

Abstract
Aims
Fluid overload (FO) puts aortic stenosis (AS) patients at risk for heart failure (HF) and death. However, conventional FO assessment, including rapid weight gain, peripheral oedema, or chest radiography, is inaccurate. Bioelectrical impedance spectroscopy (BIS) allows objective and reproducible FO quantification, particularly if clinically unapparent. It is used in dialysis patients to establish dry weight goals. BIS has not been tested for prognostication in AS. This study aimed to evaluate whether BIS adds prognostic information in stable patients undergoing transcatheter aortic valve replacement (TAVR).
Methods and results
Consecutive patients scheduled for TAVR underwent BIS in addition to echocardiographic, clinical, and laboratory assessment. On BIS, mild FO was defined as >1.0 L and severe as >3.0 L. Combined HF hospitalization and/or all‐cause death was defined as primary endpoint. Three hundred forty‐four patients (81.5 ± 7.2 years old, 47.4% female) were prospectively included. FO by BIS was associated with clinical congestion signs, higher serum markers of cardiac injury, poorer left ventricular function, higher pulmonary pressures, and more severe tricuspid regurgitation (all P < 0.05). Yet, clinical examination was unremarkable in >30% in mild FO, only detected by BIS. During 12.1 ± 5.5 months, 67 (19.5%) events were recorded (40 deaths, 15 HF hospitalizations, and 12 both). Quantitatively, every 1 L increase in FO was associated with a 24% (HR 1.24, 95% CI 1.13–1.35, P < 0.001) increase in event hazard. This association persisted after adjustment for STS/EuroSCORE‐II, NT‐proBNP, left ventricular ejection fraction, and renal function.
Conclusions
In patients undergoing TAVR, FO by BIS is strongly associated with adverse outcomes. BIS measurement conveys prognostic information not represented in any currently used AS/TAVR risk assessments.
Keywords: Volume status, Congestion, Cardiac decompensation, TAVR, Bioelectrical impedance
Introduction
Appropriate fluid management in patients with aortic stenosis (AS) is challenging. Significant fluid overload (FO) in AS indicates manifest cardiac decompensation and puts these patients at high risk for heart failure and death. However, conventional clinical FO assessment, including the tracing of rapid weight gain, peripheral oedema, or chest radiography, only allows a rough estimate of the extent of fluid retention. Overt cardiac decompensation is an accepted indication for valve replacement in patients with AS. Whether subtler fluid accumulation should also trigger prompt aortic valve intervention is unknown.
For reliable and reproducible measurements of FO, bioelectrical impedance spectroscopy (BIS) can be used. 1 BIS uses a spectrum of frequencies to determine electrical resistance and calculate the amount of extracellular water. This method is easily applicable and fast and allows objective and reproducible FO quantification, particularly if clinically unapparent. It is currently a standard tool in dialysis centres to establish dry weight goals and has been shown to improve control of hypertension, reduce intradialytic adverse events, and improve cardiac function in patients undergoing dialysis. 1 , 2 , 3 Very limited data suggest that BIS has the potential to improve prognostication in non‐dialysis cohorts, such as in heart failure patients. 4 We could also recently demonstrate that FO as measured with BIS is associated with extracellular myocardial tissue alterations on cardiac magnetic resonance imaging in patients with severe AS. 5
In the present large prospective cohort of patients scheduled for TAVR, we evaluated whether FO as determined by BIS indicates cardiac damage and worse prognosis.
Methods
Study population
Between October 2017 and May 2019, we prospectively enrolled consecutive adult patients with severe degenerative AS scheduled for TAVR at the Vienna General Hospital, a university‐affiliated tertiary centre. Eligibility and decision for TAVR were determined by a multidisciplinary Heart Team. Patients were free of clinically overt cardiac decompensation (i.e. pulmonary oedema and haemodynamic instability). All patients provided written informed consent. The study was approved by the Ethics Committee of the Medical University of Vienna (EK no. 2218/2016).
Clinical measures at baseline and follow‐up
Patients underwent clinical and laboratory assessment, electrocardiography (ECG), and transthoracic echocardiography prior to TAVR. EuroSCORE II and STS scores were calculated. On the day preceding TAVR, volume status was assessed with BIS as well as clinically (leg oedema, rales, pulmonary venous congestion/pleural effusions on chest X‐ray) in all patients. Leg oedema was considered ‘present’ if graded at least to the level of the ankles. After discharge, patients were followed at 3 months, 12 months, and every 1–2 years thereafter. Follow‐up comprised echocardiography, ECG, and clinical as well as laboratory assessment. Levels of serum creatinine were determined at baseline and daily for 7 days or until discharge after TAVR. (Peri‐)procedural complications, including acute kidney injury, were captured according to the VARC‐2 Consortium. 6 The primary endpoint was the combination of heart failure (HF) hospitalization and all‐cause death. In patients with both HF hospitalization and death, the date of the first event (=HF hospitalization) was used for outcome analysis.
Transthoracic echocardiography
Standard echocardiograms were performed by board certified cardiologists using commercially available equipment (Vivid E95, GE Healthcare, and Acuson Sequoia, Siemens). Cardiac morphology was assessed according to recent recommendations. 7 Left ventricular ejection fraction was calculated using the biplane Simpson's method. Valvular stenosis and regurgitation were quantified using an integrated approach and graded as none, mild, moderate, and severe according to the respective guidelines. 8 , 9 AS was classified as severe when transvalvular velocity exceeded 4 m/s, mean transvalvular gradient was ≥40 mmHg and aortic valve area was <1cm2. In case of low gradient AS, dobutamine stress echocardiography and/or calcium scoring by computed tomography were applied to quantify stenosis severity, according to respective recommendations. 10 Systolic pulmonary artery pressure was calculated by adding the peak tricuspid regurgitation systolic gradient to the estimated central venous pressure.
Bioelectrical impedance spectroscopy
Patients underwent standardized evaluation of their fluid status using a portable whole‐body BIS device, the Body Composition Monitor (Fresenius Medical Care, Bad Homburg, Germany). Patients were placed in supine position. Electrodes were attached to the nondominant hand and the ipsilateral foot. Measurements were conducted according to the manufacturer's manual. Because this method offers adequate reproducibility, only one measurement was performed for each study participant. 11 BIS is based on the principle that the body acts as a circuit with a given resistance (opposition of current flow through extracellular and intracellular solutions) and reactance (capacity of cells for energy storage), where the total body fluid volume is largely reflected in the resistance. 12 The device measures impedance at 50 frequencies over a range from 5 to 1000 kHz to determine the electrical resistance of total body water and extracellular water (ECW). Fluid overload (FO) assessed by BIS is expressed as an absolute value in litres or as a relative value in %, calculated as the ratio between FO and the content of ECW and multiplied by 100 (Rel. FO = FO/ECW × 100). In this study, three levels of fluid overload were defined according to pre‐specified cut‐off values: euvolaemia (<1.0 L), mild FO (1.0–3.0 L), severe FO (>3.0 L). 13
Statistical methods
Continuous data are expressed as mean ± standard deviation (SD) or as median with corresponding interquartile range (IQR), and categorical variables are presented as percentages or total numbers. Differences between groups were analysed with the Wilcoxon rank sum and Kruskal–Wallis test. χ 2 tests or Fisher exact tests were used for categorical variables as appropriate. Kaplan–Meier analysis (log‐rank test) was applied to evaluate the discriminative power of different FO levels starting with the date of BIS measurement. The impact of FO on outcomes was determined with Cox regression analyses. To account for confounding effects, we used three models that were adjusted for: Model A: STS‐Score, Model B: STS‐Score and NT‐pro‐BNP, and Model C: independent predictors of event‐free survival within domains of clinical, laboratory, and echocardiographic variables, respectively. Stepwise forward selection was used for multivariate adjustment. Furthermore, an adjusted spline model was created. Knots were placed at the 25th, 50th, and 75th percentiles. A relative risk of 1 represents the risk of patients with a fluid status of 0.0 L. A P value ≤0.05 was considered statistically significant. Statistical analyses were computed using SPSS 26 (IBM SPSS, USA) and STATA11 (StataCorp, College Station, Texas).
Results
Patient characteristics
In total, 384 TAVR patients were eligible for study participation, of whom 40 subjects had to be excluded for various reasons (Figure 1 ). The remaining 344 patients with valid BIS data were stratified according to three pre‐specified levels of FO: no FO (<1.0 L), mild FO (1.0–3.0 L), and severe FO (>3.0 L). Finally, 96.8% (n = 333) underwent TAVR, and conservative management/ongoing surveillance was pursued in 3.2% (n = 11) due to patient preference/reconsideration of the heart team decision. Detailed patient characteristics stratified according to levels of FO are displayed in Tables 1 and 2 . Stratification according to sex is displayed in Supporting Information, Table S1 . Median age was 82.2 years (IQR 77.5–86.3), 47.4% were female.
Figure 1.
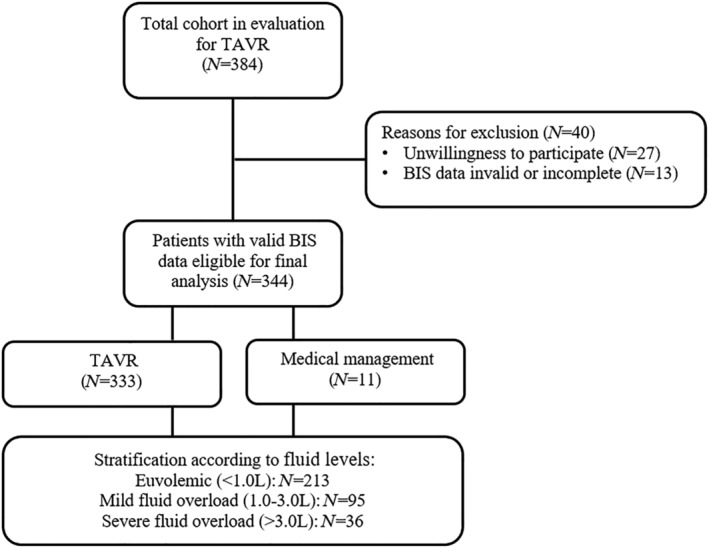
Patient population. Three hundred eighty‐four patients scheduled for TAVR were screened. Reasons for exclusion and the number of patients eligible for final analysis are displayed. BIS, bioelectrical impedance spectroscopy; TAVR, transcatheter aortic valve replacement.
Table 1.
Baseline characteristics
| All patients n = 344 | FO < +1.0 L n = 213 (61.9%) | FO + 1.0–3.0 L n = 95 (27.6%) | FO > +3.0 L N = 36 (10.5%) | P‐value | |
|---|---|---|---|---|---|
| Baseline characteristics | |||||
| Age, years | 82.2 (77.5–86.3) | 82.2 (77.5–86.1) | 82.7 (78.4–86.3) | 80.9 (75.9–88.0) | 0.638 |
| Male sex, % | 52.6 | 45.9 | 60.6 | 70.6 | 0.005 |
| BMI, kg/m2 | 26.7 (23.5–29.9) | 27.7 (24.0–31.0) | 24.2 (22.5–28.3) | 26.2 (22.5–28.1) | <0.001 |
| CAD, % | 59.0 | 54.9 | 62.8 | 73.5 | 0.085 |
| PAD, % | 12.0 | 10.2 | 12.8 | 20.6 | 0.221 |
| Previous MCI, % | 12.6 | 12.7 | 7.4 | 26.5 | 0.017 |
| Previous PCI, % | 33.2 | 30.5 | 37.2 | 38.2 | 0.422 |
| Previous CABG, % | 10.5 | 10.7 | 7.4 | 17.6 | 0.248 |
| Arterial hypertension, % | 90.1 | 89.3 | 90.4 | 94.1 | 0.675 |
| Atrial fibrillation, % | 42.6 | 40.5 | 45.7 | 47.1 | 0.597 |
| Diabetes mellitus, % | 30.6 | 29.8 | 25.5 | 50.0 | 0.027 |
| Hypercholesterinaemia, % | 69.9 | 69.1 | 73.4 | 64.7 | 0.593 |
| Pacemaker carrier, % | 12.0 | 8.8 | 13.8 | 20.6 | 0.092 |
| EuroSCORE II | 4.1 (3.8–4.6) | 4.0 (3.8–4.6) | 4.1 (3.8–4.7) | 4.5 (4.0–5.2) | 0.012 |
| STS score | 3.8 (2.6–4.9) | 3.6 (2.5–4.7) | 3.8 (2.6–4.8) | 4.5 (3.4–7.7) | 0.001 |
| Asymptomatic | 2.4 | 2.5 | 3.2 | 0.0 | 0.582 |
| NYHA class | 0.202 | ||||
| I | 8.0 | 7.5 | 11.8 | 0.0 | |
| II | 27.5 | 26.0 | 32.3 | 23.5 | |
| III | 57.8 | 61.0 | 46.3 | 70.6 | |
| IV | 6.7 | 5.5 | 9.7 | 5.9 | |
| CCS ≥ II | 25.4 | 28.1 | 23.7 | 14.7 | 0.228 |
| Syncope | 17.1 | 17.6 | 14.9 | 20.6 | 0.724 |
| Diuretic treatment, % | 70.0 | 67.3 | 68.1 | 91.2 | 0.017 |
| Loop diuretic, % | 48.3 | 42.0 | 50.0 | 82.4 | <0.001 |
| MRA, % | 33.6 | 33.2 | 31.9 | 41.2 | 0.603 |
| Xipamid, % | 3.3 | 2.0 | 2.1 | 14.7 | <0.001 |
| Any clinical sign of congestion | 44.1 | 24.4 | 68.1 | 91.7 | <0.001 |
| Chest X‐ray a | 33.6 | 15.5 | 52.1 | 86.1 | <0.001 |
| Leg oedema | 34.3 | 21.9 | 46.4 | 80.0 | <0.001 |
| Rales | 9.6 | 2.7 | 13.4 | 40.0 | <0.001 |
| FO by BIS, L | 0.7 (−0.5; 1.6) | −0.1 (−1.1; 0.5) | 1.7 (1.3;2.1) | 4.3 (3.4; 4.5) | <0.001 |
| FO by BIS, % | 3.7 (−2.9; 9.3) | −0.8 (−6.9; 3.1) | 9.4 (7.8; 11.9) | 20.7 (16.3; 25.3) | <0.001 |
| Baseline blood laboratory parameters | |||||
| Sodium, mmol/L | 139 (137–141) | 139 (137–141) | 139 (138–141) | 137 (135–141) | 0.597 |
| Potassium, mmol/L | 4.2 (3.9–4.5) | 4.1 (3.9–4.5) | 4.2 (4.0–4.5) | 4.3 (3.9–4.6) | 0.208 |
| Creatinine, mg/dL | 1.1 (0.9–1.5) | 1.1 (0.9–1.3) | 1.1 (0.9–1.6) | 1.5 (1.0–1.9) | 0.002 |
| GFR, mL/min/1.73 m2 | 56.4 (42.8–72.6) | 58.3 (46.8–72.2) | 59.7 (39.1–74.4) | 42.7 (34.1–64.7) | 0.017 |
| Haemoglobin, g/dL | 11.9 (10.7–13.2) | 12.2 (11.1–13.4) | 11.5 (10.6–12.8) | 10.6 (9.4–12.9) | <0.001 |
| Haematocrit, % | 35.6 (31.9–39.1) | 36.4 (33.4–39.8) | 34.6 (31.7–38.2) | 32.1 (27.7–37.5) | 0.001 |
| Albumin, g/L | 40.3 (36.9–42.8) | 40.9 (37.8–43.1) | 39.3 (36.3–42.1) | 37.7 (35.6–40.7) | 0.003 |
| C‐reactive protein, mg/dL | 0.4 (0.2–1.0) | 0.3 (0.1–0.8) | 0.3 (0.1–1.0) | 0.9 (0.4–1.8) | 0.001 |
| hs‐TnT, ng/L | 28 (18–47) | 25 (16–39) | 32 (20–50) | 43 (33–60) | 0.002 |
| NT‐pro BNP, ng/dL | 1812 (733–5122) | 1461 (664–3473) | 2258 (926–8715) | 6282 (1934–10 592) | <0.001 |
| Baseline electrocardiographic parameters | |||||
| LBBB, % | 7.2 | 8.6 | 6.0 | 7.1 | 0.740 |
| RBBB, % | 10.1 | 8.1 | 14.3 | 14.3 | 0.241 |
| LAFB, % | 17.3 | 14.6 | 23.8 | 21.4 | 0.164 |
| LPFB | 0.0 | 0.0 | 0.0 | 0.0 | N/A |
| Heart rate, b.p.m. | 71 (63–80) | 72 (63–81) | 69 (61–79) | 70 (63–78) | 0.611 |
| QRS duration, ms | 98 (86–114) | 96 (84–112) | 98 (86–118) | 107 (94–138) | 0.021 |
| Baseline echocardiographic parameters | |||||
| LV diameter, mm | 45.0 (40.0–49.0) | 44.0 (39.0–49.0) | 45.0 (41.0–49.0) | 49.0 (43.0–54.0) | 0.007 |
| RV diameter, mm | 33.0 (29.0–37.0) | 32.0 (28.0–35.0) | 33.0 (28.0–37.0) | 41.0 (36.0–44.0) | <0.001 |
| LA diameter, mm | 59.0 (54.0–65.0) | 59.0 (53.0–65.0) | 59.0 (54.0–64.0) | 64.0 (54.0–69.0) | 0.239 |
| RA diameter, mm | 55.0 (51.0–62.0) | 54.0 (50.0–60.0) | 57.0 (52.0–62.0) | 63.0 (58.0–69.0) | <0.001 |
| IVS, mm | 15.0 (13.0–17.0) | 15.0 (13.0–17.0) | 15.0 (14.0–17.0) | 14.0 (13.0–16.0) | 0.610 |
| LVEF, % | 60.0 (49.0–68.0) | 62.0 (52.0–69.0) | 60.0 (48.0–65.0) | 49.0 (34.0–59.0) | <0.001 |
| AV PPG, mmHg | 73.0 (64.0–88.0) | 73.0 (64.0–88.0) | 76.0 (64.0–88.0) | 69.0 (48.0–81.0) | 0.093 |
| AV MPG, mmHg | 45.0 (38.0–55.0) | 47.0 (40.0–55.0) | 45.0 (38.0–56.0) | 40.0 (27.0–49.0) | 0.009 |
| AV Vmax, m/s | 4.3 (4.0–4.7) | 4.3 (4.0–4.7) | 4.4 (4.0–4.7) | 4.2 (3.4–4.5) | 0.063 |
| MR II+, % | 26.8 | 23.9 | 26.2 | 46.7 | 0.033 |
| TR II+, % | 25.0 | 21.5 | 23.8 | 48.4 | 0.006 |
| sPAP stage | 0.095 | ||||
| <31 mmHg | 36.9 | 40.6 | 32.6 | 25.0 | |
| 31–55 mmHg | 40.9 | 41.2 | 41.9 | 35.7 | |
| >55 mmHg | 22.3 | 18.2 | 25.6 | 39.3 | 0.030 |
Bold values indicate statistical significance. ACE, angiotensin converting enzyme; AV, aortic valve; BFB, bifascicular block; BMI, body mass index; CABG, coronary artery bypass graft; CAD, coronary artery disease; CCS, Canadian Cardiac Score; EF, ejection fraction; EuroSCORE, European System for Cardiac Operative Risk Evaluation STS, Society of Thoracic Surgeons; FO, fluid overload; GFR, glomerular filtration rate; hs‐TnT, high‐sensitive Troponin T; IVS, interventricular septum; LA, left atrial; LAFB, left anterior fascicular block; LBBB, left bundle branch block; LPFB, left posterior fascicular block; LV, left ventricular; MCI, myocardial infarction; MPG, mean pressure gradient; MR, mitral regurgitation; MRA, mineral corticoid receptor antagonist; NT‐proBNP, N‐terminal prohormone of brain natriuretic peptide; NYHA, New York Heart Association functional class; PAD, peripheral artery disease; PCI, percutaneous coronary intervention; PPG, peak pressure gradient; RA, right atrial; RBBB, right bundle branch block; RV, right ventricular; sPAP, systolic pulmonary artery pressure; TR, tricuspid regurgitation; Vmax, maximum velocity.
Numbers indicate % or median and corresponding interquartile range.
Includes pleural effusions and/or pulmonary venous congestion.
Table 2.
(Peri‐)procedural characteristics
| All patients n = 344 | FO < +1.0 L n = 213 (61.9%) | FO + 1.0–3.0 L n = 95 (27.6%) | FO > +3.0 L N = 36 (10.5%) | P‐value | |
|---|---|---|---|---|---|
| (Peri)‐procedural characteristics | |||||
| Ballonexpandable, % | 39.2 | 35.8 | 42.6 | 50.0 | 0.212 |
| Transfemoral access, % | 94.8 | 95.0 | 94.6 | 94.1 | 0.969 |
| Major vascular complication, % | 3.0 | 3.4 | 3.3 | 2.9 | 0.988 |
| Major stroke, % | 0.9 | 1.0 | 1.1 | 0.0 | 0.835 |
| RBC transfusion, % | 10.5 | 7.3 | 11.7 | 26.5 | 0.003 |
| PPI, % | 11.4 | 8.6 | 21.0 | 18.5 | 0.013 |
| AKI, % | 12.9 | 12.7 | 12.8 | 14.7 | 0.947 |
| Paravalvular AR ≥ II, % | 4.3 | 3.3 | 6.0 | 6.3 | 0.522 |
| AV PPG, mmHg | 19.0 (12.0–25.0) | 19.0 (12.0–25.0) | 18.0 (11.0–25.0) | 14.0 (10.0–26.0) | 0.276 |
| AV MPG, mmHg | 10.0 (7.0–14.0) | 10.0 (7.0–14.0) | 9.0 (6.0–14.0) | 8.0 (6.0–12.0) | 0.180 |
Numbers indicate % or median and corresponding interquartile range. Bold values indicate statistical significance.
AKI, acute kidney injury; AR, aortic regurgitation; AV, aortic valve; FO, fluid overload; MPG, mean pressure gradient; PPG, peak pressure gradient; PPI, permanent pacemaker implantation; RBC, red blood cell.
Baseline characteristics
Patients with FO were more often male (no FO: 45.9% vs. mild FO: 60.6% vs. severe FO: 70.6%, P = 0.005), received diuretic treatment at a higher frequency (67.3% vs. 68.1 vs. 91.2, P = 0.017), and presented with higher surgical risk scores [EuroSCORE II: 4.0 (3.8–4.6) vs. 4.1 (3.8–4.7) vs. 4.5 (4.0–5.2), P = 0.012; STS Score: 3.6 (2.5–4.7) vs. 3.8 (2.6–4.8) vs. 4.5 (3.4–7.7), P = 0.001]. BIS results correlated well with clinical signs of congestion, with increasing prevalence of rales (2.7% vs. 13.4% vs. 40.0%), leg oedema (21.9% vs. 46.4% vs. 80.0%), and pulmonary venous congestion/pleural effusions on chest X‐ray (15.5% vs. 52.1% vs. 86.1%) for no vs. mild vs. severe FO (P for all<0.001). FO patients were furthermore characterized by a distinct laboratory risk profile with poorer kidney function and lower serum levels of haemoglobin, haematocrit, and albumin, and elevation of C‐reactive protein (P for trend<0.05). Moreover, traditional cardiac biomarkers showed a stepwise increase with ascending body fluid levels: N‐terminal prohormone of brain natriuretic peptide (NT‐proBNP) 1461 ng/dL (664–3473) vs. 2258 (926–8715) vs. 6282 (1934–10 592), P < 0.001; high‐sensitive Troponin‐T 25 ng/L (16–39) vs. 32 (20–50) vs. 43 (33–60), P = 0.002.
Pre‐TAVR ECGs of patients without pacemaker revealed QRS prolongation with increasing FO [96 ms (84–112) vs. 98 (86–118) vs. 107 (94–138), P = 0.021]. On echocardiography, increasing levels of FO were associated with incremental cardiac damage, as indicated by larger left and right heart dimensions [left ventricle: 44 mm (39–49) vs. 45 (41–49) vs. 49 (43–54), P = 0.007; right ventricle: 32 mm (28–35) vs. 33 (28–37) vs. 41 (36–44), P < 0.001; right atrium: 54 mm (50–60) vs. 57 (52–62) vs. 63 (58–69), P < 0.001] poorer left ventricular ejection fraction [62% (52–69) vs. 60 (48–65) vs. 49 (34–59), P < 0.001], and a higher prevalence of moderate or severe mitral (23.9% vs. 26.2 vs. 46.7, P = 0.033) and tricuspid regurgitation (21.5% vs. 23.8 vs. 48.4, P = 0.006) and significant pulmonary hypertension [systolic pulmonary artery pressure (sPAP) ≥ 55 mmHg: 18.2% vs. 25.6 vs. 39.3, P = 0.030].
Procedural and periprocedural characteristics
Capturing all major events via VARC‐2, procedure associated complications occurred at the same rate except for the need of permanent pacemakers after TAVR, which was significantly more frequent in cases with FO (8.6% vs. 21.0 vs. 18.5, P = 0.013). Moreover, red blood cell transfusion post‐TAVR was required significantly more often in patients with FO (7.3% vs. 11.7 vs. 26.5, P = 0.003).
Outcomes
After a mean follow‐up of 12.3 ± 5.7 months, 19.5% (n = 67/344) of patients had experienced an event (40 deaths, 15 hospitalizations due to heart failure, and 12 both). One year mortality rates according to fluid status were 8.9% for euvolaemia, 15.8% for mild FO and 30.6% for severe FO (P < 0.001, Figure 2 ). By Kaplan–Meier estimates, increasing levels of FO were associated with the primary endpoint (log‐rank<0.001, Figure 2 ). We observed a significant impact of FO on outcomes with a crude hazard ratio of 1.24 (95% CI 1.13–1.35 P < 0.001). After multivariate adjustment for STS score in the first model and STS score and NT‐proBNP levels in the second model, every 1.0 L increase in FO increased the event hazard by ~20% (Model 1: HR 1.20, 95% CI 1.09–1.32, P < 0.001; Model 2: HR 1.19, 95% CI 1.06–1.34, P = 0.002, Table 3 ). Also, in the third multivariate model including independent predictors of outcomes among domains of clinical, laboratory, and echocardiographic parameters (Supporting Information, Table S2 ), FO by BIS remained significantly associated with outcomes (HR 1.13, 95% CI 1.03–1.25, P = 0.013, Table 4 ). Finally, continuous increase of event hazard with ascending fluid levels is depicted by adjusted cubic spline analysis (Figure 3 ).
Figure 2.
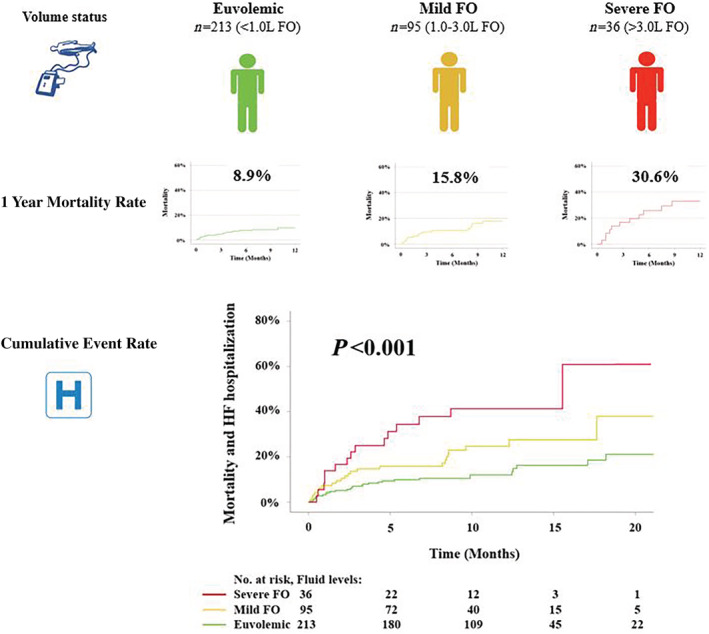
Clinical outcomes according to fluid status. Patients were classified into three groups according to fluid overload (FO): euvolemic (<1.0 L), mild FO (1.0–3.0 L), severe FO (>3.0 L). Ascending levels of FO were associated with higher mortality and cumulative event rates.
Table 3.
Univariate and multivariate Cox regression analysis assessing the association of fluid overload with mortality/heart failure hospitalization
| Univariable model | Clinical confounder model 1 a | Clinical confounder model 2 b | ||||
|---|---|---|---|---|---|---|
| HR (95% CI) | P‐value | HR (95% CI) | P‐value | HR (95% CI) | P‐value | |
| Fluid overload by BIS | 1.235 (1.129–1.349) | <0.001 | 1.202 (1.093–1.321) | <0.001 | 1.192 (1.064–1.335) | 0.002 |
Bold values indicate statistical significance. CI, confidence interval; HR, hazard ratio.
Adjusted for STS score.
Adjusted for STS score and log‐transformed NT‐proBNP serum levels.
Table 4.
Univariate and multivariate Cox regression analyses assessing the association of parameters with mortality/heart failure hospitalization (Clinical Confounder Model 3)
| Univariate | Multivariate | |||
|---|---|---|---|---|
| Parameter | Hazard ratio (95% CI) | P‐value | Hazard ratio (95% CI) | P‐value |
| Albumin | 0.901 (0.865–0.940) | <0.001 | 0.886 (0.839–0.936) | <0.001 |
| Fluid overload by BIS | 1.235 (1.129–1.349) | <0.001 | 1.134 (1.027–1.254) | 0.013 |
| MR ≥ II | 2.410 (1.460–3.979) | 0.001 | 1.978 (1.151–3.398) | 0.013 |
| AV Vmax | 0.551 (0.384–0.791) | 0.001 | 0.620 (0.422–0.911) | 0.015 |
| EuroSCORE II | 1.093 (1.032–1.157) | 0.002 | ||
| STS Score | 1.070 (1.035–1.106) | <0.001 | ||
| Clinical signs of congestion | 3.010 (1.788–5.067) | <0.001 | ||
Bold values indicate statistical significance. For abbreviations, please see Table 1 .
Figure 3.
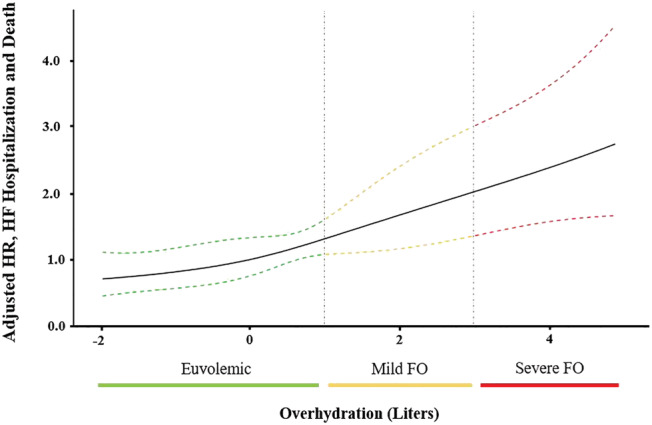
Adjusted spline models depicting the effect of fluid overload (FO) on outcomes. Dashed lines depict 95% confidence intervals. Adjusted for STS score and quartiles of NT‐proBNP serum levels. HF, heart failure; HR, hazard ratio.
Discussion
The present study is the first to systemically evaluate the prognostic impact of overhydration in patients undergoing TAVR. Our data show that even mild overhydration as measured with BIS, that can easily be missed on routine clinical assessment, is associated with cardiac damage and worse clinical outcomes.
Although the assessment of fluid status is a cornerstone in every physical exam, it lacks standardization. Signs such as peripheral oedema, pulmonary congestion, or distension of jugular veins are semiquantitative measures and lack sensitivity and specificity. 14 , 15 , 16 Fluid management is a major challenge in cardiology—and also in patients undergoing chronic (haemo‐)dialysis. BIS has specifically been developed to quantify FO and guide fluid removal during dialysis. 17 The method uses multiple frequencies from 5 to 1000 kHz to determine the amount of extracellular water based on electrical resistances. 18 BIS allows better control of hypertension, less intradialytic adverse events, and improved cardiac function in patients undergoing dialysis. 2 , 3 Also, BIS has been studied in a limited number of non‐dialysis cohorts, such as to monitor intraoperative fluid management in patients undergoing general anaesthesia. 19 However, the utility and prognostic impact of BIS in patients with AS so far is unknown.
Association of fluid overload with cardiac damage
In clinical practice, overt FO indicates an advanced disease state and high risk for adverse outcomes. However, only few studies systematically addressed FO in patients with AS. The sequelae of chronic FO in severe AS, such as RV enlargement and significant tricuspid regurgitation has been linked to excess mortality, 20 even when patients reported no valve‐related symptoms. 21 Our study is the first to use standardized FO quantification in patients undergoing TAVR. FO was strongly associated with serum levels of troponin and NT‐proBNP, left and right heart dimensions, left ventricular ejection function, severity of mitral and tricuspid regurgitation, and pulmonary pressures. These findings augment our understanding that even mild FO, not assessable on physical examination or radiographic findings, indicates an advanced disease state.
Association of fluid overload with outcomes
Several studies have evaluated predictors of survival in TAVR beyond surgical risk scores but have so far not explored the impact of fluid status. 22 , 23 While overt cardiac decompensation in AS is alarming and warrants urgent treatment, subclinical fluid overload has not previously been addressed as a marker of risk. In the present study, every 1 L increase in FO of clinically stable patients scheduled for TAVR was associated with a ~20% increase in event hazard. Mortality rates were doubled in patients with mild FO in comparison to no FO and quadrupled in severe FO. Our findings were consistent when adjusting for established risk factors, including NT‐proBNP and renal function. Even though clinical signs of congestion showed good agreement with FO by BIS, >30% of patients with mild FO had unremarkable clinical findings and still suffered adverse outcomes. We could recently demonstrate that FO as measured with BIS is associated with alterations of extracellular myocardial tissue in severe AS—a mechanisms that likely contributes to poor prognosis of affected patients. 5 Results from this study expand the potential clinical use of BIS, which is further backed by our previous observation of the association of FO in heart failure with preserved ejection fraction (HFpEF) patients with heart failure hospitalizations and cardiovascular death. 4
Whether volume status may have the potential to guide treatment decisions in AS patients with difficult symptom assessment (e.g. co‐morbidities and low physical exercise level) remains unknown. Valve‐related symptoms have repeatedly been proven to lack sensitivity for the identification of cardiac damage, 21 , 24 , 25 indicating that we should rely on more objective measures to guide management strategies. In the search of such parameters, two multicentre trials are currently investigating early TAVR versus conservative management in asymptomatic severe AS and assess cardiac magnetic resonance imaging variables (NCT03094143) as well as blood biomarkers (NCT03042104). In this respect, FO on BIS, a non‐invasive, highly reproducible, and inexpensive tool, may indicate the need for an intervention in AS patients, irrespective of symptoms.
Finally, decongestive treatment in overhydrated severe AS patients might further improve outcomes on top of valvular replacement. Based on data from the present study, this hypothesis is currently being tested in a randomized controlled trial (NCT04556123).
Limitations
The current study has several limitations that merit comment. While a selection bias must be taken into account due to the single centre character, we followed an identical protocol for TAVR as well as BIS settings throughout the entire study. Given the purely observational character of this study, we cannot provide evidence that integration of BIS into treatment algorithms is associated with improved outcomes. Also, we were not able to assess ethnicity specific differences due to the predominantly Caucasian patient population. Furthermore, although validated in various clinical scenarios, BIS is relying on several mathematical assumptions, potentially introducing errors as previously summarized. 18 In particular, BIS analysis may be challenging in (i) very obese patients, as impedance is difficult to measure, and (ii) elderly patients, as changes in impedance may represent a redistribution of body fat. 26 However, given a mean BMI of 27.0 ± 5.1 kg/m2 in the present cohort and good agreement of BIS results with clinical signs of congestion, we assume that BIS data are robust and adequately reflect fluid overload.
Conclusions
In patients scheduled for TAVR, FO is strongly associated with advanced stages of disease and adverse clinical outcomes. BIS provides an easy, non‐invasive, and reliable tool to quantify even small amounts of FO, that may be missed clinically. Additional prognostic information obtained from fluid status is independent from cardiac and renal function as well as surgical risk scores.
Conflict of interest
All authors report no relationships with industry.
Supporting information
Table S1. Baseline characteristics stratified according to sex.
Table S2. Uni‐ and multivariate Cox regression analyses assessing the association of parameters with mortality/heart failure hospitalization among domains of clinical, laboratory, and echocardiographic parameters.
Nitsche, C. , Kammerlander, A. A. , Koschutnik, M. , Sinnhuber, L. , Forutan, N. , Eidenberger, A. , Donà, C. , Schartmueller, F. , Dannenberg, V. , Winter, M.‐P. , Siller‐Matula, J. , Anvari‐Pirsch, A. , Goliasch, G. , Hengstenberg, C. , and Mascherbauer, J. (2021) Fluid overload in patients undergoing TAVR: what we can learn from the nephrologists. ESC Heart Failure, 8: 1408–1416. 10.1002/ehf2.13226.
References
- 1. Hong YA, Yoon HE, Choi BS, Shin SJ, Kim YS, Lee SY, Lee SH, Kim SH, Lee EY, Shin SK, Kwon YJ, Kim JH, Chang YK, Kim SY, Kim JE, Ahn SY, Ko GJ. The effect of strict volume control assessed by repeated bioimpedance spectroscopy on cardiac function in peritoneal dialysis patients. Sci Rep 2019; 9: 17679. [DOI] [PMC free article] [PubMed] [Google Scholar]
- 2. Machek P, Jirka T, Moissl U, Chamney P, Wabel P. Guided optimization of fluid status in haemodialysis patients. Nephrol Dial Transplant 2010; 25: 538–544. [DOI] [PMC free article] [PubMed] [Google Scholar]
- 3. Hur E, Usta M, Toz H, Asci G, Wabel P, Kahvecioglu S, Kayikcioglu M, Demirci MS, Ozkahya M, Duman S, Ok E. Effect of fluid management guided by bioimpedance spectroscopy on cardiovascular parameters in hemodialysis patients: a randomized controlled trial. Am J Kidney Dis 2013; 61: 957–965. [DOI] [PubMed] [Google Scholar]
- 4. Koell B, Zotter‐Tufaro C, Duca F, Kammerlander AA, Aschauer S, Dalos D, Antlanger M, Hecking M, Saemann M, Mascherbauer J, Bonderman D. Fluid status and outcome in patients with heart failure and preserved ejection fraction. Int J Cardiol 2017; 230: 476–481. [DOI] [PMC free article] [PubMed] [Google Scholar]
- 5. Nitsche C, Kammerlander AA, Koschutnik M, Donà C, Aschauer S, Sinnhuber L, Eidenberger A, Forutan N, Schartmueller F, Andreas M, Beitzke D, Bergler‐Klein J, Bartko PE, Siller‐Matula J, Winter M‐P, Anvari‐Pirsch A, Goliasch G, Hengstenberg C, Mascherbauer J. Volume status impacts CMR–extracellular volume measurements and outcome in AS undergoing TAVR. Cardiovascular Imaging: JACC; 2020. PMID: 33011120. [DOI] [PubMed] [Google Scholar]
- 6. Kappetein AP, Head SJ, Genereux P, Piazza N, van Mieghem NM, Blackstone EH, Brott TG, Cohen DJ, Cutlip DE, van Es GA, Hahn RT, Kirtane AJ, Krucoff MW, Kodali S, Mack MJ, Mehran R, Rodes‐Cabau J, Vranckx P, Webb JG, Windecker S, Serruys PW, Leon MB. Updated standardized endpoint definitions for transcatheter aortic valve implantation: the Valve Academic Research Consortium‐2 consensus document. J Thorac Cardiovasc Surg 2013; 145: 6–23. [DOI] [PubMed] [Google Scholar]
- 7. Lang RM, Badano LP, Mor‐Avi V, Afilalo J, Armstrong A, Ernande L, Flachskampf FA, Foster E, Goldstein SA, Kuznetsova T, Lancellotti P, Muraru D, Picard MH, Rietzschel ER, Rudski L, Spencer KT, Tsang W, Voigt JU. Recommendations for cardiac chamber quantification by echocardiography in adults: an update from the American Society of Echocardiography and the European Association of Cardiovascular Imaging. Eur Heart J Cardiovasc Imaging 2015; 16: 233–270. [DOI] [PubMed] [Google Scholar]
- 8. Lancellotti P, Tribouilloy C, Hagendorff A, Popescu BA, Edvardsen T, Pierard LA, Badano L, Zamorano JL. Recommendations for the echocardiographic assessment of native valvular regurgitation: an executive summary from the European Association of Cardiovascular Imaging. Eur Heart J Cardiovasc Imaging 2013; 14: 611–644. [DOI] [PubMed] [Google Scholar]
- 9. Baumgartner HC, Hung JC‐C, Bermejo J, Chambers JB, Edvardsen T, Goldstein S, Lancellotti P, LeFevre M, Miller F Jr, Otto CM. Recommendations on the echocardiographic assessment of aortic valve stenosis: a focused update from the European Association of Cardiovascular Imaging and the American Society of Echocardiography. Eur Heart J Cardiovasc Imaging 2017; 18: 254–275. [DOI] [PubMed] [Google Scholar]
- 10. Baumgartner H, Falk V, Bax JJ, de Bonis M, Hamm C, Holm PJ, Iung B, Lancellotti P, Lansac E, Rodriguez Munoz D, Rosenhek R, Sjogren J, Tornos Mas P, Vahanian A, Walther T, Wendler O, Windecker S, Zamorano JL. 2017 ESC/EACTS Guidelines for the management of valvular heart disease. Eur Heart J 2017; 38: 2739–2791. [DOI] [PubMed] [Google Scholar]
- 11. Moissl UM, Wabel P, Chamney PW, Bosaeus I, Levin NW, Bosy‐Westphal A, Korth O, Müller MJ, Ellegård L, Malmros V, Kaitwatcharachai C, Kuhlmann MK, Zhu F, Fuller NJ. Body fluid volume determination via body composition spectroscopy in health and disease. Physiol Meas 2006; 27: 921–933. [DOI] [PubMed] [Google Scholar]
- 12. Kushner RF. Bioelectrical impedance analysis: a review of principles and applications. J Am Coll Nutr 1992; 11: 199–209. [PubMed] [Google Scholar]
- 13. Wabel P, Chamney P, Moissl U, Jirka T. Importance of whole‐body bioimpedance spectroscopy for the management of fluid balance. Blood Purif 2009; 27: 75–80. [DOI] [PMC free article] [PubMed] [Google Scholar]
- 14. Stevenson LW, Perloff JK. The limited reliability of physical signs for estimating hemodynamics in chronic heart failure. JAMA 1989; 261: 884–888. [PubMed] [Google Scholar]
- 15. Chakko S, Woska D, Martinez H, de Marchena E, Futterman L, Kessler KM, Myerberg RJ. Clinical, radiographic, and hemodynamic correlations in chronic congestive heart failure: conflicting results may lead to inappropriate care. Am J Med 1991; 90: 353–359. [DOI] [PubMed] [Google Scholar]
- 16. Stein JH, Neumann A, Marcus RH. Comparison of estimates of right atrial pressure by physical examination and echocardiography in patients with congestive heart failure and reasons for discrepancies. Am J Cardiol 1997; 80: 1615–1618. [DOI] [PubMed] [Google Scholar]
- 17. Luo YJ, Lu XH, Woods F, Wang T. Volume control in peritoneal dialysis patients guided by bioimpedance spectroscopy assessment. Blood Purif 2011; 31: 296–302. [DOI] [PubMed] [Google Scholar]
- 18. Mulasi U, Kuchnia AJ, Cole AJ, Earthman CP. Bioimpedance at the bedside: current applications, limitations, and opportunities. Nutr Clin Pract 2015; 30: 180–193. [DOI] [PubMed] [Google Scholar]
- 19. Ernstbrunner M, Kostner L, Kimberger O, Wabel P, Saemann M, Markstaller K, Fleischmann E, Kabon B, Hecking M. Bioimpedance spectroscopy for assessment of volume status in patients before and after general anaesthesia. PLoS ONE 2014; 9: e111139. [DOI] [PMC free article] [PubMed] [Google Scholar]
- 20. Genereux P, Pibarot P, Redfors B, Mack MJ, Makkar RR, Jaber WA, Svensson LG, Kapadia S, Tuzcu EM, Thourani VH, Babaliaros V, Herrmann HC, Szeto WY, Cohen DJ, Lindman BR, McAndrew T, Alu MC, Douglas PS, Hahn RT, Kodali SK, Smith CR, Miller DC, Webb JG, Leon MB. Staging classification of aortic stenosis based on the extent of cardiac damage. Eur Heart J 2017; 38: 3351–3358. [DOI] [PMC free article] [PubMed] [Google Scholar]
- 21. Tastet L, Tribouilloy C, Marechaux S, Vollema EM, Delgado V, Salaun E, Shen M, Capoulade R, Clavel MA, Arsenault M, Bedard E, Bernier M, Beaudoin J, Narula J, Lancellotti P, Bax JJ, Genereux P, Pibarot P. Staging cardiac damage in patients with asymptomatic aortic valve stenosis. J Am Coll Cardiol 2019; 74: 550–563. [DOI] [PubMed] [Google Scholar]
- 22. Hermiller JB Jr, Yakubov SJ, Reardon MJ, Deeb GM, Adams DH, Afilalo J, Huang J, Popma JJ. Predicting early and late mortality after transcatheter aortic valve replacement. J Am Coll Cardiol 2016; 68: 343–352. [DOI] [PubMed] [Google Scholar]
- 23. Nazif TM, Chen S, George I, Dizon JM, Hahn RT, Crowley A, Alu MC, Babaliaros V, Thourani VH, Herrmann HC, Smalling RW, Brown DL, Mack MJ, Kapadia S, Makkar R, Webb JG, Leon MB, Kodali SK. New‐onset left bundle branch block after transcatheter aortic valve replacement is associated with adverse long‐term clinical outcomes in intermediate‐risk patients: an analysis from the PARTNER II trial. Eur Heart J 2019; 40: 2218–2227. [DOI] [PubMed] [Google Scholar]
- 24. Lancellotti P, Donal E, Magne J, Moonen M, Connor K, Daubert J‐C, Pierard LA. Risk stratification in asymptomatic moderate to severe aortic stenosis: the importance of the valvular, arterial and ventricular interplay. Heart 2010; 96: 1364–1371. [DOI] [PubMed] [Google Scholar]
- 25. Rosenhek R, Klaar U, Schemper M, Scholten C, Heger M, Gabriel H, Binder T, Maurer G, Baumgartner H. Mild and moderate aortic stenosis. Natural history and risk stratification by echocardiography. Eur Heart J 2004; 25: 199–205. [DOI] [PubMed] [Google Scholar]
- 26. Weyer S, Zink MD, Wartzek T, Leicht L, Mischke K, Vollmer T, Leonhardt S. Bioelectrical impedance spectroscopy as a fluid management system in heart failure. Physiol Meas 2014; 35: 917–930. [DOI] [PubMed] [Google Scholar]
Associated Data
This section collects any data citations, data availability statements, or supplementary materials included in this article.
Supplementary Materials
Table S1. Baseline characteristics stratified according to sex.
Table S2. Uni‐ and multivariate Cox regression analyses assessing the association of parameters with mortality/heart failure hospitalization among domains of clinical, laboratory, and echocardiographic parameters.