INTRODUCTION
In the USA, misinformation and inconsistent messaging surrounding coronavirus 2019 (COVID-19) may lead individuals to incorrectly assess transmission risk and undermine precautionary behaviors necessary to control the pandemic.1 A key question is to what extent the new US presidential administration can change public behaviors by adopting consistent, science-based risk messaging or whether behavior change is unlikely. We help answer this question by characterizing how Americans have responded to changes in local COVID-19 risk throughout the pandemic. Specifically, we assessed state-level patterns and trends in risk perceptions and risk-mitigating behaviors in relation to reported COVID-19 case rates.
METHODS
We used data from a large, ongoing survey of Facebook users.2 Since April 6, 2020, a geographically stratified random sample was invited daily to complete an externally hosted 5-min survey, covering COVID-19 symptoms, behaviors, and beliefs. Facebook had no access to individual survey responses. We analyzed risk perceptions, the percentage reporting being very worried that they or a relative would become seriously ill from COVID-19, and risk behaviors: the average number of contacts outside of household in the past 24 h; percentage avoiding others all/most of the time (collected prior to September 9); and percentage engaging in unmasked public activity in the past 24 h (collected after September 9). Results were weighted for non-response and to be representative of the US adult population. We obtained data on COVID-19 cases from the COVID Tracking Project.3 We created time series plots of average weekly risk perceptions, behaviors, and cases per 100,000 for each state, grouped by Census regions, over the study period May 15 through November 22, 2020 (separating before September 7 and after September 13 to accommodate changes in the survey questionnaire). We examined peaks and troughs in our outcomes relative to those for case rates. We compared changes in outcomes across states with the 10 largest per capita spring, summer, and fall COVID-19 outbreaks using weighted linear regressions. Analyses were conducted using R 4.0.2. The research was deemed IRB exempt by the Harvard TH Chan School of Public Health (IRB20-0592).
RESULTS
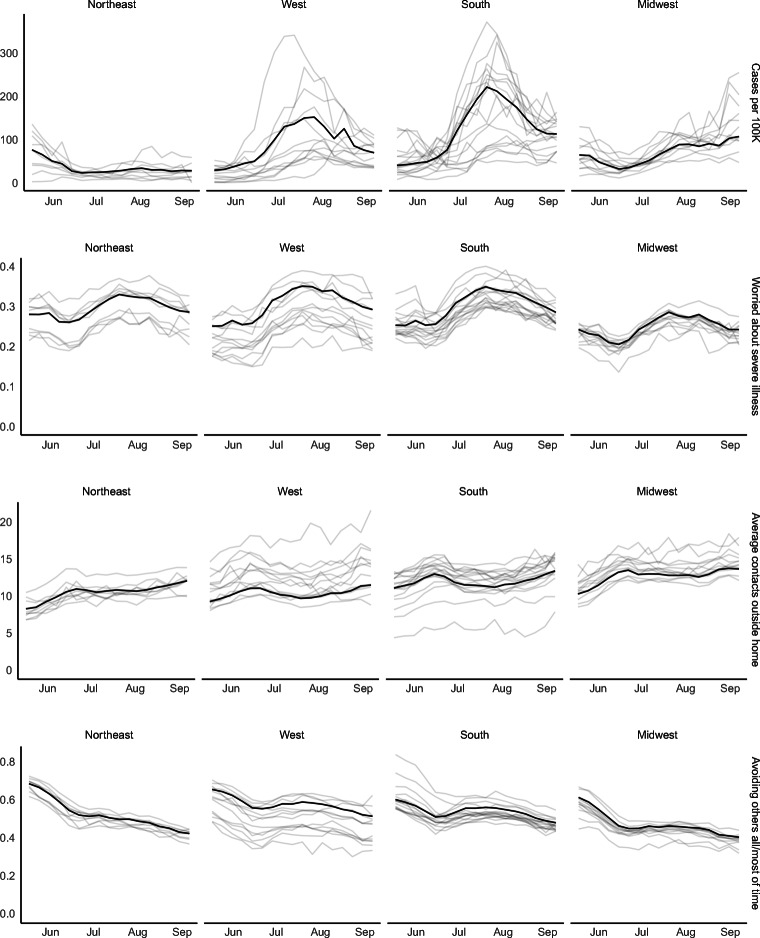
Our sample included 9,667,400 respondents, of whom 53% were female and 21% over age 65 (weighted). During the summer surge, peak worry about COVID-19 illness coincided with the peak of detected cases per capita, and mitigating risk behaviors similarly rose and fell with case rates (Fig. 1). While worry increased nationally by 9 percentage points, behavior changes were most pronounced in states with largest summer per capita case rates. These included a decrease in average contacts of 2.3 (versus an increase of 0.3 spring peak states) and increase in avoiding others all or most of the time by 8 pp (versus a decrease of 5 pp) (p < 0.001 for comparisons).
Fig. 1.
Trends by region and state, May 15, 2020, to September 6, 2020. The black line reflects the region, while the gray lines are individual states. Note that y-axes differ across variables. Due to survey reordering and minor wording changes, survey result levels are not directly comparable between Figures 1 and 2.
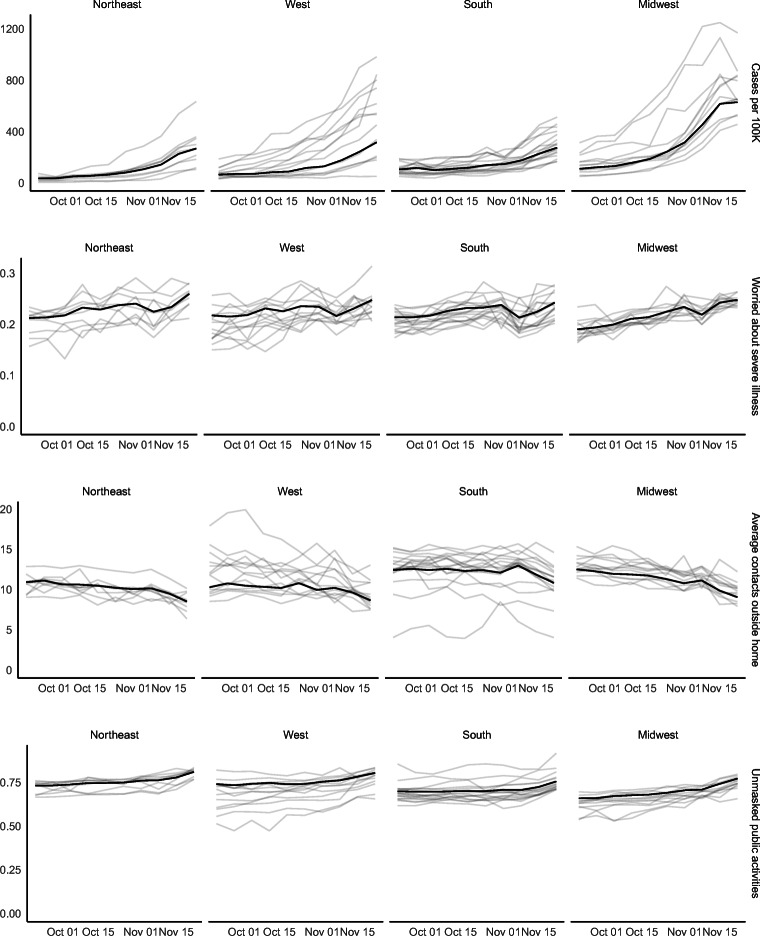
Between September 14 and November 22, 2020, both case rates and risk-mitigating behaviors increased in every region (Fig. 2). The largest declines in unmasked public activity were in the Midwest (11 pp, to 23%), followed by the Northeast (8 pp, to 19%), and the West and South (6 pp, to 20%/25%). In the 10 highest fall incidence states, average contacts outside the home decreased by 3.3 (versus 2.0 in other states), and unmasked public activities by 12 pp (versus 7 pp) (p < 0.001 for comparisons). Improvements in risk-mitigating behaviors varied across states, with largest changes in states with high initial levels of risky behavior. For instance, unmasked public activity decreased in North Dakota from 46 to 26%, Montana from 40 to 26%, Utah from 39 to 23%, and Nebraska from 39 to 26%.4
Fig. 2.
Trends by region and state from September 14, 2020, through November 22, 2020. The black line reflects the region, while the gray lines are individual states. Note that y-axes differ across variables. Due to survey reordering and minor wording changes, survey result levels are not directly comparable between Figures 1 and 2.
DISCUSSION
Our analysis of a large national survey indicates strong correspondence between rising COVID-19 case reports and increases in individual risk perceptions and mitigating behaviors. Nevertheless, the temporal coincidence between surging cases and behavior changes suggests that this reactive dynamic is likely too late to prevent substantial outbreaks and associated morbidity and mortality.5 With clear and consistent messaging and early warning signals, the new administration may be able to amplify and accelerate the public’s responses to mitigate COVID-19 outbreaks.
Limitations in this study include use of self-reported data and a sample of social media users, who may not be representative of the general population even on a highly used platform like Facebook. Further investigation of the dynamic relationship between infection risk, perceptions, behaviors, and heterogeneity by socioeconomic characteristics is warranted.6
Supplementary Information
(65 kb)
Acknowledgements
Contributors
None.
Funders
The authors were partially funded by the Colton Foundation (EE), Facebook (AB, JS), the Centers for Disease Control and Prevention through the Council of State and Territorial Epidemiologists (AB, JS) and the National Institute on Drug Abuse (JS).
Data Availability
Aggregated data and code are publicly available on GitHub: https://github.com/abilinski/COVID19RiskResponse.
Declarations
Conflict of Interest
The authors declare that they do not have a conflict of interest.
Disclaimer
The funders had no role in the design and conduct of the study; collection, management, analysis, and interpretation of the data; preparation, review, or approval of the manuscript; and decision to submit the manuscript for publication.
Footnotes
Prior presentations: None.
Publisher’s Note
Springer Nature remains neutral with regard to jurisdictional claims in published maps and institutional affiliations.
References
- 1.Garrett L. COVID-19: The Medium is the Message. The Lancet. 2020;395(10228):942–943. doi: 10.1016/S0140-6736(20)30600-0. [DOI] [PMC free article] [PubMed] [Google Scholar]
- 2.Kreuter F, Barkay N, Bilinski A, et al. Partnering with a Global Platform to Inform Research and Public Policy Making. Survey Research Methods. Published online June 2, 2020:159-163. doi:10.18148/SRM/2020.V14I2.7761
- 3.Our Data. The COVID Tracking Project. Accessed October 8, 2020. https://covidtracking.com/
- 4.Gallaway MS, Rigler J, Robinson S, et al. Trends in COVID-19 Incidence After Implementation of Mitigation Measures — Arizona, January 22–August 7, 2020. MMWR Morb Mortal Wkly Rep. 2020;69(40):1460-1463. doi:10.15585/mmwr.mm6940e3 [DOI] [PMC free article] [PubMed]
- 5.Woolf SH, Chapman DA, Sabo RT, Weinberger DM, Hill L, Taylor DDH. Excess Deaths From COVID-19 and Other Causes, March-July 2020. JAMA. 2020;324(15):1562. doi: 10.1001/jama.2020.19545. [DOI] [PMC free article] [PubMed] [Google Scholar]
- 6.Alsan M, Stantcheva S, Yang D, Cutler D. Disparities in Coronavirus 2019 Reported Incidence, Knowledge, and Behavior Among US Adults. JAMA Netw Open. 2020;3(6):e2012403. doi: 10.1001/jamanetworkop. [DOI] [PMC free article] [PubMed] [Google Scholar]
Associated Data
This section collects any data citations, data availability statements, or supplementary materials included in this article.
Supplementary Materials
(65 kb)
Data Availability Statement
Aggregated data and code are publicly available on GitHub: https://github.com/abilinski/COVID19RiskResponse.


