

Abstract
Background:
Future orientation (FO), an essential construct in youth development, encompassing goals, expectations for life, and ability to plan for the future. This study uses a multidimensional measure of future orientation to assess the relationship between change in future orientation and change in substance use over time.
Methods:
Data were from the Pathways to Desistence study. Justice involved youth (n = 1,354), ages 14 to 18 at time of recruitment, completed interviews every six months for three years. Multiple measures were chosen a priori as elements of future orientation. After evaluating the psychometrics of a new measure for future orientation, we ran mixed effects cross-lagged panel models to assess the relationship between changes in future orientation and substance use (tobacco, marijuana, hard drugs, and alcohol).
Results:
There was a significant bidirectional relationship between future orientation and all substance use outcomes. Adjusted models accounted for different sites, sex, age, ethnicity, parental education, and proportion of time spent in a facility. In adjusted models, higher levels of future orientation resulted in smaller increases in substance use at future time points.
Conclusions:
Future orientation and substance use influence each other in this sample of adolescent offenders. Treating substance use disorders is also likely to increase future orientation, promoting positive youth development more generally. This study expands our understanding of the longitudinal relationship between changes in future orientation and changes in levels of substance use in a sample of justice involved youth with high levels of substance use, a group of considerable clinical and policy interest.
Keywords: Juvenile justice, adolescents, substance use, future orientation, positive indicators
Introduction
Youth in the juvenile justice system report high rates of substance use (SU),(McClelland et al., 2004; The National Center on Addiction and Substance Abuse, 2004) and this SU is often directly connected to criminal activity, with youth often intoxicated when offenses occur (The National Center on Addiction and Substance Abuse, 2004). Compared to youth without juvenile justice involvement, those who had been arrested at least once in the past year were more than twice as likely to have used alcohol, more than 3.5 times as likely to have used marijuana, and between 3 and 20 times as likely to have used hard drugs (The National Center on Addiction and Substance Abuse, 2004). Their use also tends to be more severe, with estimates showing that 24 to 50 percent of justice-involved youth (JIY) meet criteria for diagnosable substance use disorders, compared with 9 percent of youth with no juvenile justice system contact (Chassin, 2008; Teplin et al., 2002). JIY are also more likely to continue to abuse substances into adulthood (Chassin, 2008; Teplin et al., 2012).
A positive attitude towards one’s own future may motivate positive change in a young person’s life by increasing coping skills or moderating impulsivity (Chen and Vazsonyi, 2011; Chua et al., 2015). In an influential paper, Nurmi (1989) described future orientation (FO) as a multidimensional process that characterizes a person’s personal goals as well as their thoughts about how and whether those goals are achievable (Nurmi, 1989a; Nurmi, 1991). This model theorizes three dimensions of FO: a) ‘aspirations’ or goals, b) ‘expectations’ or the judged likelihood of achieving these goals, and c) ‘planning’ or having the developmental tools to achieve one’s future plans. Fatalism, or the expectation of an early death, is another component of FO found to be particularly relevant to JIY or youth exposed to violence (Borowsky et al., 2009; Iselin et al., 2012; Piquero, 2014). Evidence that these posited processes are related to improved outcomes, however, remains limited.
Studies that have investigated the relationship between FO and SU have all shown that higher elements of FO are associated with lower amounts of SU (Barnett et al., 2013; Keough et al. 1999; Robbins and Bryan, 2004; Stein et al., 2006). Each of these studies, however, uses only a single aspect or partial subset of the dimensions of FO as conceptualized by Nurmi and expanded by others (Lindstrom Johnson et al., 2015; Nurmi, 1991; Seginer, 2003). In addition, these studies are generally cross-sectional; (Bolland, 2003; Donovan et al., 2015; Fite et al., 2014; Hawkins et al., 1992; Jackson et al., 2003) there are only a few longitudinal studies with limited measures of FO (Barnett, et al., 2013; Chua, et al., 2015) and/or small, select samples (Holmes and Kim-Spoon, 2016). The current study adds to this existing literature by first creating a model of FO informed by all dimensions that constitute this broader theoretical construct and then exploring the relationship of that comprehensive measure of future orientation with SU behaviors over time in a high-risk sample.
This study expands our understanding of the longitudinal relationship between changes in FO and changes in levels of SU in a sample of JIY with high levels of SU, a group of considerable clinical and policy interest. We develop and use a multidimensional, theoretically based, psychometrically sound model of FO to test associations of this construct with different types of SU in late adolescence. We perform a secondary data analysis that investigates the influence over time between changes in FO and changes in SU in a sample of adolescents and young adults with serious offenses. We hypothesize that greater increases in FO over time will be related to slower increases in SU over time.
Participants and procedures
Data set
Data for these secondary analyses are from the Pathways to Desistance Study (“Pathways” study), a longitudinal study of serious juvenile offenders in two locales (Philadelphia, PA, and Phoenix, AZ) as they make the transition from adolescence into early adulthood. The rationale for the study is presented in Mulvey et al. (2004) and the details of study operations are presented in Schubert et al. (2004). The data used in these analyses were available from the Inter-university Consortium for Political and Social Research hosted by the University of Michigan (ICPSR) (https://www.icpsr.umich.edu/icpsrweb/ICPSR/series/00260.)
The analyses reported here use data for the period of the baseline interview through the 36-month assessment; there are six follow-up interviews done approximately six months apart. This offers two advantages. First, it provides a reasonable time interval (six months) in which a shift in level of SU or FO might be expected to exert an influence. Second, it covers the period between ages 16 and 19 for most of the participants – a dynamic period of development when psychosocial contexts and SU patterns shift and when adolescent offenders may be amenable to engage in SU interventions, before such behaviors are more firmly established. Table 1 shows participant characteristics.
Table 1.
Demographics and substance use behaviors at baseline (n = 1350).
| Demographics | Number | Percent | |
|---|---|---|---|
| Sex, F | 184 | 13.6 | |
| Age 14–15 | 417 | 30.8 | |
| Age 16–17 | 825 | 60.9 | |
| Age 18–19 | 112 | 8.3 | |
| Site, Philadelphia | 700 | 51.7 | |
| Site, Phoenix | 654 | 48.3 | |
| Ethnicity, Hispanic | 454 | 33.5 | |
| Ethnicity, Black Non-Hispanic | 561 | 41.4 | |
| Ethnicity, White Non-Hispanic | 274 | 20.2 | |
| Ethnicity, Other | 65 | 4.8 | |
| Substance Use | |||
| Ever Cigarette Use | 981 | 72.5 | |
| Ever Marijuana Use | 1148 | 85.0 | |
| Ever Hard Drug Use | 387 | 27.4 | |
| Ever Alcohol Use | 1080 | 80.5 | |
| Any drug use in the past 6 months | 823 | 61.0 | |
| Symptoms of Drug Dependency | 409 | 30.3 | |
| History of Drug Treatment | 283 | 21.0 | |
| Number of Drugs used (mean) | 1–3 types | 21.0 |
Measures
Future orientation
We operationalized the FO construct using established scales and items available in the Pathways data set chosen a priori to represent the dimensions proposed by Nurmi in his theoretical model; i.e., aspirations, expectations, and planning (Nurmi, 1989b;). We added a fatalism measure to Nurmi’s model, consistent with other studies evaluating future expectations in JIY (Borowsky, et al., 2009; Iselin, et al., 2012; Piquero, 2014). We used confirmatory factor analysis to assess the soundness of a composite measure of mean scores and the fatalism measure as a representation of FO. We also examined the correlations of the derived factor score with previously validated measures of adolescent psychosocial development to assess construct validity. FO was assessed independently at each time point.
Aspirations:
The Perceptions of Chances for Success (PCFS) measure has a subscale to represent the aspirations element of the FO construct. The items contributing to the subscale indicate the adolescent’s view of the importance of future achievement in the domains of education, work, and family, and avoidance of legal system involvement. Participants responded on a 5-point Likert scale ranging from 1 indicating “Not at all important/Poor” to 5 corresponding with “Very important/Excellent” (e.g. How important is it that I graduate from college). Higher scores indicate greater optimism concerning future opportunities and/or success. We used a mean score that summarized scores for participants answering at least 5 of the 6 items. The aspiration score mean for the sample at baseline was 3.15 [94%CI: 2.19, 4.12] with a Cronbach alpha of 0.67.
Expectations:
The PCFS measure also contains an expectations scale. Youth answered six questions in the same domains referenced above on a five-point Likert scale regarding their perceived likelihood of achieving successful outcomes in each domain (e.g. How likely is it that I will graduate from college). We incorporated the mean expectations score as a component of our FO score (Cronbach alpha = 0.81). The mean score forthe sample at baseline was 1.48 [95%CI; 0.253, 2.701].
Fatalism:
A single item, age at expected death (in years) was used as a proxy measure for fatalism. This value was taken as a relative indicator of the adolescent’s view regarding overall future prospects, and has been found to be salient in this population and in other investigations with this sample (Piquero, 2014). Range ofyears provided were 16 to 200 with all values above 100 recoded to 100. Mean age in the sample was 70.9 years old.
Planning:
We assessed the planning component of the FO construct using the Future Outlook Inventory (FOI), developed by Cauffman and Woolard (1999, unpublished) for the Pathways study. This scale includes elements from the Life Orientation Task (Scheier and Carver, 1985), the Zimbardo Time Perspective Scale (Zimbardo, 1990) and the Consideration of Future Consequences Scale (Strathman et al., 1994). The FOI is a self-assessment where participants to rank from 1 to 4 (1 = Never True to 4 = Always True) the degree to which each statement reflects how they usually are (e.g., I will keep working at difficult, boring tasks if I know they will help me get ahead later). Higher scores indicate a greater degree of future consideration and planning. The mean score of the FOI was used in deriving our FO score and at baseline was 1.14 [95%CI: 0.309,1.96] with a Cronbach alpha of 0.68.
Additional details for each measure can be found at www.pathwaysstudy.pitt.edu.
Substance use
At each interview, adolescents reported the frequency of their use of tobacco, marijuana, alcohol, and hard drugs during the previous six-month period. Frequency of use in the past 6 months was indicated on a 9-point scale, an approach used successfully in previous research (Chassin et al., 1991; Mann et al., 1987). Because of skewness and underrepresentation of particular values, all positive responses (i.e., those greater than 0, which indicated ‘no use’) were collapsed from eight categories into four: 1 (one to five times), 2 (one to three times per month), 3 (one to three times per week), and 4 (four times per week or more), similar to what was done with this data set previously (Chassin et al., 2009).
Data Analysis
Composite future orientation (FO) scale
Table 2 shows the results of the confirmatory factor analysis testing for the fit of a single factor solution using the mean scores for the aspirations and expectations subscales, the age at expected death (fatalism), and the mean score for the FOI (planning capacity). The single factor solution of the theorized model produces acceptable fit statistics (RMSEA = 0.025; CFI = 0.999) compared to benchmarks of 0.05 and 0.90, respectively (Hu and Bentler, 1999). Second order structural equation modeling was not done to derive the factor solution because we did not have access to all individual item values.
Table 2.
Confirmatory Factor Analysis: Fit Statistics (n = 1343).
| RMSEA | 0.025 | CI: (0-0.067); df 6, p = 0.00 |
| CFI | 0.999 | |
| Chi-squared | 1570 | P 0.000 |
| SRMR | 0.009 | |
| CD | 0.995 |
We also evaluated the construct validity of the derived factor score by correlating this composite FO scale with previously validated measures of psychosocial maturity associated with positive youth development (Monahan et al., 2013; Schubert et al., 2016; Steinberg et al., 2015). The identity and self-reliance subscales of the Psychosocial Maturity Index (Greenberger et al., 1975) and the impulsiveness subscale of the Weinberger Adjustment Inventory (Feldman and Weinberger, 1994; Weinberger and Schwartz, 1990) were used for this purpose. Each of these scales is expected to show a positive association with FO. Table 3 shows correlations between the generated factor score and the scales chosen, with fairly strong positive correlations ranging from 0.43 to 0.59 (all significant at <p = 0.001). These indicate concordance high enough to demonstrate convergent validity, but low enough to rule out the measures being duplicative of these general indicators of psychosocial maturity.
Table 3.
Correlations of the CFA score for Future Orientation (FO) with convergent measures.
| Measure | Pearson Correlation Coefficient (r) |
|---|---|
| Psychosocial Maturity Index (PSMI) | 0.433** |
| PSMI- Self Reliance subscale | 0.596** |
| PSMI-Identity subscale | 0.433** |
| Weinberger Adjustment | 0.530** |
| Inventory-Impulsiveness subscale |
significant at ≤p = 0.01.
Analyses of changes over time
The derived FO factor score was calculated in terms of a standardized score. SU data were normalized using methods similar to what was described in Chassin et al (2009), including transformation of the cigarette-smoking outcome using in order to normalize the distribution of those particular data(Chassin, et al., 2009). The use of standardized scores increases the interpretability of any observed effects. It allows for shifts in FO and SU to be calibrated on comparable metrics and for shifts on a unit of one variable to be interpretable in terms of comparable shifts of a unit on the other variable.
Change scores (relative to each previous interview; time t minus time t-1) were created and tested for their associations over time for each of the constructs of interest. We employed a linear mixed effects approach to model the change in outcome (from the previous interview) over time, accounting for the correlated observations within each participant. We assessed bidirectional relationships between FO and each SU outcome (tobacco use, marijuana use, alcohol use, and hard drug use) in two types of models. First, we fit a linear mixed model for FO with covariates for concurrent change in SU, including both FO at the previous interview and SU at the previous interview in the model. Second, we fit a linear mixed model for each SU variable with covariates for concurrent change in FO, with FO at the previous interview and SU at the previous interview in the model. We used this technique to determine whether there was a quantitatively discernible and bi-directional relationship between the variables. Given that we were using standardized change scores and were assessing for hypothesized group level changes for multiple variables over time, we selected theses longitudinal modeling techniques. (Husted et al., 2012). We repeated the above models adjusting for age, gender, data collection site, proportion of time out of a locked facility during the recall period, and highest parental education; known influences of substance use and in line with other studies of SU in JIY (Chassin, et al., 2009).
While there are 1,354 subjects in the original data set, we took different sub-samples for each model based on completeness of data. As a result, each model has a slightly different sample size. Sensitivity analyses of each SU outcome show no differences between relevant outcomes in those included and those who were not.
Results
Sample
We used all available data from the entire Pathways sample for this study (n = 1,354). The sample was primarily male (86%), minority (31% Hispanic, 43% black, 22% white, and 4% other) and slightly more likely to be from Philadelphia than Phoenix (56% versus 44%). The mean age atbaselinewas 16years (SD = 1.10 years). On average, these individuals had three (SD = 2.10) prior petitions to court before enrollment and were 15 years old (SD = 1.60) at the time of their first petition. For almost half of the sample (47%), the offense bringing them into the study was a felony offense against a person (e.g., armed robbery, aggravated assault).
Prior SU in this sample was high: 84.9% of the youth report ever using marijuana, 80.5% report ever using alcohol, 72.5% report ever using cigarettes, and 27.4% report any hard drug use, with the most common lifetime hard drug being hallucinogens. Of those reporting hard drug use, most reported using between one and three different hard drugs (64.3%) sometime in the past, and about 61% reported using hard drugs in the prior 6 months. About one third reported any symptoms of drug dependency, and 21% had a history of drug treatment at baseline. Of those who smoked cigarettes, average use in the immediate recall period was 2–3 times per week (n = 722), and of alcohol users average use was 2 to 3 times per month (n = 711). Among those who used marijuana, use averaged between 1 and 3 times per week (n = 768) in the immediate recall period. Of recent hard drug users, cocaine was the most common substance in this period, with average use between 1 and 3 times per month (n = 167).
Substance use and future orientation
Figure 1 shows outcomes for the relationship between change in tobacco use and change in FO and previous level of FO over all of the recall periods. The negative direction of the loadings indicates that those with higher FO at a particular time point have smaller increases in tobacco use at the next time point; and those with large increases in FO have the smallest increases in tobacco use at the concurrent time point. This relationship is maintained when the amount of use is adjusted for demographics and time outside of a locked facility. The largest driver of tobacco use at a particular time point is tobacco use at the previous time point. Despite this large impact (beta = −0.867; p < 0.01), we still find that previous level of FO has a statistically significant effect on both current and future tobacco use (with beta values of −0.044 (p < 0.01) and −0.064 (p < 0.01), respectively). Change in FO also affects concurrent change in tobacco, with beta of −0.043 (p = 0.011). These relationships are bidirectional. Previous and current tobacco use affects the magnitude of a young persons change in FO. The magnitude of the beta coefficient illustrates that the impact of previous tobacco use on FO is slightly less (beta = 0.037) than the magnitude of the effect of previous FO on change in tobacco use, at 0.064. Table 4 shows model intercepts and confidence intervals for beta coefficients for unadjusted and adjusted models.
Figure 1.

Time Lag Relationship between changes in future orientation and changes in amount of tobacco use. Tobacco 1 is unadjusted model Tobacco 2 Adjusted model. T-1 indicates prior time point, T indicates reference time point. Future indicates future orientation score.
**P value equal or less than 0.01
Table 4.
Beta coefficients for models relating substance use and future orientation.
| Outcome | ||||||||||
|---|---|---|---|---|---|---|---|---|---|---|
| Change in Substance use |
Change in Future Orientation |
|||||||||
| Adjusted Tobacco Use | Adjusted Marijuana Use | Adjusted Hard Drug Use | Adjusted Alcohol Use | Adjusted Binge Alcohol Use | Adjusted Tobacco Use | Adjusted Marijuana Use | Adjusted Hard Drug Use | Adjusted Alcohol Use | Adjusted Binge Alcohol Use | |
| β [95% CI] | β [95% CI] | |||||||||
| Change in Substance Use | NA | NA | NA | NA | NA | −0.019 [−0.035,−0.004] |
−0.053 [−0.071,−0.035] |
−0.056 [−0.075,−0.037] | −0.028 [−0.043,−0.012] | −0.018 [−0.033,−0.004] |
| Change in Future Orientation | −0.043 [−0.076,−0.019] |
−0.103 [−0.137,−0.069] |
−0.061 [−0.082,−0.039] |
−0.046 [−0.072,−0.021] |
−0.029 [−0.050,−0.008] |
NA | NA | NA | NA | NA |
| Substance Use at Previous Visit | −0.682 [−0.726,−0.638] |
−0.815 [−0.855,−0.775] |
−0.545 [−0.579,−0.511] |
−0.716 [−0.751,−0.681] |
−0.621 [−0.656,−0.586] |
−0.037 [−0.055,−0.019] |
−0.038 [−0.052,−0.023] |
−0.040 [−0.057,−0.024] |
−0.023 [−0.039,−0.006] |
−0.018 [−0.034,−0.003] |
| Future Orientation at Previous Visit | −0.055 [−0.092,−0.012] |
−0.131 [−0.170,−0.092] |
−0.096 [−0.120,−0.072] |
−0.040 [−0.071,−0.009] |
−0.033 [−0.060,−0.007] |
−0.343 [−0.364,−0.322] |
−0.223 [−0.242,−0.204] |
−0.224 [−0.242,−0.206] |
−0.220 [−0.238,−0.202] |
−0.218 [−0.236,−0.200] |
| Intercept | 0.572 [−1.143,0.000] |
0.008 [−0.519, 0.502] |
0.002 [−0.296,0.301] |
−0.716 [−1.179,−0.253] |
−0.347 [−0.719,−0.024] |
0.217 [−0.065,0.497] |
0.186 [−0.013,0.386] |
0.195 [−0.005,0.394] |
0.166 [−0.036,0.368] |
0.179 [−0.021,0.379] |
Marijuana, hard drug, and alcohol use including binge drinking follow the same patterns as those of tobacco. Figure 2 shows the relative effects for change in marijuana use and FO over time. Figure 3 shows the results of these relationships among hard drug use and FO. Figure 4 shows the results of any alcohol use and Figure 5 shows models of binge drinking and FO. The effects for each substance tested are bidirectional. Intercepts and confidence intervals can be found in Table 4.
Figure 2.
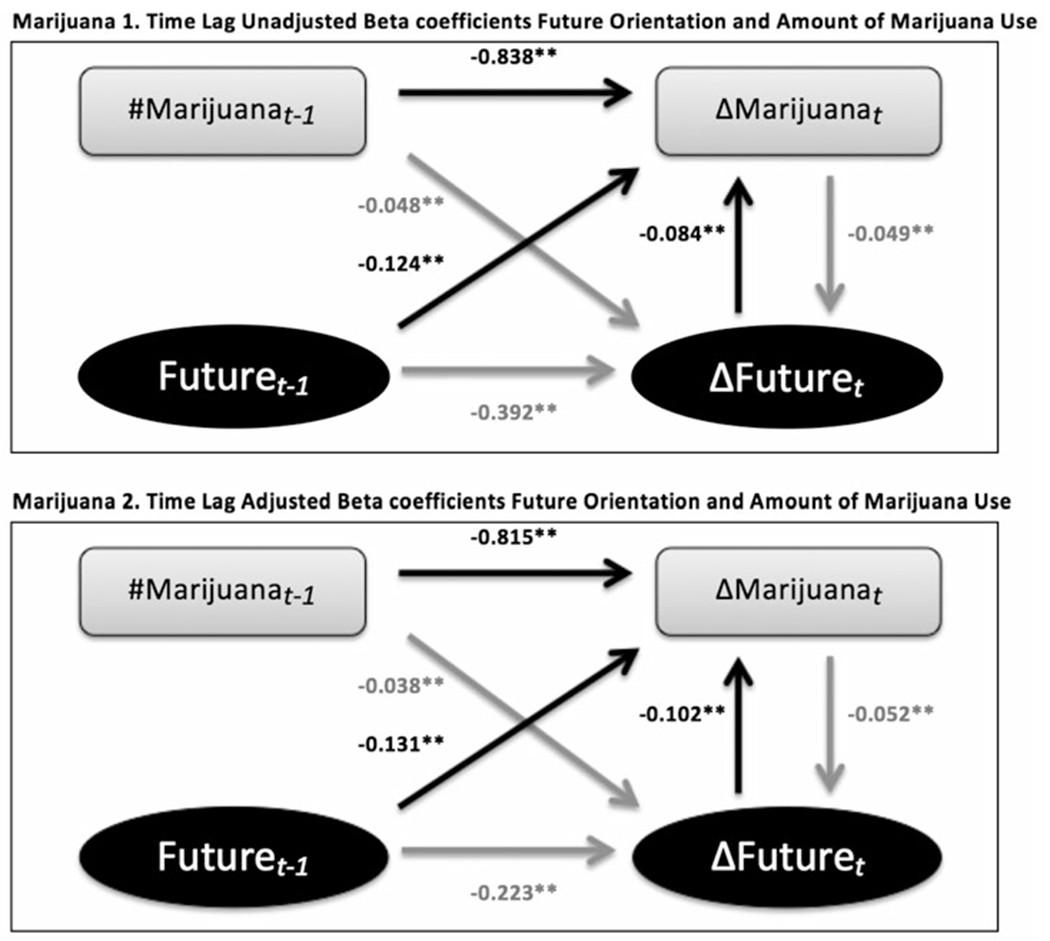
Time Lag Relationship between changes in future orientation and changes in amount of marijuana use. Marijuana 1 is unadjusted model Marijuana 2 Adjusted model. T-1 indicates prior time point, T indicates reference time point. Future indicates future orientation score.
Figure 3.

Time Lag Relationship between changes in future orientation and changes in amount of hard drug use. Hard drug 1 is unadjusted model Hard drug 2 Adjusted model. T-1 indicates prior time point, T indicates reference time point. Future indicates future orientation score.
Figure 4.

Time Lag Relationship between changes in future orientation and changes in amount of alcohol use. Alcohol 1 is unadjusted model Alcohol 2 Adjusted model. T-1 indicates prior time point, T indicates reference time point. Future indicates future orientation score.
Figure 5.

Time Lag Relationship between changes in future orientation and changes in amount of binge drinking. Binge 1 is unadjusted model binge 2 Adjusted model. T-1 indicates prior time point, T indicates reference time point. Future indicates future orientation score.
Some other specific findings are notable. Each model also shows that the strongest predictor of changes in substance use at time t is previous substance use. This holds for all models tested. The change in binge drinking at time t, however, is also associated with the change in FO at the same time t, showing a cross sectional relationship between the change variables as well. All of these results are presented in table 4.
Discussion
To our knowledge, this study is the first to use a psychometrically supported comprehensive measure of FO that includes all significant FO dimensions (aspirations, expectations, fatalism, and planning, as noted in theoretical models of FO) to assess the relationship between previous level of and changes in FO and SU over time. This study adds to the emerging literature and provides support for the idea that FO is a relevant and positive youth developmental construct even for youth with a well-established history of serious antisocial behaviors.
In summary, our findings support the hypothesized relationship between higher FO and slower increases in SU over time in an observational sample of high-risk adolescents. The cross-lag mixed effects models employed addresses whether there is a group level generalized relationship between these change scores during a dynamic developmental period for these adolescents. The results indicate small but significant bidirectional associations between FO and categorical frequency of substance use in this sample of over 1000 adjudicated youth. In addition, this observed association holds for tobacco, marijuana, hard drug use, and both overall and binge alcohol use, even when relevant covariates are included in the model. This bidirectional relationship is observed in this sample who may or may not have been exposed to any number of substance use or developmental interventions while detained. The results are also above and beyond strong effects related to previous SU. Importantly, this sample of youth was justice-involved, high-risk and high-using. Despite the possible dampening of positive future orientation inherent with juvenile justice involvement and their social milieu, increasing FO appears to influence these adolescents positively.
These results contribute to existing literature showing a positive bidirectional relationship between FO and SU in youth (Bolland, 2003; Carvajal et al., 1998; Chua, et al., 2015; Donovan, et al. 2015; Hawkins, et al. 1992; Holmes and Kim-Spoon, 2016; Koehn et al., 2012; Mathis et al., 2009; May et al., 2015; Peters et al., 2005; Wilson et al., 2005). In a longitudinal study, Barnett et al (2013) found that future time perspective (a measure similar to our planning measure) was associated with decreased SU over two time points in a sample ofhigh riskyouth at an alternative high school (Barnett, et al., 2013). In that study, the relationship was not bidirectional, and the follow up period was limited to one year. Holmes et al (2016) also found that FO has a positive influence on SU over time in a small sample of typically developing youth with high sense of religion (Holmes and Kim-Spoon, 2016). Consistent with our results, Chua (2015) found that high FO (using some elements of our construct related to expectations and planning) influenced poor coping, which in turn resulted in decreased SU over a 2-year period among typically developing young people in New Zealand (Chua, et al., 2015). Beyond individual FO, Alm and Laftman (2016) showed that classroom communities with high FO influence person level decreases in alcohol use (Alm and Laftman, 2016). Our study adds to the growing literature supportive of a substantial relationship between high FO and a reduction in SU, this time in a sample of adolescents where positive change would seem unlikely.
The mechanisms for the role of FO in slowing SU are not explained with this current study. Multiple possibilities exist. One is that this sample of youth with higher FO may be less likely to associate regularly with youth who are making more impulsive decisions, producing the observed association. Alternatively, there could be a “third” variable driving the changes in both FO and SU. A variety of relevant developmental variables related to FO can be expected to increase during adolescence (Banich et al., 2013; Beal, 2011; Mello et al., 2009; Nurmi, 1989a; Nurmi, 1991; Ripke et al., 2012; Seginer, 2003), but shifts in FO and SU cannot be attributed simply to age in this study, since age was accounted for in the adjusted model and statistically significant findings remained. However, previous adolescent SU studies often show increases as youth age, so though FO may be increasing in a developmentally appropriate manner, the slowed use of substances may not be explained by age differences (Johnston et al., 2015; Substance Abuse and Mental Health Services Administration, 2014). Finally, being involved with the juvenile justice system and its subsequent rehabilitation attempts may have changed both SU and FO trajectories equally but not simultaneously, making the observed changes parallel and not causal. If this is the case, it presumes JIY most responsive to SU treatment or cognitive interventions are also encouraged by their success either resisting SU or thinking ahead more clearly. Success in one realm, thus, leads to improvements in the other.
More SU is also associated with decreases in FO in these current analyses. This study cannot provide a definitive causal explanation for this directional relationship. However, we could hypothesize that SU leads to apathy or blunts motivation towards future planning, as it does with psychosocial maturity more generally (Chassin et al., 2010). For example, chronic exposure to multiple substances shows sustained decreased cognition in adolescents (Gould, 2010; Meier et al., 2012). Involvement with significant SU may increase a young person’s fatalism, resulting in a younger estimated age for expected death, consistent with results from the National Longitudinal Study of Adolescent Health (which showed a relationship between early illicit drug use and increased likelihood to perceive early death and not vice versa) (Borowsky, et al., 2009).
There are limitations with this study to consider. Since individual items were not available for all measures, and the items available in this data set used for this analysis were limited to mean scores for all of the scales (PCFS, FOI, fatalism) used in the measure, the composite measure of FO may not be as accurate in its representation of FO as it could have been. Related, the aspirations scale of the PCFS and the FOI measures have reliability scores less than 0.7 (0.67, 0.68 respectively), though these scores are only slightly below standard cut offs this increases the likelihood that error explains measured differences. Our composite measure aligns with Nurmi’s multidimensional concept, but is still not a fully elaborated model. Although the current model is more comprehensive than those tested in previous work, further studies are needed to refine and validate comprehensive measures for FO. Second, the sample is mostly male, mostly minority, seriously offending youth, which is both a limitation and a strength. The composition of the sample limits generalizability outside of JIY. At the same time it is reassuring that the characteristics of the sample indicate that even the most high-risk youth, who might be thought of as least likely to gain from interventions, may instead represent a suitable target group for interventions. Third, the measures for FO and SU were based on self-report and thus arevulnerable to social desirabilitybias. Fourth, the cross-lagged panel mixed effects modeling approach, though appropriate to test the question of whether there is an overall sample level relationship between previous levels of and change in FO and SU, is limited. This approach does not provide information on individual fixed effects or moderators, but it does clearly demonstrate the potential for FO to influence SU behavior, even in the most high-risk groups. Next steps would be to evaluate individual trajectories to further explore the nuances of this relationship and to use a FO centered intervention to assess an effect size potentially attributable to such an intervention.
Despite these limitations, these findings support the potential group level impact of promoting positive youth development with even the highest risk adolescents. To our knowledge this is the first longitudinal study with a large sample of high-risk youth to find a significant bidirectional influence between a multidimensional measure of FO and changes in use of tobacco, marijuana, hard drugs, and alcohol. These results and others support the conclusion that for even very high-risk youth, where results can sometimes be difficult to obtain, there is a role for adding promotion of FO to a comprehensive SU intervention. Simultaneously, SU treatment may lead to heightened FO, thus promoting positive youth development overall.
Acknowledgements
We would like to acknowledge Kwonho Jeong and Scott Rothenberger of the Center for Research on Health Care Data Center at the University of Pittsburgh for assistant with statistical analyses. We would also like to thank Gerald Montano, Heather McCauley, and Carol Schubert for manuscript review.
Funding from Eunice Kennedy Shriver National Institute of Child Health and Human Development [5T32HD071834-03].
Footnotes
Copyright of Substance Use & Misuse is the property of Taylor & Francis Ltd and its content may not be copied or emailed to multiple sites or posted to a listserv without the copyright holder’s express written permission. However, users may print, download, or email articles for individual use.
References:
- Alm S, & Låftman SB (2016). Future orientation climate in the school class: Relations to adolescent delinquency, heavy alcohol use, and internalizing problems. Children and Youth Services Review, 70, 324–331. doi: 10.1016/j.childyouth.2016.09.021 [DOI] [Google Scholar]
- Banich MT, De La Vega A, Andrews-Hanna JR, Mackiewicz Seghete K, Du Y, & Claus ED (2013). Developmental trends and individual differences in brain systems involved in intertemporal choice during adolescence. Psychol Addict Behav, 27, 416–430. doi: 10.1037/a0031991. Epub 0032013 Apr 0031915. [DOI] [PubMed] [Google Scholar]
- Barnett E, Spruijt-Metz D, Unger JB, Rohrbach LA, Sun P, & Sussman S (2013). Bidirectional Associations Between Future Time Perspective and Substance Use Among Continuation High-School Students. Substance use & misuse, 48, 574–580. doi: 10.3109/10826084.2013.787092 [DOI] [PMC free article] [PubMed] [Google Scholar]
- Beal S (2011). The development of future orientation: under-pinnings and related concepts. PhD, University of Nebraska, Lincoln. Retrieved from http://digitalcommons.unl.edu/psychdiss/32/?utm_source=digitalcommons.unl.edu%2Fpsychdiss%2F32&utm_medium=PDF&utm_campaign=PDFCoverPages(32) [Google Scholar]
- Bolland JM (2003). Hopelessness and risk behaviour among adolescents living in high-poverty inner-city neighbourhoods. J Adolesc. 26,145–158. [DOI] [PubMed] [Google Scholar]
- Borowsky IW, Ireland M, & Resnick MD (2009). Health status and behavioral outcomes for youth who anticipate a high likelihood of early death. Pediatrics., 124, e81–88. doi: 10.1542/peds.2008-3425. [DOI] [PubMed] [Google Scholar]
- Carvajal SC, Clair SD, Nash SG, & Evans RI (1998). Relating optimism, hope, and self-esteem to social influences in deterring substance use in adolescents. Journal of Social and Clinical Psychology, 17, 443–465. doi: 10.1521/jscp.1998.17.4.443 [DOI] [Google Scholar]
- Cauffman E & Woolard J (1999). Future outlook inventory. Unpublished test. [Google Scholar]
- Chassin L (2008). Juvenile justice and substance use. Future Child., 18, 165–183. [DOI] [PubMed] [Google Scholar]
- Chassin L, Dmitrieva J, Modecki K, Steinberg L, Cauffman E, Piquero AR, … Losoya SH. (2010). Does adolescent alcohol and marijuana use predict suppressed growth in psychosocial maturity among male juvenile offenders? Psychol Addict Behav, 24,48–60. doi: 10.1037/a0017692. [DOI] [PMC free article] [PubMed] [Google Scholar]
- Chassin L, Knight G, Vargas-Chanes D, Losoya SH, & Naranjo D (2009). Substance use treatment outcomes in a sample of male serious juvenile offenders. J Subst Abuse Treat, 36, 183–194. doi: 10.1016/j.jsat.2008.1006.1001. Epub 2008 Jul 1026. [DOI] [PMC free article] [PubMed] [Google Scholar]
- Chassin L, Rogosch F, & Barrera M (1991). Substance use and symptomatology among adolescent children of alcoholics. J Abnorm Psychol, 100, 449–463. [DOI] [PubMed] [Google Scholar]
- Chen P, & Vazsonyi AT (2011). Future orientation, impulsivity, and problem behaviors: a longitudinal moderation model. Dev Psychol, 47,1633–1645. doi: 10.1037/a0025327. Epub 0022011 Sep 0025325. [DOI] [PubMed] [Google Scholar]
- Chua LW, Milfont TL, & Jose PE (2015). Coping Skills Help Explain How Future-Oriented Adolescents Accrue Greater Well-Being Over Time. J Youth Adolesc, 44, 20282041. doi: 10.1007/s10964-10014-10230-10968. Epub 12014 Nov 10927. [DOI] [PubMed] [Google Scholar]
- Donovan DM, Thomas LR, Sigo RLW, Price L, Lonczak H, Lawrence N, … Bagley L (2015). Healing of the canoe: preliminary results of a culturally grounded intervention to prevent substance abuse and promote trival identity for Native youth in two Pacific Northwest Tribes. American Indian and Alaska native mental health research (Online), 22, 42–76. [DOI] [PMC free article] [PubMed] [Google Scholar]
- Feldman SS, & Weinberger DA (1994). Self-restraint as a mediator of family influences on boys’ delinquent behavior: a longitudinal study. Child Dev, 65,195–211. [DOI] [PubMed] [Google Scholar]
- Fite PJ, Gabrielli J, Cooley JL, Haas SM, Frazer A, Rubens SL, & Johnson-Motoyama M (2014). Hope as a moderator of the associations between common risk factors and frequency of substance use among Latino adolescents. Journal of Psychopathology and Behavioral Assessment, 36, 653–662. doi: 10.1007/s10862-014-9426-1 [DOI] [PMC free article] [PubMed] [Google Scholar]
- Gould TJ (2010). Addiction and Cognition. Addiction Science & Clinical Practice, 5,4–14. [PMC free article] [PubMed] [Google Scholar]
- Greenberger E, Josselson R, Knerr C, & Knerr B (1975). The measurement and structure of psychosocial maturity. Journal of Youth and Adolescence, 4,127–143. [DOI] [PubMed] [Google Scholar]
- Hawkins JD, Catalano RF, & Miller JY (1992). Risk and protective factors for alcohol and other drug problems in adolescence and early adulthood: Implications for substance abuse prevention. Psychological Bulletin, 112, 64105. doi: 10.1037/0033-2909.112.1.64 [DOI] [PubMed] [Google Scholar]
- Holmes C, & Kim-Spoon J (2016). Adolescents’ Religiousness and Substance Use Are Linked via Afterlife Beliefs and Future Orientation. The Journal of Early Adolescence, 37(8), 1054–1077. doi: 10.1177/0272431616642325 [DOI] [PMC free article] [PubMed] [Google Scholar]
- Hu L. t., & Bentler PM (1999). Cutoff criteria for fit indexes in covariance structure analysis: Conventional criteria versus new alternatives. Structural Equation Modeling: A Multidisciplinary Journal, 6, 1–55. doi: 10.1080/10705519909540118 [DOI] [Google Scholar]
- Husted JA, Tom BD, Farewell VT, & Gladman DD (2012). Longitudinal study of the bidirectional association between pain and depressive symptoms in patients with psoriatic arthritis. Arthritis Care Res (Hoboken), 64, 758–765. doi: 10.1002/acr.21602. [DOI] [PubMed] [Google Scholar]
- Iselin AM, Mulvey EP, Loughran TA, Chung HL, & Schubert CA (2012). A longitudinal examination of serious adolescent offenders’ perceptions of chances for success and engagement in behaviors accomplishing goals. J Abnorm Child Psychol, 40,237–249. doi: 10.1007/s10802-10011-19561-z. [DOI] [PMC free article] [PubMed] [Google Scholar]
- Jackson R, Wernicke R, & Haaga DAF (2003). Hope as a predictor of entering substance abuse treatment. Addictive Behaviors, 28, 13–28. doi: 10.1016/S0306-4603(01)00210-6 [DOI] [PubMed] [Google Scholar]
- Johnston LD, O’Malley PM, Miech RA, Bachman JG, & Schulenberg JE. (2015). Monitoring the Future national survey results on drug use: 1975–2014: Overview, key findings on adolescent drug use. In T. U. o., M. I. f., S. Research (Ed.). Ann Arbor: The University of Michigan Institute for Social Research. [Google Scholar]
- Keough KA, Zimbardo PG, & Boyd JN. (1999). Who’s smoking, drinking, and using drugs? Time perspective as a predictor of substance use. Basic and Applied Social Psychology, 21, 149–164. doi: 10.1207/15324839951036498 [DOI] [Google Scholar]
- Koehn C, O’Neill L, & Sherry J (2012). Hope-focused interventions in substance abuse counselling. International Journal of Mental Health and Addiction, 10, 441–452. doi: 10.1007/s11469-011-9360-3 [DOI] [Google Scholar]
- Lindstrom Johnson S, Jones V, & Cheng TL (2015). Promoting “healthy futures” to reduce risk behaviors in urban youth: A randomized controlled trial. American Journal of Community Psychology, 56, 36–45. [DOI] [PMC free article] [PubMed] [Google Scholar]
- Mann LM, Chassin L, & Sher KJ (1987). Alcohol expectancies and the risk for alcoholism. J Consult Clin Psychol, 55, 411–417. [DOI] [PubMed] [Google Scholar]
- Mathis GM, Ferrari JR, Groh DR, & Jason LA (2009). Hope and substance abuse recovery: The impact of agency and pathways within an abstinent communal-living setting. Journal of Groups in Addiction & Recovery, 4, 42–50. doi: 10.1080/15560350802712389 [DOI] [PMC free article] [PubMed] [Google Scholar]
- May EM, Hunter BA, Ferrari J, Noel N, & Jason LA (2015). Hope and abstinence self-efficacy: Positive predictors of negative affect in substance abuse recovery. Community Mental Health Journal, 51(6), 695–700. doi: 10.1007/s10597-015-9888-y [DOI] [PMC free article] [PubMed] [Google Scholar]
- McClelland GM, Teplin LA, & Abram KM (2004). Detection and prevalence of substance use among juvenile detainees. In O. o., J. J. a.,D. Prevention (Ed.), Juvenile Justice Bulletin. Washington, D.C: U.S. Department of Justice. [Google Scholar]
- Meier MH, Caspi A, Ambler A, Harrington H, Houts R, Keefe RSE, … Moffitt TE. (2012). Persistent cannabis users show neuropsychological decline from childhood to midlife. Proceedings of the National Academy of Sciences, 109, E2657–E2664. doi: 10.1073/pnas.1206820109 [DOI] [PMC free article] [PubMed] [Google Scholar]
- Mello ZR, Bhadare DK, Fearn EJ, Galaviz MM, Hartmann ES, & Worrell FC (2009). The window, the river, and the novel: Examining adolescents’ conceptions of the past, the present, and the future. Adolescence, 44, 539–556. [PubMed] [Google Scholar]
- Monahan KC, Steinberg L, Cauffman E, & Mulvey EP (2013). Psychosocial (im)maturity from adolescence to early adulthood: Distinguishing between adolescence-limited and persisting antisocial behavior. Development and Psychopathology, 25, 1093–1105. doi: 10.1017/S0954579413000394 [DOI] [PubMed] [Google Scholar]
- Mulvey EP, Steinberg L, Fagan J, Cauffman E, Piquero AR, Chassin L, … Losoya SH. (2004). Theory and Research on Desistance from Antisocial Activity among Serious Adolescent Offenders. Youth Violence and Juvenile Justice, 2, 213–236. doi: 10.1177/1541204004265864 [DOI] [PMC free article] [PubMed] [Google Scholar]
- Nurmi JE (1989a). Development of Orientation to the Future during Early Adolescence: A Four-Year Longitudinal Study and Two Cross-Sectional Comparisons. Int J Psychol, 24, 195–214. doi: 10.1080/00207594.1989.10600042 [DOI] [PubMed] [Google Scholar]
- Nurmi JE (1989b). Planning, motivation, and evaluation in orientation to the future: a latent structure analysis. Scand J Psychol, 30, 64–71. [DOI] [PubMed] [Google Scholar]
- Nurmi JE (1991). How do adolescents see their future? A review of the development of future orientation and planning. Developmental Review, 11, 1–59. doi: 10.1016/0273-2297(91)90002-6 [DOI] [Google Scholar]
- Peters RJ Jr., Tortolero SR, Johnson RJ, Addy RC, Markham CM, Escobar-Chaves SL, … Yacoubian GS Jr (2005). The relationship between future orientation and street substance use among Texas alternative school students. Am J Addict, 14, 478–485. [DOI] [PubMed] [Google Scholar]
- Piquero AR (2014). “Take My License n’ All That Jive, I Can’t See … 35”: Little Hope for the Future Encourages Offending Over time. Justice Quarterly, 33(1), 73–99. doi: 10.1080/07418825.2014.896396 [DOI] [Google Scholar]
- Ripke S, Hubner T, Mennigen E, Muller KU, Rodehacke S, Schmidt D, … Smolka MN (2012). Reward processing and intertemporal decision making in adults and adolescents: the role ofimpulsivity and decision consistency. Brain Res, 1478:36–47., 10.1016/j.brainres.2012.1008.1034. Epub 2012 Aug 1025. [DOI] [PubMed] [Google Scholar]
- Robbins RN, & Bryan A (2004). Relationships Between Future Orientation, Impulsive Sensation Seeking, and Risk Behavior Among Adjudicated Adolescents. Journal of adolescent research, 19, 428–445. doi: 10.1177/0743558403258860 [DOI] [PMC free article] [PubMed] [Google Scholar]
- Scheier MF, & Carver CS (1985). Optimism, coping, and health: assessment and implications of generalized outcome expectancies. Health Psychol, 4, 219–247. [DOI] [PubMed] [Google Scholar]
- Schubert CA, Mulvey EP, & Pitzer L (2016). Differentiating serious adolescent offenders who exit the justice system from those who do not. Criminology, 54, 56–85. doi: 10.1111/1745-9125.12098 [DOI] [Google Scholar]
- Schubert CA, Mulvey EP, Steinberg L, Cauffman E, Losoya SH, Hecker T, … Knight GP. (2004). Operational Lessons from the Pathways to Desistance Project. Youth Violence Juv Justice., 2, 237. [DOI] [PMC free article] [PubMed] [Google Scholar]
- Seginer R (2003). Adolescent Future Orientation: An Integrated Cultural and Ecological Perspective. Online Readings in Psycology and Culture, 6(1), 1–12. [Google Scholar]
- Stein LAR, Monti PM, Colby SM, Barnett NP, Golembeske C, Lebeau-Craven R, & Miranda R (2006). Enhancing Substance Abuse Treatment Engagement in Incarcerated Adolescents. Psychological services, 3, 25–34. [DOI] [PMC free article] [PubMed] [Google Scholar]
- Steinberg L,Cauffman E,&Monahan KC. (2015). Psychosocial Maturity and Desistance From Crime in a Sample of Serious Juvenile Offenders. In O. o., J. J. a., D. Prevention (Ed.), OJJDP Juvenile Justice Bulletin (pp. 1–12). Laurel,MD: U.S. Department of Justice. [Google Scholar]
- Strathman A, Gleicher F, Boninger DS, & Edwards CS (1994). The consideration of future consequences: Weighing immediate and distant outcomes of behavior. Journal of Personality and Social Psychology, 66, 742–752. doi: 10.1037/0022-3514.66.4.742 [DOI] [Google Scholar]
- Substance Abuse and Mental Health Services Administration. (2014). Results from the 2013 National Survey on Drug Use and Health: Summary of National Findings. ((SMA) 14-4863). Rockville, MD: HHS H48. [PubMed] [Google Scholar]
- Teplin LA, Abram KM, McClelland GM, Dulcan MK, & Mericle AA (2002). Psychiatric disorders in youth in juvenile detention. Arch Gen Psychiatry., 59,1133–1143. [DOI] [PMC free article] [PubMed] [Google Scholar]
- Teplin LA, Welty LJ, Abram KM, Dulcan MK, & Washburn JJ (2012). Prevalence and persistence of psychiatric disorders in youth after detention: a prospective longitudinal study. Arch Gen Psychiatry., 69, 1031–1043. doi: 10.1001/archgenpsychiatry.2011.2062. [DOI] [PMC free article] [PubMed] [Google Scholar]
- The National Center on Addiction and Substance Abuse. (2004). Criminal Neglect: Substance Abuse, Juvenile Justice and The Children Left Behind (pp. 177). New York, NY: Columbia University. [Google Scholar]
- Weinberger DA, & Schwartz GE (1990). Distress and restraint as superordinate dimensions of self-reported adjustment: a typological perspective. J Pers, 58, 381–417. [DOI] [PubMed] [Google Scholar]
- Wilson N, Syme SL, Boyce WT, Battistich VA, & Selvin S (2005). Adolescent alcohol, tobacco, and marijuana use: the influence of neighborhood disorder and hope. Am J Health Promot, 20, 11–19. [DOI] [PubMed] [Google Scholar]
- Zimbardo PG (1990). Stanford Time Perspective Inventory manual. Stanford, CA: Stanford University, Department of Psychology. [Google Scholar]