Abstract
Significance.
The macular ganglion cell-inner plexiform layer (mGCIPL) may serve as a quick and easily obtained measure of generalized neurodegeneration. Investigating factors associated with this thickness could help to understand neurodegenerative processes.
Purpose.
Characterize and identify associated factors of the mGCIPL thickness in the Beaver Dam Offspring Study, a middle-aged U.S. adult cohort.
Methods.
Baseline examinations occurred from 2005 to 2008, with follow-up examinations every five years. Included participants had baseline data and measured mGCIPL at 10-year follow-up (N=1848). The mGCIPL was measured using the Cirrus 5000 HD-OCT Macular Cube Scan. Associations between mean mGCIPL thickness and thin mGCIPL, defined as 1 standard deviation (SD) below the population mean, and baseline risk factors were investigated using generalized estimating equations.
Results.
Participants (mean baseline age: 48.9 years (SD=9.3); 54.4% women) had a mean mGCIPL thickness of 78.4 μm (SD=8.1) in the right eye and 78.1 μm in the left (SD=8.5), correlation coefficient=0.76. In multivariable models, age (−1.07 μm per 5 years; 95% CI: −1.28 to −0.86), high alcohol consumption (−1.44 μm; 95% CI=−2.72, −0.16), higher interleukin-6 levels (50% increase in level: −0.23 μm; 95% CI: −0.45 to 0.00), myopia (−2.55 μm; 95% CI: −3.17 to −1.94), and glaucoma (−1.74 μm, 95% CI: −2.77 to −0.70) were associated with thinner mGCIPL. Age (per 5 years: Odds Ratio (OR)=1.38, 95% CI: 1.24-1.53), diabetes (OR=1.89, 95% CI:1.09-3.27), myopia (OR=2.11, 95% CI: 1.63-2.73), and increasing and long-term high C-reactive protein (OR=1.46, 95% CI: 1.01-2.11; OR=1.74, 95% CI=1.14-2.65, respectively) were associated with increased odds of thin mGCIPL.
Conclusions.
Factors associated cross-sectionally with mGCIPL thickness, older age, high alcohol consumption, inflammation, diabetes, myopia, and glaucoma, may be important to neural retina structure and health and neuronal health system wide.
Advances in ocular imaging, specifically high-resolution spectral domain optical coherence tomography, have led to a quick non-invasive method for measuring retinal layers including the macular ganglion cell-inner plexiform layer. The automated segmentation of the macular ganglion cell-inner plexiform layer may be useful as a novel, non-invasive, and quick measure of generalized neuronal health.
The macular ganglion cell-inner plexiform layer consists of retinal ganglion cell bodies and dendrites, the main anatomical substrates of the neural retina.1-2 The macular ganglion cell-inner plexiform layer has been important in studies of ocular diseases like glaucoma and in studies of neurodegenerative diseases, including multiple sclerosis, Alzheimer’s disease, and Parkinson’s disease.3-8 However, macular ganglion cell-inner plexiform layer characterization and factors associated with macular ganglion cell-inner plexiform layer thickness in healthy middle-aged adults has not been widely documented. In three population-based cohort studies, older age, female sex, higher body mass index, high alcohol consumption, lower education, myopia, and higher estimated glomerular filtration rate were associated with thinner macular ganglion cell-inner plexiform layer, ganglion cell complex, or the ganglion cell layer and inner plexiform layers separately.9-11 In a study of neurodegeneration and diabetes, macular ganglion cell-inner plexiform layer was thinner in people with diabetes than in controls.12
Inflammation, diabetes, and cardiovascular disease have been shown to be associated with neurodegeneration.13-19 The relationships of these factors to macular ganglion cell-inner plexiform layer thickness in the general population are relatively unknown. A recent report from the Rhineland Study found an association between stroke history and thinner ganglion cell layer, inner plexiform layer, and peripapillary retinal nerve fiber layer separately.10 In a study of people with diabetes, hypertension was correlated with thinner macular ganglion cell-inner plexiform layer.20 Another study found associations between ganglion cell complex thickness and blood pressure, glucose, and insulin levels.9 Other factors related to neurodegeneration which may be related to macular ganglion cell-inner plexiform layer thickness include behavioral factors like smoking, alcohol consumption, and exercise, as well as adiposity, vitamin and cholesterol levels, and neurotoxin exposure.11,21-26
The present study aims to characterize the macular ganglion cell-inner plexiform layer thickness in a cohort of middle-aged U.S. adults, and investigate factors associated with this thickness, including factors associated with other neurodegenerative measures. Understanding factors related to preclinical neurodegeneration in middle-aged community-living adults could aid in prevention of future declines in neuronal health.
METHODS
Study Population
The Beaver Dam Offspring Study is a study of aging in the adult offspring (aged 21-84 years) of the population-based Epidemiology of Hearing Loss Study participants. Recruitment details of the Beaver Dam Offspring Study have been reported.27 Briefly, baseline examinations took place in 2005-2008 with follow-up examinations occurring every five years. The macular ganglion cell-inner plexiform layer was first measured in 2015-2017, which had 1964 participants take part in examinations. The presented research conforms to the tenants of the Declaration of Helsinki and study approval was granted by the University of Wisconsin Health Sciences Institutional Review Board. All participants provided informed written consent prior to each examination.
Optical Coherence Tomography Measurement (10-year Follow-up)
An optical coherence tomography macular cube 512X128 scan, centered on the fovea, was conducted using the Cirrus 5000 HD-OCT (Carl Zeiss Meditec, Inc). This scan generates retinal thickness data from a 6 mm square acquired from 128 horizonal line scans and 512 A-scans.28 Technicians were trained and certified in standard protocols with quarterly review of a 10% random selection of scans. Participants were dark adapted prior to conducting scans on each eye. Technicians reviewed scans immediately for low signal strength (<6/10) and artefacts, including saccades and banding. Scans of insufficient quality were retaken and those with remaining quality issues were excluded. The macular ganglion cell-inner plexiform layer was measured using instrument specific automatic segmentation algorithms. Each eye’s average macular ganglion cell-inner plexiform layer thickness is calculated using 6 sectors in an elliptical annulus around the fovea.1 Right and left eye averages were used for analyses. Thin macular ganglion cell-inner plexiform layer was defined as measured thickness 1 standard deviation or more below the population mean (≤70.3μm).
Potential Risk Factors (Baseline)
As the largest number of risk factors were available at baseline, factors collected 10 years prior to the macular ganglion cell-inner plexiform layer thickness measurement were evaluated to maintain a consistent timeframe. Blood pressure, height, weight, and waist circumference were measured following standard protocols. Hypertension was defined as a measured systolic blood pressure ≥140 mmHG, a diastolic blood pressure ≥90 mmHG, or a physician hypertension diagnosis with current blood pressure medication use. Body mass index (weight (kg) divided by height squared (m2)) was calculated and classified as normal (<25), overweight (25-29), or obese (≥30).
Refractive error was measured using an autorefractor (WR-5001K; Grand-Seiko). Participants were classified based on measured spherical equivalent as having myopia (≤−1.00D), hyperopia (≥1.00D) or emmetropia (>−1.00D and <1.00D). Intra-ocular pressure was measured using a Goldman applanation Tonometer (Haag-Streit, Inc.). Retinal fundus photographs were taken (Dgi-45NM: Canon) and graded for retinal diseases, including age-related macular degeneration, diabetic retinopathy, and a large cup-disc ratio (≥0.7), by the University of Wisconsin Ocular Epidemiology Reading Center using the Wisconsin Age-Related Maculopathy Grading System.29-30 Lens images were taken using a slit-lamp microscope (DG-1; Topcon Medical Systems) and a retroillumination cataract screener (Neitz CT-S; Neitz Instruments Co Ltd). Lens images were graded for nuclear, cortical, or posterior sub-capsular cataract presence.31 Image grading results and self-reported physician diagnoses were used to determine age-related macular degeneration, diabetic retinopathy, and cataract. Participants considered to have glaucoma had a large cup-disc ratio, physician diagnosis, or a measured intra-ocular pressure>21 mmHg. Eye imaging, grading, and intra-ocular pressure measurement were repeated at the 5-year follow-up examination. Sensitivity analyses were conducted among those free of these ocular conditions at baseline and follow-up.
Mean intima-media thickness (mean of up to 12 wall thicknesses in the carotid arteries) and plaque site count (0-6 sites: common carotid, carotid bulb, internal carotid, right and left sides) were measured using carotid artery ultrasounds.32
Inflammatory and cell adhesion marker levels were measured at the Advanced Research and Diagnostic Laboratory (University of Minnesota) in serum samples obtained at baseline and at the 5-year follow-up. High-sensitivity C-reactive protein was measured with a latex-particle enhanced immunoturbidimetric assay kit (Roche Diagnostics, Indianapolis, IN) (coefficient of variation=2.6-4.3%). Interleukin-6, tumor necrosis factor-α, soluble intercellular adhesion molecule-1 and soluble vascular adhesion molecule-1 were measured using quantitative sandwich enzyme technique kits (R&D Systems, Minneapolis, MN) (interassay coefficient of variation=4.9-6.5%, 20.6% at a 2.26 pg/mL mean concentration for an in-house pooled serum control, 7.8%, and 6.1%, respectively).33 Long-term high biomarker level was defined as being in the highest tertile at both baseline and 5-year follow-up, increasing biomarker level was defined as increasing by 1 or more tertiles, and the referent group either remained stable below the highest tertile or decreased by 1 or more tertiles.
Glycated Hemoglobin (hemoglobin A1c), serum total cholesterol and high-density lipoprotein cholesterol levels were measured at the Advanced Research and Diagnostic Laboratory (University of Minnesota) in non-fasting baseline samples. Hemoglobin A1c (%) was measured using high performance liquid chromatography (coefficient of variation=1.4-1.9%). Diabetes was defined by an A1c≥6.5% or a doctor diagnosis of diabetes. Total and high-density lipoprotein cholesterol were measured on a Roche/Hitachi 911 (Roche Diagnostics, Indianapolis, IN) (coefficient of variation=1.6% and 2.9%, respectively).27 Non-high-density lipoprotein cholesterol was calculated using these values. A complete blood count, including white blood cell count was done using an automated hematology analyzer: Cell-Dyn 3200 (Abbott, Abbott Park, IL).27 Vitamin B12 was measured in baseline serum samples using a Vitamin B12 reagent/competitive immunoassay method (Roche Diagnostics, Indianapolis, IN) (coefficient of variation=4.5% - 6.3%). Vitamins D2, D3, and D3-epimer were measured at the Molecular Epidemiology and Biomarker Laboratory (University of Minnesota) in stored baseline serum samples by liquid chromatography and tandem mass spectrometry to quantitate 25-OH Vitamin D2, 25-OH Vitamin D3 and the 25-OH Vitamin D3 epimer (coefficient of variation=3.9-4.8%).34 Total vitamin D was calculated using these values. Cadmium and lead levels were measured by the Wisconsin State Laboratory of Hygiene (University of Wisconsin) in baseline whole blood samples using inductively coupled plasma mass spectrometry (lower limit of detection: 0.21 μg/L and 0.20 μg/dL, respectively).35
Education (<16 versus ≥16 years), current smoking, alcohol consumption in the previous year (grams of ethanol per week), exercise (at least once per week long enough to work up a sweat), history of head injury (ever), an extensive medical history including cardiovascular disease, and statin use were assessed by interview.
Statistical Analyses
Analyses were completed with the SAS System version 9.4 (SAS Institute, Inc., Gary, NC). Population mean macular ganglion cell-inner plexiform layer thickness was calculated overall and stratified by age and sex. Age- and sex- adjusted generalized estimating equation linear regression models were used to test baseline factors associations with macular ganglion cell-inner plexiform layer thickness. The generalized estimating equation approach uses information from both eyes in a single model adjusting for the correlation between eyes. Estimates are reported as difference in macular ganglion cell-inner plexiform layer thickness by factor with 95% confidence intervals (CI). Factors suggestive of association (P<0.20) were considered for multivariable modeling. Statistical significance was defined by a p-value<0.05 or a 95%CI not containing 1.00 for odds ratios. A final reduced multivariable model was constructed using a manual backwards elimination approach. Age and sex were retained in the models regardless of association. Additional generalized estimating equation analyses were conducted with the thin macular ganglion cell-inner plexiform layer binary outcome. Estimates are reported as odds ratios with 95% CI for the odds of thin macular ganglion cell-inner plexiform layer in either eye. A final reduced multivariable model was constructed following the same method described for the continuous outcome. Sensitivity analyses were conducted for final models removing anyone with age-related macular degeneration, diabetic retinopathy, glaucoma, or cataract at baseline or 5-year follow-up to ensure ocular morbidities were not affecting results. An additional analysis was conducted using available risk factor data collected concurrent to the macular ganglion cell-inner plexiform layer measurement to investigate whether changes in status of these variables affected results, for example if a participant reported doctor diagnosed diabetes at the 10-year follow-up examination, but did not have such a diagnosis at baseline. Although all investigated factors were measured prior to assessment of mGCIPL, the results of the present study are cross-sectional. As such all reported estimates are associative in nature and no causal inferences can be inferred in the present study.
RESULTS
Of the 1964 participants examined at the 10-year follow-up, 74 were excluded due to missing OCT data and 42 were excluded due to not having a baseline examination. Of the remaining 1848 participants, 1820 had both eyes scanned, 16 had right eye scans only, and 12 left only. Scans with low signal strength, poor alignment, or artefacts were excluded from analysis (N=28 right eyes, N=29 left eyes) resulting in 10 participants without optical coherence tomography data for either eye. The final analytic set had 1838 participants (1808 right eyes and 1803 left eyes). Participants included in these analyses had a mean baseline age of 48.9 years (standard deviation=9.3) and 986 (54.4%) were women. Average age at macular ganglion cell-inner plexiform layer measurement was 58.5 years (standard deviation=9.3). The mean macular ganglion cell-inner plexiform layer thickness was 78.4 μm (standard deviation=8.1) in the right eye and 78.1 μm (standard deviation=8.5) in the left. Measurements were strongly correlated between the two eyes (correlation coefficient=0.76).
Continuous Macular Ganglion Cell-inner Plexiform Layer Thickness
The mean macular ganglion cell-inner plexiform layer thickness decreased with age (sex-adjusted estimate: β=−1.15 μm per 5 years, 95% CI: −1.34 to −0.95) but did not differ by sex (age-adjusted estimate: β=0.03 μm, 95% CI: −0.67 to 0.73) (Figure 1). Mean macular ganglion cell-inner plexiform layer thickness by refractive status, alcohol consumption, and interleukin-6 level is displayed in Figures 2-4. Graphical depiction of mean macular ganglion cell-inner plexiform layer thickness by other potential risk factors is displayed in the Appendix figures. In age- and sex-adjusted models, larger waist circumference, diabetes, hypertension, myopia, glaucoma, higher baseline and long-term high high-sensitivity C-reactive protein and soluble vascular adhesion molecule-1, higher baseline interleukin-6, and not consuming any alcohol were associated with thinner macular ganglion cell-inner plexiform layer, while exercising was associated with thicker macular ganglion cell-inner plexiform layer (Table 1).
Figure 1.
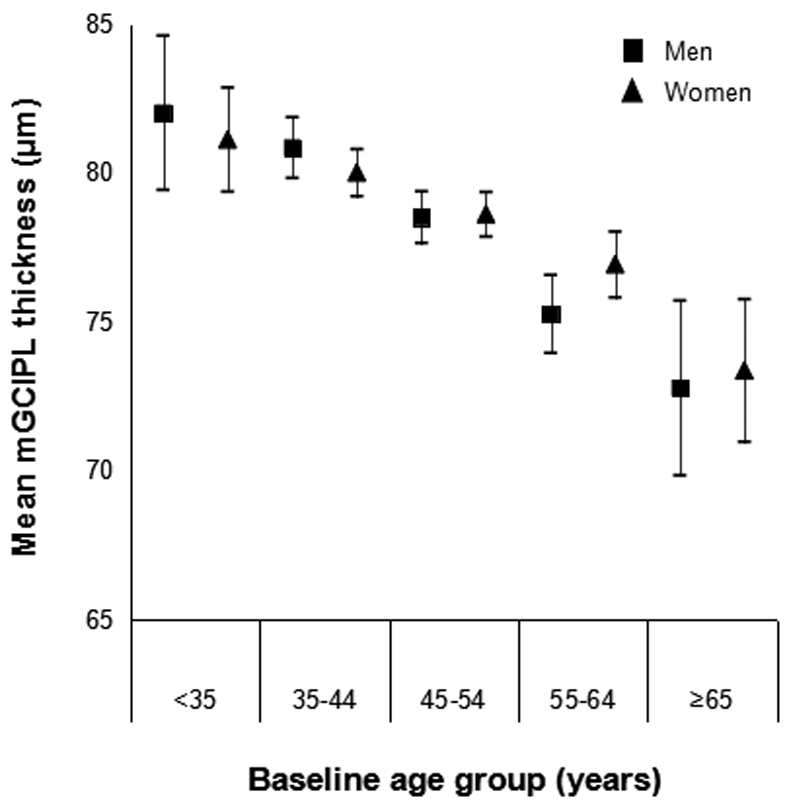
Mean macular ganglion cell-inner plexiform layer (mGCIPL) thickness and 95% confidence intervals stratified by age group and sex in the Beaver Dam Offspring Study.
Figure 2.
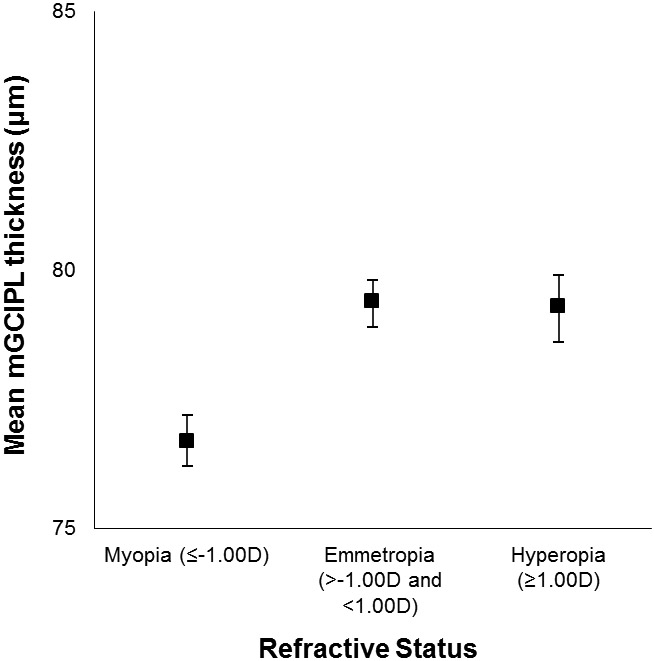
Mean macular ganglion cell-inner plexiform layer (mGCIPL) thickness and 95% confidence intervals stratified refractive status in the Beaver Dam Offspring Study.
Figure 4.
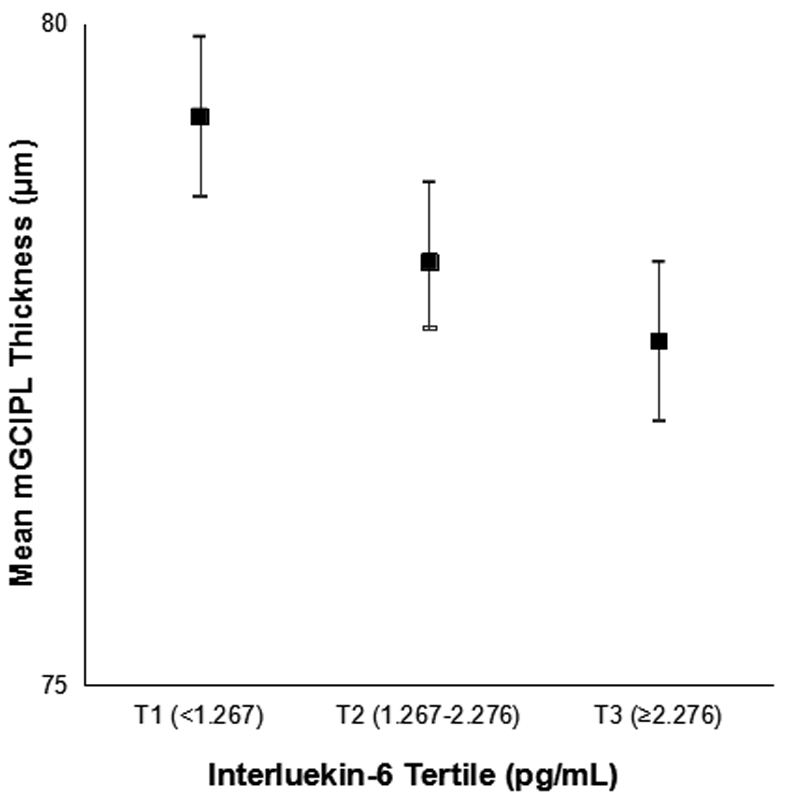
Mean macular ganglion cell-inner plexiform layer (mGCIPL) thickness and 95% confidence intervals stratified by interleukin-6 level in the Beaver Dam Offspring Study.
Table 1.
Macular ganglion cell-inner plexiform layer (mGCIPL) thickness (μm) and frequency of thin mGCIPL by baseline characteristics of Beaver Dam Offspring Study participants.
| Overall N |
mGCIPL thickness (μm) | Thin mGCIPL (≤70.3 μm) | |||
|---|---|---|---|---|---|
| Mean (SD)a | Age-Sex Adjusted Estimate β (95% CI)b |
N (%)a | Age-Sex Adjusted Odds Ratio OR (95% CI)b |
||
| Men | 821 | 78.3 (8.6) | 0.03 (−0.67 to 0.73) | 125 (15.1) | 1.14 (0.89-1.45) |
| Women | 986 | 78.5 (7.6) | Reference | 124 (12.7) | Reference |
| Age (years) | |||||
| <35 | 101 | 81.5 (7.4) | 10 (9.9) | ||
| 35-44 | 500 | 80.4 (7.2) | 33 (6.6) | ||
| 45-54 | 713 | 78.6 (7.7) | Per 5 years | 85 (11.9) | Per 5 years |
| 55-64 | 398 | 76.1 (8.6) | −1.15 (−1.34 to −0.95) | 83 (20.9) | 1.39 (1.29-1.49) |
| 65+ | 95 | 73.1 (8.9) | 38 (40.0) | ||
| Education (years) | |||||
| < 16 | 1178 | 78.6 (7.9) | Reference | 157 (13.3) | Reference |
| 16+ | 619 | 78.1 (8.5) | −0.57 (−1.30 to 0.16) | 91 (14.7) | 1.06 (0.82-1.38) |
| Current Smoker | |||||
| No | 1523 | 78.3 (8.4) | Reference | 217 (14.3) | Reference |
| Yes | 278 | 79.3 (7.5) | 0.24 (−0.68 to 1.16) | 32 (11.5) | 0.94 (0.66-1.35) |
| Alcohol (gm ethanol/week) | |||||
| None | 176 | 76.9 (10.2) | −1.72 (−3.15 to −0.29) | 36 (20.5) | 1.63 (1.11-2.38) |
| 0-14 | 768 | 78.5 (8.0) | Reference | 102 (13.3) | Reference |
| >14-74 | 438 | 79.2 (7.3) | 0.41 (−0.42 to 1.25) | 48 (11.0) | 0.94 (0.67-1.31) |
| >74-140 | 204 | 78.3 (8.2) | −0.55 (−1.69 to 0.59) | 26 (12.8) | 1.00 (0.64-1.55) |
| >140 | 216 | 77.6 (7.9) | −1.18 (−2.37 to 0.01) | 37 (17.1) | 1.30 (0.85-1.97) |
| Exercise 1/week | |||||
| No | 707 | 77.5 (8.4) | Reference | 114 (16.1) | Reference |
| Yes | 1095 | 79.0 (7.8) | 1.09 (0.37-1.81) | 135 (12.3) | 0.82 (0.64-1.06) |
| Waist Circumference (cm) | |||||
| T1 (≤92) | 596 | 79.3 (7.6) | 60 (10.1) | ||
| T2 (93-105) | 603 | 78.2 (8.3) | Per 5 cm increase | 93 (15.4) | Per 5 cm increase |
| T3 (>105) | 556 | 77.6 (8.5) | −0.13 (−0.25 to −0.01) | 92 (16.6) | 1.04 (1.00-1.08) |
| BMI (kg/m2) | |||||
| Normal (<25) | 363 | 79.7 (7.4) | Reference | 35 (9.6) | Reference |
| Overweight (25 to <30) | 604 | 78.0 (8.4) | −0.94 (−1.92 to 0.04) | 93 (15.4) | 1.27 (0.86-1.89) |
| Obese (≥30) | 792 | 78.1 (8.1) | −0.76 (−1.69 to 0.17) | 117 (14.8) | 1.17 (0.80-1.72) |
| Hypertension | |||||
| No | 1159 | 79.1 (7.9) | Reference | 132 (11.4) | Reference |
| Yes | 617 | 77.0 (8.4) | −0.91 (−1.72 to −0.09) | 116 (18.8) | 1.21 (0.92-1.59) |
| CVD History | |||||
| No | 1681 | 78.5 (8.1) | Reference | 225 (13.4) | Reference |
| Yes | 115 | 77.1 (7.8) | −0.91 (−2.38 to 0.56) | 21 (18.3) | 1.16 (0.76-1.79) |
| Mean IMT (mm) | |||||
| <0.79 | 1544 | 78.6 (8.0) | Per 0.1mm increase | 210 (13.6) | Reference |
| ≥0.79 | 199 | 76.2 (8.8) | −0.21 (−0.55 to 0.13) | 35 (17.6) | 0.84 (0.58-1.22) |
| Any Plaque | |||||
| No | 1366 | 78.7 (8.2) | Reference | 179 (13.1) | Reference |
| Yes | 375 | 76.9 (7.8) | −0.52 (−1.47 to 0.43) | 66 (17.6) | 0.97 (0.72-1.31) |
| Plaque sites (#) | |||||
| 0 | 1303 | 78.8 (8.2) | Reference | 165 (12.7) | Reference |
| 1-3 | 342 | 77.0 (7.8) | −0.70 (−1.69 to 0.29) | 61 (17.8) | 1.05 (0.76-1.43) |
| 4-6 | 27 | 75.6 (6.9) | −0.66 (−3.01 to 1.70) | 4 (14.8) | 0.73 (0.33-1.62) |
| Diabetes | |||||
| No | 1715 | 78.6 (7.9) | Reference | 222 (12.9) | Reference |
| Yes | 83 | 74.9 (10.0) | −2.70 (−4.76 to −0.64) | 24 (28.9) | 1.84 (1.16-2.92) |
| Hemoglobin A1C (%) | |||||
| <6.5 | 1675 | 78.4 (8.1) | Reference | 225 (13.4) | Reference |
| ≥6.5 | 54 | 76.5 (9.3) | −1.75 (−4.49 to 0.99) | 14 (25.9) | 1.53 (0.86-2.71) |
| Non-HDL cholesterol <150 mg/dL | |||||
| No | 922 | 78.3 (8.3) | Per 20 mg/dL | 132 (14.3) | Per 20 mg/dL |
| Yes | 815 | 78.5 (7.9) | 0.04 (−0.15 to 0.23) | 112 (13.7) | 0.98 (0.92-1.05) |
| Vitamin B12 <247 pg/mL | |||||
| No | 1636 | 78.4 (8.2) | Reference | 230 (14.1) | Reference |
| Yes | 30 | 76.5 (8.5) | −1.70 (−3.91 to 0.50) | 6 (20.0) | 1.49 (0.71-3.14) |
| Vitamin D3, Q1 (<19.29 ng/mL) | |||||
| No | 1317 | 78.4 (8.1) | Reference | 177 (13.4) | Reference |
| Yes | 338 | 78.0 (8.4) | −0.64 (−1.57 to 0.30) | 57 (16.9) | 1.17 (0.86-1.59) |
| Vitamin D total <20 ng/mL | |||||
| No | 1458 | 78.4 (8.2) | Reference | 203 (13.9) | Reference |
| Yes | 197 | 78.3 (8.0) | −0.56 (−1.70 to 0.58) | 31 (15.7) | 1.08 (0.73-1.59) |
| hsCRP (mg/L) | |||||
| <1.0 | 676 | 78.6 (8.0) | 91 (13.5) | ||
| 1.0-3.0 | 645 | 78.4 (8.1) | lnCRP | 83 (12.9) | lnCRP |
| ≥3.0 | 381 | 77.7 (8.6) | −0.41 (−0.74 to −0.07) | 68 (17.9) | 1.18 (1.04-1.34) |
| IL-6 (pg/mL) | |||||
| T1 (<1.267) | 540 | 79.3 (7.9) | 56 (10.4) | ||
| T2 (1.267-2.276) | 597 | 78.2 (8.3) | lnIL-6 | 86 (14.4) | lnIL-6 |
| T3 (≥2.276) | 550 | 77.6 (8.2) | −0.94 (−1.50 to −0.37) | 96 (17.5) | 1.43 (1.17-1.73) |
| sVCAM −1 (ng/mL) | |||||
| T1 (≤497.51) | 596 | 78.9 (7.7) | 76 (12.8) | ||
| T2 (497.52-635.40) | 573 | 78.5 (8.3) | lnVCAM (unit=0.25) | 79 (13.8) | lnVCAM (unit=0.25) |
| T3 (>635.40) | 533 | 77.5 (8.4) | −0.34 (−0.67 to −0.02) | 87 (16.3) | 1.06 (0.95-1.18) |
| TNF- α (pg/mL) | |||||
| T1 (≤0.35) | 585 | 79.0 (7.3) | 68 (11.6) | ||
| T2 (0.36-0.61) | 569 | 78.0 (8.2) | lnTNF- α | 89 (15.6) | lnTNF- α |
| T3 (>0.61) | 548 | 78.0 (8.9) | −0.36 (−0.85 to 0.13) | 85 (15.5) | 1.04 (0.86-1.24) |
| sICAM-1 (ng/mL) | |||||
| T1 (<190.1) | 567 | 78.9 (8.0) | 71 (12.5) | ||
| T2 (190.1-238.5) | 591 | 78.1 (7.9) | lnICAM (unit=0.25) | 86 (14.6) | lnICAM (unit=0.25) |
| T3 (≥238.5) | 534 | 78.1 (8.5) | −0.16 (−0.46 to 0.13) | 81 (15.2) | 1.07 (0.96-1.18) |
| Long Term hsCRP | |||||
| Reference | 978 | 78.6 (7.8) | Reference | 121 (13.4) | Reference |
| Increasing | 349 | 78.4 (8.0) | −0.42 (−1.31 to 0.48) | 49 (14.0) | 1.35 (0.97-1.88) |
| High-High | 232 | 77.6 (8.7) | −1.36 (−2.48 to −0.25) | 45 (19.4) | 1.97 (1.38-2.82) |
| Long Term IL-6 | |||||
| Reference | 1075 | 78.7 (7.9) | Reference | 135 (12.6) | Reference |
| Increasing | 203 | 78.6 (8.5) | 0.38 (−0.73 to 1.50) | 28 (13.8) | 1.00 (0.66-1.52) |
| High-High | 266 | 77.7 (7.8) | −0.98 (−2.01 to 0.04) | 48 (18.1) | 1.54 (1.10-2.15) |
| Long Term sICAM | |||||
| Reference | 1145 | 78.6 (8.3) | Reference | 156 (13.6) | Reference |
| Increasing | 164 | 78.2 (6.7) | −0.08 (−1.09 to 0.94) | 19 (11.6) | 0.83 (0.52-1.31) |
| High-High | 240 | 78.4 (7.1) | −0.45 (−1.43 to 0.52) | 36 (15.0) | 1.15 (0.81-1.63) |
| Long Term sVCAM | |||||
| Reference | 774 | 79.0 (8.0) | Reference | 99 (12.8) | Reference |
| Increasing | 410 | 78.7 (7.9) | −0.23 (−1.11 to 0.65) | 52 (12.7) | 0.91 (0.65-1.27) |
| High-High | 375 | 77.1 (8.0) | −1.14 (−2.03 to −0.25) | 64 (17.1) | 1.02 (0.75-1.40) |
| WBC (k/μL) | |||||
| T1 (≤6.3) | 618 | 78.7 (8.0) | Per 1 k/uL | 91 (14.7) | Per 1 k/uL |
| T2 (6.4-7.8) | 560 | 78.3 (8.0) | −0.18 (−0.35 to 0.002) | 68 (12.1) | 1.03 (0.96-1.10) |
| T3 (>7.8) | 562 | 78.1 (8.4) | 84 (15.0) | ||
| Refractive Status (diopters) | |||||
| Myopia (≤-1.00) | 703 | 76.6 (8.1) | −2.75 (−3.33, −2.17) | 135 (19.2) | 2.52 (2.01-3.16) |
| Emmetropia (>-1.00 and <1.00) | 853 | 79.9 (7.5) | Reference | 81 (9.5) | Reference |
| Hyperopia (≥1.00) | 206 | 78.2 (9.2) | 0.44 (−0.42 to 1.29) | 29 (14.1) | 0.99 (0.75-1.30) |
| Any AMD | |||||
| No | 1616 | 78.5 (8.0) | Reference | 220 (13.6) | Reference |
| Yes | 48 | 77.4 (7.5) | 0.62 (−0.86 to 2.11) | 7 (14.6) | 0.91 (0.52-1.61) |
| Any Cataract | |||||
| No | 1388 | 78.9 (7.3) | Reference | 157 (11.3) | Reference |
| Yes | 130 | 75.0 (11.7) | −0.77 (−2.00 to 0.45) | 36 (27.7) | 1.35 (1.01-1.79) |
| Diabetic Retinopathy | |||||
| No | 1597 | 78.4 (8.0) | Reference | 217 (13.6) | Reference |
| Yes | 90 | 77.8 (7.7) | 0.07 (−0.63 to 0.77) | 14 (15.6) | 1.12 (0.86-1.46) |
| Glaucoma | |||||
| No | 1644 | 78.7 (8.0) | Reference | 210 (12.8) | Reference |
| Yes | 99 | 73.9 (8.7) | −1.93 (−2.94 to −0.92) | 32 (32.3) | 1.43 (0.97-2.11) |
| History of Head Injury | |||||
| No | 1309 | 78.4 (8.3) | Reference | 176 (13.5) | Reference |
| Yes | 496 | 78.5 (7.5) | −0.27 (−1.03 to 0.50) | 73 (14.7) | 1.13 (0.85-1.49) |
| Cadmium Q5 (≥0.53 μg/L ) | |||||
| No | 1329 | 78.2 (8.2) | Reference | 192 (14.5) | Reference |
| Yes | 301 | 79.0 (7.4) | 0.60 (−0.28 to 1.49) | 39 (13.0) | 0.92 (0.66-1.29) |
| Lead Q5 (≥2.07 μg/dL) | |||||
| No | 1312 | 78.5 (8.2) | Reference | 189 (14.4) | Reference |
| Yes | 318 | 77.9 (7.5) | 0.44 (−0.44 to 1.32) | 42 (13.2) | 0.61 (0.43-0.86) |
| Statin Use | |||||
| No | 1511 | 78.7 (8.2) | Reference | 199 (13.2) | Reference |
| Yes | 261 | 76.8 (7.7) | −0.61 (−1.64 to 0.42) | 48 (18.4) | 1.04 (0.75-1.43) |
SD=standard deviation, CI=confidence interval, BMI=body mass index, CVD=cardiovascular disease, IMT=intima-media thickness, HDL=high-density lipoprotein, Q=quintile, hsCRP=high-sensitivity C-reactive protein, IL-6=interleukin-6, T=tertile, sVCAM=soluble vascular adhesion molecule-1, TNF-α=tumor necrosis factor-α, sICAM-1=soluble intercellular adhesion molecule-1, WBC=white blood cell count, AMD=age-related macular degeneration
Means and percentages presented are for right eye.
Models incorporate both eyes using generalized estimating equations
In the final multivariable model, older baseline age (β=−1.07 μm per 5 years; 95% CI: −1.28 to −0.86), high alcohol consumption (>140 gm of ethanol/week versus 1-14 gm/week: β=−1.44 μm; 95% CI: −2.72 to −0.16), higher interleukin-6 (natural log interleukin-6: β=−0.56 μm; 95% CI: −1.11 to −0.01), myopia (β=−2.55 μm; 95% CI: −3.17 to −1.94), and glaucoma (β=−1.74 μm, 95% CI: −2.77 to −0.70) were associated with thinner macular ganglion cell-inner plexiform layer (Table 2). The association between macular ganglion cell-inner plexiform layer thickness and diabetes (β=−2.10 μm; 95% CI: −4.25 to 0.05) and long-term high soluble vascular adhesion molecule-1 (β=−0.85 μm; 95% CI: −1.72 to 0.03) were of borderline statistical significance in this model. As diabetes exacerbates inflammation, and interleukin-6 levels were higher in participants with diabetes than in those without (natural log interleukin-6 =1.06, natural log interleukin-6 =0.55, respectively; p<0.0001), an additional model was run removing interleukin-6 to investigate possible collinearity. In this model, the association between diabetes and macular ganglion cell-inner plexiform layer thickness was statistically significant (−2.36 μm; 95% CI: −4.49 to −0.23), while other covariate estimates remained virtually unchanged.
Table 2.
Multivariable (MV) models of the association between baseline factors and macular ganglion cell-inner plexiform layer (mGCIPL) thickness.
| mGCIPL thickness | Thin mGCIPL | |||
|---|---|---|---|---|
| MV model | Sensitivity Analysisa | MV model | Sensitivity Analysisa | |
| β (95% CI) | OR (95% CI) | |||
| Age (per 5 years) | −1.07 (−1.28 to −0.86) | −0.95 (−1.17 to −0.74) | 1.38 (1.24-1.53) | 1.38 (1.24-1.54) |
| Male sex | −0.06 (−0.82 to 0.71) | 0.09 (−0.70 to 0.89) | 1.30 (0.93-1.81) | 1.24 (0.87-1.76) |
| Alcohol consumption (g/week) | ||||
| 0 | −0.87 (−2.25 to 0.52) | −0.61 (−2.02 to 0.81) | 1.40 (0.89-2.20) | 1.87 (1.14-3.07) |
| 15-74 | 0.10 (−0.76 to 0.97) | −0.47 (−1.36 to 0.43) | 1.05 (0.70-1.58) | 1.34 (0.88-2.03) |
| 75-140 | −1.09 (−2.29 to 0.11) | −1.63 (−2.92 to −0.34) | 0.93 (0.54-1.60) | 1.41 (0.81-2.46) |
| >140 | −1.44 (−2.72 to −0.16) | −1.69 (−3.01 to −0.38) | 1.08 (0.64-1.81) | 1.53 (0.90-2.60) |
| Diabetes | −2.10 (−4.25 to 0.05) | −2.22 (−4.92 to 0.48) | 1.89 (1.09-3.27) | 1.81 (0.90-3.63) |
| Myopia | −2.55 (−3.17 to −1.94) | −2.48 (−3.15 to −1.80) | 2.11 (1.63-2.73) | 2.55 (1.89-3.44) |
| Hyperopia | −0.07 (−1.02 to 0.89) | −0.34 (−1.46 to 0.77) | 0.90 (0.63-1.28) | 0.95 (0.63-1.43) |
| Cataract | 1.21 (0.89-1.66) | |||
| Glaucoma | −1.74 (−2.77 to −0.70) | 1.49 (0.98-2.28) | ||
| IL-6 (natural log) | −0.56 (−1.11 to −0.01) | −0.73 (−1.32 to −0.13) | 1.24 (0.97-1.59) | 1.32 (1.01-1.73) |
| Long-term sVCAM | ||||
| Increasingb | −0.21 (−1.08 to 0.65) | −0.22 (−1.10 to 0.66) | ||
| Highc | −0.85 (−1.72 to 0.03) | −0.78 (−1.67 to 0.11) | ||
| Long-term hsCRP | ||||
| Increasingb | 1.46 (1.01-2.11) | 1.31 (0.88-1.93) | ||
| Highc | 1.74 (1.14-2.65) | 1.66 (1.06-2.56) | ||
CI=confidence interval, OR=Odds Ratio, IL-6=interleukin-6, sVCAM=soluble vascular adhesion, hsCRP=high-sensitivity C-reactive protein
Excluding those with age-related macular degeneration, diabetic retinopathy, glaucoma, or cataract
Biomarker level increased by 1 or more tertiles from baseline examination to the 5-year follow-up examination
Biomarker level in highest tertile at baseline examination and at 5-year follow-up examination
In the sensitivity analysis removing those with ocular morbidities results were similar. (Table 2) Older age, high alcohol consumption, higher interleukin-6 levels, and myopia remained significantly associated with thinner macular ganglion cell-inner plexiform layer. In this model, participants who consumed 75-140 gm of ethanol per week also had thinner macular ganglion cell-inner plexiform layer (−1.63 μm; 95% CI: −2.92 to −0.34). Analyses using covariates available at the 10-year follow-up examination had similar results though current alcohol consumption was not associated with macular ganglion cell-inner plexiform layer thickness.
Thin Macular Ganglion Cell-inner Plexiform Layer (≤70.3 μm)
Of the 1838 participants, 321 (17.5%) had at least 1 eye with a thin macular ganglion cell-inner plexiform layer, of which 189 (58.9%) had a thin macular ganglion cell-inner plexiform layer in both eyes, 60 (18.7%) in the right eye only, and 72 (22.4%) in the left eye only. Odds of thin macular ganglion cell-inner plexiform layer increased with age, 39% per 5 years (odds ratio=1.39, 95% CI: 1.29-1.49), but did not differ by sex (odds ratio=1.14, 95% CI: 0.89-1.45). In age- and sex-adjusted models, larger waist circumference, diabetes, myopia, cataract, higher baseline and long-term high high-sensitivity C-reactive protein and interleukin-6, and no alcohol consumption in the previous year were associated with increased odds of thin macular ganglion cell-inner plexiform layer, while high baseline blood lead level was associated decreased odds of thin macular ganglion cell-inner plexiform layer (Table 1).
In the final multivariable model, older age (per 5 years: odds ratio=1.40, 95% CI: 1.26-1.56), diabetes (odds ratio=1.83, 95% CI: 1.04-3.21), myopia (odds ratio=2.12, 95% CI: 1.64-2.75), and long-term high high-sensitivity C-reactive protein (odds ratio=1.74, 95% CI: 1.14-2.65) were associated with increased odds of thin macular ganglion cell-inner plexiform layer (Table 2).
In a sensitivity analysis removing participants with ocular co-morbidities, results were similar. The association between not consuming alcohol in the previous year and thin macular ganglion cell-inner plexiform layer became significant (odds ratio=1.94, 95% CI: 1.17-3.22), while the association with diabetes was no longer significant though the point estimate was virtually unchanged. Analyses using covariates available at the 10-year follow-up examination had similar results though current alcohol consumption was not associated with increased odds of thin macular ganglion cell-inner plexiform layer.
DISCUSSION
Understanding the macular ganglion cell-inner plexiform layer distribution and factors associated with macular ganglion cell-inner plexiform layer thickness in a relatively healthy middle-aged adult cohort is important to its potential application as a quick non-invasive assessment of preclinical neurodegeneration and aids in finding potential prevention strategies for neurodegenerative disease. We reported this distribution in the Beaver Dam Offspring Study. Previous studies have reported varying mean thickness of the macular ganglion cell-inner plexiform layer. The thickness in the present study was similar, though slightly lower than some recent studies, including the Singapore Epidemiology of Eye Diseases Study (80.4 μm), and studies in a Chinese (80.8 μm) and a United States based Vietnamese (82.5 μm) population.36-38 The thickness in the present study was nearly identical to an Indian population in the SEED study (78.0), to healthy controls in recent studies of glaucoma (77.8 μm) and diabetic retinopathy (78 μm in right eye), and was slightly higher than a recent UK Biobank Study (75.3 μm), and a recent Rotterdam Study investigation (70.4 μm) though their population was older than the BOSS population.39-42 The observed differences in mean macular ganglion cell-inner plexiform layer thickness may be due to a variety of factors including age of the cohort, racial or ethnic background of the cohort, whether the cohort is clinic or population-based, and differences due to the instrumentation used for measurement.43 Careful consideration of these potential sources for differences should be exercised when comparing means across populations.
In the present study, older age, consuming high alcohol levels, higher inflammation levels, myopia, and glaucoma were independently associated with thinner macular ganglion cell-inner plexiform layer on a continuous scale. We additionally characterized thin macular ganglion cell-inner plexiform layer in this population. Older age, long-term high inflammation, diabetes, and myopia were associated with increased odds of thin macular ganglion cell-inner plexiform layer.
Consistent with previous studies, participants in older age groups had progressively thinner macular ganglion cell-inner plexiform layer.9-11,44 The effect of age in the BOSS (approximately 0.21 μm thinner per year of age) was slightly larger than some previous studies, for example 0.14 μm per year in the Twins UK Study and 0.15 μm per year in the UK Biobank Study, but similar to that conducted in a Chinese population, 0.18 μm per year.9,11,37 The differences in the age effect by study could be due to a number of factors including age distribution, racial and ethnic distribution, and instrumentation differences. However, across studies, older age is associated with thinner macular ganglion cell-inner plexiform layer. As neurodegeneration progresses during aging, seeing this reduction in a neuronal layer in the eye is to be expected. A previous study reported that men had a thinner macular ganglion cell-inner plexiform layer than women. 11 This difference was not observed in the Beaver Dam Offspring Study cohort.
A number of factors were associated with the macular ganglion cell-inner plexiform layer thickness in age- and sex-adjusted models which did not make the final multivariable models. These factors include those associated with thinner macular ganglion cell-inner plexiform layer, waist circumference and hypertension, and those associated with thicker macular ganglion-cell inner plexiform layer indicating a potential protective effect, exercise and higher blood lead levels. While the observed minimally adjusted associations may warrant further investigation, these factors did not qualify for the final multivariable model indicating these may have been spurious associations impacted by confounding.
Higher inflammation at baseline, and long-term high inflammation were associated with thinner macular ganglion cell-inner plexiform layer in the current study. A 50% increase in interleukin-6 level was associated with 0.28 μm thinner macular ganglion cell-inner plexiform layer and having long-term increasing or high C-reactive protein was associated with a 46% and 74% increase in odds of thin macular ganglion cell-inner plexiform layer respectively, independent of other factors. This suggests acute and chronic inflammation may impact the macular ganglion cell-inner plexiform layer structure. A previous study proposed that inflammatory mechanisms do not have a role in the pathophysiologic processes in the neural retina because they did not find an association with smoking.11 In our study, smoking was not associated with macular ganglion cell-inner plexiform layer thickness, though interleukin-6 and high-sensitivity C-reactive protein levels were, indicating inflammation could influence neurodegeneration. The relationship between inflammation and macular ganglion cell-inner plexiform layer thickness should be further explored as it provides a potential point for prevention or intervention in neurodegenerative outcomes.
Metabolic dysfunction, including diabetes, has wide reaching systemic effects. Previous studies have shown associations between diabetes and structural changes to the nervous system.16-17 The macular ganglion cell-inner plexiform layer was thinner in people with diabetes than in healthy controls.12 In our study, diabetes was independently associated with an 83% increase in odds of thin macular ganglion cell-inner plexiform layer, and a 2.10 μm thinner macular ganglion cell-inner plexiform layer, though the latter finding was not statistically significant. However, in additional modeling removing interleukin-6, diabetes was significantly associated with thinner macular ganglion cell-inner plexiform layer (−2.36 μm), suggesting collinearity between diabetes and systemic inflammation. Diabetes increases inflammation and participants with diabetes in the current study had higher interleukin-6 levels. Diabetes induced inflammation, as well as the metabolic dysregulation of the disease might contribute to the neurodegenerative process.
In age- and sex-adjusted analyses, abstinence from alcohol was associated with thinner macular ganglion cell-inner plexiform layer and higher odds of having a thin macular ganglion cell-inner plexiform layer when compared to those who consumed a low amount (0-14 gm/week). This could result from uncontrolled confounding as those who abstained from alcohol consumption could have had other health conditions. This could explain why this association was not present in the full multivariable model. Instead high alcohol consumption was associated with thinner macular ganglion cell-inner plexiform layer. Those who consumed >140 gm of ethanol per week had a macular ganglion cell-inner plexiform layer 1.44 μm thinner than non-abstainers who consumed 0-14 grams of ethanol per week. Excessive alcohol consumption affects cognition, leads to alterations in brain structure, disrupts neurocircuitry, and reduces brain volumes.22,45-46 In previous studies, alcohol consumption was associated with peripapillary retinal nerve fiber layer thickness and high consumption was associated with macular ganglion cell-inner plexiform layer thickness.11,21,47 Our findings of an association between baseline alcohol consumption and macular ganglion cell-inner plexiform layer thickness support the hypothesis that alcohol’s negative effects on neuronal health and structure may extend to the eye’s macular region, specifically the macular ganglion cell-inner plexiform layer. This finding adds evidence that changes in lifestyle, including reducing alcohol intake, could have a positive impact on long-term neural outcomes. However, concurrent alcohol consumption was not associated with macular ganglion cell-inner plexiform layer thickness in this study. This could imply that the observed association with baseline alcohol consumption was spurious, or that past alcohol consumption is more closely related to macular ganglion cell-inner plexiform layer thickness than current consumption. Further study is needed to fully ascertain the relationship of alcohol consumption and macular ganglion cell-inner plexiform layer thickness.
Consistent with previous studies, myopia was associated with thinner macular ganglion cell-inner plexiform layer. It remains unknown if this is due to an actual difference in anatomy, as longer axial length could lead to thinner macular ganglion cell-inner plexiform layer, or if this is solely due to magnification effects.9,11 As suggested by previous studies and indicated by the current results, future studies should control for refractive status. In this study, glaucoma was associated with thinner macular ganglion cell-inner plexiform layer. As glaucoma is an optic neurodegenerative disease, this is an expected finding.2 Previous studies have indicated the potential usefulness of optical coherence tomography in glaucoma diagnosis and identifying early disease stages.4,48
In the current study, cardiovascular disease history and mean intima-media thickness were not associated with macular ganglion cell-inner plexiform layer thickness. A previous study found an association between a stroke history and retinal layer thickness, while another observed an association between hypertension and macular ganglion cell-inner plexiform layer thickness among people with diabetes.10,20 Few Beaver Dam Offspring Study participants had a history of cerebrovascular events, so the present study was not powered to evaluate stroke. An age- and sex-adjusted association between hypertension and macular ganglion cell-inner plexiform layer thickness was observed in the present study. Future studies should investigate the relationship between vascular health and macular ganglion cell-inner plexiform layer.
While a number of factors associated with the macular ganglion cell-inner plexiform layer were identified in the present study, the strength of associations of many of these factors were modest or small. The largest effect observed in the continuous measure was for participants with myopia, −2.55 μm, followed by that for diabetes −2.10 μm, glaucoma −1.74 μm, and >140 grams of ethanol consumed per week, −1.44 μm. These differences are small though they are larger than the difference for a 5-year increase in age, −1.07 μm. Although these results are cross-sectional this may indicate the importance of these factors in neurodegeneration. The effects of inflammation in the present study are small for the continuous outcome, <1 μm, however, in the binary outcome, long-term high C-reactive protein was associated with a 74% increase in odds of thin macular ganglion cell-inner plexiform layer, nearly double the effect of 5-years of aging, 38%, while increasing C-reactive protein was associated with a 46% increase in odds. This points to the potential importance of inflammation in neurodegenerative processes as well, though longitudinal study is necessary to confirm this finding.
This study’s strengths include a well characterized cohort, a large sample size, and standardized measurement of key variables. Few studies have characterized the macular ganglion cell-inner plexiform layer thickness in the general population and identified factors associated with this thickness. To our knowledge this is the first study to do so in a middle-aged U.S. adult population. A limitation of this study is the population is racially and ethnically homogenous. As a result, these findings may not be generalizable to other groups, and studies should be conducted addressing this limitation. Our findings are cross-sectional in nature and as a result no causal inferences can be made.
CONCLUSIONS
Older age, high alcohol consumption, inflammation, diabetes, myopia, and glaucoma were independently associated with macular ganglion cell-inner plexiform layer thickness in this cross-sectional study of relatively healthy middle-aged U.S. adults. Inflammation, metabolic dysfunction, and alcohol consumption may be important to neural retinal structure and health and neuronal health system wide. These factors should be studied longitudinally to determine their role in neurodegenerative processes and to determine if they provide a potential avenue for prevention and intervention.
Figure 3.
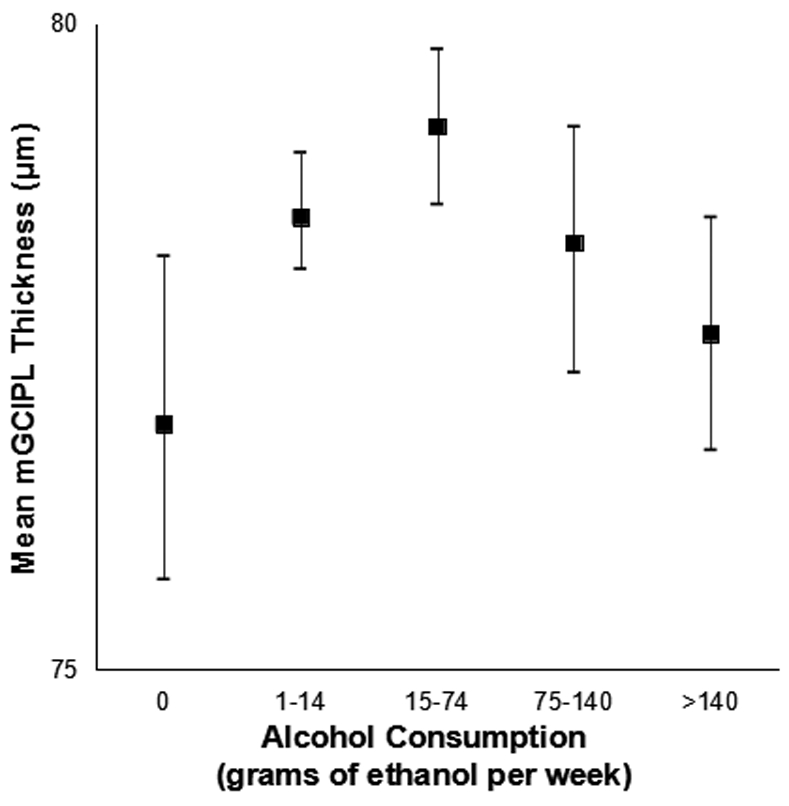
Mean macular ganglion cell-inner plexiform layer (mGCIPL) thickness and 95% confidence intervals stratified by alcohol consumption in the Beaver Dam Offspring Study.
ACKNOWLEDGMENTS
We would like to acknowledge the contributions of Dr. Ronald Klein to this study. He passed away before this paper was written but was a valued member of our investigative group. He contributed his expertise in ocular epidemiology to the design and conduct of this cohort study.
Appendix
Appendix Figure 1:
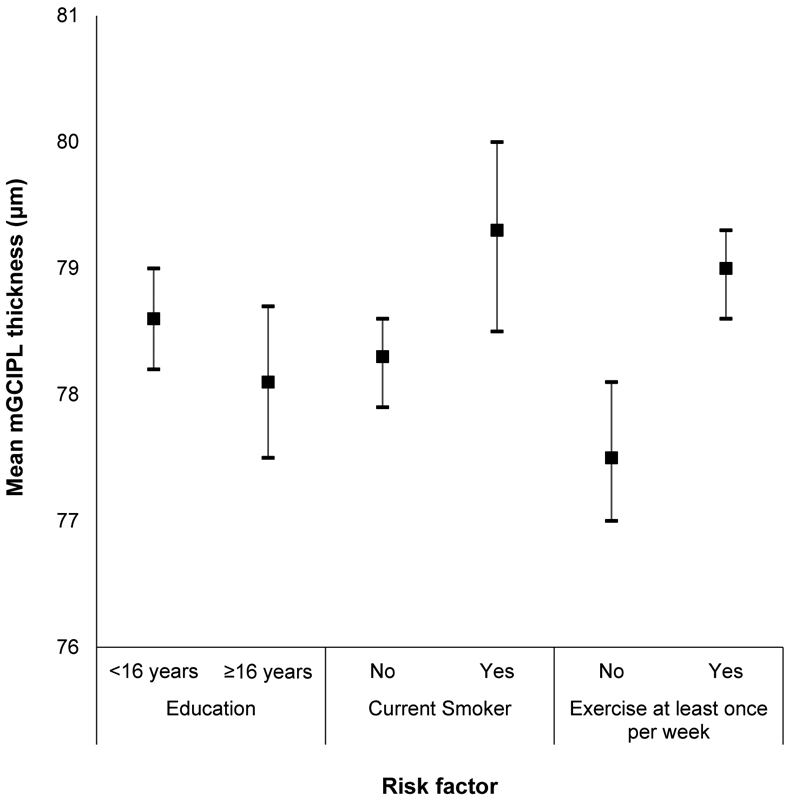
Mean macular ganglion cell-inner plexiform layer (mGCIPL) thickness and 95% confidence intervals stratified by education, smoking status, and exercise in the Beaver Dam Offspring Study.
Appendix Figure 2:
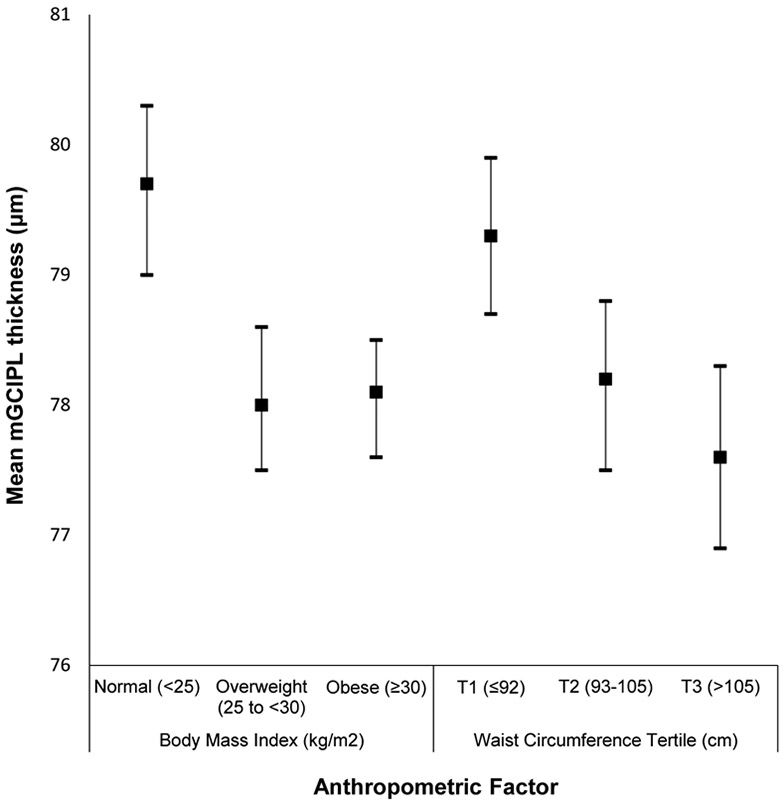
Mean macular ganglion cell-inner plexiform layer (mGCIPL) thickness and 95% confidence intervals stratified by anthropometric factors in the Beaver Dam Offspring Study.
Appendix Figure 3:
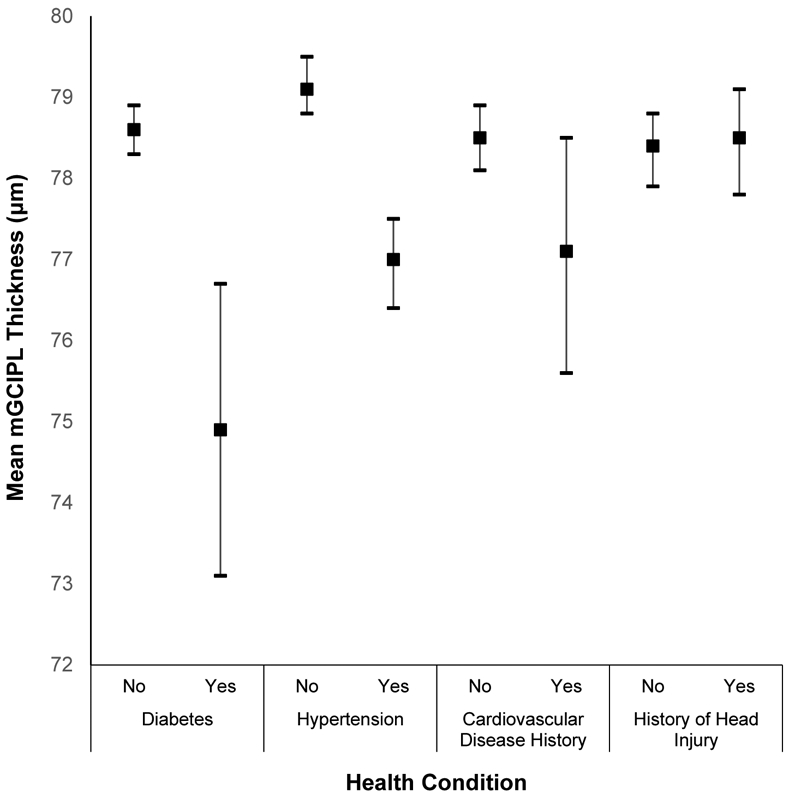
Mean macular ganglion cell-inner plexiform layer (mGCIPL) thickness and 95% confidence intervals stratified by health conditions in the Beaver Dam Offspring Study.
Appendix Figure 4:
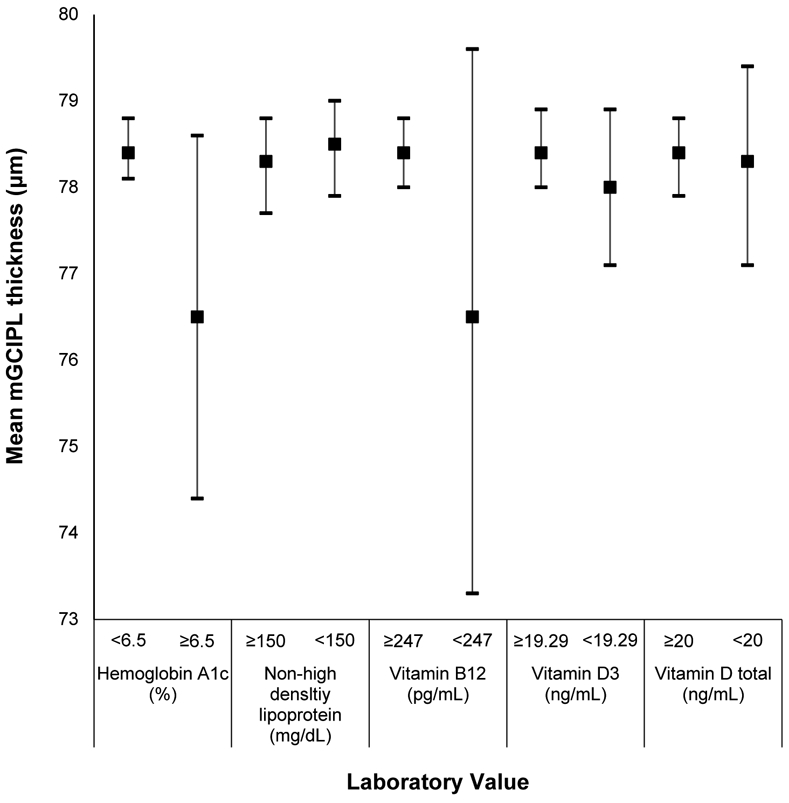
Mean macular ganglion cell-inner plexiform layer (mGCIPL) thickness and 95% confidence intervals stratified by hemoglobin A1c, cholesterol, and vitamin levels in the Beaver Dam Offspring Study.
Appendix Figure 5:
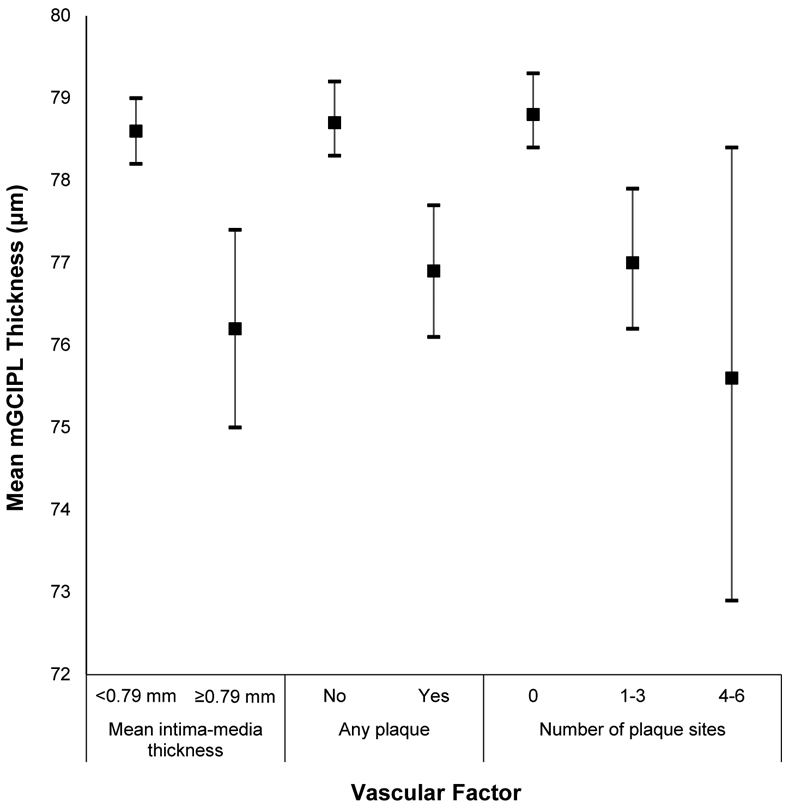
Mean macular ganglion cell-inner plexiform layer (mGCIPL) thickness and 95% confidence intervals stratified by vascular risk factors in the Beaver Dam Offspring Study.
Appendix Figure 6:
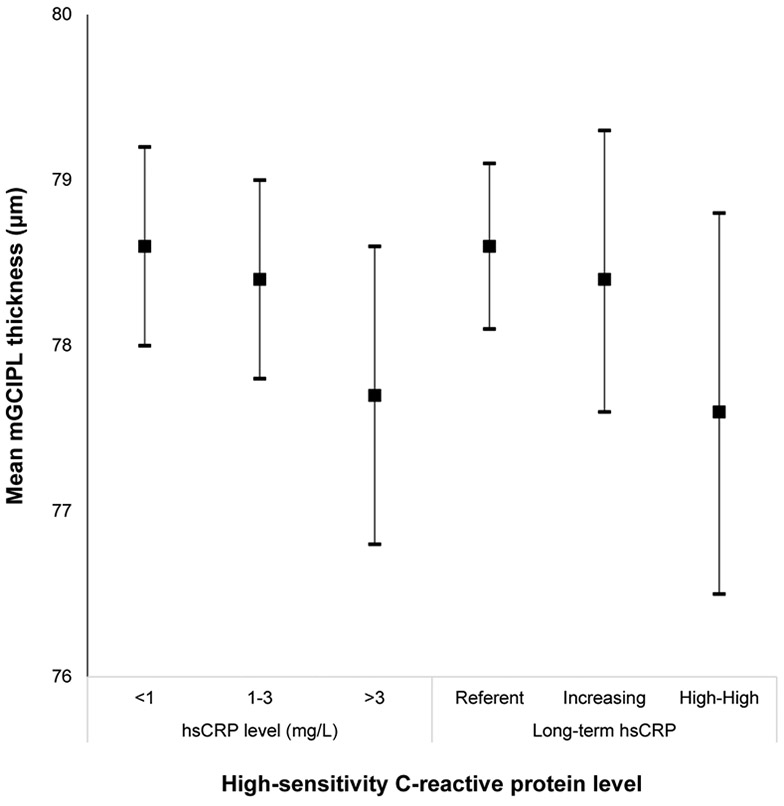
Mean macular ganglion cell-inner plexiform layer (mGCIPL) thickness and 95% confidence intervals stratified by high-sensitivity C-reactive protein level in the Beaver Dam Offspring Study.
Appendix Figure 7:
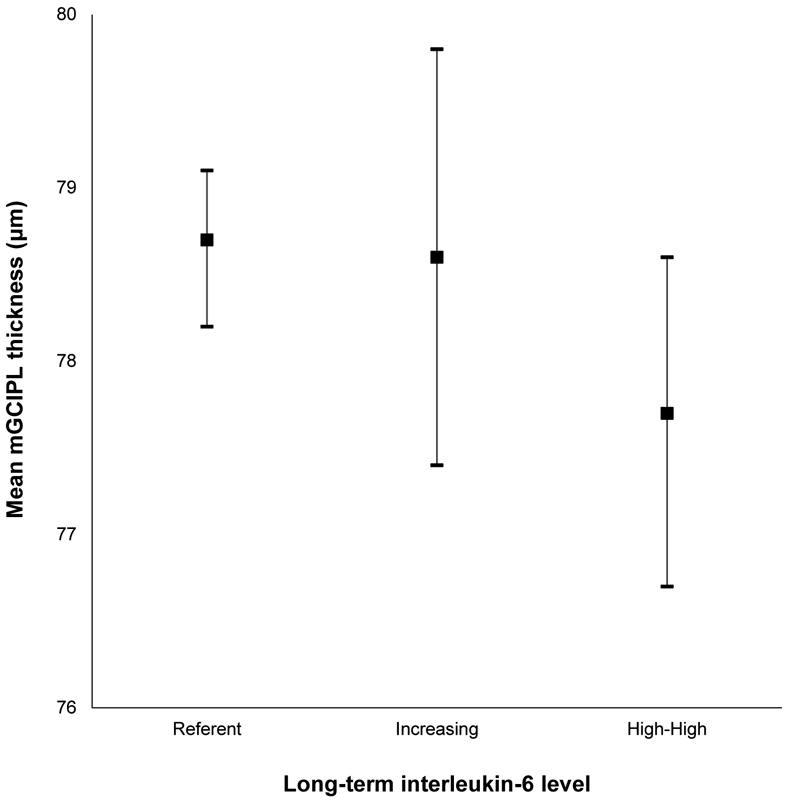
Mean macular ganglion cell-inner plexiform layer (mGCIPL) thickness and 95% confidence intervals stratified by long-term interleukin-6 level in the Beaver Dam Offspring Study.
Appendix Figure 8:
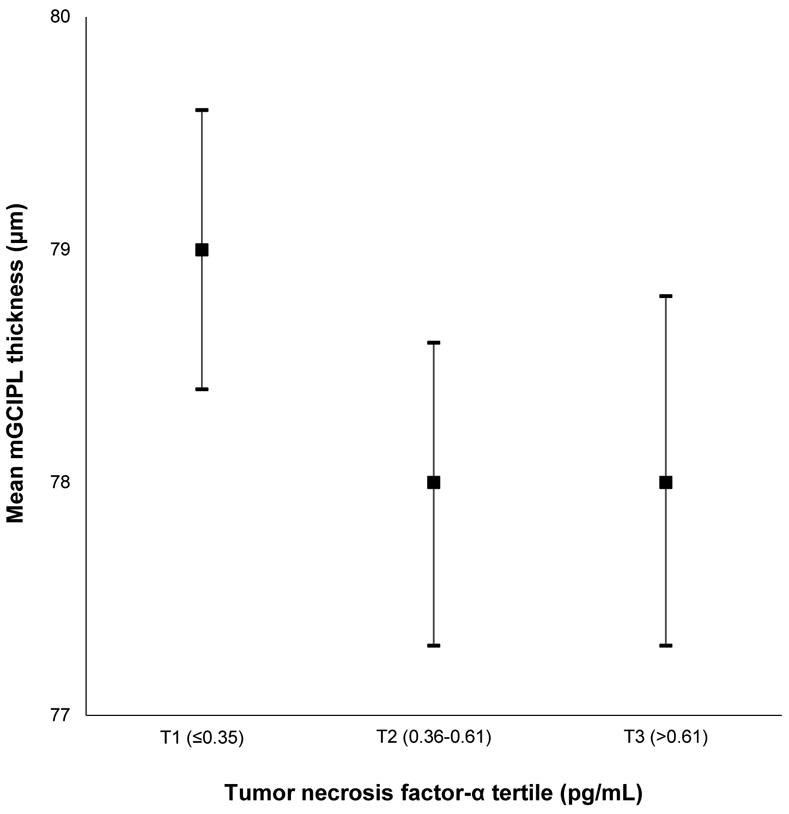
Mean macular ganglion cell-inner plexiform layer (mGCIPL) thickness and 95% confidence intervals stratified by tumor necrosis factor-α level in the Beaver Dam Offspring Study.
Appendix Figure 9:
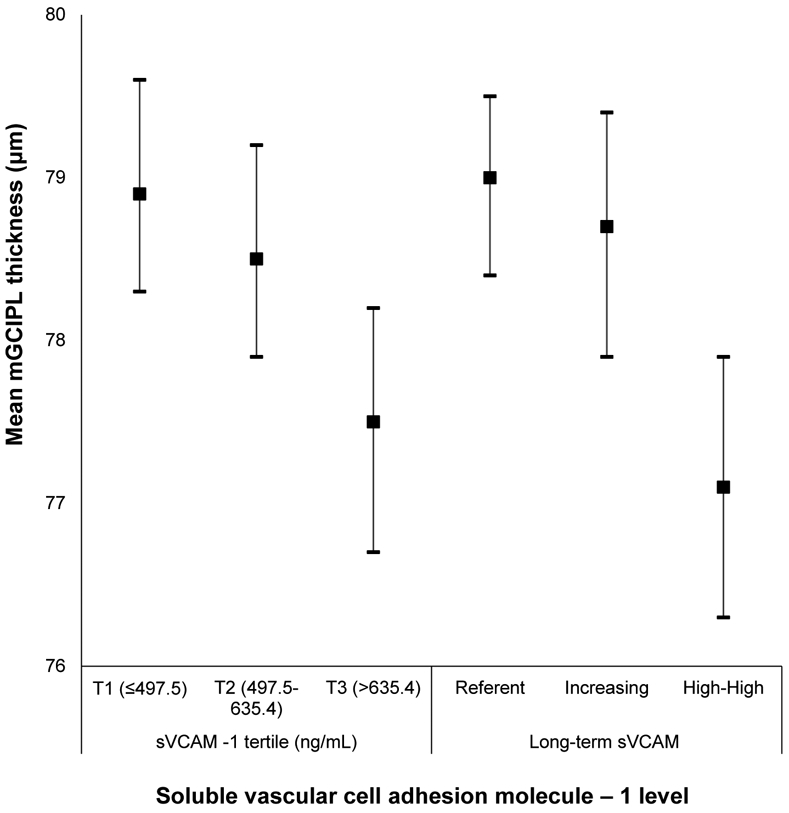
Mean macular ganglion cell-inner plexiform layer (mGCIPL) thickness and 95% confidence intervals stratified by soluble vascular cell adhesion molecule-1 level in the Beaver Dam Offspring Study.
Appendix Figure 10:
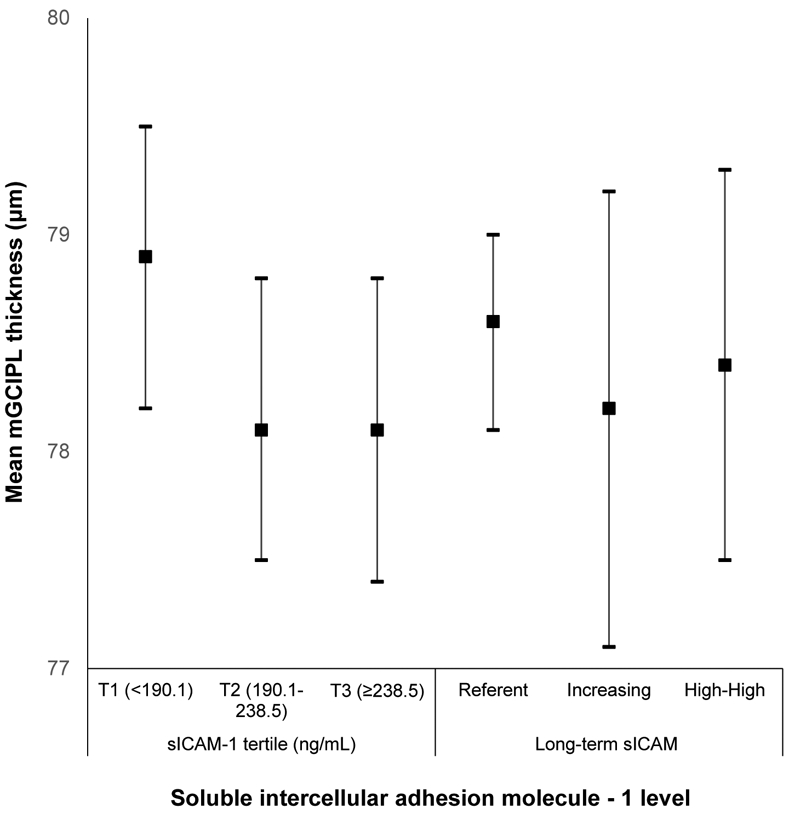
Mean macular ganglion cell-inner plexiform layer (mGCIPL) thickness and 95% confidence intervals stratified by soluble intercellular adhesion molecule-1 level in the Beaver Dam Offspring Study.
Appendix Figure 11:
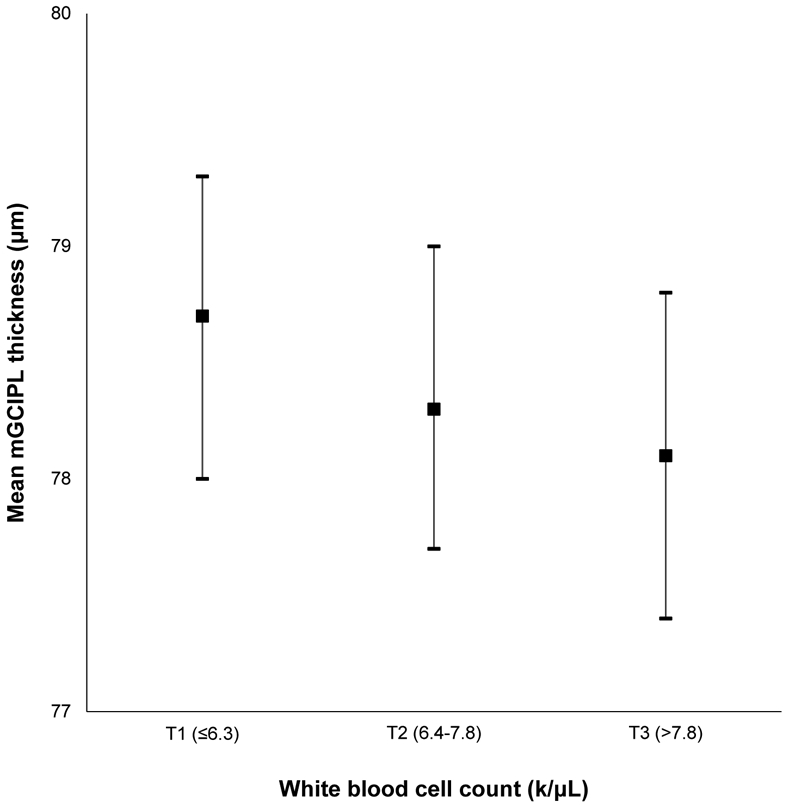
Mean macular ganglion cell-inner plexiform layer (mGCIPL) thickness and 95% confidence intervals stratified by white blood cell count in the Beaver Dam Offspring Study.
Appendix Figure 12:
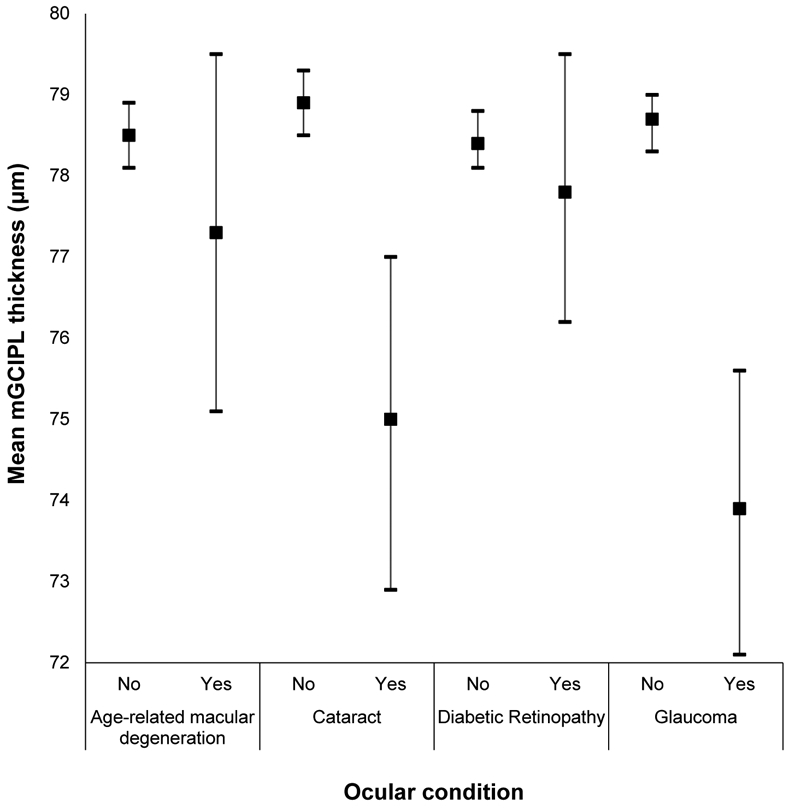
Mean macular ganglion cell-inner plexiform layer (mGCIPL) thickness and 95% confidence intervals stratified by ocular health conditions in the Beaver Dam Offspring Study.
Appendix Figure 13:
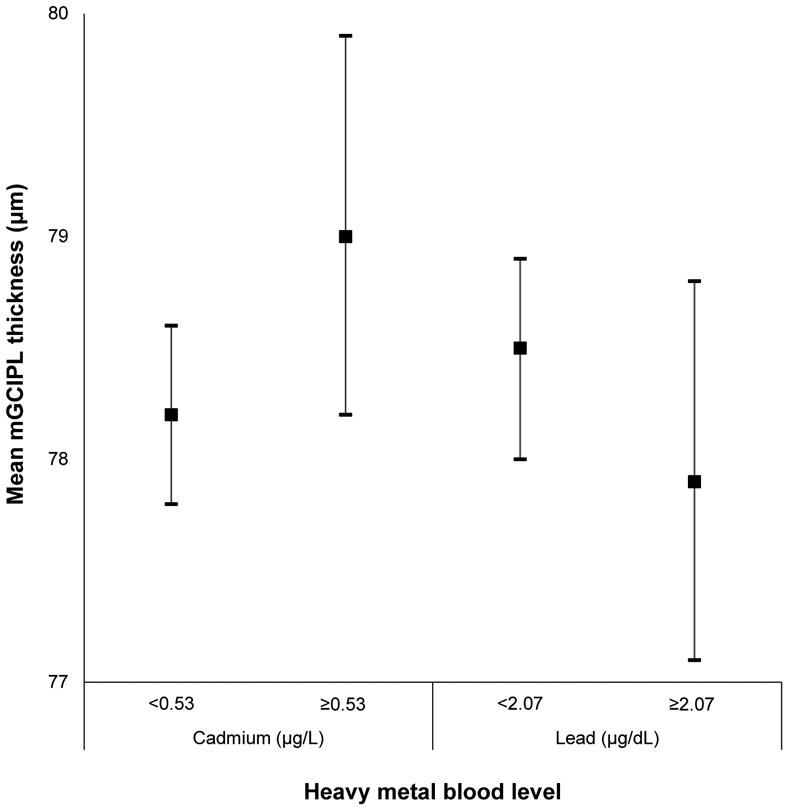
Mean macular ganglion cell-inner plexiform layer (mGCIPL) thickness and 95% confidence intervals stratified by blood cadmium and lead levels in the Beaver Dam Offspring Study.
Appendix Figure 14:
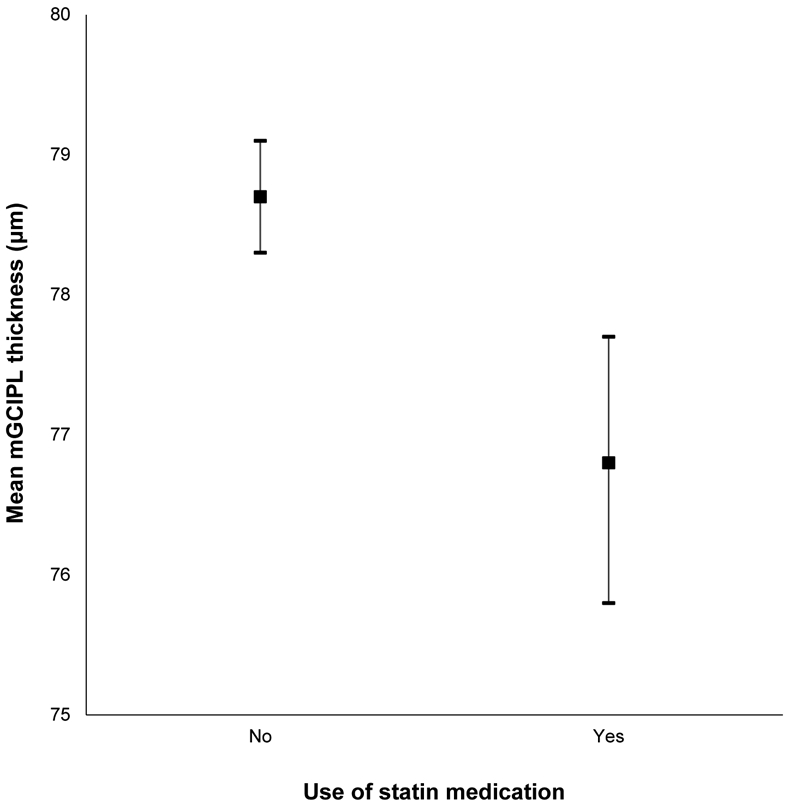
Mean macular ganglion cell-inner plexiform layer (mGCIPL) thickness and 95% confidence intervals stratified by use of statin medications in the Beaver Dam Offspring Study.
Contributor Information
Adam J. Paulsen, Department of Ophthalmology and Visual Sciences, School of Medicine and Public Health, University of Wisconsin – Madison, Madison, Wisconsin.
Alex Pinto, Department of Ophthalmology and Visual Sciences, School of Medicine and Public Health, University of Wisconsin – Madison, Madison, Wisconsin.
Natascha Merten, Department of Population Health Sciences, School of Medicine and Public Health, University of Wisconsin – Madison, Madison, Wisconsin.
Yanjun Chen, Department of Ophthalmology and Visual Sciences, School of Medicine and Public Health, University of Wisconsin – Madison, Madison, Wisconsin.
Mary E. Fischer, Department of Ophthalmology and Visual Sciences, School of Medicine and Public Health, University of Wisconsin – Madison, Madison, Wisconsin.
Guan-Hua Huang, National Chiao Tung University – Hsinchu, Taiwan.
Barbara E. K. Klein, Department of Ophthalmology and Visual Sciences, School of Medicine and Public Health, University of Wisconsin – Madison, Madison, Wisconsin.
Carla R Schubert, Department of Ophthalmology and Visual Sciences, School of Medicine and Public Health, University of Wisconsin – Madison, Madison, Wisconsin.
Karen J. Cruickshanks, Department of Ophthalmology and Visual Sciences, School of Medicine and Public Health, University of Wisconsin – Madison, Madison, Wisconsin; Department of Population Health Sciences, School of Medicine and Public Health, University of Wisconsin – Madison, Madison, Wisconsin.
REFERENCES
- 1.Mwanza JC, Durbin MK, Budenz DL, et al. Profile and Predictors of Normal Ganglion Cell-Inner Plexiform Layer Thickness Measured with Frequency-Domain Optical Coherence Tomography. Invest Ophthalmol Vis Sci 2011;52:7872–9. [DOI] [PubMed] [Google Scholar]
- 2.Hood DC, Raza AS, de Moraes CG, et al. Glaucomatous Damage of the Macula. Prog Retin Eye Res 2013;32:1–21. [DOI] [PMC free article] [PubMed] [Google Scholar]
- 3.Tan O, Li G, Lu AT, et al. Advanced Imaging for Glaucoma Study Group. Mapping of Macular Substructures with Optical Coherence Tomography for Glaucoma Diagnosis. Ophthalmology 2008;115:949–56. [DOI] [PMC free article] [PubMed] [Google Scholar]
- 4.Nouri-Mahdavi K, Nowroozizadeh S, Nassiri N, et al. Macular Ganglion Cell/Inner Plexiform Layer Measurements with Spectral Domain Optical Coherence Tomography for Detection of Early Glaucoma and Comparison to Retinal Nerve Fiber Layer Measurements. Am J Ophthalmol 2013;156:1297–307. [DOI] [PMC free article] [PubMed] [Google Scholar]
- 5.Burkholder BM, Osborne B, Loguidice MJ, et al. Macular Volume Determined by Optical Coherence Tomography as a Measure of Neuronal Loss in Multiple Sclerosis. Arch Neurol 2009;66:1366–72. [DOI] [PubMed] [Google Scholar]
- 6.Marziani E, Pomati S, Ramolfo P, et al. Evaluation of Retinal Nerve Fiber Layer and Ganglion Cell Layer Thickness in Alzheimer’s Disease Using Spectral-Domain Optical Coherence Tomography. Invest Ophthalmol Vis Sci 2013;54:5953–8. [DOI] [PubMed] [Google Scholar]
- 7.Sari ES, Koc R, Yazici A, et al. Ganglion Cell-Inner Plexiform Layer Thickness in Patients With Parkinson Disease and Association With Disease Severity and Duration. J Neuroophthalmol 2015;35:117–21. [DOI] [PubMed] [Google Scholar]
- 8.Adam CR, Shrier E, Ding Y, et al. Correlation of Inner Retinal Thickness Evaluated by Spectral-Domain Optical Coherence Tomography and Contrast Sensitivity in Parkinson disease. J Neuroophthalmol 2013;33:137–42. [DOI] [PubMed] [Google Scholar]
- 9.Bloch E, Yonova-Doing Y, Jones-Odeh E, et al. Genetic and Environmental Factors Associated with the Ganglion Cell Complex in a Healthy Aging British Cohort. JAMA Ophthalmol 2017;135:31–8. [DOI] [PubMed] [Google Scholar]
- 10.Mauschitz MM, Holz FG, Finger RP, Breteler MMB. Determinants of Macular Layers and Optic Disc Characteristics on SD-OCT: The Rhineland Study. Transl Vis Sci Technol 2019;8:34. [DOI] [PMC free article] [PubMed] [Google Scholar]
- 11.Khawaja AP, Chua S, Hysi PG, et al. Comparison of Associations with Different Macular Inner Retinal Thickness Parameters in a Large Cohort: The UK Biobank. Ophthalmology 2020;127:62–71. [DOI] [PubMed] [Google Scholar]
- 12.Rodrigues EB, Urias MG, Penha FM, et al. Diabetes Induces Changes in Neuroretina Before Retinal Vessels: a Spectral-Domain Optical Coherence Tomography Study. Int J Retina Vitreous 2015;1:4. [DOI] [PMC free article] [PubMed] [Google Scholar]
- 13.Perry VH. Contribution of Systemic Inflammation to Chronic Neurodegeneration. Acta Neuropathol 2010;120:277–86. [DOI] [PubMed] [Google Scholar]
- 14.Schultzburg M, Lindberg C, Aronsson AF, et al. Inflammation in the Nervous System – Physiological and Pathophysiological Aspects. Physiol Behav 2007;92:121–8. [DOI] [PubMed] [Google Scholar]
- 15.Koyama A, O’Brien J, Weuve J, et al. The Role of Peripheral Inflammatory Markers in Dementia and Alzheimer’s Disease: A Meta-Analysis. J Gerontol (A) 2013;68:433–40. [DOI] [PMC free article] [PubMed] [Google Scholar]
- 16.Sasaki N, Fukatsu R, Tsuzuki K, et al. Advanced Glycation End Products in Alzheimer’s Disease and Other Neurodegenerative Diseases. Am J Pathol 1998;153:1149–55. [DOI] [PMC free article] [PubMed] [Google Scholar]
- 17.Verdile G, Fuller SJ, Martins RN. The Role of Type 2 Diabetes in Neurodegeneration. Neurobiol Dis 2015;84:22–38. [DOI] [PubMed] [Google Scholar]
- 18.Castillo X, Castro-Obregón S, Gutiérrez-Becker B, et al. Re-Thinking the Etiological Framework of Neurodegeneration. Front Neurosci 2019;13:728. [DOI] [PMC free article] [PubMed] [Google Scholar]
- 19.Vemuri P, Lesnick TG, Przybelski SA, et al. Age, Vascular Health, and Alzheimer’s Disease Biomarkers in an Elderly Sample. Ann Neurol 2017;82:706–18. [DOI] [PMC free article] [PubMed] [Google Scholar]
- 20.Kim K, Kim ES, Rhee SY, et al. Clinical Characteristics and Risk Factors for Retinal Diabetic Neurodegeneration in Type 2 Diabetes. Acta Diabetol 2017;54:993–9. [DOI] [PubMed] [Google Scholar]
- 21.Ahuja S, Kumar PS, Kumar VP, et al. Effect of Chronic Alcohol and Tobacco Use on Retinal Nerve Fibre Layer Thickness: a Case-Control Study. BMJ Open Ophthalmol 2016;1:e000003. [DOI] [PMC free article] [PubMed] [Google Scholar]
- 22.Crews FT, Nixon K. Mechanisms of Neurodegeneration and Regeneration in Alcoholism. Alcohol 2009;44:115–27. [DOI] [PMC free article] [PubMed] [Google Scholar]
- 23.Brown BM, Peiffer JJ, Martins RN. Multiple Effects of Physical Activity on Molecular and Cognitive Signs of Brain Aging: Can Exercise Slow Neurodegeneration and Delay Alzheimer’s Disease. Mol Psychiatry 2013;18:864–74. [DOI] [PubMed] [Google Scholar]
- 24.Armstrong NM, An Y, Beason-Held L, et al. Predictors of Neurodegeneration Differ Between Cognitively Normal and Subsequently Impaired Older Adults. Neurobiol Aging 2019;75:178–86. [DOI] [PMC free article] [PubMed] [Google Scholar]
- 25.Gillette-Guyonnet S, Secher M, Vellas B. Nutrition and Neurodegeneration: Epidemiologic Evidence and Challenges for Future Research. Br J Clin Pharmacol 2013;75:738–55. [DOI] [PMC free article] [PubMed] [Google Scholar]
- 26.Armstrong NM, An Y, Beason-Held L, et al. Sex Differences in Brain Aging and Predictors of Neurodegeneration in Cognitively Healthy Older Adults. Neurobiol Aging 2019;81:146–56. [DOI] [PMC free article] [PubMed] [Google Scholar]
- 27.Nash SD, Cruickshanks KJ, Klein R, et al. The Prevalence of Hearing Impairment and Associated Risk Factors: the Beaver Dam Offspring Study. Arch Otolaryngol Head Neck Surg 2011;137:432–9. [DOI] [PMC free article] [PubMed] [Google Scholar]
- 28.Carl Zeiss Meditec, Inc. Cirrus HD-OCT User Manual – Models 500, 5000. Dublin, CA: Carl Zeiss Meditec, Inc.; 2015. [Google Scholar]
- 29.Klein R, Meuer SM, Moss SE, et al. Detection of Age-Related Macular Degeneration Using a Nonmydriatic Digital Camera and a Standard Film Fundus Camera. Arch Ophthalmol 2004;122:1642–6. [DOI] [PubMed] [Google Scholar]
- 30.Klein R, Cruickshanks KJ, Nash SD, et al. The Prevalence of Age-Related Macular Degeneration and Associated Risk Factors: The Beaver Dam Offspring Study. Arch Ophthalmol 2010;128:750–8. [DOI] [PMC free article] [PubMed] [Google Scholar]
- 31.Klein BEK, Klein R, Linton KL, et al. Assessment of Cataracts from Photographs in the Beaver Dam Eye Study. Ophthalmology 1990;97:1428–33. [DOI] [PubMed] [Google Scholar]
- 32.Zhong W, Cruickshanks KJ, Huang GH, et al. Carotid Atherosclerosis and Cognitive Function in Midlife: The Beaver Dam Offspring Study. Atherosclerosis 2011;219:330–3. [DOI] [PMC free article] [PubMed] [Google Scholar]
- 33.Schubert CR, Fischer ME, Pinto AA, et al. Brain Aging in Midlife: The Beaver Dam Offspring Study. J Am Geriatr Soc 2019;67:1610–6. [DOI] [PMC free article] [PubMed] [Google Scholar]
- 34.Dalton DS, Schubert CR, Pinto A, et al. Cadmium, Obesity, and Education, and the 10-year Incidence of Hearing Impairment: The Beaver Dam Offspring Study. Laryngoscope 2020;130:1396–401. [DOI] [PMC free article] [PubMed] [Google Scholar]
- 35.Paulsen AJ, Schubert CR, Johnson LJ, et al. Association of Cadmium and Lead Exposure with the Incidence of Contrast Sensitivity Impairment among Middle-aged Adults. JAMA Ophthalmol 2018;136:1342–50. [DOI] [PMC free article] [PubMed] [Google Scholar]
- 36.Poh S, Tham Y, Chee ML, et al. Association between Macular Thickness Profiles and Visual Function in Healthy Eyes: The Singapore Epidemiology of Eye Diseases (SEED) Study. Sci Rep 2020;10:6142. [DOI] [PMC free article] [PubMed] [Google Scholar]
- 37.Huo YJ, Guo Y, Li L, et al. Age-related Changes in and Determinants of Macular Ganglion Cell-Inner Plexiform Layer Thickness in Normal Chinese Adults. Clin Exp Ophthalmol 2018;46:400–6. [DOI] [PubMed] [Google Scholar]
- 38.Perez CI, Chansangpetch S, Thai A, et al. Normative Database and Color-code Agreement of Peripapillary Retinal Nerve Fiber Layer and Macular Ganglion Cell-inner Plexiform Layer Thickness in a Vietnamese Population. J Glaucoma 2018;27:665–73. [DOI] [PubMed] [Google Scholar]
- 39.Tham Y, Chee ML, Dai W, et al. Profiles of Ganglion Cell-Inner Plexiform Layer Thickness in a Multi-Ethnic Asian Population: The Singapore Epidemiology of Eye Diseases Study. Ophthalmology 2020;127:1064–76. [DOI] [PubMed] [Google Scholar]
- 40.Moghimi S, Fatehi N, Nguyen AH, et al. Relationship of the Macular Ganglion Cell and Inner Plexiform Layers in Healthy and Glaucoma Eyes. Transl Vis Sci Technol 2019;8:27. [DOI] [PMC free article] [PubMed] [Google Scholar]
- 41.Lim HB, Lee WH, Jo YJ, Kim JY. Interocular Asymmetry of the Ganglion Cell-inner Plexiform Layer in Diabetic Retinopathy. Optom Vis Sci 2018;95:594–601. [DOI] [PubMed] [Google Scholar]
- 42.Mutlu U, Colijn JM, Ikram A, et al. Association of Retinal Neurodegeneration on Optical Coherence Tomography with Dementia: A Population-Based Study. JAMA Neurol 2018;75:1256–63. [DOI] [PMC free article] [PubMed] [Google Scholar]
- 43.Hafner J, Prager S, Lammer J, et al. Comparison of Ganglion Cell Inner Plexiform Layer Thickness by Cirrus and Spectralis Optical Coherence Tomography in Diabetic Macular Edema. Retina 2018;38:820–7. [DOI] [PubMed] [Google Scholar]
- 44.Demirkaya N, van Dijk HW, van Schuppen SM, et al. Effect of Age on Individual Retinal Layer Thickness in Normal Eyes as Measured With Spectral-Domain Optical Coherence Tomography. Invest Ophthalmol Vis Sci 2013;54:4934–40. [DOI] [PMC free article] [PubMed] [Google Scholar]
- 45.Sullivan EV, Rosenbloom MJ, Lim KO. Longitudinal Changes in Cognition, Gait, and Balance in Abstinent and Relapsed Alcoholic Men: Relationships to Changes in Brain Structure. Neuropsychology 2000;14:178–88. [PubMed] [Google Scholar]
- 46.Sullivan EV, Pfefferbaum A. Neurocircuitry in Alcoholism: A Substrate of Disruption and Repair. Psychopharmacology (Berl) 2005;180:583–94. [DOI] [PubMed] [Google Scholar]
- 47.Lamparter J, Schmidtmann I, Schuster AK, et al. Association of Ocular, Cardiovascular, Morphometric and Lifestyle Parameters with Retinal Nerve Fibre Layer Thickness. PLoS One 2018;13:e0197682. [DOI] [PMC free article] [PubMed] [Google Scholar]
- 48.Akashi A, Kanamori A, Nakamura M, et al. Comparative Assessment for the Ability of Cirrus, RTVue, and 3D-OCT to Diagnose Glaucoma. Invest Ophthalmol Vis Sci 2013;54:4478–84. [DOI] [PubMed] [Google Scholar]


