

Abstract
Listeria monocytogenes is well known to survive and grow under several stress conditions, including salt stress, which is important for growth in certain foods as well as for host infection. To characterize the contributions, to salt stress response, of transcriptional regulators important for stress response and virulence (i.e., σB and PrfA), we analyzed three L. monocytogenes parent strains and isogenic mutants (ΔsigB, ΔprfA, and ΔsigBΔprfA), representing different serotypes and lineages, for their ability to grow, at 25 °C, in BHI with 1.9 M NaCl. With regard to growth rate, only the lineage IV strain presented a significant difference between the parent strain and both of its respective mutants lacking prfA (ΔprfA and ΔsigBΔprfA). Conversely, the lineage I and II parent strains showed significantly shorter lag phase in comparison to their respective ΔsigB mutant strains. Intestinal epithelial cell invasion assay and hemolytic activity assays showed a significant role for σB in the former and for PrfA in the latter. To explore the mechanism that may contribute to the extended lag phase in the ΔsigB mutant strain and survival and growth of the parent strain upon salt shock, whole genome transcription profiling was performed to compare transcript levels between the lineage I, serotype 1/2b, parent strain and its isogenic ΔsigB mutant after 30 min of lag phase growth at 25 °C in the presence of 1.9 M NaCl (salt shock) without aeration. Microarray data showed significantly higher transcript levels for 173 genes in the parent strain as compared to the ΔsigB strain. Overall, 102 of the 173 σB up-regulated genes had been identified in previous studies, indicating that 71 genes were newly identified as being up-regulated by σB in this study. We hypothesize that, among these genes newly identified as σB up-regulated, four genes (lmo2174, lmo0530, lmo0527 and lmo0529) may play a major role in response to salt stress. Lmo2174 contains domains that facilitate sensing and producing a transduction signal in the form of cyclic di-GMP, which may activate the enzymes Lmo0527, Lmo0529 and Lmo0530, which encode proteins similar to those responsible for synthesis of exopolysaccharides that may protect the cell by changing the cell wall structure during salt stress. Overall, our data showed that σB, but not PrfA, contributes to growth under salt stress. Moreover, we show that the σB regulon of a L. monocytogenes lineage I strain challenged with salt shock includes salt stress-specific as well as previously unidentified σB up-regulated genes.
Keywords: Listeria monocytogenes, Salt stress, Salt shock, Sigma B, PrfA, Microarray
1. Introduction
Listeria monocytogenes is found in a wide range of food products such as dairy products, deli meats, salads, and seafood (Ryser and Marth, 2007). Food safety relies primarily on the use of multiple hurdle technology to prevent microbial growth in foods (Leistner, 2000). Among the well-established barriers applied to prevent microbial growth, acid and osmotic stresses are most commonly applied during food processing (e.g., by acidification or addition of NaCl), or naturally encountered in foods (e.g., low pH of fruits and desiccation). These two factors normally contribute to the preservation of food products, but L. monocytogenes is capable of surviving and growing in environments where these factors are present, resulting in long-term adaptation of L. monocytogenes to sublethal environmental stress conditions (Rogga et al., 2007; Ryser and Marth, 2007). Furthermore, L. monocytogenes can be challenged with adverse conditions not only in a food environment, but also during the infection of an animal host. While the empty human stomach can be highly acidic, with documented pH measurements as low as 2.0 (Chowduhry et al., 1996), bacteria encounter a mildly acidic environment with an elevated osmolarity (pH 4.5–6.5, 0.3 M NaCl) in the small intestine (Chowduhry et al., 1996; Davenport, 1982).
L. monocytogenes strains can be grouped into at least four phylogenetic lineages, which have been reported to vary in virulence potential and stress resistance (Orsi et al., 2011). Several studies have shown differential distribution of lineage I and II isolates among human clinical isolates (Hong et al., 2007; Parihar et al., 2008) and food isolates (Meloni et al., 2009; Orsi et al., 2008) as well as an apparent overrepresentation, among animal clinical isolates, of lineage III strains (Bundrant et al., 2011; Liu et al., 2006), while lineage IV isolates are very rare and have been isolated from food, animal and environmental sources (Ward et al., 2008). In addition, it has been noted that certain serotypes (4b, 1/2a, and 1/2b) are more frequently associated with human disease than others (Orsi et al., 2011). Differences between lineages and serotypes with respect to resistance to osmotic stress (Oliver et al., 2010), acid stress (Dykes and Moorhead, 2000), bacteriocins, heat (Buncic et al., 2001), and starvation (Avery and Buncic, 1997) have been observed. For example, Bergholz et al. (2010) reported that lineage II strains had an impaired ability to adapt to salt stress at 37 °C compared to both lineage I and lineage III strains.
The tolerance of L. monocytogenes to a variety of harsh environmental conditions, such as salt stress is at least partly attributed to genes under the control of the alternative sigma (σ) factor, σB (Abram et al., 2008a). Different studies have identified about 170 L. monocytogenes genes that are expressed in a σB-dependent manner and the functional categories represented by these genes include stress tolerance, carbon metabolism, transport, cell envelope, and virulence (Kazmierczak et al., 2003; Raengpradub et al., 2008). On the other hand, genes known to be up-regulated by PrfA, the positive regulator of L. monocytogenes virulence genes, were shown to be down-regulated under salt stress conditions (Raengpradub et al., 2008), suggesting that exposure to salt stress mediates a decrease in PrfA activity, by acting either directly on the PrfA protein or on some PrfA-regulating element. Also, interactions between σB and PrfA in a regulatory network certainly appear to be critical for appropriate expression of virulence genes important for early stages of listerial infection (e.g., inlA, inlB) (Ollinger et al., 2008). The importance of this network has been investigated under stationary phase growth conditions, but the interactions of these regulators have not been investigated under salt stress conditions.
Identifying interactions between stress response and virulence, as well as understanding the global behavior of the transcriptome in response to salt stress, may provide insights into how L. monocytogenes survives and adapts to adverse conditions, leading to the development of new strategies for intervention and control. In this study, we compared the growth parameters of three parent strains representing three different L. monocytogenes lineages and serotypes and their respective isogenic mutants with null mutations in sigB and or prfA under a condition of high salt stress (11% NaCl). We also assessed the hemolytic activity and invasion efficiency in epithelial cells for the lineage I, II and IV L. monocytogenes strains studied here, and compared, using microarrays, the genome-wide expression of genes under salt stress for the lineage I serotype 1/2b strain. Our results suggest that σB plays a major role in invasion of epithelial cells in all strains studied while PrfA plays a major role in hemolytic activity in the same strains. We have also for the first time characterized, by microarray, the σB regulon under lag phase growth salt stress at 25 °C; this represents a salt stress condition more likely encountered by L. monocytogenes in the food chain than exposure to salt stress at 37 °C. For example, L. monocytogenes may be exposed to salt stress at temperatures above refrigeration in processing environments, certain processing stages, and in high salt foods (e.g., certain cheeses) that may be stored or transported at ambient temperatures. We have also identified 71 genes not previously described as being up-regulated by σB; these genes may be σB-up-regulated only under specific conditions (e.g., salt stress).
2. Materials and methods
2.1. Strains
The strains selected for this study represented L. monocytogenes lineages I (serotype 1/2b), II (serotype 1/2a), and IV (serotype 4a) and their respective isogenic ΔsigB and ΔprfA null mutants (Table 1). FSL C6–001, an FSL J1–194 isogenic ΔsigB mutant, FSL A1–254, a 10403S isogenic ΔsigB mutant, FSL B2–046, a 10403S isogenic ΔprfA mutant, FSL-B2–068, a 10403S isogenic ΔsigBΔprfA mutant and FSL O1–005, an FSL J1–208 ΔsigB isogenic mutant have been reported previously (McGann et al., 2007; Oliver et al., 2010; Wiedmann et al., 1998; Wong and Freitag, 2004). FSL C6–004, an FSL J1–194 isogenic ΔprfA mutant, FSL C6–005, an FSL J1–194 isogenic ΔsigBΔprfA mutant, FSL C6–009, an FSL J1–208 isogenic ΔprfA mutant and FSL C6–007, an FSL J1–208 isogenic ΔsigBΔprfA mutants were created using allelic exchange mutagenesis, as previously described (Horton et al., 1990; Wiedmann et al., 1998). All null mutants represent non-polar in-frame deletion mutants (hence, no complemented mutants were created). Stock cultures were stored at −80 °C in brain heart infusion (BHI) containing 15% glycerol. Cultures were streaked onto BHI agar (Difco, Detroit, MI) and incubated at 37 °C for 24 h to obtain isolated colonies for inoculation of overnight cultures.
Table 1.
Listeria monocytogenes strains used in this study.
| Isolate designation | Serotype | Source or parent strain | Genotype | Reference |
|---|---|---|---|---|
| Lineage I strains | ||||
| FSL J1–194 | 1/2b | Human, sporadic | Parent | Sauders et al. (2003) |
| FSL C6–001 | 1/2b | FSL J1–194 | ΔsigB | Oliver et al. (2010) |
| FSL C6–004 | 1/2b | FSL J1–194 | ΔprfA | This study |
| FSL C6–005 | 1/2b | FSL J1–194 | ΔsigBΔprfA | This study |
| Lineage II strains | ||||
| FSL X1–001 | 1/2a | Human, skin lesion | Parent | Bishop and Hinrichs (1987) |
| FSL A1–254 | 1/2a | 10403S | ΔsigB | Wiedmann et al. (1998) |
| FSL B2–046 | 1/2a | 10403S | ΔprfA | Wong and Freitag (2004) |
| FSL B2–068 | 1/2a | 10403S | ΔsigBΔprfA | McGann et al. (2007) |
| Lineage IV strains | ||||
| FSL J1–208 | 4a | Animal | Parent | Roberts et al. (2006) |
| FSL O1–005 | 4a | FSL J1–208 | ΔsigB | Oliver et al. (2010) |
| FSL C6–009 | 4a | FSL J1–208 | ΔprfA | This study |
| FSL C6–007 | 4a | FSL J1–208 | ΔsigBΔprfA | This study |
2.2. Growth conditions and salt stress survival assays
Initially, all strains were grown to early stationary phase in BHI at 37 °C as described previously (Oliver et al., 2010). Briefly, strains were first grown in 5 ml of BHI broth at 37 °C with shaking (230 rpm) for 12 h. A 1% inoculum was transferred to 5 ml of pre-warmed BHI broth and grown to an optical density at 600 nm (OD600) of 0.4; 50 μl of this culture was transferred to another 5 ml of pre-warmed (37 °C) BHI broth, followed by incubation at 37 °C with shaking (230 rpm) until bacteria reached early stationary phase (defined as growth to an OD600 of 1.0, followed by incubation for an additional 3 h). Serial dilutions of this early stationary phase culture (representing approx. 109 CFU/ml) were made in BHI broth and 1 ml of a dilution with 106 CFU/ml of L. monocytogenes was transferred to 99 ml BHI plus 1.9 M NaCl (11%) (for an inoculum of ∼104 CFU/ml), followed by incubation at 25 °C, without aeration. Cultures were incubated for 20 days and plated onto BHI agar in 12 different time points (1, 2, 3, 4, 5, 7, 10, 12, 14, 16, 18 and 20 days post-incubation). Plates were incubated at 37 °C overnight and colonies enumerated. Three independent replicates were performed.
2.3. Growth parameter data analysis
Growth parameters for each strain (for growth in BHI or BHI plus 1.9 M NaCl at 25 °C) were estimated using the Baranyi model (Baranyi and Roberts, 1994) implemented in the NLStools v.0.0–4 package in R v.2.5.1. Cell densities (CFU/ml) for each strain at every time point were log-transformed and used to estimate the lag phase duration and maximum growth rate. The statistical significance of differences in the growth parameters between the L. monocytogenes strains was evaluated using one-way analysis of variance (one-way ANOVA) at α = 0.05 significance level with the Tukey’s HSD multiple correction procedure.
2.4. RNA extraction
For RNA extraction, 1 ml of early stationary phase cells (prepared as detailed in Section 2.2) was transferred to 99 ml BHI with 1.9 M NaCl (to reach ∼107 CFU/ml), followed by incubation at 25 °C, without aeration for 30 min. RNA Protect bacterial reagent (Qiagen, Valencia, CA) was added to these 100 ml cultures, according to the manufacturer’s instruction, to stabilize the mRNA followed by centrifugation at 18,000 g for 20 min; pellets were stored at −80 °C prior to RNA isolation. RNA was extracted from cultures using TriReagent (Ambion). Total RNA was incubated with RNasin (Promega, Madison, WI) to inhibit RNases and with RQ1 DNase (Promega) to remove contaminating DNA, according to the manufacturer’s instructions. After phenol–chloroform extraction, UV spectrophotometry (Nanodrop, Wilmington, DE) was used to quantify and assess the purity of the RNA (Oliver et al., 2010). RNA quality was assessed on a Bioanalyzer (Agilent), and only samples with RNA Integrity Numbers (RIN) > 8.0 were used for subsequent analyses. Purified RNA was stored in RNase-free water at −80 °C prior to reverse transcription (RT), which was performed as previously described (Ollinger et al., 2009).
2.5. Microarray, cDNA labeling, and microarray hybridization
The Pathogen Functional Genomics Resource Center (PFGRC)/J. Craig Venter Institute (JCVI) L. monocytogenes microarray (version 2) was used to identify mRNA transcript level differences between the lineage I, serotype 1/2b, parent strain FSL J1–194 and its respective isogenic ΔsigB mutant both grown to lag phase with 1.9 M NaCl at 25 °C without aeration for 30 min. cDNA labeling and microarray hybridization steps were performed as previously described (Oliver et al., 2010). Three biological replicates were performed.
2.6. Microarray image processing, replicates, and statistical analysis
Image processing and analyses were performed as previously described (Raengpradub et al., 2008). Data preprocessing and statistical analyses were performed using the LIMMA package available from the BioConductor software project for the R programming environment (Gentleman et al., 2004; Smyth, 2005). Background correction was performed using the “normexp” method to produce more robust ratios for low-intensity spots, and print tip normalization was used to correct for spatial effects and dye intensity bias (Smyth and Speed, 2003). The empirical Bayes approach was used to assess differential expression (Smyth, 2004). For each probe, fold changes, moderated t-statistics, and p-values (adjusted for multiple tests by controlling for the false discovery rate) were calculated. Genes whose transcript levels were higher in the parent strain than in the ΔsigB isogenic mutant (≥1.5 fold change) and whose adjusted p-values were <0.05 were considered positively regulated by σB (σB-up-regulated). Genes whose transcript levels were higher in the ΔsigB isogenic mutant than in the parent strain (≥1.5 fold change) and whose adjusted p-values were <0.05 were considered σB-down-regulated. Raw and normalized microarray data have been deposited in the NCBI Gene Expression Omnibus (GEO) database under accession number GSE49056.
2.7. GSEA analysis
Gene set enrichment analysis (GSEA) (Subramanian et al., 2005) was used to identify role categories that were significantly overrepresented among genes up- or down-regulated by σB under the salt stress condition. GSEA was run on the ranked list of log2 expression ratios obtained from the fitted normalized data in LIMMA with 1000 permutations and exclusion of gene sets with fewer than 5 or greater than 500 members. Genes were classified into sets based on the TIGR Comprehensive Microbial Resource (http://cmr.tigr.org) subrole categories for L. monocytogenes EGD-e. False discovery rate q-values less than 0.05 were considered significant.
2.8. TaqMan quantitative RT-PCR (qRT-PCR)
Quantitative Real-Time PCR (qRT-PCR) was used to confirm σB-dependent transcript levels for selected genes (inlD, fri, gltX) that showed higher and lower transcript levels in cells grown at 25 °C in the microarray analyses (see Results section). Primers and TaqMan minor groove binder probes have been previously reported (Chan et al., 2007; Mcgann et al., 2007; Ollinger et al., 2009). qRT-PCR was performed as previously described (Kazmierczak et al., 2006). All qRT-PCR experiments were performed using the three different RNA preparations that were also used for the microarray experiments. Relative expression (i.e. lineage I parent strain transcript levels/ΔsigB mutant strain transcript levels) was determined using the method described by Pfaffl (2001), and normalized to the geometric means for the housekeeping gene rpoB as previously described (Bergholz et al., 2010). Statistical significance of the relative expressions was assessed using the one-sample t-test implemented in R with μ = 1.0.
2.9. Hemolysin assay
For the hemolysin assay, bacteria were grown in BHI broth (without additional salt) overnight at 37 °C with agitation. The enzymatic activity of hemolysin (LLO) from each strain was measured as described previously (Portnoy et al., 1988), except that 0.5 mM dithiothreitol was used as a reducing agent instead of cysteine. Lysis of sheep red blood cells was measured as hemoglobin release at 420 nm in a Multiskan FC microplate analyzer (Thermo Fisher, Waltham, MA). A hemolytic unit was defined as the reciprocal of the supernatant dilution at which 50% of the sheep red blood cells were lysed. The parent level, represented by L. monocytogenes 10403S, was set at 100% hemolysis. All comparisons were evaluated by one-way analysis of variance (one-way ANOVA). Statistical significance was established at p-value < 0.05. Statistical analyses were performed in Minitab (Statistical Software, State College, Pa.).
2.10. Invasion assay
The human colorectal adenocarcinoma epithelial cell line Caco-2 (ATCC HTB-37) was cultured, and invasion assays were performed as described by Garner et al. (2006) with minor modifications. In addition to the 12 strains used in this study (3 parent strains and 9 mutants), the laboratory strain Scott A was included in this experiment as a positive control. Briefly, 5.0 × 10⁴ Caco-2 cells were seeded into 24-well plates (Corning Incorporated, Corning, NY) 48 h prior to infection. For infection, the Caco-2 cells were inoculated with approximately 5.0 × 10⁶ L. monocytogenes cells grown to early stationary phase (in BHI without added salt) at 37 °C without agitation. An additional aliquot of the L. monocytogenes inoculum was serially diluted and plated onto BHI agar to ensure that the number of bacteria that had been used for infection was as expected, based on previous enumeration of the frozen aliquots. At 30 min postinfection, pre-warmed BHI media containing 50 μg/ml gentamicin (Invitrogen Ltd.) was added to the plates to kill extracellular bacteria. Intracellular L. monocytogenes numbers were determined 90 min postinfection. The invasion efficiency (expressed as a percentage) was calculated by using the ratio of the number of bacterial cells that survived the gentamicin assay to the total number of bacterial cells added initially to each well. Invasion efficiency values did not follow a normal distribution and were thus log-transformed to satisfy this assumption. Invasion efficiencies were analyzed using a one-way analysis of variance (one-way ANOVA, α = 0.05); Tukey’s HSD was used to assess the significance of differences between strains.
3. Results
3.1. L. monocytogenes strains differ in the relative contributions of σB and PrfA to growth under salt stress conditions
Three L. monocytogenes parent strains representing lineages I (serotype 1/2b), II (serotype 1/2a), and IV (serotype 4a) were grown for 20 days in BHI broth with 1.9 M (11%) NaCl at 25 °C without aeration. The parent strains showed significant differences in growth differential (log10[final population] − log10[initial population]) (p-value = 0.044, one-way ANOVA), lag phase (p-value = 0.001, one-way ANOVA) and maximum growth rate (p-value = 0.003, one-way ANOVA). Specifically, the lineage I parent strain showed a significantly shorter lag phase as compared to the lineage II and IV parent strains (p-value = 0.002 for both, Tukey’s HSD). The lineage IV parent strain showed a significantly lower maximum growth rate as compared to the lineage I (p-value = 0.004, Tukey’s HSD) and lineage II (p-value = 0.007, Tukey’s HSD) parent strains.
Differences, in growth parameters under salt stress conditions, between the lineage I, II and IV parent strains and their isogenic mutants were also observed (Table 2). Specifically, lineage I and II strains that lacked sigB (ΔsigB and ΔsigBΔprfA) showed significantly longer lag phase as compared to their respective parent strains (p-value < 0.02 for all comparisons; Tukey’s HSD); conversely, the lag phase duration of all three lineage IV mutant strains did not differ statistically (p-value > 0.05, Tukey’s HSD) from that observed for their respective parent strain, indicating possible σB- and PrfA-independent mechanisms of salt stress adaptation during lag phase. In addition, the lineage II ΔsigBΔprfA strain (p-value < 0.001, Tukey’s HSD) and the lineage IV ΔprfA (p-value = 0.028; Tukey’s HSD) and ΔsigBΔprfA (p-value = 0.032; Tukey’s HSD) strains showed significantly higher growth rates than their respective parent strains (Fig. 1B and C, Table 2). The lineage I ΔsigBΔprfA strain showed significantly higher final populations than its parent strain (p-value = 0.013; Tukey’s HSD). Conversely, the lineage II ΔsigBΔprfA strain showed a significantly lower final population than its parent strain (p-value = 0.001; Tukey’s HSD). Moreover, the two lineage II strains with sigB deletions (i.e., ΔsigB and ΔsigBΔprfA mutant strains) seemed to be entering death phase after two days of exponential growth without entering an apparent stationary phase (see Fig. 1).
Table 2.
Growth parameters of L. monocytogenes 1/2b, 1/2a and 4a in BHI broth with 11% NaCl at 25 °C.
| Strain | Genotype | Lag phase (h)a | Growth rate (log CFU/ml * day)a | Population increasea,b (log CFU/ml) |
|---|---|---|---|---|
| Lineage I, serotype 1/2b | ||||
| FSL J1–194 | Parent | 33.4 ± 3.49 | 0.108 ± 0.01 | 2.95 ± 0.07 |
| FSL C6–001 | ΔsigB | 60.5 ± 0.63c | 0.099 ± 0.02 | 3.60 ± 0.16 |
| FSL C6–004 | ΔprfA | 36.0 ± 1.64 | 0.103 ± 0 | 3.33 ± 0.39 |
| FSL C6–005 | ΔsigBΔprfA | 54.0 ± 6.24c | 0.117 ± 0.02 | 3.90 ± 0.34c |
| Lineage II, serotype 1/2a | ||||
| FSL X1–001 | Parent | 60.9 ± 6.80 | 0.104 ± 0.01 | 3.75 ± 0.09 |
| FSL A1–254 | ΔsigB | 115.5 ±23.62c | NDd | NDd |
| FSL B2–046 | ΔprfA | 48.21 ± 6.86 | 0.122 ± 0.02 | 3.90 ± 0.21 |
| FSL B2–068 | ΔsigBΔprfA | 101.5 ± 1.85c | 0.208 ± 0.02c | 2.54 ± 0.01c |
| Lineage IV, serotype 4a | ||||
| FSL J1–208 | Parent | 62.78 ± 5.95 | 0.059 ± 0.02 | 3.74 ± 0.51 |
| FSL O1–005 | ΔsigB | 67.38 ± 10.59 | 0.065 ± 0.02 | 3.57 ± 0.56 |
| FSL C6–009 | ΔprfA | 50.44 ± 0.64 | 0.119 ± 0.03c | 4.00 ± 0.10 |
| FSL C6–007 | ΔsigBΔprfA | 47.33 ± 8.24 | 0.118 ± 0.02c | 3.51 ± 0.73 |
Data represent the average and standard deviations for three independent biological replicates.
Difference between the inoculum and final population.
Indicates if the value for a mutant differs statistically significantly from the value for the parent strain (p-value < 0.05).
ND—not determined; growth rate and population increase for FSL A1–254 were not calculated due to the short exponential phase (yielding insufficient time points to calculate the growth rate) and due to the rapid entry into death phase.
Fig. 1.
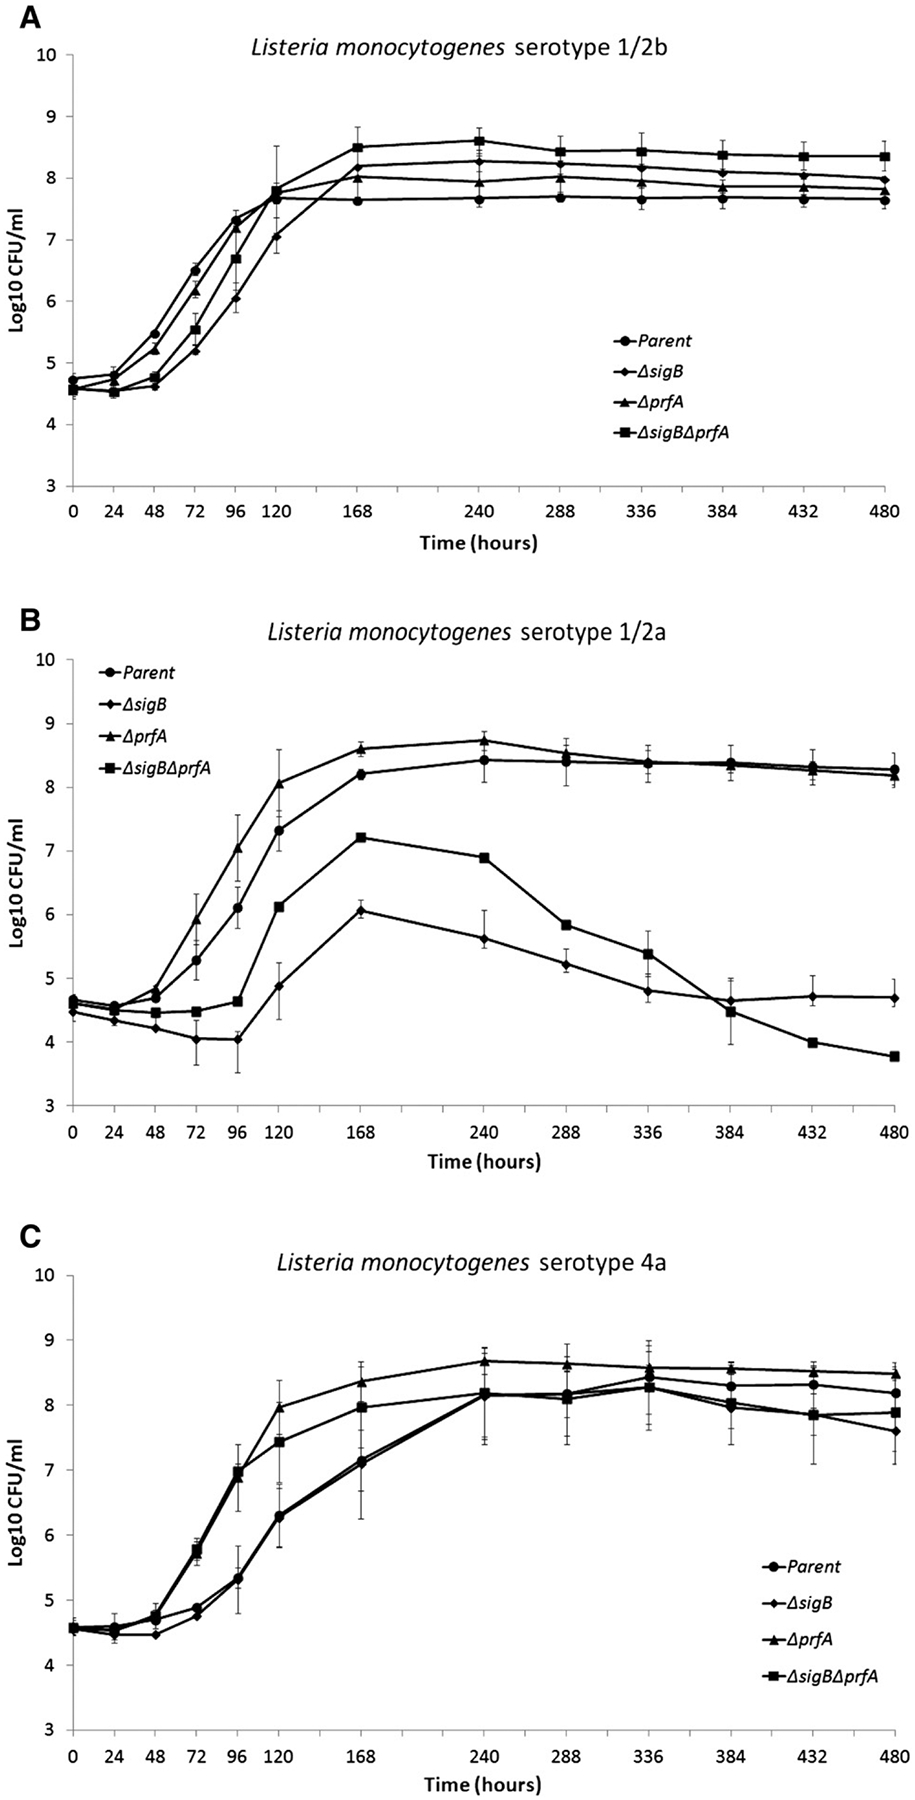
Growth patterns at 25 °C and in the presence of 11% salt for (A) L. monocytogenes FSL J1–194 (serotype 1/2b and lineage I) and its isogenic ΔsigB, ΔprfA, and ΔsigBΔprfA strains; (B) L. monocytogenes FSL X1–001 (serotype 1/2a and lineage II) and its isogenic ΔsigB, ΔprfA, and ΔsigBΔprfA strains; and (C) L. monocytogenes FSL J1–208 (serotype 4a and lineage IV) and its isogenic ΔsigB, ΔprfA, and ΔsigBΔprfA strains. Data represent the mean of at least three biological replicates. Error bars represent standard deviations (SD).
3.2. Contributions of σB and PrfA to invasion of Caco-2 cells and hemolytic activity by L. monocytogenes cells are similar among the tested strains representing different lineages
Contributions of σB to virulence-associated phenotypes were characterized in vitro by using hemolysis and tissue culture invasion assays. The lineage I parent strain showed significantly higher invasion efficiency (p-value < 0.003 for both comparisons against lineage II and IV parent strains; Tukey’s HSD) as compared to the other two parent strains (Fig. 2). Lineage I, II, and IV parent strains had significantly (p-value < 0.02 for all comparisons; Tukey’s HSD) higher invasion efficiencies in Caco-2 epithelial cells than their isogenic ΔsigB and ΔsigBΔprfA mutants (Fig. 2). However, no significant difference in invasion efficiency was found between the lineage I, II and IV parent strains and their respective ΔprfA mutants. Overall, σB significantly contributed to invasion of Caco-2 cells by L. monocytogenes lineage I, II, and IV parent strains while PrfA did not appear to contribute to invasion by these three strains under the same conditions.
Fig. 2.
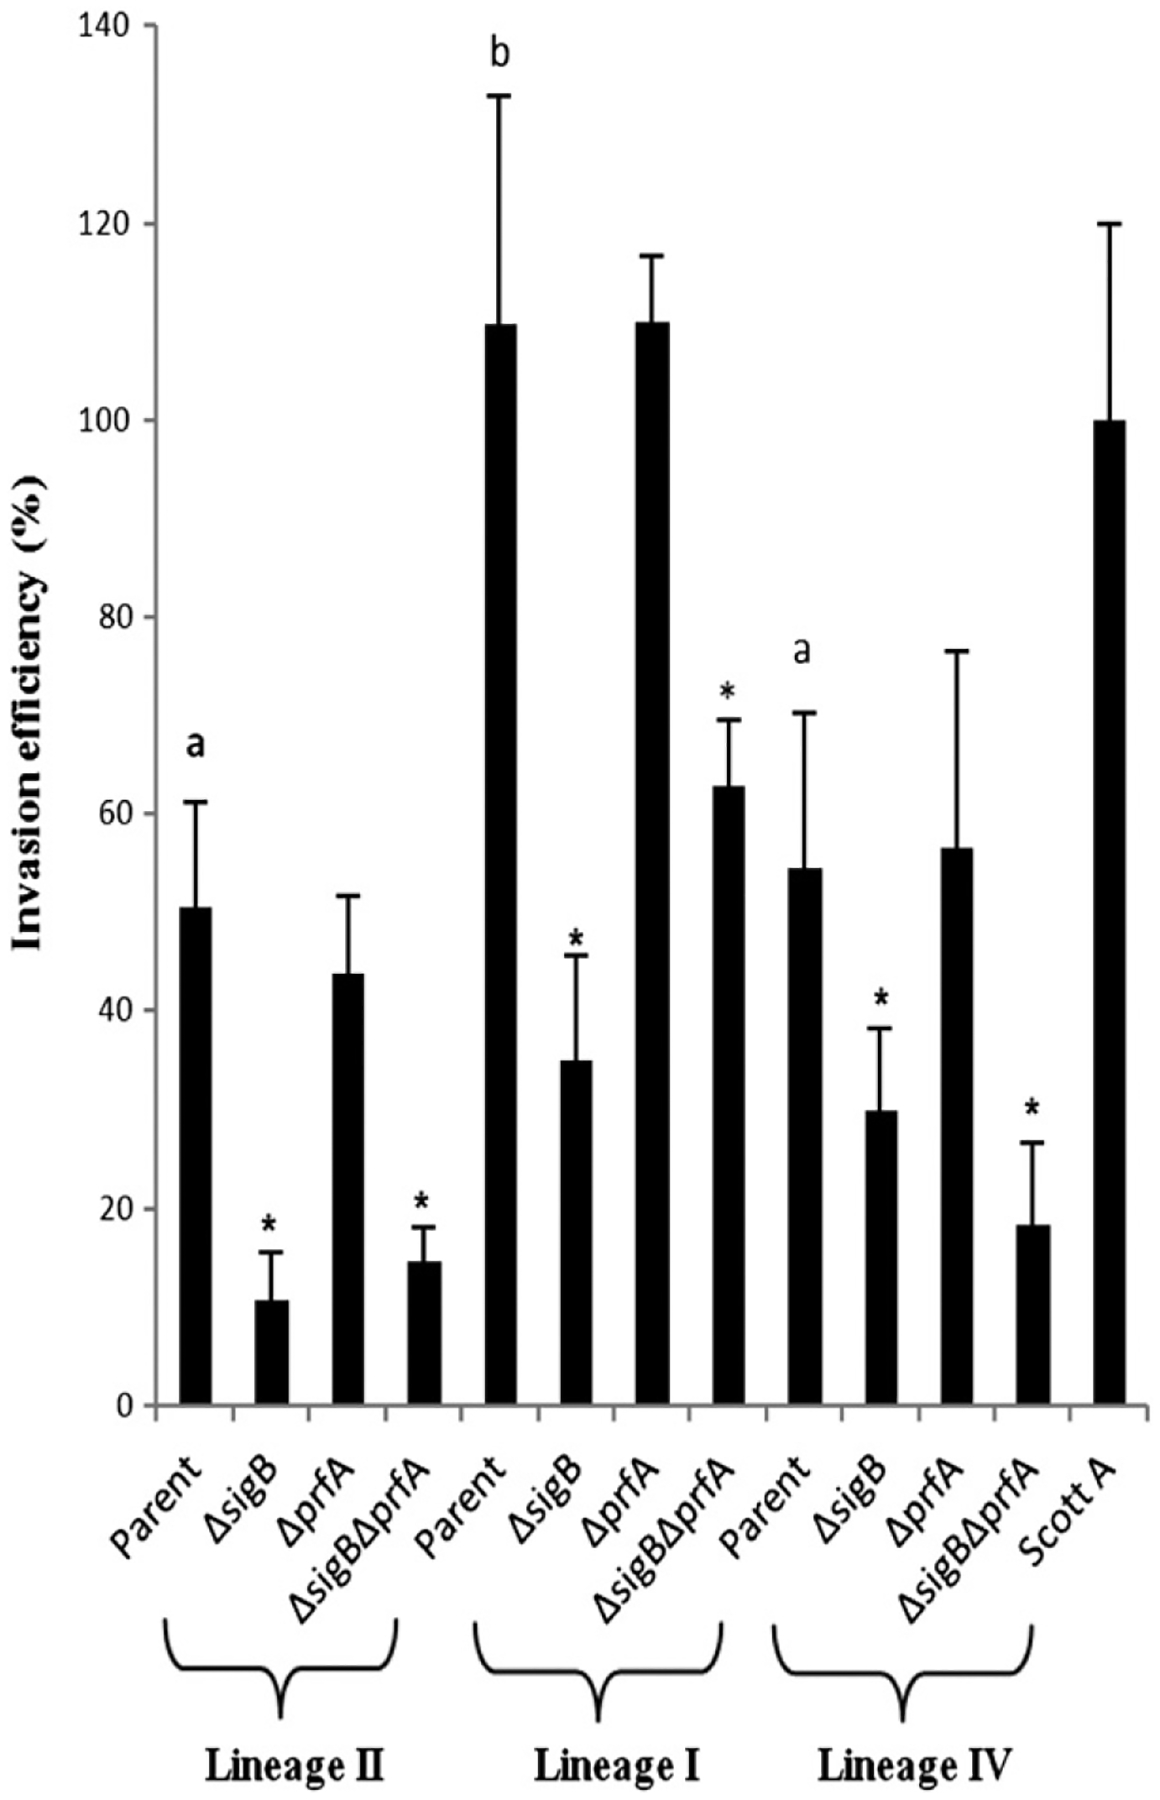
Caco-2 invasion efficiencies of Listeria monocytogenes parent and mutant strains. Bacteria were grown to early stationary phase (growth to OD600 = 1.0, followed by 3 h of incubation) with aeration (i.e., shaking at 220 rpm) at 37 °C. Invasion assays were performed at 37 °C. For the graphical representation of the invasion assay results, the invasion efficiency of strain Scott A (last strain at the right side) was set to 100% and the invasion efficiency of all other strains is represented as percentages relative to that of strain Scott A. Data represent the mean of at least three biological replicates. Error bars represent SD. * indicates a p-value < 0.05 (mutants in comparison with their parent strains; calculated based on log-transformed absolute, non-normalized numbers). Different letters on top of parent strain bars represent significant differences in invasion among parent strains.
A hemolysis assay using sheep red blood cells showed no significant difference in hemolytic activity (p-value > 0.05) among parent strains (Table 3). Significantly reduced hemolytic activities (p-value < 0.05; Tukey’s HSD) were observed for ΔprfA and ΔsigBΔprfA strains as compared to their respective parent strains across all three lineages (Table 3), but no difference was observed between the parent strains and their respective ΔsigB mutants. These results suggest that PrfA has a positive effect on hemolytic activity across different lineages in L. monocytogenes while σB apparently does not play an important role in this activity, at least under the condition tested.
Table 3.
Hemolytic activity of whole-cell suspension of L. monocytogenes lineages I, II and IV strains.
| Strain | Genotype | Avg. no. of hemolytic unitsa |
|---|---|---|
| Lineage I, serotype 1/2b | ||
| FSL J1–194 | Parent | 24.0 ± 13.0 |
| FSL C6–001 | ΔsigB | 21.9 ± 9.0 |
| FSL C6–004 | ΔprfA | <2.0 ± 0.0b |
| FSL C6–005 | ΔsigBΔprfA | <2.0 ± 0.0b |
| Lineage II, serotype 1/2a | ||
| FSL X1–001 | Parent | 21.4 ± 9.0 |
| FSL A1–254 | ΔsigB | 16.0 ± 2.0 |
| FSL B2–046 | ΔprfA | <2.0 ± 1.0b |
| FSL B2–068 | ΔsigBΔprfA | <2.0 ± 0.0b |
| Lineage IV, serotype 4a | ||
| FSL J1–208 | Parent | 16.0 ± 2.0 |
| FSL O1–005 | ΔsigB | 12.0 ± 2.0 |
| FSL C6–009 | ΔprfA | <2.0 ± 0.0b |
| FSL C6–007 | ΔsigBΔprfA | <2.0 ± 1.0b |
Hemolytic unit is defined as the reciprocal of the dilution at which 50% lysis of sheep red blood cells occurred; data represent the average and standard deviations for three independent biological replicates.
p-Value < 0.05 when data are compared with those from the parent using Tukey’s HSD.
3.3. Transcriptional analysis of potential σB-dependent genes under high salt stress conditions
In order to explore the mechanism that may contribute to the extended lag phase observed for the ΔsigB mutant during growth in media with 1.9 M NaCl and no aeration at 25 °C, microarray was performed at 30 min after inoculation (i.e., salt shock) to compare transcript levels between the lineage I, serotype 1/2b, parent strain and its isogenic ΔsigB mutant strain. An adjusted p-value <0.05 and a fold change (FC) ≥1.5 in gene expression between the parent strain and the ΔsigB mutant strain or between the ΔsigB mutant strain and the parent strain were used as the cutoff criteria to consider a gene significantly up- or down-regulated by σB, respectively. Using these criteria, we identified 135 σB down-regulated and 173 σB up-regulated genes (Tables S1 and S2, respectively). Overall, 102 of the 173 σB up-regulated genes had previously been found as being σB-dependent in microarray, RNA-Seq, and proteomics studies using other growth conditions and/or strains (Abram et al., 2008a, 2008b; Hain et al., 2008; Mujahid et al., 2013; Oliver et al., 2009, 2010; Ollinger et al., 2009; Raengpradub et al., 2008). Therefore, 71 new σB up-regulated genes were identified in this study suggesting that these genes may only be transcribed in a σB-dependent fashion under certain conditions, including during lag phase salt shock (without aeration) at 25 °C. These 71 genes newly identified as being up-regulated by σB are listed in Supplemental Table 2 along with all the other σB up-regulated genes identified in this study. Among the 71 newly identified genes up-regulated by σB, genes presenting a FC ≥ 2.00 (17 genes) as well as genes also previously identified by Raengpradub et al. (2008) with FC ≥ 1.5 (6 genes, discussed below) are shown in Table 4. Among the newly identified σB-dependent genes are cspL (lmo1364, encoding a cold shock protein, FC = 2.63), lmo0903 (encoding a putative osmotically inducible protein involved in stress response, similar to OsmC, FC = 2.41), and lmo2174 (encoding a GGDEF domain protein, involved in signal transduction by synthesizing cyclic di-GMP, FC = 4.49). The six genes that were so far only identified as σB-up-regulated in this study and in another genome-wide microarray study (Raengpradub et al., 2008) that also applied salt shock to cells (Table 4) include lmo2256 (encoding a putative intracellular protease similar to a general stress protein from Bacillus subtilis, FC = 3.71), and sigH (lmo0243, encoding the alternative σ factor σH, FC = 1.78).
Table 4.
Selected genes newly identified as σB-up-regulated and genes identified as σB-up-regulated only during salt stress.a
| Locus | Function | Fold change | p-Valueb |
|---|---|---|---|
| Genes newly identified as σB-up-regulated with FC > 2.0c | |||
| Lmo2174d | GGDEF domain protein putatively involved in signal transduction and cell differentiation; function is to synthesize cyclic di-GMP | 4.49 | 0.002 |
| LMOf2365_0800 | PTS system, IIAB component | 3.85 | 0.001 |
| Lmo0530d | Putative cellulose synthase; this enzyme is activated by cyclic di-GMP | 3.51 | 0.017 |
| LMOh7858_1020 | Glucosamine-6-phosphate isomerase | 3.49 | 0.001 |
| Lmo0197 | Similar to B. subtilis SpoVG protein | 3.25 | <0.001 |
| Lmo1364 (cspL) | Cold shock protein | 2.63 | 0.002 |
| Lmo0527d | Putative membrane protein | 2.54 | 0.001 |
| Lmo0903 | OsmC/Ohr family protein | 2.41 | <0.001 |
| Lmo0186 | B. subtilis YabE protein homolog lmo0186 | 2.37 | 0.012 |
| Lmo0486 (rpmF) | Ribosomal protein L32 | 2.24 | 0.042 |
| Lmo0223 (cysK) | Cysteine synthase A | 2.19 | 0.005 |
| Lmo0245 (secE) | Highly similar to preprotein SecE translocase subunit | 2.16 | 0.001 |
| Lmo0393 | Conserved hypothetical protein | 2.10 | 0.001 |
| LMOh7858_2006 | Chitinase | 2.09 | 0.001 |
| Lmo0242 | Conserved hypothetical protein | 2.07 | 0.009 |
| Lmo2037 (mraY) | Phospho-N-acetylmuramoyl-pentapeptide-transferase | 2.06 | 0.001 |
| Lmo2795 | Phosphosugar-binding transcriptional regulator, RpiR family | 2.00 | 0.005 |
| σB-Dependent genes only up-regulated under salt stresse | |||
| Lmo2256 | Intracellular protease, PfpI family | 3.71 | 0.016 |
| Lmo0653 | Conserved hypothetical protein | 1.93 | 0.026 |
| Lmo2490 | Conserved hypothetical protein | 1.87 | 0.007 |
| Lmo0243 | RNA polymerase alternative σ factor, σH | 1.78 | 0.001 |
| Lmo0137 | Oligopeptide ABC transporter, permease protein | 1.66 | 0.049 |
| Lmo1027 | Similar to conserved hypothetical proteins | 1.50 | 0.001 |
Genes found to be up-regulated by σB in this study were compared to σB up-regulated genes identified by Raengpradub et al. (2008), Ollinger et al. (2009), Oliver et al. (2009), Oliver et al. (2010), Mujahid et al. (2013), Abram et al. (2008a, 2008b) and Hain et al. (2008). A minimum fold change (FC) ≥ 1.5 and an adjusted p-value < 0.05 were considered significant for microarray and proteomics studies. For the RNA-seq study (Oliver et al., 2009), the criteria used was the same as those used in the original study. Genes only identified here were considered “genes newly identified as σB-up-regulated”, while genes identified here and by Raengpradub et al. (2008) (the only other study using transcriptomics who defined the σB regulon under salt stress conditions) were considered “σB-up-regulated only during salt stress”.
Adjusted p-values.
Only genes with FC ≥ 2.0 are shown here; for a complete list (which includes genes with an FC between 1.5 and 2.0), see Supplemental Table 2.
Genes with σB-dependent promoters identified upstream the transcription unit based on RNA-Seq data (Orsi et al., unpublished data).
The genes under this subheader were identified as σB-up-regulated with FC ≥ 1.5 and significant p-value (adjusted p-value < 0.05) only in this work and in the salt-stress experiment carried out by Raengpradub et al. (2008).
Other noteworthy genes that were previously identified as being positively regulated by σB and also showed significantly higher transcript levels in the parent strain as compared to the ΔsigB mutant strain in our study include inlD (LMOf2365_0282, encoding internalin D, FC = 8.07), glpK (lmo1538, encoding a glycerol kinase, FC = 6.96), resD (lmo1948, encoding a protein similar to the two-component response regulator ResD, FC = 2.05) and gabD (lmo0913, encoding a succinic semialdehyde dehydrogenase SSDH, GabD, FC = 14.62). Genes previously identified as being down-regulated by σB and that also showed significantly lower transcript levels in the parent strain as compared to the ΔsigB mutant strain in this study include dnaK (lmo0348, encoding a dihydroxyacetone kinase, FC = −10.98), groES (lmo2069, encoding a class I heat-shock protein GroES, FC = −3.86) and grpE (lmo1474, encoding a co-chaperone GrpE, FC = −1.94). Surprisingly, fri (lmo0943, encoding a non-heme iron-binding ferritin, FC = −2.36), which had been shown to be positively regulated by σB in a lineage II strain under salt shock (0.3 M NaCl) at 37 °C with aeration (Raengpradub et al., 2008), showed σB-dependent down-regulation in our study (1.9 M NaCl, no aeration, and incubation at 25 °C), suggesting a lineage-specific regulation by σB or a salt concentration-, aeration- and/or temperature-dependent regulation of this gene by σB.
GSEA identified one role category, “Transport and binding proteins: Carbohydrates, organic alcohols and acids”, as overrepresented among the σB down-regulated genes (FDR < 0.034) (Supplemental Table 3). GSEA was not able to identify overrepresented role categories among σB up-regulated genes (Supplemental Table 4).
3.4. Confirmation of select differentially expressed genes in lineage I by TaqMan qRT-PCR
We used TaqMan qRT-PCR to confirm differences in transcript levels between the parent and ΔsigB mutant strains for select genes that were σB-dependent in the lineage I strain based on microarray analyses. As previous studies (Chan et al., 2007; McGann et al., 2007; Ollinger et al., 2009) showed that transcription of gltX and inlD is up-regulated by σB in a lineage II strain, we used TaqMan qRT-PCR to confirm that these genes were also up-regulated by σB in the lineage I strain used in this study. We also assessed the transcript levels of the fri gene in both the parent and ΔsigB mutant strain since this gene had previously been shown to be positively regulated by σB under salt shock in a lineage II strain (Raengpradub et al., 2008). We confirmed that the gltX and inlD transcript copy numbers were numerically higher in the parent strain than in the isogenic ΔsigB mutant (p-value = 0.098 and p-value =0.006, respectively; one-sided one-sample t-test). We also confirmed that fri transcript copy numbers were numerically lower in the parent strain than in the isogenic ΔsigB mutant strain (p-value = 0.009; one-sided one-sample t-test), suggesting negative regulation by σB in the lineage I strain under the conditions used in our study (Supplemental Table 5).
4. Discussion
In this study we challenged three L. monocytogenes strains representing three distinct lineages (i.e., I, II and IV) to a stress condition (growth with 1.9 M NaCl with no aeration at 25 °C) that may more closely than previous studies reflect salt stress conditions. L. monocytogenes can be experienced in certain foods or food associated environments. We also assessed the contributions of two important transcriptional regulators (i.e., σB and PrfA) to two major aspects of virulence, invasion of intestinal epithelial cells and hemolytic activity. Finally, we used microarrays to assess the transcriptional profiles of a parent strain and a ΔsigB isogenic mutant strain representing lineage I, serotype 1/2b, to investigate the σB regulon in this strain under these food-relevant stress conditions.
4.1. Heterogeneity in the contributions of σB in strains from different lineages during growth with high salt stress
Strains were shifted from growth to early stationary phase in BHI broth with aeration at 37 °C to growth in BHI broth with 1.9 M NaCl and incubated with no aeration at 25 °C for a period of 480 h. The lineage I strain presented a shorter lag phase after the condition shift as compared to the lineage II and IV strains. A previous study showed that lineage I isolates, belonging to serotype 4b, also showed shorter lag phase, as compared to lineage II isolates belonging to serotype 1/2a, when the strains were shifted to growth at 37 °C after being grown for four weeks at 4 °C (Buncic et al., 2001). Similarly, Bergholz et al. (2010) also observed a numerically shorter lag phase duration for lineage I strains grown in BHI with 6% NaCl at 7 °C as compared to lineage II strains. Another study, however, found that lineage I isolates had longer lag phases than lineage II isolates when the strains were shifted from growth in BHI broth at 37 °C for 24 h to growth in BHI broth adjusted to pH 6.5 with 0.1 M lactate at 5 °C (De Jesús and Whiting, 2003). As a shorter lag phase after environmental shifts suggests that the isolate can adapt faster to the environmental change, it is possible that the ability of lineage I isolates to more readily adapt to some environmental changes such as body temperature and high osmolarity, as represented by the shorter lag phases observed upon shifts to these conditions, could be associated with the higher virulence potential observed for lineage I isolates as compared to lineage II isolates (Chen et al., 2006). On the other hand, it is also possible that lineage II isolates have adapted to rapidly respond to environmental changes usually found during food processing and storage such as low temperature, which may be associated with the higher prevalence, of isolates belonging to this lineage, in foods (Orsi et al., 2011). Similarly, the lower growth rate observed for the lineage IV strain in comparison to the other two strains may help explain why isolates belonging to lineage IV are rarely isolated from foods (Orsi et al., 2011).
Differences in terms of σB contribution to growth in high osmolarity with no aeration at 25 °C were also observed for the different strains tested here. Our results suggest that in the lineage I and lineage II strains tested, σB contributes to adaptation of L. monocytogenes after shift from growth in rich media (i.e., BHI broth) with aeration at 37 °C to salt stress (1.9 M NaCl) with no aeration at 25 °C. Other studies have also shown that σB is highly active during the initial period after a salt-shock and up-regulates the expression of several genes involved in the general stress response (Raengpradub et al., 2008; Ringus et al., 2012). Interestingly, in our study, the lineage I parent strain presented a lower final population than its respective ΔsigB mutant when grown in the presence of 1.9 M NaCl at 25 °C, suggesting that expression of σB and the σB regulon may represent a significant energy cost to the cells after exponential phase is reached. The two lineage II mutant strains that did not express sigB (i.e., ΔsigB and ΔsigBΔprfA strains) both entered an apparent death phase after two days of exponential growth without entering an apparent stationary phase. This illustrates the importance of σB for the lineage II strain in comparison to the lineage I and IV strains, which appear to enter into stationary phase normally even when not expressing sigB (i.e. in the ΔsigB mutant strains). Similarly, in a previous study using the same strains used in this study, σB showed the highest contributions in survival to acid and oxidative stresses in the lineage II strain as compared to the lineage I and lineage IV strains (Oliver et al., 2010). PrfA apparently has no influence on adaptation to salt stress in L. monocytogenes strains since ΔprfA strains showed similar behavior compared to their respective parent strains, especially for lineages I and II. Additional studies using other strains of these lineages of L. monocytogenes need to be conducted in order to confirm whether these differences regarding growth behavior are specific to the strains used in this study or represent broader differences between L. monocytogenes lineages. Complementation of the deleted genes (i.e., sigB or prfA) might be necessary in these additional studies if strain-specific differences are observed.
4.2. PrfA, but not σB contributes to L. monocytogenes hemolytic activity while σB, but not PrfA, contribute to intestinal epithelial cell invasion
The lineage I strain presented a higher invasion efficiency than the other two parent strains, which is in agreement with previous studies that showed that lineage I strains have a higher pathogenic potential than strains from other lineages (Buncic et al., 2001; Chen et al., 2006; Gray et al., 2004; Weis and Seeliger, 1975; Wiedmann et al., 1997) and a higher invasion efficiency than strains from other lineages (Jacquet et al., 2004; Nightingale et al., 2008; van Stelten et al., 2010). However, this difference has been attributed mostly to a higher prevalence, in lineage II strains, of premature stop codons in inlA, which encodes the internalin protein necessary for efficient invasion into epithelial cells (Jacquet et al., 2004; Nightingale et al., 2008; van Stelten et al., 2010). Since none of the strains used in this study present a premature stop codon in inlA, another feature is probably involved in the higher invasion efficiency observed for the lineage I strain in this study. Only σB showed a significant contribution to invasion in all three strains. Although the contribution of σB to epithelial cell invasion has been documented in a number of studies (Garner et al., 2006; Kim et al., 2004, 2005), other studies have also found PrfA to contribute to host cell invasion, although PrfA contributions to invasion were typically lower than the σB contributions (Garner et al., 2006; Ivy et al., 2010). As it is well established that transcription of inlA, which encodes a key protein involved in invasion of human cells expressing E-cadherin, is regulated by both σB and PrfA (Kim et al., 2005; Lingnau et al., 1995; McGann et al., 2008), these observation likely reflect the fact that σB and PrfA are activated by different conditions.
All three parent strains presented similar hemolytic activities. Similarly, previous studies have found similar plaquing efficiencies of lineage III and IV strains compared to lineage II strains (Roberts et al., 2006), while another study observed higher plaquing efficiency among lineage III and IV strains compared to lineage II strains (Wiedmann et al., 1997). Although Raengpradub et al. (2008) observed a lower expression of the gene hly in a lineage II parent strain in comparison to its isogenic ΔsigB mutant strain when a salt shock was applied to the culture (with 0.3 M NaCl, incubation with aeration at 37 °C), no contribution of σB to the hemolytic activities of the three strains was observed, at 25 °C, in the study reported here (1.9 M NaCl, incubated with no aeration), possibly again reflecting that σB and PrfA potentially show temperature-, salt concentration- and/or aeration-dependent transcription and/or activation (temperature-dependent prfA translation has clearly been established (Johansson et al., 2002)). It has been suggested that a σB-dependent promoter exists upstream of hly (Orsi et al., 2011) however, transcriptional activity from that promoter has not been shown to date. Reduced hemolytic activities were only observed for ΔprfA mutants consistent with the PrfA-dependent nature of hly transcription observed in previous studies (Bohne et al., 1994; Nadon et al., 2002; Ollinger et al., 2009; Sheehan et al., 1995).
4.3. Transcription profile of the lineage I serotype 1/2b strain after salt shock at 25 °C with no aeration reveals new σB-dependent up-regulated genes and salt-shock-specific σB-dependent up-regulated genes
Although several studies have investigated the σB regulon using microarray (Hain et al., 2008; Oliver et al., 2010; Ollinger et al., 2009; Raengpradub et al., 2008), RNA sequencing (Oliver et al., 2009), and proteomics (Abram et al., 2008a, 2008b; Mujahid et al., 2013), the majority of these studies have only used lineage II strains (i.e., 10403S and EGD-e). Moreover, only one other transcriptomic study (Raengpradub et al., 2008) analyzed the genome-wide contributions of σB to transcription during salt-shock stress, but with conditions different than those used in this study (i.e., growth with 0.3 M NaCl with aeration at 37 °C versus growth with 1.9 M NaCl without aeration at 25 °C used here). The conditions used here permitted the identification of new σB-dependent genes and, in conjunction with prior work by Raengpradub et al. (2008), who applied salt-shock to L. monocytogenes at 37 °C, permitted initial identification of possible salt-shock-specific σB-dependent genes.
Among the total of 71 genes newly identified as being up-regulated by σB, a gene (lmo2174) encoding a GGDEF domain protein presented the highest fold change (FC = 4.49). Proteins with this domain are involved in signal transduction by synthesizing cyclic di-GMP, an intracellular signaling molecule. Proteins with this domain have been involved in processes such as exopolysaccharide synthesis, biofilm formation, motility and cell differentiation. Further Hidden Markov Model analyses using the EMBL-EBI-based InterProScan Signature Recognition Search Against the Integrated Resources of Protein Domains and Functional Sites (http://www.ebi.ac.uk/Tools/pfa/iprscan/) revealed two other domains in this protein. One domain belongs to guanylate cyclases (IPR001054), which catalyze the formation of cyclic GMP from GTP. Lmo2174 also presents a transmembrane region (IPR11620) commonly found among signal transduction histidine kinases of the LytS-YhcK type, which probably regulate genes involved in cell wall metabolism. Interestingly, L. monocytogenes cells challenged with ≥6% NaCl were previously shown to form thicker sections in the cell envelope at the septum or other areas of the cell (Zaika and Fanelli, 2003). In Escherichia coli, the yjbEFGH operon, involved in production of an unknown exopolysaccharide was shown to be induced by osmotic stress. This operon was shown to be negatively regulated by the general stress response σ factor RpoS, the analog of σB, although expression of this operon in the presence of RpoS was also observed (Ionescu and Belkin, 2009). Increased levels of exopolysaccharides have also been observed in response to osmotic stress in Pseudomonas spp. (Sandhya et al., 2010) and exopolysaccharides were also reported to protect Synechocystis cells against salt stress (Jittawuttipoka et al., 2013). A visual search in the region upstream lmo2174 identified a putative σB-dependent promoter region 31 nt upstream the start codon of this gene. The putative promoter sequence (GAAT-N16-GGGTAT) greatly resembles the consensus sequence (GTTT-N16-GGGTAT) for σB-dependent promoters in L. monocytogenes (Oliver et al., 2009). Moreover, among the newly identified σB-dependent up-regulated genes is a gene (lmo0530) encoding a putative cellulose synthase subunit B (IPR018513), which is activated by cyclic di-GMP, the product of Lmo2174. In Acetobacter xylinum, this gene, bcsB, is part of a four-gene operon, bscABCD, with all genes in the operon required for maximum bacterial cellulose synthesis (Wong et al., 1990). In L. monocytogenes, lmo0530 is part of a five-gene operon (lmo0527–lmo0531). Although two other genes in this operon, lmo0527 and lmo0529, were also found to be up-regulated by σB in this study, none of the genes in this operon have defined function. While three genes in this operon encode proteins with a transmembrane region (lmo0527, lmo0528 and lmo0530), one (lmo0529) encodes a protein with a transmembrane domain and a glycosyl transferase domain and one (lmo0531) encodes a protein with GGDEF and guanylyl cyclase domains and, therefore, may be involved with signal transduction through synthesis of cyclic di-GMP. In L. monocytogenes strain 10403S, this operon seems to be co-regulated by σA, the housekeeping σ factor, and σB. A σB-dependent promoter 137 nt upstream the start codon of lmo0527 was identified by transcriptional start site mapping using RNA sequencing (Orsi et al., in preparation). The σA-dependent promoter is upstream this σB-dependent promoter and transcription initiation from both promoters was observed in stationary phase cells incubated at 37 °C (Orsi et al., in preparation). Therefore, we are suggesting a model in which salt-shock induces transcription of lmo2174 and the lmo0527–lmo0531 operon leading to production of (i) a cyclic di-GMP synthase/histidine kinase double functional enzyme (Lmo2174) that senses the osmolarity change and synthesizes cyclic di-GMP, and (ii) a cyclic di-GMP-activated complex (encoded by one or more genes in the lmo0527–lmo0531 operon). These gene expression changes may allow for enhanced synthesis of exopolysaccharides in response to osmolarity changes, facilitating bacterial survival under these stress conditions. Further studies will be required to investigate the function of these genes and to test the model presented above.
Other genes newly identified as up-regulated by σB include lmo0903 and cspL. lmo0903 encodes a peroxiredoxin, OsmC/Ohr-like protein. In E. coli, this protein is osmotically induced although it can also be induced under other conditions (Gordia and Gutierrez, 1996). cspL encodes a cold shock protein shown to be up-regulated during growth at 4 °C in L. monocytogenes (Chan et al., 2007). Six genes were found to be up-regulated by σB only in this study and in another transcriptomic study that also applied salt-shock to cells (Raengpradub et al., 2008). Although three of these six genes encode hypothetical proteins, one gene (lmo2256) encodes an intracellular cysteine peptidase similar to a general stress protein 18, GSP18 from B. subtilis (IPR06286) and one (lmo0137) encodes an oligopeptide ABC transporter. Interestingly, a third gene identified as σB-up-regulated both here and in the previous salt stress study by Raengpradub et al. (2008) is sigH (lmo0243), which encodes the alternative σ factor σH. While to date, no role in salt stress survival and growth has been attributed to σH in L. monocytogenes, the L. monocytogenes σH and σB regulons have been shown, in a previous study, to overlap (Chaturongakul et al., 2011), consistent with our findings here. None of the six genes identified as being salt-shock-stress specific in these two transcriptomic studies (this study; Raengpradub et al., 2008) were identified as being σB-dependent in two previous studies that assessed the σB regulon under salt stress using proteomics (Abram et al., 2008a, 2008b). These discrepancies between the microarray and proteomics studies could either reflect the nature of the proteomics approach (e.g., lower detection sensitivity than microarrays, identification of genes that show different protein levels but not different transcript levels) or differences in growth conditions such as media or salt concentration used in each study. Although only six genes showed overlap between this study and the study carried out by Raengpradub et al. (2008), we cannot rule out the possibility that other genes among the 71 genes newly identified as being σB-dependent are also only differentially expressed under salt stress. Additional microarray studies using corresponding parent strains and isogenic sigB knock-out mutant, not exposed to salt stress, will be needed to definitely determine whether some of the newly identified σB up-regulated genes are induced only in salt stress condition.
Gene Set Enrichment Analysis (GSEA) showed that genes involved in transport and binding of carbohydrate, organic alcohols and acids were enriched for σB down-regulated genes. This may suggest that once the salt shock is applied using rich BHI media, which happened 30 min before RNA extraction, the cells seem to prioritize the response to the salt stress over acquisition of carbohydrates and other energy sources as previously observed (Bergholz et al., 2012). This shows how L. monocytogenes can rapidly regulate gene expression turning specific sets of genes on and off in response to a rapidly changing environment.
5. Conclusions
In order to survive adverse conditions, foodborne pathogens must adapt and alter their gene expression and metabolism to overcome stress conditions encountered during food processing, food storage, and gastrointestinal passage. Here we studied the L. monocytogenes response to salt stress under conditions that may be encountered during food processing as well as storage of some food products (e.g., certain cheeses and cheese products). However, L. monocytogenes is also exposed to salt stress during infection as the human small intestine presents a concentration of 0.3 M NaCl (Chowduhry et al., 1996; Davenport, 1982). Overall, our results indicate that (i) L. monocytogenes strains representing different phylogenetic lineages differ in the relative contributions of σB and PrfA to growth under salt stress conditions, (ii) L. monocytogenes σB, but not PrfA, contributes to epithelial cell invasion while PrfA, but not σB, contributes to hemolytic activity, and (iii) although the σB regulon has been extensively studied, studies using different environmental conditions may still identify new σB-dependent genes that are specifically regulated under those conditions. We have identified a new set of σB-dependent up-regulated genes that we hypothesize may be specifically used to overcome high osmolarity stress by altering the cell wall structure, which may involve σB-upregulated biosynthesis of exopolysaccharides. Future studies, will be needed to test this hypothesis. In addition, our data indicate that future studies applying other conditions may continue to increase our knowledge of the number of genes that are part of the L. monocytogenes σB regulon, furthering our understanding of stress response systems in L. monocytogenes and their contributions to the transmission of this important foodborne pathogen.
Supplementary Material
Acknowledgments
The authors thank Fundação de Amparo a Pesquisa do Estado de São Paulo (FAPESP) (Projects 09/16931-8 and 09/14618-0) for financial support. Partial support for this work was also provided by award number R01A1052151 from the National Institute of Allergy and Infectious Diseases (to K.J.B.).
Footnotes
Supplementary data to this article can be found online at http://dx.doi.org/10.1016/j.ijfoodmicro.2014.02.018.
References
- Abram F, Starr E, Karatzas KA, Matlawska-Wasowska K, Boyd A, Wiedmann M, Boor KJ, Connally D, O’Byrne CP, 2008a. Identification of components of the sigma B regulon in Listeria monocytogenes that contribute to acid and salt tolerance. Appl. Environ. Microbiol 74, 6848–6858. [DOI] [PMC free article] [PubMed] [Google Scholar]
- Abram F, Su WL, Wiedmann M, Boor KJ, Coote P, Botting C, Karatzas KA, O’Byrne CP, 2008b. Proteomic analyses of a Listeria monocytogenes mutant lacking sigmaB identify new components of the sigmaB regulon and highlight a role for sigmaB in the utilization of glycerol. Appl. Environ. Microbiol 74, 594–604. [DOI] [PMC free article] [PubMed] [Google Scholar]
- Avery SM, Buncic S, 1997. Differences in pathogenicity for chick embryos and growth kinetics at 37 degrees C between clinical and meat isolates of Listeria monocytogenes previously stored at 4 degrees C. Int. J. Food Microbiol 34, 319–327. [DOI] [PubMed] [Google Scholar]
- Baranyi J, Roberts TA, 1994. A dynamic approach to predicting bacterial growth in food. Int. J. Food Microbiol 23, 277–294. [DOI] [PubMed] [Google Scholar]
- Bergholz TM, den Bakker HC, Fortes ED, Boor KJ, Wiedmann M, 2010. Salt stress phenotypes in Listeria monocytogenes vary by genetic lineage and temperature. Foodborne Pathog. Dis 7, 1537–1549. [DOI] [PMC free article] [PubMed] [Google Scholar]
- Bergholz TM, Bowen B, Wiedmann M, Boor KJ, 2012. Listeria monocytogenes shows temperature-dependent and -independent responses to salt stress, including responses that induce cross-protection against other stresses. Appl. Environ. Microbiol 78, 2602–2612. [DOI] [PMC free article] [PubMed] [Google Scholar]
- Bishop DK, Hinrichs DJ, 1987. Adoptive transfer of immunity to Listeria monocytogenes. The influence of in vitro stimulation on lymphocyte subset requirements. J. Immunol 139, 2005–2009. [PubMed] [Google Scholar]
- Bohne J, Sokolovic Z, Goebel W, 1994. Transcriptional regulation of prfA and PrfA-regulated virulence genes in Listeria monocytogenes. Mol. Microbiol 11, 1141–1150. [DOI] [PubMed] [Google Scholar]
- Buncic S, Avery SM, Rocourt J, Dimitrijevic M, 2001. Can food-related environmental factors induce different behaviour in two key serovars, 4b and 1/2a, of Listeria monocytogenes? Int. J. Food Microbiol 65, 201–212. [DOI] [PubMed] [Google Scholar]
- Bundrant BN, Hutchins T, den Bakker HC, Fortes E, Wiedmann M, 2011. Listeriosis outbreak in dairy cattle caused by an unusual Listeria monocytogenes serotype 4b strain. J. Vet. Diagn. Invest 23, 155–158. [DOI] [PubMed] [Google Scholar]
- Chan YC, Raengpradub S, Boor KJ, Wiedmann M, 2007. Microarray-based characterization of the Listeria monocytogenes cold regulon in log- and stationary-phase cells. Appl. Environ. Microbiol 73, 6484–6498. [DOI] [PMC free article] [PubMed] [Google Scholar]
- Chaturongakul S, Raengpradub S, Palmer ME, Bergholz TM, Orsi RH, Hu Y, Ollinger J, Wiedmann M, Boor KJ, 2011. Transcriptomic and phenotypic analyses identify coregulated, overlapping regulons among PrfA, CtsR, HrcA, and the alternative sigma factors sigmaB, sigmaC, sigmaH, and sigmaL in Listeria monocytogenes. Appl. Environ. Microbiol 77, 187–200. [DOI] [PMC free article] [PubMed] [Google Scholar]
- Chen Y, Ross WH, Gray MJ, Wiedmann M, Whiting RC, Scott VN, 2006. Attributing risk to Listeria monocytogenes subgroups: dose response in relation to genetic lineages. J. Food Prot 69, 335–344. [DOI] [PubMed] [Google Scholar]
- Chowduhry R, Sahu GK, Das J, 1996. Stress response in pathogenic bacteria. J. Biosci 21, 149–160. [Google Scholar]
- Davenport HW, 1982. Physiology of the Digestive Tract: An Introductory Text, 5th ed. Year Book Medical Publishers, Chicago. [Google Scholar]
- De Jesús AJ, Whiting RC, 2003. Thermal inactivation, growth, and survival studies of Listeria monocytogenes strains belonging to three distinct genotypic lineages. J. Food Prot 66, 1611–1617. [DOI] [PubMed] [Google Scholar]
- Dykes GA, Moorhead SM, 2000. Survival of osmotic and acid stress by Listeria monocytogenes strains of clinical or meat origin. Int. J. Food Microbiol 56, 161–166. [DOI] [PubMed] [Google Scholar]
- Garner MR, Njaa BL, Wiedmann M, Boor KJ, 2006. Sigma B contributes to Listeria monocytogenes gastrointestinal infection but not to systemic spread in the guinea pig infection model. Infect. Immun 74, 876–886. [DOI] [PMC free article] [PubMed] [Google Scholar]
- Gentleman R, Carey V, Bates D, Bolstad B, Dettling M, Dudoit S, Ellis B, Gautier L, Ge Y, Gentry J, Hornik K, Hothorn T, Huber W, Iacus S, Irizarry R, Leisch F, Li C, Maechler M, Rossini A, Sawitzki G, Smith C, Smyth G, Tierney L, Yang J, Zhang J, 2004. Bioconductor: open software development for computational biology and bioinformatics. Genome Biol 5, R80. [DOI] [PMC free article] [PubMed] [Google Scholar]
- Gordia S, Gutierrez C, 1996. Growth-phase-dependent expression of the osmotically inducible gene osmC of Escherichia coli K-12. Mol. Microbiol 19, 729–736. [DOI] [PubMed] [Google Scholar]
- Gray MJ, Zadoks RN, Fortes ED, Dogan B, Cai S, Chen Y, Scott VN, Gombas DE, Boor KJ, Wiedmann M, 2004. Listeria monocytogenes isolates from foods and humans form distinct but overlapping populations. Appl. Environ. Microbiol 70, 5833–5841. [DOI] [PMC free article] [PubMed] [Google Scholar]
- Hain T, Hossain H, Chatterjee SS, Machata S, Volk U, Wagner S, Brors B, Haas S, Kuenne CT, Billion A, Otten S, Pane-Farre J, Engelmann S, Chakraborty T, 2008. Temporal transcriptomic analysis of the Listeria monocytogenes EGD-e sigmaB regulon. BMC Microbiol 8, 20. [DOI] [PMC free article] [PubMed] [Google Scholar]
- Hong E, Doumith M, Duperrier S, Giovannacci I, Morvan A, Glaser P, Buchrieser C, Jacquet C, Martin P, 2007. Genetic diversity of Listeria monocytogenes recovered from infected persons and pork, seafood and dairy products on retail sale in France during 2000 and 2001. Int. J. Food Microbiol 114, 187–194. [DOI] [PubMed] [Google Scholar]
- Horton RM, Hildebrand WH, Martinko JM, Pease LR, 1990. Structural analysis of H-2Kf and H-2Kfm1 by using H-2K locus-specific sequences. J. Immunol 145, 1782–1787. [PubMed] [Google Scholar]
- Ionescu M, Belkin S, 2009. Overproduction of exopolysaccharides by an Escherichia coli K-12 rpoS mutant in response to osmotic stress. Appl. Environ. Microbiol 75, 483–492. [DOI] [PMC free article] [PubMed] [Google Scholar]
- Ivy RA, Chan YC, Bowen BM, Boor KJ, Wiedmann M, 2010. Growth temperature-dependent contributions of response regulators, σB, PrfA, and motility factors to Listeria monocytogenes invasion of Caco-2 cells. Foodborne Pathog. Dis 7, 1337–1349. [DOI] [PMC free article] [PubMed] [Google Scholar]
- Jacquet C, Doumith M, Gordon JI, Martin PM, Cossart P, Lecuit M, 2004. A molecular marker for evaluating the pathogenic potential of foodborne Listeria monocytogenes. J. Infect. Dis 189, 2094–2100. [DOI] [PubMed] [Google Scholar]
- Jittawuttipoka T, Planchon M, Spalla O, Benzerara K, Guyot F, Cassier-Chauvat C, Chauvat F, 2013. Multidisciplinary evidences that Synechocystis PCC6803 exopolysaccharides operate in cell sedimentation and protection against salt and metal stresses. PLoS One 8, e55564. [DOI] [PMC free article] [PubMed] [Google Scholar]
- Johansson J, Mandin P, Renzoni A, Chiaruttini C, Springer M, Cossart P, 2002. An RNA thermosensor controls expression of virulence genes in Listeria monocytogenes. Cell 110, 551–561. [DOI] [PubMed] [Google Scholar]
- Kazmierczak MJ, Mithoe SC, Boor KJ, Wiedmann M, 2003. Listeria monocytogenes sigma B regulates stress response and virulence functions. J. Bacteriol 185, 5722–5734. [DOI] [PMC free article] [PubMed] [Google Scholar]
- Kazmierczak MJ, Wiedmann M, Boor KJ, 2006. Contributions of Listeria monocytogenes B and PrfA to expression of virulence and stress response genes during extra- and intracellular growth. Microbiology 152, 1827–1838. [DOI] [PubMed] [Google Scholar]
- Kim H, Boor KJ, Marquis H, 2004. Listeria monocytogenes sigmaB contributes to invasion of human intestinal epithelial cells. Infect. Immun 72, 7374–7378. [DOI] [PMC free article] [PubMed] [Google Scholar]
- Kim H, Marquis H, Boor KJ, 2005. SigmaB contributes to Listeria monocytogenes invasion by controlling expression of inlA and inlB. Microbiology 151, 3215–3222. [DOI] [PMC free article] [PubMed] [Google Scholar]
- Leistner L, 2000. Basic aspects of food preservation by hurdle technology. Int. J. Food Microbiol 55, 181–186. [DOI] [PubMed] [Google Scholar]
- Lingnau A, Domann E, Hudel M, Bock M, Nichterlein T, Wehland J, Chakraborty T, 1995. Expression of the Listeria monocytogenes EGD inlA and inlB genes, whose products mediate bacterial entry into tissue culture cell lines, by PrfA-dependent and -independent mechanisms. Infect. Immun 63, 3896–3903. [DOI] [PMC free article] [PubMed] [Google Scholar]
- Liu D, Lawrence ML, Gorski L, Mandrell RE, Ainsworth AJ, Austin FW, 2006. Listeria monocytogenes serotype 4b strains belonging to lineages I and III possess distinct molecular features. J. Clin. Microbiol 44, 214–217. [DOI] [PMC free article] [PubMed] [Google Scholar]
- McGann P, Wiedmann M, Boor KJ, 2007. The alternative sigma factor sigma B and the virulence gene regulator PrfA both regulate transcription of Listeria monocytogenes internalins. Appl. Environ. Microbiol 73, 2919–2930. [DOI] [PMC free article] [PubMed] [Google Scholar]
- McGann P, Raengpradub S, Ivanek R, Wiedmann M, Boor KJ, 2008. Differential regulation of Listeria monocytogenes internalin and internalin-like genes by sigmaB and PrfA as revealed by subgenomic microarray analyses. Foodborne Pathog. Dis 5, 417–435. [DOI] [PMC free article] [PubMed] [Google Scholar]
- Meloni D, Galluzzo P, Mureddu A, Piras F, Griffiths M, Mazzette R, 2009. Listeria monocytogenes in RTE foods marketed in Italy: prevalence and automated EcoRI ribotyping of the isolates. Int. J. Food Microbiol 129, 166–173. [DOI] [PubMed] [Google Scholar]
- Mujahid S, Orsi RH, Vangay P, Boor KJ, Wiedmann M, 2013. Refinement of the Listeria monocytogenes σB regulon through quantitative proteomic analysis. Microbiology 159, 1109–1119. [DOI] [PMC free article] [PubMed] [Google Scholar]
- Nadon CA, Bowen BM, Wiedmann M, Boor KJ, 2002. Sigma B contributes to PrfA-mediated virulence in Listeria monocytogenes. Infect. Immun 70, 3948–3952. [DOI] [PMC free article] [PubMed] [Google Scholar]
- Nightingale KK, Ivy RA, Ho AJ, Fortes ED, Njaa BL, Peters RM, Wiedmann M, 2008. InlA premature stop codons are common among Listeria monocytogenes isolates from foods and yield virulence-attenuated strains that confer protection against fully virulent strains. Appl. Environ. Microbiol 74, 6570–6583. [DOI] [PMC free article] [PubMed] [Google Scholar]
- Oliver HF, Orsi RH, Ponnala L, Keich U, Wang W, Sun Q, Cartinhour SW, Filiatrault MJ, Wiedmann M, Boor KJ, 2009. Deep RNA sequencing of L. monocytogenes reveals overlapping and extensive stationary phase and sigma B-dependent transcriptomes, including multiple highly transcribed noncoding RNAs. BMC Genomics 10, 641. [DOI] [PMC free article] [PubMed] [Google Scholar]
- Oliver HF, Orsi RH, Wiedmann M, Boor KJ, 2010. Listeria monocytogenes {sigma}B has a small core regulon and a conserved role in virulence but makes differential contributions to stress tolerance across a diverse collection of strains. Appl. Environ. Microbiol 76, 4216–4232. [DOI] [PMC free article] [PubMed] [Google Scholar]
- Ollinger J, Wiedmann M, Boor KJ, 2008. SigmaB- and PrfA-dependent transcription of genes previously classified as putative constituents of the Listeria monocytogenes PrfA regulon. Foodborne Pathog. Dis 5, 281–293. [DOI] [PMC free article] [PubMed] [Google Scholar]
- Ollinger J, Bowen B, Wiedmann M, Boor KJ, Bergholz TM, 2009. Listeria monocytogenes sigmaB modulates PrfA-mediated virulence factor expression. Infect. Immun 77, 2113–2124. [DOI] [PMC free article] [PubMed] [Google Scholar]
- Orsi RH, Maron SB, Nightingale KK, Jerome M, Tabor H, Wiedmann M, 2008. Lineage specific recombination and positive selection in coding and intragenic regions contributed to evolution of the main Listeria monocytogenes virulence gene cluster. Infect. Genet. Evol 8, 566–576. [DOI] [PMC free article] [PubMed] [Google Scholar]
- Orsi RH, den Bakker HC, Wiedmann M, 2011. Listeria monocytogenes lineages: genomics, evolution, ecology, and phenotypic characteristics. Int. J. Med. Microbiol 301, 79–96. [DOI] [PubMed] [Google Scholar]
- Parihar VS, Lopez-Valladares G, Danielsson-Tham ML, Peiris I, Helmersson S, Unemo M, Andersson B, Arneborn M, Bannerman E, Barbuddhe S, Bille J, Hajdu L, Jacquet C, Johansson C, Löfdahl M, Möllerberg G, Ringberg H, Rocourt J, Tjernberg I, Ursing J, Henriques-Normark B, Tham W, 2008. Characterization of human invasive isolates of Listeria monocytogenes in Sweden 1986–2007. Foodborne Pathog. Dis 5, 755–761. [DOI] [PubMed] [Google Scholar]
- Pfaffl MW, 2001. A new mathematical model for relative quantification in real-time RT-PCR. Nucleic Acids Res 29, 45. [DOI] [PMC free article] [PubMed] [Google Scholar]
- Portnoy DA, Jacks PS, Hinrichs DJ, 1988. Role of hemolysin for the intracellular growth of Listeria monocytogenes. J. Exp. Med 67, 1459–1471. [DOI] [PMC free article] [PubMed] [Google Scholar]
- Raengpradub S, Wiedmann M, Boor KJ, 2008. Comparative analysis of the sigma B-dependent stress responses in Listeria monocytogenes and Listeria innocua strains exposed to selected stress conditions. Appl. Environ. Microbiol 74, 158–171. [DOI] [PMC free article] [PubMed] [Google Scholar]
- Ringus DL, Ivy RA, Wiedmann M, Boor KJ, 2012. Salt stress-induced transcription of σB- and CtsR-regulated genes in persistent and non-persistent Listeria monocytogenes strains from food processing plants. Foodborne Pathog. Dis 9, 198–206. [DOI] [PubMed] [Google Scholar]
- Roberts A, Nightingale K, Jeffers G, Fortes E, Kongo JM, Wiedmann M, 2006. Genetic and phenotypic characterization of Listeria monocytogenes lineage III. Microbiology 152, 685–693. [DOI] [PubMed] [Google Scholar]
- Rogga KJ, Samelis J, Kakouri A, Katsiari MC, Savvaidis IN, Kontominas MG, 2007. Survival of Listeria monocytogenes in Galotyri, a traditional Greek soft acid-curd cheese, stored aerobically at 4 °C and 12 °C. Int. Dairy J 15, 59–67. [Google Scholar]
- Ryser ET, Marth EH, 2007. Listeria, Listeriosis and Food Safety, third ed. Marcel Dekker Inc., Nova York. [Google Scholar]
- Sandhya V, Ali SZ, Venkateswarlu B, Reddy G, Grover M, 2010. Effect of osmotic stress on plant growth promoting Pseudomonas spp. Arch. Microbiol 192, 867–876. [DOI] [PubMed] [Google Scholar]
- Sauders BD, Fortes ED, Morse DL, Dumas N, Kiehlbauch JA, Schukken Y, Hibbs JR, Wiedmann M, 2003. Molecular subtyping to detect human listeriosis clusters. Emerg. Infect. Dis 9, 672–680. [DOI] [PMC free article] [PubMed] [Google Scholar]
- Sheehan B, Klarsfeld A, Msadek T, Cossart P, 1995. Differential activation of virulence gene expression by PrfA, the Listeria monocytogenes virulence regulator. J. Bacteriol 177, 6469–6476. [DOI] [PMC free article] [PubMed] [Google Scholar]
- Smyth GK, 2004. Linear models and empirical Bayes methods for assessing differential expression in microarray experiments. Stat. Appl. Genet. Mol. Biol 3 (Article3). [DOI] [PubMed] [Google Scholar]
- Smyth GK, 2005. Limma: linear models for microarray data. In: Gentleman R, Carey V, Dudoit S, Irizarry R, Huber W (Eds.), Bioinformatics and Computational Biology Solutions Using R and Bioconductor Springer, New York, pp. 397–420. [Google Scholar]
- Smyth GK, Speed T, 2003. Normalization of cDNA microarray data. Methods 31, 265–273. [DOI] [PubMed] [Google Scholar]
- Subramanian A, Tamayo P, Mootha VK, Mukherjee S, Ebert BL, Gillette MA, Paulovich A, Pomeroy SL, Golub TR, Lander ES, Mesirov JP, 2005. Gene set enrichment analysis: a knowledge-based approach for interpreting genome-wide expression profiles. Proc. Natl. Acad. Sci 102, 15545–15550. [DOI] [PMC free article] [PubMed] [Google Scholar]
- Van Stelten A, Simpson JM, Ward TJ, Nightingale KK, 2010. Revelation by single-nucleotide polymorphism genotyping that mutations leading to a premature stop codon in inlA are common among Listeria monocytogenes isolates from ready-to-eat foods but not human listeriosis cases. Appl. Environ. Microbiol 76, 2783–2790. [DOI] [PMC free article] [PubMed] [Google Scholar]
- Ward TJ, Ducey TF, Usgaard T, Dunn KA, Bielawski JP, 2008. Multilocus genotyping assays for single nucleotide polymorphism-based subtyping of Listeria monocytogenes isolates. Appl. Environ. Microbiol 74, 7629–7642. [DOI] [PMC free article] [PubMed] [Google Scholar]
- Weis J, Seeliger HP, 1975. Incidence of Listeria monocytogenes in nature. Appl. Microbiol 30, 29–32. [DOI] [PMC free article] [PubMed] [Google Scholar]
- Wiedmann M, Bruce JL, Keating C, Johnson AE, McDonough PL, Batt CA, 1997. Ribotypes and virulence gene polymorphisms suggest three distinct Listeria monocytogenes lineages with differences in pathogenic potential. Infect. Immun 65, 2707–2716. [DOI] [PMC free article] [PubMed] [Google Scholar]
- Wiedmann M, Arvik TJ, Hurley RJ, Boor KJ, 1998. General stress transcription factor sigmaB and its role in acid tolerance and virulence of Listeria monocytogenes. J. Bacteriol 180, 3650–3656. [DOI] [PMC free article] [PubMed] [Google Scholar]
- Wong KK, Freitag NE, 2004. A novel mutation within the central Listeria monocytogenes regulator PrfA that results in constitutive expression of virulence gene products. J. Bacteriol 186, 6265–6276. [DOI] [PMC free article] [PubMed] [Google Scholar]
- Wong HC, Fear AL, Calhoon RD, Eichinger GH, Mayer R, Amikan D, Benziman M, Gelfand DH, Meade JH, Emerick AW, Bruner R, Ben-Bassat A, Tal R, 1990. Genetic organization of the cellulose synthase operon in Acetobacter xylinum. Proc. Natl. Acad. Sci 87, 8130–8134. [DOI] [PMC free article] [PubMed] [Google Scholar]
- Zaika LL, Fanelli JS, 2003. Growth kinetics and cell morphology of Listeria monocytogenes Scott A as affected by temperature, NaCl, and EDTA. J. Food Prot 66, 1208–1215. [DOI] [PubMed] [Google Scholar]
Associated Data
This section collects any data citations, data availability statements, or supplementary materials included in this article.