

Abstract
The human inferior parietal lobule (IPL) is a multimodal brain region, subdivided in several cytoarchitectonic areas which are involved in neural networks related to spatial attention, language, and higher motor processing. Tracer studies in macaques revealed differential connectivity patterns of IPL areas as the respective structural basis. Evidence for comparable differential fibre tracts of human IPL is lacking. Here, anatomical connectivity of five cytoarchitectonic human IPL areas to 64 cortical targets was investigated using probabilistic tractography. Connection likelihood was assessed by evaluating the number of traces between seed and target against the distribution of traces from that seed to voxels in the same distance as the target. The main fibre tract pattern shifted gradually from rostral to caudal IPL: Rostral areas were predominantly connected to somatosensory and superior parietal areas while caudal areas more strongly connected with auditory, anterior temporal and higher visual cortices. All IPL areas were strongly connected with inferior frontal, insular and posterior temporal areas. These results showed striking similarities with connectivity patterns in macaques, providing further evidence for possible homologies between these two species. This shift in fibre tract pattern supports a differential functional involvement of rostral (higher motor functions) and caudal IPL (spatial attention), with probable overlapping language involvement. The differential functional involvement of IPL areas was further supported by hemispheric asymmetries of connection patterns which showed left–right differences especially with regard to connections to sensorimotor, inferior frontal and temporal areas.
Keywords: Diffusion tensor imaging, DTI, Probabilistic tractography, Inferior parietal, Fibre tract, Cytoarchitecture
Introduction
The human inferior parietal lobule (IPL) is a heterogeneous, multimodal brain region as demonstrated by functional neuroimaging and lesion mapping studies. Thus, different parts of human IPL seem to be involved in different functional brain networks, where they interact with different other cortical regions within frontal, occipital, and temporal lobe.
Rostral IPL areas bilaterally seem to be involved in higher motor functions, potentially including parts of a human mirror neuron system (Rizzolatti and Craighero, 2004; Iacoboni, 2005; Keysers and Gazzola, 2009; Caspers et al., 2010). The caudal IPL, in contrast, was shown to feature hemisphere-specific functionality. The right IPL is recruited during spatial and non-spatial attention and motor preparation tasks and conceptualised as part of the “ventral attention network” (Fink et al., 2001; Corbetta and Shulman, 2002; Corbetta et al., 2008; Jakobs et al., 2009). Contrastingly, its left counter-part is thought to form Geschwind’s area in the language network, being mainly involved in semantic and phonological processing (Geschwind, 1970; Price, 2000; Gernsbacher and Kaschak, 2003; Vigneau et al., 2006).
In macaque monkeys, electrophysiological recordings have shown evidence of a comparable functional segregation of the IPL as in humans (apart from language processing). Rostral IPL areas in this species have been shown to contain mirror neurons and participate in sensorimotor processing, whereas caudal areas are mainly involved in functions such as spatial attention, auditory-sensory integration, and visuo-motor coordination, e.g., grasping (Hyvärinen, 1982; Pandya and Seltzer, 1982; Seltzer and Pandya, 1984; Rozzi et al., 2006).
In both species, this functional heterogeneity is reflected on a cytoarchitectonic level. In humans, a recent study delineated seven cytoarchitectonically distinct areas within the IPL (Caspers et al., 2006, 2008). Five of these cover the lateral surface of the IPL in a rostro-caudal sequence (Fig. 1A). The remaining two are located in the Sylvian fissure. Comparably, the macaque IPL has been reported to consist of six main areas (Pandya and Seltzer, 1982; Gregoriou et al., 2006) . Of these, four are located on the lateral surface in a rostro-caudal sequence (Fig. 1B), the other two in the Sylvian fissure.
Fig. 1.
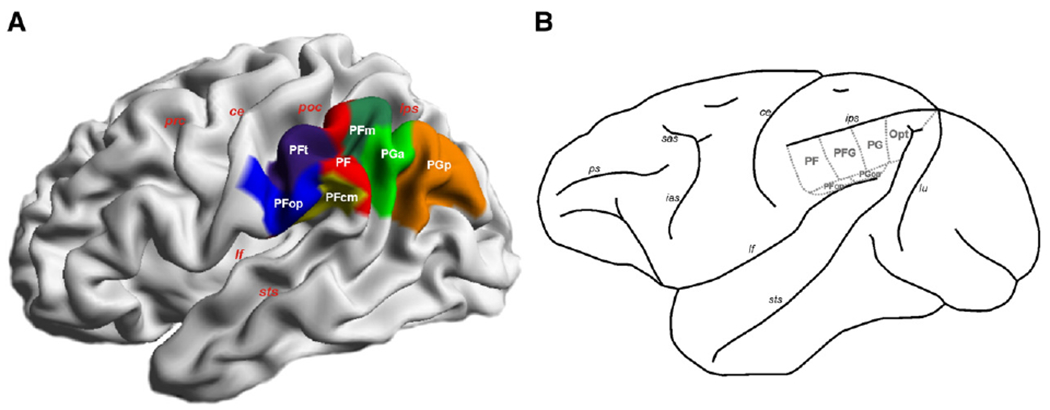
(A) 3D reconstruction of maximum probability maps (MPM; Eickhoff et al., 2006a) of the cytoarchitectonic areas (PFop, PFt, PF, PFm, PFcm, PGa, PGp) defined within the human IPL (Caspers et al., 2006, 2008), displayed on a lateral surface view of the MNI single subject template. (B) Schematic depiction of the six areas (PF, PFG, PG, Opt, PFop, PGop) of the macaque IPL, adopted from Pandya and Seltzer (1982) and Gregoriou et al. (2006). ce central sulucs, ias inferior arcuate sulcus, ips intraparietal sulcus, lf lateral fissure, lu lunate sulcus, poc postcentral sulcus, prc precentral sulcus, ps principal sulcus, sas superior arcuate sulcus, sts superior temporal sulcus.
Tracer studies of axonal connectivity in macaques have provided a potential link between structural heterogeneity and functional diversity of the IPL by revealing a differentiated connectivity pattern of the cortical areas in this region. Rostral areas (PF, PFG) show strong reciprocal connections to (pre-) motor, somatosensory and superior parietal areas. In contrast, caudal areas are mainly connected to higher visual areas within occipital and inferior temporal cortex (Cavada and Goldman-Rakic, 1989a,b; Felleman and Van Essen, 1991; Gregoriou et al., 2006).
In humans, the anatomical connectivity of individual IPL areas is largely unknown, although macroanatomical fibre preparations and studies on disconnection syndromes such as apraxia (Freund, 2003; Culham and Valyear, 2006), spatial neglect (Karnath, 2001; Hillis, 2006; Husain and Nachev, 2007) or aphasia (Dronkers et al., 2004) support the idea of a similar connection pattern for humans as in macaques. Diffusion tensor imaging (DTI) studies in healthy humans were indeed able to show partly different connectivity of different aspects of the IPL. Makris et al. (2005) found a partition of one of the two main fibre pathways connecting the IPL with mainly frontal regions, i.e. the superior longitudinal fascicle (SLF) which they could subdivide into four distinct parts, two of which running into the rostral and caudal aspect of the IPL, respectively. Catani et al. (2005) found a comparable partition for the other main pathway, i.e. the arcuate fascicle. They demonstrated that different parts of the arcuate fascicle reach either the rostral or the caudal aspect of the IPL, comparable to the SLF as reported by Makris et al. (2005). Focusing on a possible subdivision of the parietal cortex by means of connectivity based parcellation, Rushworth et al. (2006) showed that rostral IPL is more likely to connect to ventral premotor cortex whereas caudal IPL was more likely to connect with the parahippocampal gyrus. A recent study by Mars et al. (2011) used connectivity-based parcellation of the IPL, resulting in a comparable subdivision of this region as found by cytoarchitectonic parcellation (Caspers et al., 2006, 2008). Consecutive resting-state functional connectivity analyses showed how the IPL areas were differentially connected to premotor, prefrontal and parahippocampal areas (Mars et al., 2011). These studies provide first hints that the fibre tract pattern of human IPL is different in its many parts, at least in rostral and caudal IPL.
But it can be assumed that the functional and cytoarchitectonic heterogeneity of the IPL is also reflected by a more differentiated fibre tract pattern than a bipartition. In order to provide a precise identification of areal-specific fibre tract pattern as structural basis for the involvement in different functional networks, we assessed the fibre tracts related to five cytoarchitectonic areas of the lateral IPL using probabilistic tractography based on DTI data.
Material and methods
Data acquisition
We acquired diffusion-weighted data from 40 healthy, right-handed human subjects (20 males, mean age ± SD = 28.65 ± 5.73, range 21–42; 20 females, mean age±SD = 28.75±6.20, range 21–42) on a 3.0 T Tim-Trio Siemens whole-body scanner (Siemens, Erlangen, Germany) with a maximum gradient strength of 40 mT m−1, using a 12-channel phased-array head coil for signal reception. Subjects had no history of neurological or psychiatric disease, or head injury. All subjects gave informed, written consent to participate in the study which was approved by the local Ethics Committee of the RWTH Aachen University.
Diffusion-weighted images were acquired using a twice-refocused spin-echo sequence (axial slices, slice thickness: 1.8 mm, number of slices: 75, matrix = 128×128, field of view = 230×230 mm2, band-width = 1502 Hz/pixel, reconstruction using an iPAT GRAPPA-scheme, final voxel resolution of 1.8×1.8×1.8 mm3). The diffusion sensitive gradients were distributed along 60 directions in an icosahedral scheme (Jones et al., 1999). For each set of diffusion-weighted data, 60 volumes with b-value = 800 s/mm2 and 7 volumes with b-value = 0 s/mm2 were obtained. For each subject, the entire diffusion measurement was repeated four times in successive sessions for subsequent averaging. The total scan time for the diffusion-weighted imaging protocol was about 50 min. A scanning protocol with special focus on quality protection of the data was applied, in particular with respect to the prevention of head motion. The four data sets for each subject were obtained in two 6-minute runs each which minimised motion within a scan session as subjects could relax in-between. Head fixation was carried out using foam paddles at either side of the subjects’ head. Light in the scanner room was dimmed to avoid visual distraction of the subjects during scanning. Quality of scanning in general was checked by routinely applied phantom measurements with retrieval of signal and noise change measures within the acquired images and the background to assure stability of the scanning protocol over time.
Definition of seed and target areas
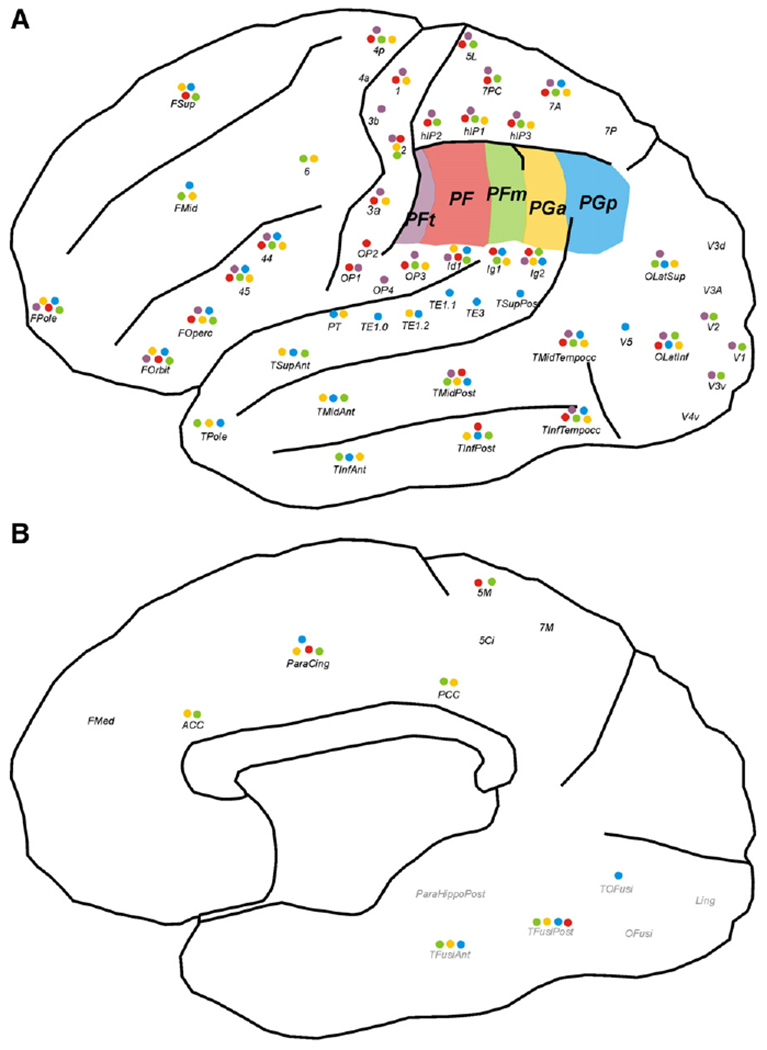
The five cytoarchitectonic areas on the lateral surface of the IPL (in rostro-caudal sequence: PFt, PF, PFm, PGa, PGp; Caspers et al., 2006, 2008) were used as seed areas. Definition of the seed volumes was based on probabilistic cytoarchitectonic maps (Caspers et al., 2008) as implemented in the Düsseldorf-Jülich histological atlas (JHA; Zilles and Amunts, 2010) using the SPM Anatomy Toolbox (http://www.fz-juelich.de/inm/spm_anatomy_toolbox; Eickhoff et al., 2005). The rest of the cerebral cortex was subdivided in different targets, again based on the JHA where available. For those regions that have not yet been cytoarchitectonically defined, we used the macroscopic probabilistic Harvard–Oxford cortical structural atlas (HOCSA) as included in FSL (Oxford Centre for Functional Magnetic Resonance Imaging of the Brain, http://www.fmrib.ox.ac.uk/fsl/data/atlas-descriptions.html) for target definition. In total, 64 target areas were defined in each hemisphere (Table 1), for which locations are schematically depicted in Fig. 2.
Table 1.
Target areas for connectivity analysis of IPL seed areas.
| Target area | Atlas | Labelling | |
|---|---|---|---|
| Frontal lobe | Broca’s speech region, BA 44 | JHA | BA 44 |
| Broca’s speech region, BA 45 | JHA | BA 45 | |
| Primary motor area 4a | JHA | 4a | |
| Primary motor area 4p | JHA | 4p | |
| Premotor cortex, BA 6 | JHA | BA 6 | |
| Frontal medial cortex | HOCSA | FMed | |
| Frontal operculum | HOCSA | FOperc | |
| Frontal orbital cortex | HOCSA | FOrbit | |
| Frontal pole | HOCSA | FPole | |
| Middle frontal gyrus | HOCSA | FMid | |
| Superior frontal gyrus | HOCSA | FSup | |
| Anterior cingulate cortex | HOCSA | CingAnt | |
| Posterior cingulate cortex | HOCSA | CingPost | |
| Paracingulate cortex | HOCSA | ParaCing | |
| Primary somatosensory cortex (SI) | Area 1 | JHA | 1 |
| Area 2 | JHA | 2 | |
| Area 3a | JHA | 3a | |
| Area 3b | JHA | 3b | |
| Secondary somatosensory cortex (SII) | Area OP1 | JHA | OP1 |
| Area OP2 | JHA | OP2 | |
| Area OP3 | JHA | OP3 | |
| Area OP4 | JHA | OP4 | |
| Insula | Dysgranular insula Id1 | JHA | Id1 |
| Granular insula Ig1 | JHA | Ig1 | |
| Granular Insula Ig2 | JHA | Ig2 | |
| Parietal lobe | Superior parietal area 5Ci | JHA | 5Ci |
| Superior parietal area 5L | JHA | 5L | |
| Superior parietal area 5M | JHA | 5M | |
| Superior parietal area 7A | JHA | 7A | |
| Superior parietal area 7M | JHA | 7M | |
| Superior parietal area 7PC | JHA | 7PC | |
| Superior parietal area 7P | JHA | 7P | |
| Intraparietal area hIP1 | JHA | hIP1 | |
| Intraparietal area hIP2 | JHA | hIP2 | |
| Intraparietal area hIP3 | JHA | hIP3 | |
| Occipital lobe | Visual area hOc1, BA 17 | JHA | hOc1 |
| Visual area hOc2, BA 18 | JHA | hOc2 | |
| Visual area hOc3A | JHA | hOc3A | |
| Visual area hOc3d | JHA | hOc3d | |
| Visual area hOc3v | JHA | hOc3v | |
| Visual area hOc4 | JHA | hOc4 | |
| Visual area hOc5 | JHA | hOc5 | |
| Lateral inferior occipital cortex | HOCSA | OLatInf | |
| Lateral superior occipital cortex | HOCSA | OLatSup | |
| Lingual gyrus | HOCSA | Ling | |
| Occipital fusiform gyrus | HOCSA | OFusi | |
| Temporal lobe | Auditory area TE1.0 | JHA | TE1.0 |
| Auditory area TE1.1 | JHA | TE1.1 | |
| Auditory area TE1.2 | JHA | TE1.2 | |
| Auditory area TE3 | JHA | TE3 | |
| Inferior temporal gyrus, anterior part | HOCSA | TInfAnt | |
| Inferior temporal gyrus, posterior part | HOCSA | TInfPost | |
| Inferior temporal gyrus, temporooccipital part | HOCSA | TInfTempocc | |
| Middle temporal gyrus, anterior part | HOCSA | TMidAnt | |
| Middle temporal gyrus, posterior part | HOCSA | TMidPost | |
| Middle temporal gyrus, temporooccipital part | HOCSA | TMidTempocc | |
| Superior temporal gyrus, anterior part | HOCSA | TSupAnt | |
| Superior temporal gyrus, posterior part | HOCSA | TSupPost | |
| Temporal fusiform cortex, anterior part | HOCSA | TFusiAnt | |
| Temporal fusiform cortex, posterior part | HOCSA | TFusiPost | |
| Temporal occipital fusiform cortex | HOCSA | TOFusi | |
| Planum temporale | HOCSA | PT | |
| Temporal Pole | HOCSA | TPole | |
| Posterior parahippocampal gyrus | HOCSA | ParaHippoPost |
Areal naming as provided in the atlases and respective publications. JHA: Jülich histological atlas, HOCSA: Harvard–Oxford cortical structural atlas. Labelling of JHA areas according to publications: Amunts et al. (1999, 2000), Choi et al. (2006),Eickhoff et al. (2006b,c),Geyer (2004), Geyer et al. (1996, 1999, 2000),Grefkes et al. (2001),Kurth et al. (2010),Malikovic et al. (2007), Morosan et al. (2001), Rottschy et al. (2007), Scheperjans et al. (2008a,b).
Fig. 2.
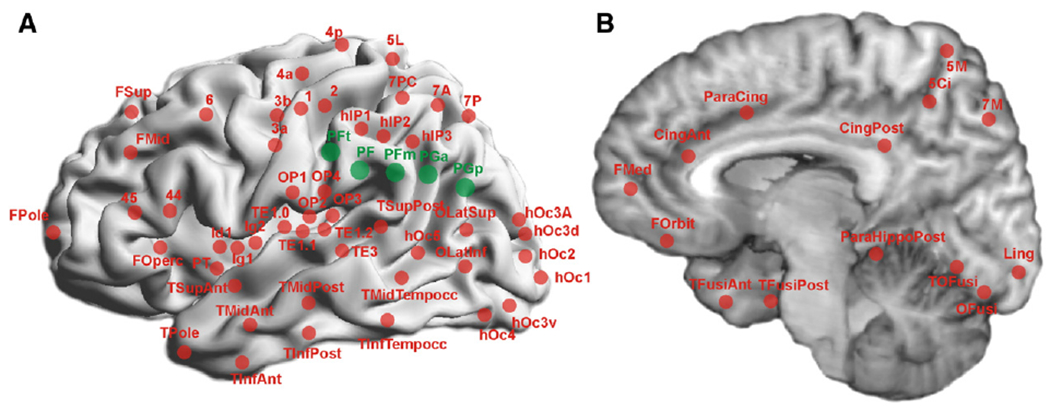
Visualisation of seed (green) and target areas (red) on the (A) lateral 3D reconstructed and (B) medial surface view of the MNI single subject template. For labelling conventions of areas, cf. Table 1.
Seeds and targets were defined separately for each hemisphere by using the centre of each region in a maximum probability map (MPM; Eickhoff et al., 2006a) included in the JHA and the HOCSA atlases. Centres were defined as the top 10% of the underlying probability that are also represented by the respective MPM. To perform diffusion-image analysis the ensuing area definitions had to be transformed from MNI standard space into the individual diffusion space (Eickhoff et al., 2010), being the reason why only the centre representation of the MPM has been chosen to avoid overlapping seed and target regions in individual diffusion spaces. Transformation fields were generated by normalising the mean b = 0 image from each subject to the MNI tissue probability maps (TPM) using a segmentation-based approach (Ashburner and Friston, 2005). By using the combination of a transformation from the MNI single subject template into the TPM space with the inverse transformation of the individual b = 0 image, we transformed seeds and targets from the template brain into the individual diffusion spaces. All diffusion-weighted images, including the b = 0 images, were spatially realigned. All 28 b = 0 images of each subject (7 b = 0 images of4 scanning sessions) were then averaged to provide an anatomical reference for consecutive registration of all diffusion-weighted images to the individual mean b = 0 image which allowed for a consecutive application of the transformation procedure to all diffusion-weighted images. The representations of seeds and targets in individual diffusion space were then mapped on the grey–white matter interface with restriction to fractional anisotropy (FA) values of at least 0.25. This procedure was necessary to provide sufficient directional information for the tracking algorithm to proceed. Within the grey matter, directional information is poorly available due to low anisotropy. In particular, transforming the regions of interest (seeds and targets) onto the grey–white matter interface resulted in mean FA-values of around 0.4 within the transformed region of interest, thus providing sufficient directional information for consecutive tracking. The grey–white matter interface was gauged based on segmentation of the average of the 28 b = 0 images for each subject by means of unified segmentation (Ashburner and Friston, 2005) which provided a robust and reliable basis for defining the interface between the two tissue classes grey and white matter. By adding an FA threshold of 0.25 to the grey matter segment, it was possible to only identify those grey matter voxels that were located close to the grey matter and construct of the respective interface.
Image analysis
Data were preprocessed using SPM 5 (Wellcome Department of Imaging Neuroscience, London, UK, http://www.fil.ion.ucl.ac.uk/) and FSL 4.1 (http://www.fmrib.ox.ac.uk/fsl). After correction for eddy currents and head motion, the four data sets (sessions) for each subject were averaged to improve signal-to-noise ratio. Data sets were additionally checked for motion artefacts or other acquisition-related quality compromises (ghosting, signal drop-outs etc). But due to a scanning protocol with focus on optimal acquisition of high quality data, only one data set had to be removed from further analysis, leaving 39 data sets which showed minimal motion and no other artefacts for consecutive analysis. Brain segmentation into three compartments (grey matter, white matter, cerebrospinal fluid (CSF)) was then performed on the averaged b = 0 images for each participant using the unified segmentation approach (Ashburner and Friston, 2005).
Diffusion probabilistic tractography was then performed using the Diffusion Toolbox FDT (version 4.0.4) implemented in FSL (Behrens et al., 2003a,b; Smith et al., 2004). Possible multiple fibre orientations in each voxel were estimated according to Behrens et al. (2007). The CSF-segment obtained from segmentation of the individual b = 0 images was used as exclusion mask for probabilistic tractography to avoid tracts passing through ventricles or sulci. The grey matter-white matter interface mask was used as stop mask for the tracking algorithm to stop after reaching a relevant target voxel. Otherwise, tracts might be prone to further proceed until they reach the CSF which would cause exclusion of this tract from further analysis.
Probabilistic tractography was carried out from each seed area using 100,000 samples for each seed voxel to improve signal-to-noise ratio and create a stable probability distribution. For each voxel in the brain, the number of samples (probabilistic tracts) passing through it was registered, together with the respective distance from the seed voxel along the tract. For visualisation purposes only, all individual tractography results were transformed into anatomical MNI space and then averaged across subjects.
Statistical analysis
Statistical analysis was performed using MATLAB (The Math-Works). To quantitatively compare the connection likelihood of the individual IPL areas with different targets in spite of the varying distances between them, we first recorded the number of traces (samples from probabilistic tractography) for all voxels within the entire mask of each target (Fig. 3A).
Fig. 3.
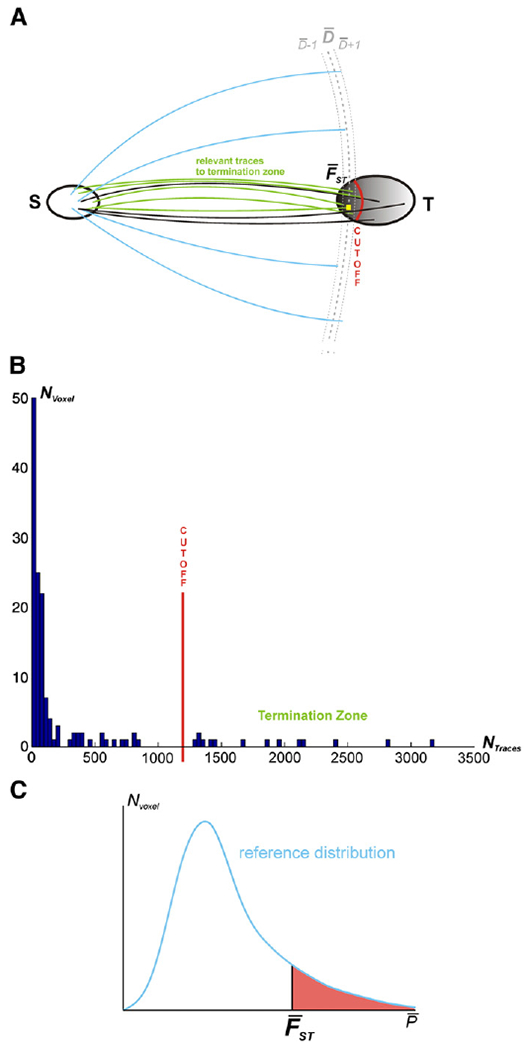
(A) Schematic overview of the statistical approach used for identifying terminal zone of a particular seed-target connection (for details, see text). S: Seed, T: Target, : distance between seed and target voxels, exemplarily given for one highlighted voxel (yellow square in termination zone of target T), , : uncertainty of tract length around , : defined mean frequency of traces between S and T. (B) Histogram showing an exemplary frequency distribution of traces running from a seed to one target with visualisation of the cutoff point for the identification of the termination zone. Nvoxel (y-axis): number of voxels in the target region which featured a particular trace-count as indicated by NTraces on the x-axis (following probabilistic tractography with 100,000 samples run from each seed voxel). (C) Reference distribution of traces derived from drawing a random sample of voxels at the same distance as the target voxels in the termination zone. Nvoxel: number of voxels which showed a certain frequency of traces in the randomisation procedure to generate the reference distribution.
For the analysis of relevant traces, it has to be considered that cortical targets are irregularly shaped in three dimensional space due to the gyral and sulcal pattern of the respective region. Thus, the fibre tracts that can be assessed by DTI might terminate in only a small part of the target, i.e. that part of the target which is located closest to the seed. Moreover, the employed tractography analysis favours target voxels which are located close to the white matter as directional information is poor in more superficial grey matter due to low anisotropy values, even if DTI-based tractography is generally able to also reach voxels far within the grey matter.
Thus, most fibre tracts should predominantly reach the target in this kind of “termination zone”, due to technical and biological constraints. To the contrary, the majority of voxels showed lower frequencies of traces since these voxels were only rarely hit by incoming traces when running the probabilistic tractography (left part of Fig. 3B). Analysis of tract counts was consequently restricted to this termination zone, excluding voxels within the target that only reflect stray connectivity (i.e. voxels which were rarely hit due to probabilistic phenomena), but may severely bias further analysis.
By restricting analysis to that termination zone, those voxels within each target mask which were reached most consistently in the probabilistic tractography were identified. It has to be emphasised that this was performed separately for each seed-target combination, i.e., a particular target was allowed to have distinct termination zones for the different seed areas.
When examining the distribution of trace frequencies for the different seed-target combinations, i.e. how many voxels were reached by which number of traces (trace density), two patterns became evident (Fig. 3B). In most instances, one or a few clusters of target voxels showed considerably higher trace density than all others, indicative of a distinct termination zone. Algorithmically, voxels forming this termination zone were identified using a stepwise threshold decrease. Initially, the 10 voxels with the highest trace density were considered. This minimum cluster-size was introduced to reduce the effect of outliers and potential technical artefacts. The threshold for inclusion was then successively lowered until the voxel to be included next showed a trace density less than half as high as the median trace density of the voxels already included. In cases where no such break could be identified, the procedure was stopped after inclusion of 5% of all target voxels.
The number of traces passing through the different voxels in the termination zone was averaged to yield the trace density representing the connectivity between the particular seed (S) and that target (T). When trying to compare these values across different seed-target combinations or when trying to interpret whether an observed FST is indicative of an anatomical connection, one faces two problems. First, as 100,000 traces originated from each (individual) seed voxel, the number of traces will increase with the size of the seed volume. This holds true for any given number of samples. A reliable comparison between different seed-target connections would therefore be aggravated. Thus, a correction for this potentially Biasing factor ‘seed size’ is needed. Second, the number of traces is also highly dependent on the distance (along the tract) between the seed and the target. In particular, the further away a target is located from a particular seed, the lower the trace count that it will reach the target, as the number of potential “wrong turns” increases. Hence, low density values for a distant seed-target pair may actually reflect stronger connectivity than high values for a proximate pair. In fact, stray samples close to the seed result in higher trace counts than “true” connectivity at a more distant location.
In order to correct for these two potential biases (i.e. seed size and distance), we referenced the observed mean trace density against a reference distribution reflecting the empirically expected trace density in the same distance to the respective seed. This would ameliorate the influence of both Biasing factors on further analysis, since the reference distribution will be drawn from voxels at the same distance from the same seed as the target. The distance between a seed and a target was defined as the physiological distance, i.e. following the natural way of the fibre tracts with all curves around sulci. Thus, the distance is no straight-line distance in 3D, but fitted to the anatomy. Thus, only voxels which were reached by at least one trace were included in any further analysis, yielding a more conservative approach as compared to including also those voxels with a trace count of zero. Actually, different voxels in the termination zone may be located in slightly different distances from the seed which was accommodated by recording the distances between each voxel in the termination zone and the seed. Subsequently, for each voxel of the termination zone, we identified all voxels within a whole brain grey–white matter interface mask that were located at the same distance from the seed as that target voxel. The trace densities of these voxels then provided a reference distribution for the number of probabilistic traces that may be expected in the same distance from the seed as that particular voxel of the termination zone. To account for potential rounding errors in distance of each target voxel, the voxels for the reference distribution were drawn from a distance interval +/−1 voxel around the computed distance (Fig. 3A).
To establish the reference distribution for the mean trace density , we used a randomisation procedure. For each voxel in the termination zone, one trace density from the reference voxels as defined above was selected independently at random. This procedure thus yielded as many trace density values as were obtained from the termination zone that had the same distance from the seed. These random trace densities were then averaged to yield an estimate for the mean trace density of a random set of the same number of voxels in the same distance as the termination zone. As this mean trace density was computed from a voxel that were matched with those constituting the termination zone in terms of distance along the tracts, it reflects an at-chance trace density in the same range. This procedure of drawing the same number of samples and consecutive averaging of the trace counts observed for these (random but matched) voxels was repeated 106 times yielding (due to the central limit theorem) a normal distribution for the mean trace density in the termination zone. In other words, we obtained a reference distribution of at-chance (mean) trace counts across an equally large number of voxels as contained in the seed, which were located in the same distance from the target. Depending on the distance from the seed, a differing number of reference voxels existed. At the relevant distances of up to about 120–130 steps from the seed, there were at least 3000 to 5000 reference voxels from which the samples for the reference distribution could be chosen (Suppl. Fig. S1).
The likelihood of observing by chance, given the distance of this target from the seed, was then expressed as the proportion of the realisations within the reference distribution that showed less or equal trace densities, being a quantitative description of this proportion (Fig. 3C). We thus evaluated the mean number of traces between seed and target (termination zone) against a reference distribution reflecting the by-chance distribution of mean trace counts in such set of voxels at the same distance from the seed. Note, that even though this assessment was based on a reference distribution, no inference was sought at this stage. Rather, these likelihoods were converted into standard Z-scores to allow statistical inference on their consistency across subjects in a second-level group analysis. A Z-score of 0 indicates that it is equally likely to find a higher or a lower mean trace density at that distance by chance. A positive Z-score points towards a termination zone that receives more traces than expected by chance in the same distance from the seed. In contrast, negative Z-scores would be found for targets that show a lower mean trace density than expected by chance in the same distance. It has to be noted that the probabilities obtained from comparison with the reference distribution do not reflect connection probabilities per se (how likely is the target connected) but rather the probabilities for excess of the expected trace number (how (un-) likely would one see the observed trace count at chance in the same distance). Importantly, the former probability would certainly decrease with increasing distance from the seed due to increasing uncertainty and “fanning out” of the tracts. The current approach does not attempt to correct for this phenomenon. Instead, it implements a reference distribution of how many trace counts could be expected by chance at a given distance and describes the observed effects relative to this reference.
Consistency of these findings across subjects was then tested for by means of one-sample T-tests performed separately for each seed-target combination (p<0.001; Bonferroni-corrected for multiple comparisons). Together with the individual Z-scores, this consistency test provides a measure for the likelihood of a given connection across subjects. Thus, the results of the present analysis will be referred to by calling them a connection which one should be more or less confident about.
Further statistical analysis was performed on the confidence measures (individual Z-scores) from each seed to every target area. Different target areas were grouped into anatomically and functionally defined groups to test for differences in anatomical connectivity from IPL seed areas to cortical regions involved in different functional systems. Repeated-measures ANOVAs of connection likelihood values were used to test for influences of the within-subject factors of “IPL seed” (PFt, PF, PFm, PGa, PGp), and “hemisphere” (left, right), as well as the interaction between them on connection likelihood. In particular, the main effect of the factor “IPL seed” assessed whether there was a significant difference between the five IPL seeds with respect to their connection likelihood to that group of targets. The main effect of factor “hemisphere” tested whether the connection likelihood between the five seeds and that assessed target differed between the two hemispheres. The interaction between both factors tested for differences in connection likelihood between left and right hemisphere that were conditioned upon the IPL seed considered.
Reference to macaque data
In order to facilitate a comparison of the results of the present analysis with those from tracer studies in macaques, the relevant literature on connectivity of the inferior parietal lobule in macaque cortex has been reviewed and summarised in a figure (Fig. 10 of the Discussion) using the same layout as for the current results (Fig. 5). To this end, different labelling systems had to be combined and displayed on the schematic drawing of a typical macaque hemisphere in Fig. 10 adopted from Schmahmann and Pandya (2006), with minor changes according to Felleman and Van Essen (1991) and Luppino et al. (1993).
Fig. 10.
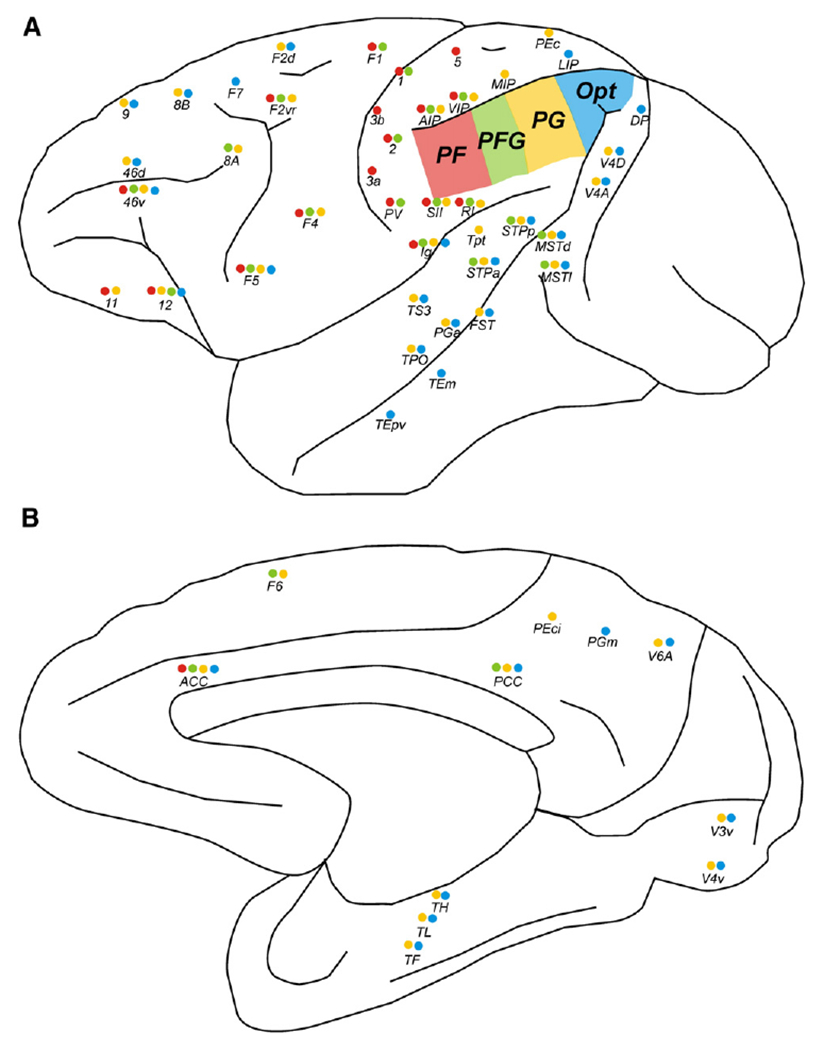
Schematic drawings of (A) the lateral and (B) the mesial part of a macaque hemisphere, indicating those connections between the four lateral IPL areas and cortical targets that were found to be connected to either one the IPL areas. IPL areas are marked in four different colours: PF red, PFG green, PG yellow, Opt blue. Coloured dots beneath each target region indicate the presence of a connection to the respective seed region. Areas within the depth of a sulcus were placed along its rim to facilitate readability. Such depiction pertains to the following areas: areas Ig, and RI within the depth of the Sylvian fissure on the insular cortex; areas AIP, VIP, MIP, and LIP within the intraparietal sulcus; parts of areas 46v, and 46d within the depth of the principal sulcus; areas STPa, STPp, FST, MSTd, MSTl, TPO, TEm, and TEpv within the depth of the superior temporal sulcus. Connections depicted here were obtained from and named according to the relevant literature (cf. text) and by reference to the CoCoMac database (http://www.cocomac.org; Stephan et al., 2001).
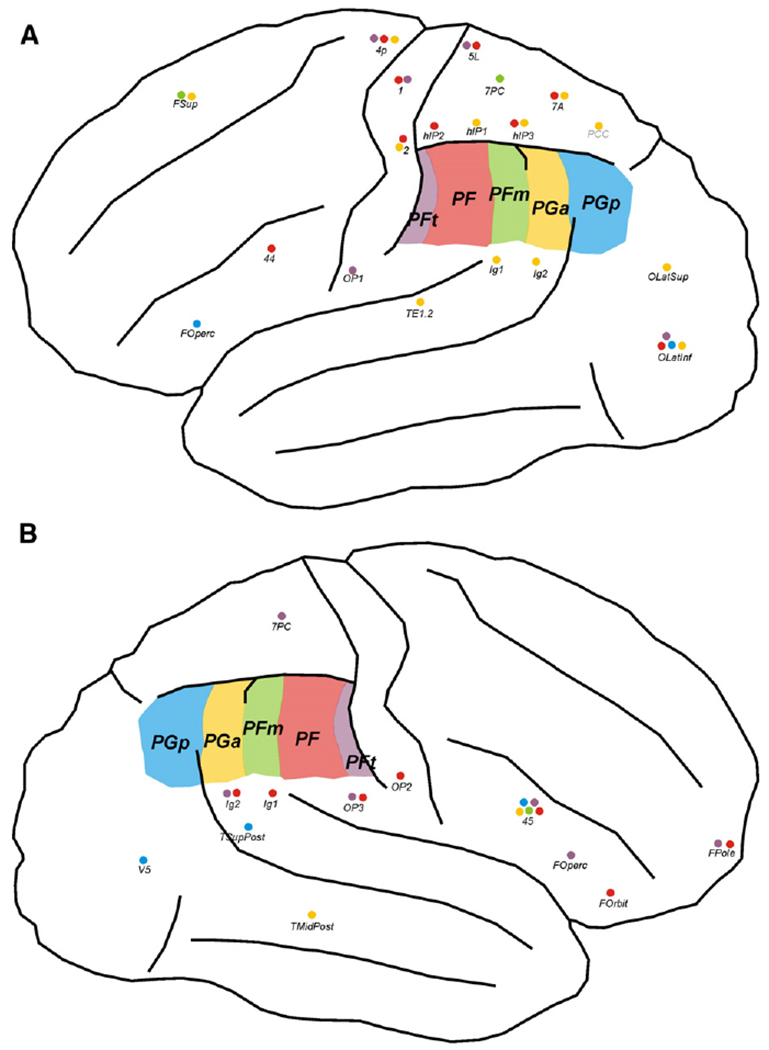
Fig. 5.
Schematic drawings of (A) the lateral and (B) the mesial part of a human hemisphere, indicating those connections between the five IPL seed areas and cortical targets that were consistently (across subjects) found to be more likely than expected by chance for lateral (A) and mesial (B) target areas. IPL seed areas are marked in five different colours: PFt violet, PF red, PFm green, PGa yellow, PGp blue. Coloured dots beneath each target region indicate the presence of a connection to the respective seed region. For labelling conventions of areas, cf. Table 1.
Results depicted in the figure and within the text of the Discussion were derived from the following publications on IPL connectivity of macaque cortex: Pandya and Seltzer (1982), Petrides and Pandya (1984), Cavada and Goldman-Rakic (1989a,b), Andersen et al. (1990), Neal et al. (1990a,b), Felleman and Van Essen (1991), Luppino et al. (1993), Lewis and Van Essen (2000), Matelli and Luppino (2001), Zhong and Rockland (2003), Gregoriou et al. (2006), Rozzi et al. (2006), Schmahmann and Pandya (2006), Petrides and Pandya (2009) as well as the CoCoMac database (http://www.cocomac.org; Stephan et al., 2001).
The parcellation scheme of the macaque IPL as referred to in the Discussion of the present manuscript was adopted from today’s most widely used parcellation of Pandya and Seltzer (1982). This includes areas PF, PFG, PG, and Opt in rostro-caudal sequence, for which differential connection patterns have been shown by several groups. Since not all publications used this parcellation scheme, the results of the respective publications had to be adapted accordingly. Whenever possible, this was based on the ORT algorithm in CoCoMac (Stephan et al., 2001), in other cases by consensus across the literature and among the investigators. Connections reported for area 7b (rostral IPL) were attributed in most cases to areas PF and PFG, whereas connections reported for area 7a (caudal IPL) were attributed to PG and Opt. If rostral or caudal subareas of 7b or 7a were explicitly distinguished and could be identified as either one of the four areas of Pandya and Seltzer, the reported connection was specifically attributed to the respective area.
Results
Fibre tract pattern of IPL areas
The courses of the (hemisphere-specific) fibre tract patterns for the individual IPL seed areas are visualised in Fig. 4. It should be noted that the probabilistic nature of the tractography as well as the inter-individual variability of fibre tract patterns contributes to substantial uncertainty of these group-averaged tracts.
Fig. 4.
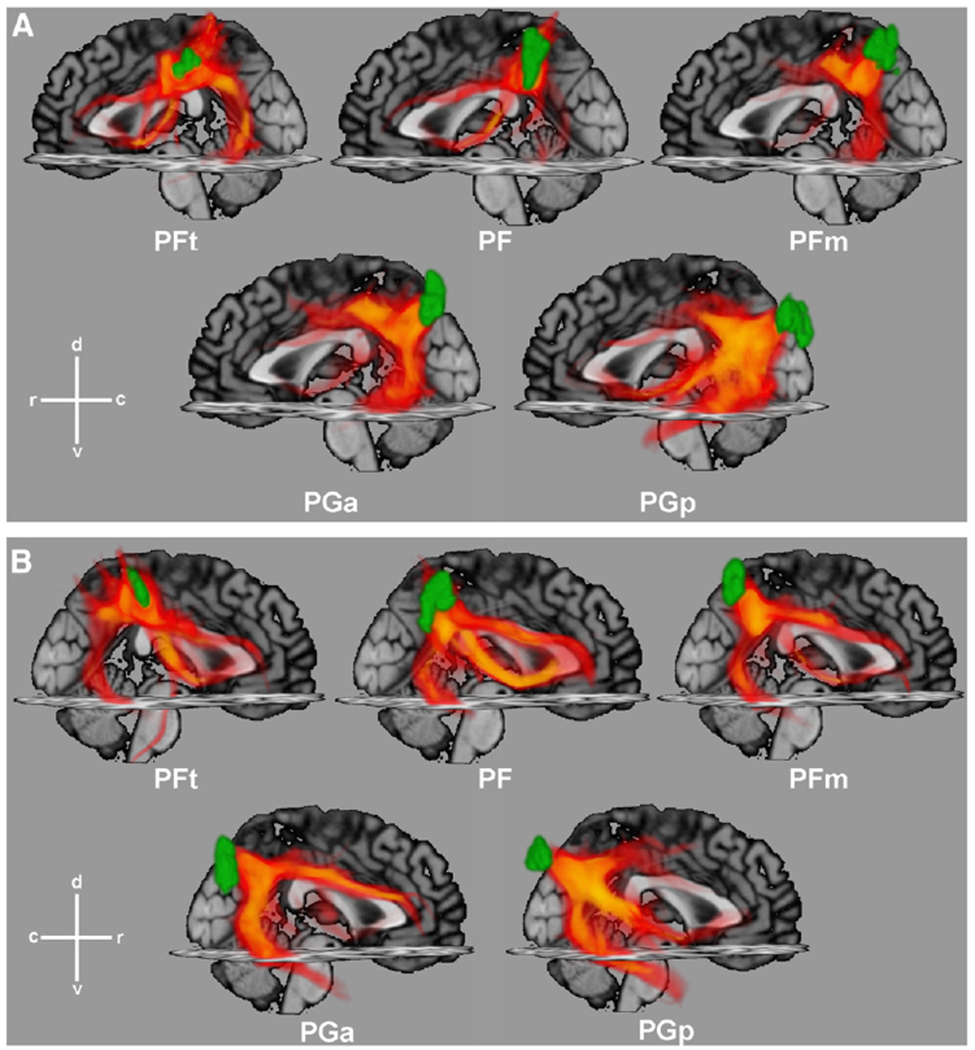
Probabilistic tractography results for five IPL seed areas, ordered from top-left to bottom-right in a rostral sequence and overlaid with the respective cytoarchitectonic seed region (green), for (A) left and (B) right hemisphere. Probabilistic fibre tracts, projected back from individual diffusion spaces into anatomical MNI space, are displayed with regard of the uncertainty of tract traces (among others due to interindividual variability), as revealed by the probabilistic tracking algorithm. The density of traces is colour-coded from opaque yellow for low to transparent red for high uncertainties. Traces are projected onto the sagittal and transversal planes of the MNI single subject template for anatomical orientation. c caudal, d dorsal, r rostral, v ventral.
Visual inspection of the tractography patterns indicates that homologous regions on either hemisphere show a largely similar course. The most conspicuous differences in fibre tract pattern can be observed between rostral (PFt, PF, PFm) and caudal (PGa, PGp) areas of the IPL. Tracts originating from rostral IPL areas tend to run mainly in direction of the inferior frontal, postcentral, and superior parietal regions. They predominantly follow the course of the superior longitudinal (SLF) and arcuate fascicles (AF). In contrast, tracts from caudal IPL areas preferentially follow fibre pathways in direction of lateral occipital and temporal areas, at this joining the inferior longitudinal fascicle via anterior parts of the SLF. Additionally, fibres from the latter region also reach the inferior frontal cortex by a more ventral pathway through the extreme capsule. Interestingly, this differentiation approximately matches the putative location of the border between Brodmann’s areas 40 (rostral, corresponding topographically to the PF areas) and 39 (caudal, PG areas). It should be emphasised, however, that this change in the associated fibre tract patterns is not abrupt but rather shows a gradient when moving from rostral to caudal areas of the IPL with an accentuation at the transition between PFm and PGa.
This visualisation of the probabilistic fibre traces provides qualitative information about possible major pathways connecting the individual areas of the IPL to the rest of the brain, but requires a statistical analysis for quantification of the results.
Seed-target connections of IPL areas
To quantify the respective connectivity patterns, mean trace density in the termination zone obtained from probabilistic tractography for each seed-target combination was assessed relative to the expected trace density at the same distance and statistically tested against its inter-individual variability, providing a measure for the connection likelihood for a given seed-target combination. The findings of these analyses are summarised in Fig. 5 which illustrates those connections of the individual IPL areas that were consistently expressed with higher connection likelihood than expected given their length (p<0.001 for the random-effects inference following Bonferroni-correction for multiple comparisons).
All areas showed consistent connections to inferior frontal (44, 45, frontal operculum, orbitofrontal cortex, frontal pole) and posterior insular regions. The visually apparent shift of predominant connectivity patterns from rostral to caudal IPL areas is also well supported by the statistical analysis. Rostral areas PFt and PF mainly showed consistent connections with targets located in the inferior frontal, somatosensory and superior parietal cortices while reaching only posterior parts of the temporal cortex. Intermediate areas of the IPL (PFm, PGa) likewise show reliable connections to the aforementioned targets, but additionally feature consistent fibre tracts to middle and superior frontal as well as anterior temporal regions. The most caudal area (PGp), finally, again connects with the inferior frontal cortex and, like PFm and PGa, to the entire temporal lobe. In contrast to the other areas, however, there is also significantly expressed connectivity to auditory and temporo-occipital areas.
The visualisation of the fibre tract patterns (Fig. 4) already suggested inter-hemispheric asymmetries. Thus, the fibre tracts that showed consistently greater connection likelihood than expected by chance were further analysed by means of repeated-measures ANOVAs. Fig. 6 summarises the connections that were found to be more pronounced in either hemisphere following correction for multiple comparisons (p<0.05).
Fig. 6.
Schematic drawings of a typical lateral view of a (A) left and (B) right human hemisphere, indicating those connections for which repeated-measures ANOVA revealed a significant left–right asymmetry effect. Only those connections are displayed which were consistently (across subjects) found to be more likely than expected by chance as visualised in Fig. 5. IPL seed areas are marked in five different colours: PFt violet, PF red, PFm green, PGa yellow, PGp blue. Coloured dots beneath each target region indicate the presence of a connection to the respective seed region. For labelling conventions of areas, cf. Table 1.
Rostral IPL areas PFt and PF showed more consistent connections with sensorimotor and superior parietal areas in the left hemisphere, whereas in the right hemisphere, more likely connections existed with secondary somatosensory, posterior insular and inferior opercular and orbito-frontal areas. Caudal IPL areas PGa and PGp had more consistent connections with intraparietal, superior parietal, posterior insular, lateral occipital and auditory areas in the left hemisphere, whereas more likely connections with posterior temporal, temporo-occipital, and inferior frontal areas existed within the right hemisphere. A complete list of the results of the ANOVA can be found in Supplementary Table S1.
While this binarisation into presence or absence of consistent evidence for a connecting fibre tract provides a useful overview over the connectivity of the human IPL, it may fail to reflect finer levels of the rostro-caudal gradients suggested by visual inspection. In order to reveal such gradients and provide more fine-graded information, the relative confidence for each connection has to be considered. Evidently, this analysis again has to accommodate distance-related effects. Connection likelihood of a particular seed-target combination was thus defined by averaging the Z-score (expressing above-chance connectivity) across subjects, reflecting the average chance that the observed trace density would be obtained in the same distance in our group of subjects. Summarising these mean Z-scores for each seed-target connection in a polar plot provided a connectivity fingerprint for each assessed IPL area (cf. Passingham et al., 2002) in which higher values denote stronger evidence for above-chance connectivity.
Comparing the left- and right-hemispheric fingerprints for each seed region again indicated a comparable pattern of connectivity for both hemispheres. Fingerprints of the left hemisphere (Fig. 7) show more consistent connections to temporal areas for all IPL seed areas, probably reflecting the dominance of the arcuate fascicle in the left hemisphere. The shift of fibre tract pattern from rostral to caudal IPL areas is again confirmed by the more fine-grained information provided in the connectivity fingerprints. While most rostral area PFt showed predominant connections to superior parietal cortex and somatosensory regions (major weight of the fingerprint in lower left quadrant of the polar plot), most caudal area PGp featured strong connections to auditory and temporal areas (major weight of the fingerprint in upper right quadrant of polar plot; Figs. 7, 8). Between these two extremes, the connectivity fingerprints for areas PF, PFm, and PGa reflect a relatively continuous shift in connectivity patterns. In particular, the fingerprint of area PF, i.e., the area just caudal to PFt in rostral IPL, closely resembled that of the latter area. The fingerprint of area PFm in the centre of the IPL showed a balanced connectivity to the parietal-sensorimotor and the temporal group. The fingerprint of caudally adjacent area PGa already showed a preponderance of the upper right quadrant.
Fig. 7.
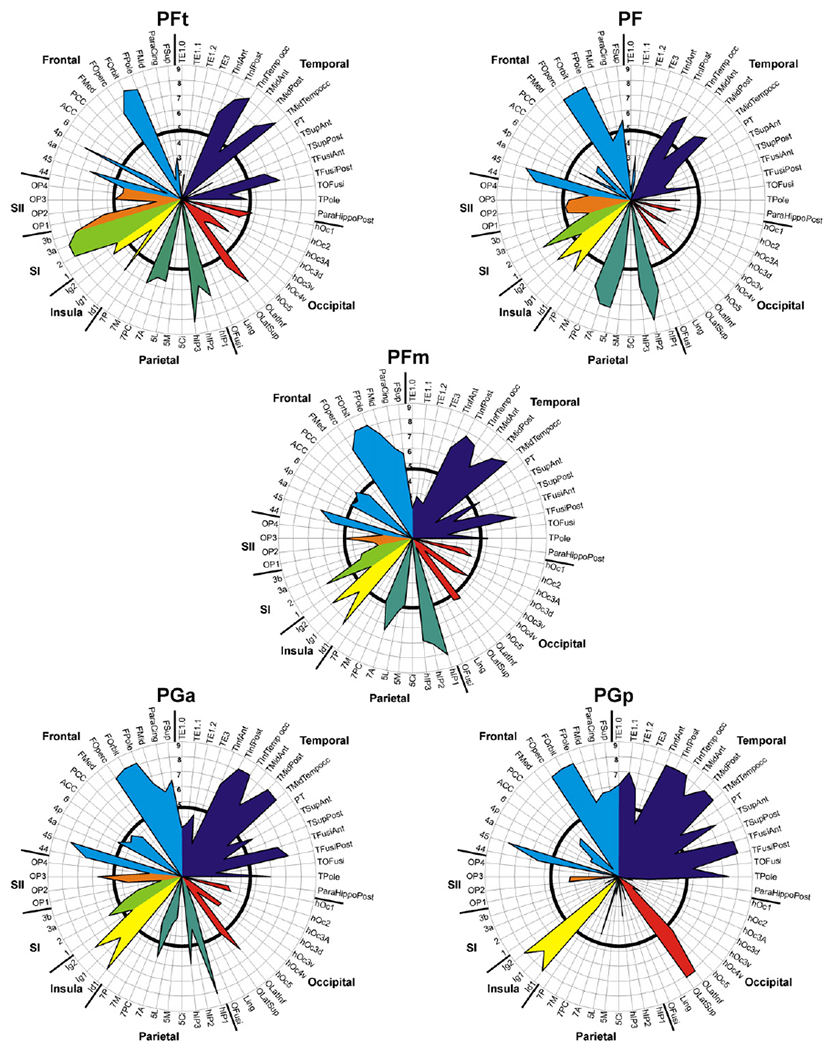
Connectivity fingerprints for the left hemispheric seed regions. Results for consistency testing of fibre tract patterns (across subjects) for each seed-target combination are displayed as Z-scores, reflecting the chance that the observed trace density was higher (positive Z-scores) than expected according to the reference distribution. To clearly highlight the relevant connections (positive Z-scores) of the IPL seed areas, all non-positive (zero or negative) Z-scores (i.e. the chance that observed trace density was lower than or equally high as expected at the same distance) were set to zero. Labelling of areas as introduced in Table 1. Black circle within each polar plot marks a Z-score of 4.80, corresponding to a p-value of 0.001 (corrected for multiple comparisons), to indicate significance of each seed-target connection as a measure of consistency across subjects.
Fig. 8.
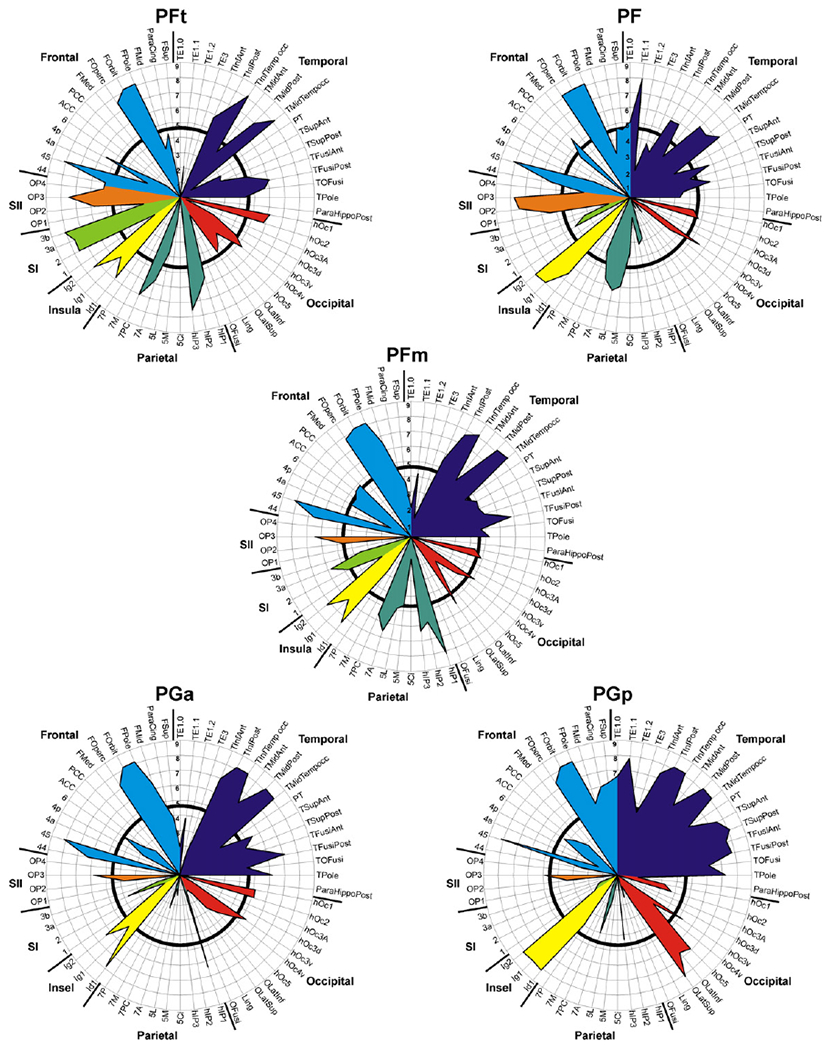
Connectivity Fingerprints for each seed region in the right hemisphere. Results for consistency testing of fibre tract patterns (across subjects) for each seed-target combination are displayed as Z-scores, reflecting the chance that the observed trace density was higher (positive Z-scores) than expected based on the reference distribution. To clearly highlight the relevant connections (positive Z-scores) of the IPL seed areas, all non-positive (zero or negative) Z-scores (i.e. the chance that observed trace density was lower than or equally high as expected at the same distance) were set to zero. Labelling of areas as introduced in Table 1. Black circle within each polar plot marks a Z-score of 4.80, corresponding to a p-value of 0.001 (corrected for multiple comparisons), to indicate significance of each seed-target connection as a measure of consistency across subjects.
Connections of IPL seed areas to anatomically- and functionally-defined target groups
Entering the mean Z-scores across subjects into repeated-measures ANOVAs allowed for statistical confirmation of shift in predominant fibre tract patterns from rostral to caudal IPL seed areas (Fig. 9, Tables 2 and 3).
Fig. 9.
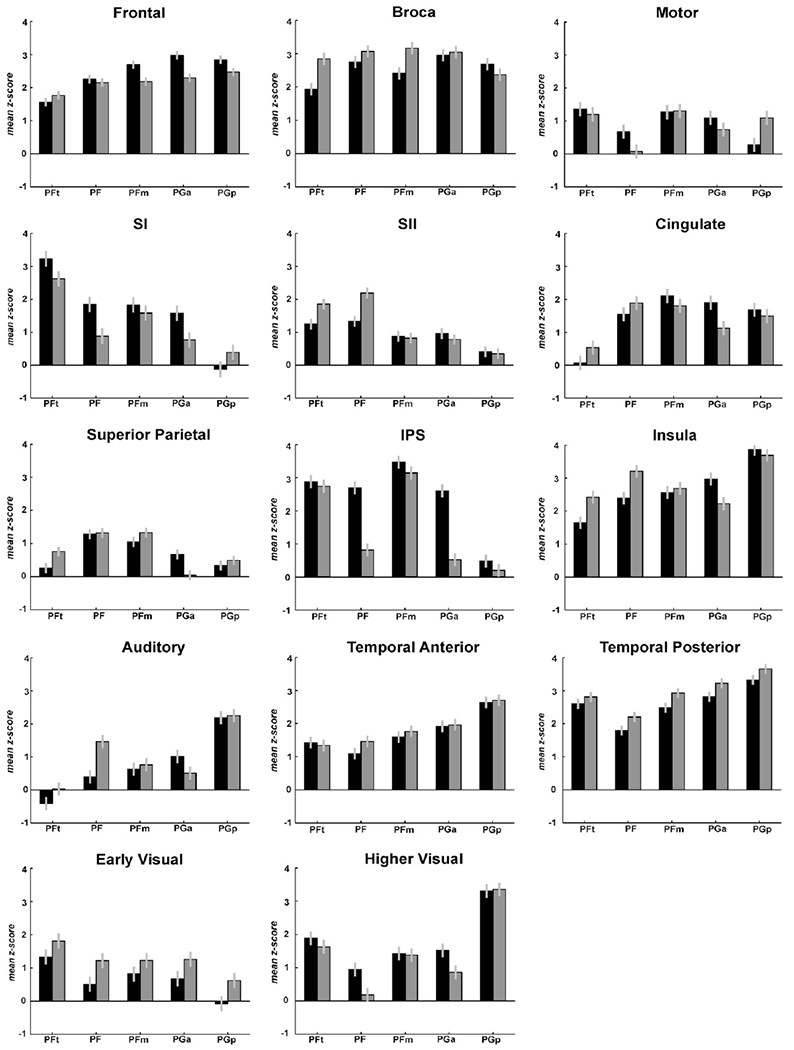
Fibre tract strengths between IPL seed areas (x-axis) and anatomically and functionally relevant groups of targets for left (black bars) and right hemisphere (white bars). Individual fibre tract densities to all target areas, separated for left and right hemispheres, can be found in Supplementary Figs. S1–S4. Connection strengths are displayed as mean Z-scores across subjects (averaged across targets within each group), derived from the comparison for each seed-target connection with the reference distribution. Error bars denote standard error. For each plot, the statistics from the repeated-measures ANOVA are displayed beneath the heading of the plot. Grouping of target areas is indicated in Table 2. Fibre tract strengths between IPL seed areas (x-axis) and anatomically and functionally relevant groups of targets for left (black bars) and right hemisphere (white bars). Individual fibre tract densities to all target areas, separated for left and right hemispheres, can be found in Supplementary Figs. S1–S4. Connection strengths are displayed as mean Z-scores across subjects (averaged across targets within each group), derived from the comparison for each seed-target connection with the reference distribution. Error bars denote standard error. For each plot, the statistics from the repeated-measures ANOVA are displayed beneath the heading of the plot. Grouping of target areas is indicated in Table 2.
Table 2.
Grouping of target areas in relation to anatomical and functional criteria.
| Group name | Included areas |
|---|---|
| Frontal | FMed, FMid, FOperc, FOrbit, FPole, FSup |
| Broca | 44, 45 |
| Motor | 4a, 4p, 6 |
| Primary somatosensory (SI) | 3a, 3b, 1, 2 |
| Secondary somatosensory (SII) | OP1, OP2, OP3, OP4 |
| Cingulate | ACC, PCC, ParaCing |
| Superior parietal | 5L, 5M, 5Ci, 7PC, 7A, 7M, 7P |
| Intraparietal sulcus (IPS) | hIP1, hIP2, hIP3 |
| Insula | Id1, Ig1, Ig2 |
| Auditory | TE1.0, TE1.1, TE1.2, TE3 |
| Temporal anterior | TSup Ant, TMidAnt, TInfAnt, TFusiAnt, TPole |
| Temporal posterior | TSupPost, TMidPost, TMidTempocc, TInfPost, TInfTempocc, TFusiPost, TOFusi |
| Early visual | V1, V2, V3A, V3d, V3v, V4v |
| Higher visual | V5, OLatSup, OLatInf |
Labelling of areas as introduced in Table 1.
Table 3.
Statistics of connections between seeds and groups of targets.
| Group name | Main effect ‘Seed’ | Main effect ‘Hemi’ | Interaction ‘Seed×Hemi’ |
|---|---|---|---|
| Frontal | < 0.001 | < 0.001 | 0.004 |
| Broca | 0.003 | 0.002 | 0.005 |
| Motor | <0.001 | 0.700 | 0.013 |
| Primary somatosensory (SI) | <0.001 | 0.004 | 0.014 |
| Secondary somatosensory (SII) | <0.001 | 0.018 | 0.002 |
| Cingulate | <0.001 | 0.497 | 0.026 |
| Superior parietal | <0.001 | 0.444 | 0.002 |
| Intraparietal sulcus (IPS) | <0.001 | <0.001 | <0.001 |
| Insula | <0.001 | 0.192 | <0.001 |
| Auditory | <0.001 | 0.058 | 0.002 |
| Temporal anterior | <0.001 | 0.289 | 0.736 |
| Temporal posterior | <0.001 | <0.001 | 0.932 |
| Early visual | <0.001 | <0.001 | 0.951 |
| Higher visual | <0.001 | 0.010 | 0.178 |
Groups of areas as defined in Table 2. Values in the columns Main effect ‘Seed’, Main effect ‘Hemi’, and Interaction ‘Seed×Hemi’ denote the p-values of the repeated-measures ANOVA. Significant results for p<0.001 are marked in bold type. Hemi: Hemisphere.
Targets were summarised into anatomically or functionally defined groups as follows. First, target areas within different anatomical brain regions were grouped together (frontal, parietal, occipital, temporal). Where meaningfully possible, groups were further subdivided with respect to functional systems (e.g. motor, primary and secondary somatosensory, early and higher visual, auditory) based on knowledge from neuroimaging, lesion data, and non-human primates. Such analysis for different groups of targets provided information about the involvement of the IPL seed areas in different functional systems. The connection likelihoods for each seed are displayed for each target individually in Supplementary Figs. S2–S5.
For all target groups, there was a significant main effect of factor “IPL seed” (Fig. 9), indicating that for each given target region connection likelihood was differentially expressed between the individual seed areas. This result thus statistically confirmed the above summary of the connectivity fingerprints (Figs. 7 and 8). While prefrontal areas showed a slight increase in connection likelihood from rostral to caudal IPL areas, Broca’s region had highest fibre tract densities in the intermediate areas PF, PFm, and PGa, with lower connection likelihood to area PFt. Secondary (SII) and particularly primary (SI) somatosensory cortex, to the contrary, showed a pronounced decrease in fibre tract density from PFt to PGp (Fig. 9, first two rows). A similar, though less pronounced pattern was seen for the superior parietal cortex while the anterior intraparietal sulcus (Choi et al., 2006; Scheperjans et al., 2008a,b) featured an abrupt drop in connection likelihood from the anterior PF- to the posterior PG-areas.
The posterior insula (Kurth et al., 2010), in contrast, showed an increase in connection likelihood from rostral to caudal IPL seed areas. This pattern was even more pronounced for the auditory and temporal regions, which all showed a strong increase in fibre tract density from rostral to caudal IPL areas. In addition, it should be noted that the overall connection likelihood with the IPL is substantially higher for posterior temporal target areas as compared to the anterior temporal and auditory ones (Fig. 9, fourth row). Within the occipital lobe, two groups of areas could be differentiated: Early visual areas (V1–V4v) showed generally low connection likelihood with a slight decrease from rostral to caudal IPL areas whereas higher visual areas (on lateral occipital cortex up to V5) showed a pronounced increase in fibre tract density from rostral to caudal IPL areas (Fig. 9, last row).
Discussion
The fibre tract patterns of five cytoarchitectonic areas on the lateral surface of the human inferior parietal lobule were assessed by means of probabilistic tractography. Connection likelihood was analysed by evaluating the number of traces reaching a particular target against those reaching other voxels in the same distance from the seed. Random-effects inference then delineated connections that were consistently (across subjects) expressed with higher than expected densities. Across IPL areas, most consistent connections existed with inferior frontal, posterior temporal and insular targets. Connectivity patterns, however, shifted gradually from rostral to caudal IPL areas. Whereas rostral areas featured most likely connections to somatosensory and superior parietal areas, more caudal areas were predominantly connected to the temporal lobe. Connectivity patterns of IPL areas favoured a left–right asymmetry with regard to different target areas of somatosensory, superior parietal (left hemisphere), and inferior frontal, orbito-frontal and temporal areas (right hemisphere).
Methodological considerations
Any kind of tractography study faces the problem of false positives or negatives due to limits in effective resolution, resulting in non-resolved crossing/kissing fibres. This can cause tractography traces to get absorbed into bigger fibre bundles like the superior longitudinal or arcuate fascicle (Ciccarelli et al., 2003; Klein et al., 2009). This problem is ameliorated by using probabilistic (instead of deterministic) tractography methods with crossing fibre models (Behrens et al., 2007) . Moreover, tractography results are highly dependent on the distance between seed and target (Behrens et al., 2003a,b). This may already impair relative comparisons between individual results, the procedure currently most frequently used in tractography studies (e.g. Behrens et al., 2003a; Rushworth et al., 2006; Uddin et al., 2010). More importantly, it makes inference about the relevance of a particular trace density for a given seed-target combination hardly possible. Thus, it is difficult to infer whether a particular observed trace-density is indeed indicative of a fibre connection between these two regions.
We aimed at addressing these two problems by the present algorithm by introducing a reference distribution of traces for each seed-target combination. The reference distribution was set depending on the distance between seed and target, thus accounting for the possible confounding factor “distance” within further analysis. Furthermore, this distribution provided a reference to evaluate each seed-target connection separately by testing if traces between seed and target were more consistently expressed (across subjects) than expected at the same distance from the seed. Thus, for each seed-target connection, we could evaluate if connection likelihood was consistently above chance.
Nevertheless, it still has to be emphasised that DTI does not provide information about anatomical connectivity sensu stricto, i.e. synaptic connectivity as revealed by invasive tracer studies in macaques, which will be discussed in the next section. Rather, this method assesses the presence and confidence about macroanatomical fibre bundles between seeds and targets.
By using probabilistic atlases for delineation of seed and target areas together with probabilistic tractograhpy, it was possible to stringently use probabilistic approaches throughout the current study. Like probabilistic tractography for fibre paths, probabilistic atlases accommodate inter-subject variability and hence allow inclusion of uncertainty estimates into the investigation. Combining two different probabilistic atlases of the human cerebral cortex (JHA and HCSA) allowed for whole brain coverage. Some regions, however, were covered in a more coarse fashion than others due to the current limitation of available atlases. For example, the middle and superior frontal gyrus were only covered by a single area each. Based on different parcellation schemes, it could be assumed that these two regions can at least be separated into areas 8, 9, and 46. As known from studies in macaques, these areas can be further subdivided, supporting the notion that a comparably fine-grained parcellation can be assumed for the human prefrontal cortex as well. Areas 46v, 46d, 8A, 8B, and 9 of the macaque prefrontal cortex show a differential connection pattern with the IPL areas (see discussion below). Thus, it can be assumed that such parcellation might yield a differential connectivity pattern also in humans. Our results may hence represent a first overview of the global connectivity patterns of inferior parietal areas rather than a fine-grained description of pre-frontal connections. By the time reliable information on a functionally relevant parcellation of the human prefrontal cortex will be available, future studies might add further insight into the patterns of anatomical connections between human prefrontal and inferior parietal areas.
It has to be further emphasised that our approach with definition of seed and target areas is different from the connectivity-based parcellation which aims at parcellation of a cortical region based on its connectivity pattern to every other voxel in the brain (Anwander et al., 2007; Behrens et al., 2003a; Eickhoff et al., 2011; Johansen-Berg et al., 2004) In these approaches, connectivity was assessed without a priori anatomical suppositions about potentially connected areas, thus allowing for an assumption-free investigation of brain connectivity. Our approach in turn is based on a priori knowledge on the location of cortical areas which limits the analysis to previously defined regions. Hua et al. (2009) described an approach which combined the ideas of both seed-target and connectivity-based parcellation approaches: First, they obtained overall probability distributions from all voxels inside the brain. In a second step, they drew regions of interest across the cortex. Each resulting trace of the first analysis was post-hoc assigned to one of the fibre tracts known to be connected with the respective region of interest which was passed by the tractography trace. Thus, Hua et al. (2009) also used a priori anatomical knowledge for definition of regions of interest. But in contrast to the approach of the present study, their regions of interest were not used as seed regions for tractography, but rather as targets through which existing tracts should go. Thus, they also identified those target regions which were reached by certain traces, but based on overall tract distributions within the brain. Conversely, we focused on traces which originated in different predefined seed regions.
Connectivity patterns of macaque IPL areas and homology considerations
The overall pattern revealed by our results bears close resemblance to the axonal connection patterns found in tracer studies on macaques (Fig. 10), as both species showed a comparable rostrocaudal shift in preferential connectivity.
In macaques, rostral IPL areas mainly connected to (pre-) motor, inferior frontal, somatosensory, superior parietal and posterior temporal areas (Fig. 10). A similar pattern was found here for rostal human IPL areas PFt and PF, hinting at a possible homology between human areas PFt/PF and macaque areas PF/PFG, respectively. This is further supported by a recent tracing study (Petrides and Pandya, 2009) showing that macaque area PF is mainly connected to ventral premotor cortex (area 6v), whereas intermediate areas PFG and PG preferentially connected to areas 44 and 45. A similar pattern was found here for human IPL as rostral-most area PFt showed weaker connectivity to areas 44 and 45 than intermediate areas PF, PFm, and PGa (Fig. S2).
Caudal IPL areas in macaques showed connections to more dorsal parietal areas, the prefrontal cortex (in particular true for area PG) as well as numerous areas within the whole temporal lobe (in particular for Opt; Fig. 10). This pattern strongly resembled that of the two caudal-most areas of human IPL (areas PGa and PGp), suggesting a possible homology between human PGa/PGp and macaque PG/Opt, respectively.
Intermediate human IPL area PFm which does not have an obvious homologue in macaques showed characteristics of both rostral and caudal connection patterns. Interestingly, cytoarchitectonic features of this region also share characteristics of rostral and caudal IPL areas (Caspers et al., 2006). It may thus be speculated that this intermediate area in human IPL is a new evolutionary feature that may have derived from a more subtle subdivision of adjacent PFG or PG in the macaque IPL (Krubitzer, 2009). This view is further supported by recent evidence that especially central parts of the IPL may have evolved more pronouncedly in humans than other parts of the brain (Husain and Nachev, 2007; Rushworth et al., 2009; Simon et al., 2004).
Despite these congruencies, there are also notable differences in fibre tract patterns between human and macaque IPL, e.g. with respect to occipital connections. Whereas for macaques no connections between IPL and primary and secondary visual areas V1 and V2 were observed, the results of our present study suggest such fibre tracts in humans. Higher visual areas as V3 and V4 connect to caudal IPL areas in the macaque whereas in humans connections are also found with the more rostral IPL (e.g., for targets OLatSup, OLatInf). To provide a possible explanation for these differences, one has to consider several aspects.
It has been argued that the macaque visual system follows a rather strict hierarchy: While earlier visual areas such as V1 and V2 first project to higher extrastriate areas such as V3, V4, DP, and LIP, these areas in turn provide the relevant visually related connections with caudal IPL areas (Andersen et al., 1990). It might be assumed that a comparable hierarchical processing stream exists in humans, making the existence of any direct tract between early visual and IPL areas unlikely. This suspicion is strengthened by the notion that caudal rather than rostral IPL areas are primarily involved in visual processing (cf. Mountcastle et al., 1975; Hyvärinen, 1982 in macaques; e.g., Fink et al., 2001 in humans). On the other hand, however, a recent meta-analysis indicated that rostral IPL areas and higher visual areas are conjointly recruited by action observation (Caspers et al., 2010), matching the existence of mirror neurons in the rostral IPL of macaques (Rizzolatti, 2005). How such visual input reaches the rostral IPL, however, is still unclear. The present data suggest that connections from earlier visual areas may contribute to this functional interaction even though such connections have not yet been demonstrated in macaques. Such shortcuts may hold a particular relevance for the rapid, “on-line” processing of observed actions, in particular in the context of social interactions. The finding that not only mirror neurons, but also grasping neurons were found to be located within macaque area PFG (Rozzi et al., 2008) further supports this notion since grasping-related actions highly rely on visual input.
From a methodological perspective, however, one also has to consider the relative advantages and drawbacks of tracer studies (in macaques) and DTI. Whereas tracing methods reveal axonal connectivity and yield a high specificity, their sensitivity may be limited by the selection of injection sites and methods, incomplete tracer uptake or spread, unexpectedly slow transport (or to early sacrifice), the histological method used to detect the labelled brain sites and the (usual) lack of whole brain coverage (Köbbert et al., 2000; Stephan et al., 2001). In contrast, DTI is particularly prone to false positives due to limited resolution and limited specificity. This pertains in particular to the assimilation of traces into major fibre bundles that are a frequent source of false positive results. Independent of evolutionary differences, interpretation of the current finding thus faces the challenge that it is present in the more sensitive but distinctly less specific method but absent in the specific but somewhat less sensitive approach. In summary, we would thus cautiously suggest that connections between visual areas and anterior IPL would be physiologically reasonable as a fast framework for action observation and may warrant further investigation by specifically targeted tracing experiments. Until such confirmation, however, the possibility of false positives in tractography has to be considered an at least equally likely scenario.
A similar argument pertains to the connections to the frontal pole found in the present study. For the macaque, it must remain tentative if such connections are indeed absent since review of the relevant literature (Petrides and Pandya, 1984; Cavada and Goldman-Rakic, 1989b; Andersen et al., 1990; Rozzi et al., 2006) together with information from the CoCoMac database did not provide final evidence about their presence or absence. Nevertheless, a recent study demonstrated nonexisting connections between IPL and anterior prefrontal regions in macaques (Petrides and Pandya, 2007) . But it was also argued that in particular prefrontal cortex showed very strong expansion in the evolution from macaques to humans (Semendeferi et al., 2001). A comparable suggestion was raised for the IPL in humans as compared to macaques (Husain and Nachev, 2007; Simon et al., 2004), a concept which was particularly stressed for the central parts of IPL (see above; Rushworth et al., 2009). In a recent study, Mars et al. (2011) could show that the IPL, its central part in particular, was functionally connected with anterior prefrontal cortex whereas no such interaction was found in macaques. In the present study, we also found such connections between IPL areas and the frontal pole region which further supports these recent findings of resting-state functional connectivity and evolutionary considerations and provides evidence for a direct anatomical connection between these two cortical regions.
With regard to other prefrontal regions, the current study is certainly limited by the lack of reliable target regions. This limits the comparison to a juxtaposition of the connections of the ‘superior frontal gyrus’ target with a summary of results for macaque areas 8 and 9. Whereas all but the rostral-most IPL area were found to connect with the superior frontal gyrus, mainly caudal areas of the macaque IPL seemed to project to superior frontal areas 8B and 9. Likewise, for the middle frontal gyrus, the present human data mainly fit the macaque data of target areas 46d and 8A, but not area 46v. In both cases, we would resort to caution regarding evolutionary interpretations, since no reliable more fine-grained and functionally relevant parcellation of human prefrontal cortex is currently available. The issue of prefrontal connections of IPL areas thus warrants further investigation once such information becomes available in humans.
On a more general note, our results again highlight the difficulty of establishing inter-species differences in the concurrent presence of diverging methods and potential evolutionary changes. One approach to address this problem is to use the same method (DTI) in both species, as done in studies on the arcuate fasciculus (Rilling et al., 2008), prefrontal-cerebellar circuits (Ramnani et al., 2006), and prefrontal connections (Croxson et al., 2005). The studies show good agreement between human and macaque DTI data, but point to considerable inter-species differences in connectivity patterns even when using a comparable method. On the other hand, Dyrby et al. (2007) and Schmahmann et al. (2007) demonstrated that while many connections obtained from invasive tracing methods could also be replicated by means of DTI tractography in the same animal, others could not. Are thus all differences between humans and primates related to limitations of one (or both) technique? We would argue against this view, since evolutionary effects that result in the evident differences between macaque and man also warrant consideration. While humans share many aspects of cortical organisation with non-human primates, uniquely human features may not be neglected (Finlay et al., 2001; Kaas, 2006; Kaas and Preuss, 2003; Striedter, 2005). This may hold true particularly for the regions showing the most pronounced differences as discussed above, the prefrontal cortex (which is vastly expanded and presumably re-organised in humans, cf. Semendeferi et al., 2001) and the occipital lobe, which also has a considerable differential morphology in humans and macaques due to different importance of the visual system in these two species. While primary visual cortex (V1) in macaques occupies a major part of the lateral occipital cortex, the same region in humans is mainly located on the mesial surface within the calcarine sulcus. The same holds true for the extrastriate visual areas V2–V5 which in the macaque are located within the lunate sulcus and on the prelunate gyrus, bringing them close to the caudal end of the IPL (Kaas, 2006; Ungerleider and Haxby, 1994), whereas in humans these areas are located more caudo-ventrally (ventral visual stream) and caudo-dorsally (dorsal visual stream) (Amunts et al., 2000; Malikovic et al., 2007; Rottschy et al., 2007). Finally, differential connectivity pattern of comparable regions may also result from differential cortical structure and folding patterns as white matter tracts had to adapt to the gross morphological differences as well (Kaas, 2000).
Considering these potential pitfalls when comparing connectivity patterns of humans and macaques, it seems even more important to take a systems perspective and use a large number of target areas to establish connectivity profiles of several seed areas. Such an approach provides a complementary approach to the connectivity-based parcellation used by Mars et al. (2011). Using the present approach of predefined seed and target areas, we could show that connectivity of human IPL areas shifted gradually from rostral to caudal. We thus amended the findings of Mars et al. (2011) who demonstrated that a similar parcellation of the IPL as based on cytoarchitecture (Caspers et al., 2006, 2008) was possible by means of DTI. Within the present study, we could elucidate how these assumed differences manifested with regard to differential connections to numerous target areas. Furthermore, we could show, in spite of the discussed differences that a similar connection pattern as in macaques (Gregoriou et al., 2006; Rozzi et al., 2006) also existed in humans. This supported the notion of a differential involvement of IPL areas in functional cortical networks which was already assumed based on electrophysiological recordings from different parts of macaque IPL (Hyvärinen, 1982; Mountcastle et al., 1975; Seltzer and Pandya, 1984).
Relation to functional segregation
The potential human mirror neuron system has received particular interest in the study of IPL functions (Rizzolatti and Craighero, 2004; lacoboni, 2005; Keysers and Gazzola, 2009). In a recent meta-analysis, it was shown that particularly the rostral-most area PFt was strongly engaged in action observation and imitation (Caspers et al., 2010). In these tasks, PFt co-activated with a region in the caudal-most aspect of ventral premotor cortex (vPMC) (comparable to the macaque mirror neuron system; Rizzolatti, 2005). This view is supported by human DTI studies highlighting vPMC to rostral IPL connections (Rushworth et al., 2006; Tomassini et al., 2007) and a study by Kelly et al. (2010) on resting-state co-activation pattern of Broca’s region, and more specifically by a recent macaque study of Petrides and Pandya (2009) showing differential connections from rostral IPL to different vPMC areas. PFt furthermore co-activated with SI, superior parietal and posterior temporal regions. The present study demonstrated that indeed rostral IPL areas showed consistent connections with Broca’s region. But more importantly, area PFt also showed consistent anatomical connections with SI, superior and intraparietal, and posterior temporal areas. We would thus argue that these fibre tracts represent the structural scaffold for the previously described functional “mirror neuron” network (Caspers et al., 2010). This notion is further supported by the lateralization structure of the connections of rostral IPL: connections with sensorimotor regions were more consistently found in the left as compared to the right hemisphere in the present study. For the potential human mirror neuron network, it was argued that such higher motor functions would likely be assumed to be supported by a bilateral network of brain areas (Iacoboni and Dapretto, 2006) which was supported by a recent meta-analysis (Caspers et al., 2010). But there have also been findings of a functional left-lateralization within this network (Rizzolatti and Arbib, 1998; Aziz-Zadeh et al., 2004). Based on the results of the present study, we would argue that the connections between rostral IPL and areas relevant within this potential mirror neuron network are more consistently expressed within the left hemisphere. It has to be noted that all our subjects were right-handed, thus introducing a potential bias towards the contralateral left hemisphere for any sensorimotor processing. It has furthermore to be stressed that mirror-related activity within IPL may also exhibit a right-lateralization, depending on the task demands (Biermann-Ruben et al., 2008). Such overriding of a potentially present general leftward-lateralization was in particular observed in the context of emotion-processing (Carr et al., 2003). Thus, it might be speculated that the predominance of left hemispheric anatomical connections as found in the present study only partially account for functional phenomena within the potential human mirror-neuron network. Findings of bilateral or right-lateralized activations within IPL might demonstrate that functional demands and the specific experimental context might be at least as important in determining functional recruitment as the structural basis of anatomical connections.
Within the language network, areas of the (left) caudal IPL, corresponding to Geschwind’s area (Geschwind, 1970), have been related to semantic and phonological processing, especially during reading (Price, 2000; Vigneau et al., 2006). Presumably, the main fibre pathway connecting Broca’s, Geschwind’s, and Wernicke’s area is the arcuate fasciculus (Catani et al., 2005; Parker et al., 2005; Frey et al., 2008; Saur et al., 2008). These studies also demonstrated an additional ventral fibre system via the external or extreme capsule. The present study showed that particularly PGa and PGp are connected to Broca’s region via this ventral route.
Overall, all IPL areas showed quite consistent connections with Broca’s region. This finding suggested that language-related functions might involve different parts of the IPL, specialised for different language-related aspects. With regard to the potential human mirror-neuron system within rostral IPL, these consistent connections to Broca’s region might be regarded as evidence for the assumed relation between the mirror neurons and the development of language (Rizzolatti and Arbib, 1998). Within the IPL, more caudal areas might relate to reading aspects (Price, 2000), which would be supported by the current finding of additional visual input to these areas. Their connection to Broca’s region and temporal though not auditory cortex furthermore point to an involvement in vocalisation (Catani et al., 2005; Saur et al., 2008). Moreover, PGp showed consistent connection patterns with auditory areas. It may thus represent the key IPL node for auditory language processing, a view supported by functional studies (Price, 2000; Saur et al., 2008). With respect to a hemispheric asymmetry of connectivity of these two caudal IPL areas, the present study revealed higher likelihood of connections to auditory, higher visual, and frontal opercular areas in the left hemisphere. It might be speculated how such connection pattern especially within the left hemisphere might relate to language functions. Geschwind (1965,1970) not only highlighted the aspect of reading to be located within rostral parts of the angular gyrus, but furthermore stressed that this left IPL hub would integrate visual and auditory word forms to generate speech (Price, 2000). In functional studies, it became evident that some aspects of the semantic processing network were modality specific, thus having an auditory (auditory cortex) and a visual component (higher visual areas, inferior posterior temporal cortex). These earlier areas were found to be involved in either semantic or phonological processing (Vigneau et al., 2006). The predominant connections to both auditory and higher visual areas in the left hemisphere, as found in the present study, might support the notion that these areas integrate these different modalities for semantic or phonological processing, independent from input modality.
But the leftward asymmetry of connections of the caudal IPL areas also comprises connections to superior parietal and intraparietal areas. These latter areas have consistently been implicated in number magnitude processing. During more complex processing steps such as calculation, the left caudal IPL is strongly involved as well (Dehaene et al., 1998; Fias et al., 2003; Nieder, 2005; Ansari, 2008; Dehaene, 2009) . With the predominance of left hemispheric connections to the intraparietal and superior parietal areas found in the present study, caudal IPL area PGa might reflect the relevant part of the angular gyrus which is involved in number processing. The respective underlying fibre tracts provide the anatomical basis for a close communication pathway between these areas, with a potential link to the language system with vocalisation of the numbers (see above).
Areas of right IPL are part of the ventral attention network as proposed by Corbetta and Shulman (2002, 2008). This network involves IPL, posterior temporal and inferior/middle frontal areas. Within the IPL, damage to areas close to the temporo-parietal junction (TPJ) is associated with the emergence of spatial neglect (Hillis, 2006). This would presumably match the location of areas PFm and PGa. In the present study, it could be shown that these areas featured consistent connections to posterior temporal and inferior frontal areas (like the other IPL areas), but particularly also to middle frontal cortex. Based on this fibre tract pattern which matches the co-activation pattern of respective functional studies (Corbetta and Shulman, 2002; Corbetta et al., 2008), it can be assumed that especially areas PFm and PGa play an important role in the ventral attention network, possibly in combination with caudal most area PGp. Further strong connections existed with lateral superior and intraparietal areas, providing a possible link to the dorsal part of the attention network (Corbetta and Shulman, 2002). Besides some remarks on a possible bilateral distribution of this network, especially the ventral attention network was most consistently found in the right hemisphere. Taking into account the right lateralization of consistent fibre tracts from these caudal IPL areas to posterior temporal, temporo-occipital and inferior frontal areas, the present study might provide the potential anatomical connectional basis of how the areas of the ventral attention network might interact. Based on the fibre connections found to be dominant in the right hemisphere, it seems reasonable to assume that information between posterior temporal and inferior frontal regions are transported via caudal IPL. The right hemisphere analogue of the arcuate fasciculus of the left hemisphere might provide the necessary pathways here.
The good agreement between anatomical fibre tract patterns of IPL areas and their possible functional roles provides strong evidence for their differential involvement in specific neural networks. The investigation of the functional and potentially context-specific relevance of these connections as revealed by effective connectivity analyses represents an important topic for future studies on connectivity of human IPL.
Supplementary materials related to this article can be found online at doi:10.1016/j.neuroimage.2011.06.027.
Supplementary Material
Acknowledgments
This Human Brain Project/Neuroinformatics Research was funded by the National Institute of Biomedical Imaging and Bioengeneering, the National Institute of Neurological Disorders and Stroke and the National Institute of Mental Health (KZ). Further funding was granted by the Human Brain Project (R01-MH074457-01A1; SBE), the Initiative and Networking Fund of the Helmholtz Association within the Helmholtz Alliance on Systems Biology (Human Brain Model; KZ, SBE), and the Helmholtz Alliance for Mental Health in an Aging Society (HelMA; KZ).
References
- Amunts K, Schleicher A, Bürgel U, Mohlberg H, Uylings HBM, Zilles K, 1999. Broca’s region revisited: cytoarchitecture and intersubject variability. J. Comp. Neurol 412, 319–341. [DOI] [PubMed] [Google Scholar]
- Amunts K, Malikovic A, Mohlberg H, Schormann T, Zilles K, 2000. Brodmann’s areas 17 and 18 brought into stereotaxic space – where and how variable? Neuroimage 11, 66–84. [DOI] [PubMed] [Google Scholar]
- Andersen RA, Asanuma C, Essick G, Siegel RM, 1990. Corticocortical connections of anatomically and physiologically defined subdivisions within the inferior parietal lobule. J. Comp. Neurol 296, 65–113. [DOI] [PubMed] [Google Scholar]
- Ansari D, 2008. Effects of development and enculturation on number representation in the brain. Nat. Rev. Neurosci 9, 278–291. [DOI] [PubMed] [Google Scholar]
- Anwander A, Tittgemeyer M, von Cramon DY, Friederici AD, Knösche TR, 2007. Connectivity-based parcellation of Broca’s area. Cereb. Cortex 17 (4), 816–825. [DOI] [PubMed] [Google Scholar]
- Ashburner J, Friston KJ, 2005. Unified segmentation. Neuroimage 26, 839–851. [DOI] [PubMed] [Google Scholar]
- Aziz-Zadeh L, Iacoboni M, Zaidel E, Wilson S, Mazziotta J, 2004. Left hemisphere motor facilitation in response to manual action sounds. Eur. J. Neurosci 19, 2609–2612. [DOI] [PubMed] [Google Scholar]
- Behrens TE, Johansen-Berg H, Woolrich MW, Smith SM, Wheeler-Kingshott CAM, Boulby PA , Barker GJ , Sillery EL, Sheehan K, Ciccarelli O , Thompson AJ, Brady JM, Matthews PM, 2003a. Non-invasive mapping of connections between human thalamus and cortex using diffusion imaging. Nat. Neurosci 6 (7), 750–757. [DOI] [PubMed] [Google Scholar]
- Behrens TE, Woolrich MW, Jenkinson M, Johansen-Berg H, Nunes RG, Clare S, Matthews PM, Brady JM, Smith SM, 2003b. Characterization and propagation of uncertainty in diffusion-weighted MR imaging. Magn. Reson. Med 50, 1077–1088. [DOI] [PubMed] [Google Scholar]
- Behrens TE, Johansen-Berg H, Jbabdi S, Rushworth MF, Woolrich MW, 2007. Probabilistic diffusion tractography with multiple fibre orientations: What can we gain? Neuroimage 34 (1), 144–155. [DOI] [PMC free article] [PubMed] [Google Scholar]
- Biermann-Ruben K, Kessler K, Jonas M, Siebner HM, Bäumer T, Münchau A, Schnitzler A, 2008. Right hemisphere contributions to imitation tasks. Eur. J. Neurosci 27, 1843–1855. [DOI] [PubMed] [Google Scholar]
- Carr L, Iacoboni M, Dubeau MC, Mazziotta JC, Lenzi GL, 2003. Neural mechanisms of empathy in humans: a relay from neural systems for imitation to limbic areas. Proc. Natl. Acad. Sci. U. S. A 100 (9), 5497–5502. [DOI] [PMC free article] [PubMed] [Google Scholar]
- Caspers S, Geyer S, Schleicher A, Mohlberg H, Amunts K, Zilles K, 2006. The human inferior parietal cortex: cytoarchitectonic parcellation and interindividual variability. Neuroimage 33 (2), 430–448. [DOI] [PubMed] [Google Scholar]
- Caspers S, Eickhoff SB, Geyer S, Scheperjans F, Mohlberg H, Zilles K, Amunts K, 2008. The human inferior parietal lobule in stereotaxic space. Brain Struct. Funct 212, 481–495. [DOI] [PubMed] [Google Scholar]
- Caspers S, Zilles K, Laird AR, Eickhoff SB, 2010. ALE meta-analysis of action observation and imitation in the human brain. Neuroimage 50, 1148–1167. [DOI] [PMC free article] [PubMed] [Google Scholar]
- Catani M, Jones DK, ffytche DH, 2005. Perisylvian language networks of the human brain. Ann. Neurol 57, 8–16. [DOI] [PubMed] [Google Scholar]
- Cavada C, Goldman-Rakic PS, 1989a. Posterior parietal cortex in rhesus monkey: I. Parcellation of areas based on distinctive limbic and sensory corticocortical connections. J. Comp. Neurol 287, 393–421. [DOI] [PubMed] [Google Scholar]
- Cavada C, Goldman-Rakic PS, 1989b. Posterior parietal cortex in rhesus monkey: II. Evidence of segregated corticocortical networks linking sensory and limbic areas with the frontal lobe. J. Comp. Neurol 287, 422–445. [DOI] [PubMed] [Google Scholar]
- Choi HJ, Zilles K, Mohlberg H, Schleicher A, Fink GR, Armstrong E, Amunts K, 2006. Cytoarchitectonic identification and probabilistic mapping of two distinct areas within the anterior ventral bank of the human intraparietal sulcus. J. Comp. Neurol 495 (1), 53–69. [DOI] [PMC free article] [PubMed] [Google Scholar]
- Ciccarelli O, Parker GJ, Toosy AT, Wheeler-Kingshott CA, Barker GJ, Boulby PA, Miller DH, Thompson AJ, 2003. From diffusion tractography to quantitative white matter tract measures: a reproducibility study. Neuroimage 18 (2), 348–359. [DOI] [PubMed] [Google Scholar]
- Corbetta M, Shulman GL, 2002. Control of goal-directed and stimulus-driven attention in the brain. Nat. Rev. Neurosci 3 (3), 201–215. [DOI] [PubMed] [Google Scholar]
- Corbetta M, Patel G, Shulman GL, 2008. The reorienting system of the human brain: from environment to theory of mind. Neuron 58, 306–324. [DOI] [PMC free article] [PubMed] [Google Scholar]
- Croxson PL, Johansen-Berg H, Behrens TEJ, Robson MD, Pinsk MA, Gross CG, Richter W, Richter MC, Kastner S, Rushworth MFS, 2005. Quantitative investigation of connections of the prefrontal cortex in the human and macaque using probabilistic diffusion tractography. J. Neurosci 25 (39), 8854–8866. [DOI] [PMC free article] [PubMed] [Google Scholar]
- Culham JC, Valyear KF, 2006. Human parietal cortex in action. Curr. Opin. Neurobiol 16, 205–212. [DOI] [PubMed] [Google Scholar]
- Dehaene S, 2009. Origins of mathematical intuition. The case of arithmetic. Ann. N. Y. Acad. Sci 1156, 232–259. [DOI] [PubMed] [Google Scholar]
- Dehaene S, Dehaene-Lambertz G, Cohen L, 1998. Abstract representations of numbers in the animal and human brain. Trends Neurosci. 21 (8), 355–361. [DOI] [PubMed] [Google Scholar]
- Dronkers NF, Wilkins DP, van Valin RD, Redfern BB, Jaeger JJ, 2004. Lesion analysis of the brain areas involved in language comprehension. Cognition 92, 145–177. [DOI] [PubMed] [Google Scholar]
- Dyrby TB, Sogaard LV, Parker GJ, Alexander DC, Lind NM, Baaré WF, Hay-Schmidt A, Eriksen N, Pakkenberg B, Paulson OB, Jelsing J, 2007. Validation of in vitro probabilistic tractography. Neuroimage 37 (4), 1267–1277. [DOI] [PubMed] [Google Scholar]
- Eickhoff SB, Stephan KE, Mohlberg H, Grefkes C, Fink GR, Amunts K, Zilles K, 2005. A new SPM toolbox for combining probabilistic cytoarchitectonic maps and functional imaging data. Neuroimage 25 (4), 1325–1335. [DOI] [PubMed] [Google Scholar]
- Eickhoff SB, Amunts K, Mohlberg H, Zilles K, 2006a. The human parietal operculum. II. Stereotaxic maps and correlation with functional imaging results. Cereb. Cortex 16, 268–279. [DOI] [PubMed] [Google Scholar]
- Eickhoff SB, Heim S, Zilles K, Amunts K, 2006b. Testing anatomically specified hypotheses in functional imaging studies using cytoarchitectonic maps. Neuroimage 32, 570–582. [DOI] [PubMed] [Google Scholar]
- Eickhoff SB, Schleicher A, Zilles K, Amunts K, 2006c. The human parietal operculum. I. Cytoarchitectonic mapping of subdivisions. Cereb. Cortex 16, 254–267. [DOI] [PubMed] [Google Scholar]
- Eickhoff SB, Jbabdi S, Caspers S, Laird AR, Fox PT, Zilles K, Behrens TEJ, 2010. Anatomical and functional connectivity of cytoarchitectonic areas within the human parietal operculum. J. Neurosci 30 (18), 6409–6421. [DOI] [PMC free article] [PubMed] [Google Scholar]
- Eickhoff SB, Bzdok D, Laird AR, Roski C, Caspers S, Zilles K, Fox PT, 2011. Coactivation patterns distinguish cortical modules, their connectivity and functional differentiation. NeuroImage 57, 938–949. [DOI] [PMC free article] [PubMed] [Google Scholar]
- Felleman DJ, Van Essen DC, 1991. Distributed hierarchical processing in the primate cerebral cortex. Cereb. Cortex 1, 1–47. [DOI] [PubMed] [Google Scholar]
- Fias W, Lammertyn J, Reynvoet B, Dupont P, Orban GA, 2003. Parietal representation of symbolic and nonsymbolic magnitude. J. Cogn. Neurosci 15 (1), 47–56. [DOI] [PubMed] [Google Scholar]
- Fink GR, Marshall JC, Weiss PH, Zilles K, 2001. The neural basis of vertical and horizontal line bisection judgements: an fMRI study of normal volunteers. Neuroimage 14, 59–67. [DOI] [PubMed] [Google Scholar]
- Finlay BL, Darlington RB, Nicastro N, 2001. Developmental structure in brain evolution. Behav. Brain Sci 24, 263–308. [PubMed] [Google Scholar]
- Freund HJ, 2003. Somatosensory and motor disturbances in patients with parietal lobe lesions. Adv. Neurol 93, 179–193. [PubMed] [Google Scholar]
- Frey S, Campbell JSW, Pike GB, Petrides M, 2008. Dissociating the human language pathways with high angular resolution diffusion fiber tractography. J. Neurosci 28 (45), 11435–11444. [DOI] [PMC free article] [PubMed] [Google Scholar]
- Gernsbacher MA, Kaschak MP, 2003. Neuroimaging studies of language production and comprehension. Annu. Rev. Psychol 54, 91–114. [DOI] [PMC free article] [PubMed] [Google Scholar]
- Geschwind N, 1965. Disconnection syndromes in animals and man. Brain 88, 237–294. [DOI] [PubMed] [Google Scholar]
- Geschwind N, 1970. The organization of language and the brain. Science 170, 940–944. [DOI] [PubMed] [Google Scholar]
- Geyer S, 2004. The microstructural border between the motor and the cognitive domain in the human cerebral cortex. Advances in anatomy, embryology, and cell biology, vol. 174. Springer, Berlin. [DOI] [PubMed] [Google Scholar]
- Geyer S, Ledberg A, Schleicher A, Kinomura S, Schormann T, Bürgel U, Klingberg T, Larsson J, Zilles K, Roland PE, 1996. Two different areas within the primary motor cortex of man. Nature 382, 805–807. [DOI] [PubMed] [Google Scholar]
- Geyer S, Schleicher A, Zilles K, 1999. Areas 3a, 3b, and 1 of human primary somatosensory cortex: 1. Microstructural organization and interindividual variability. Neuroimage 10, 63–83. [DOI] [PubMed] [Google Scholar]
- Geyer S, Schormann T, Mohlberg H, Zilles K, 2000. Areas 3a, 3b, and 1 of human primary somatosensory cortex. Part 2: spatial normalization to standard anatomical space. Neuroimage 11, 684–696. [DOI] [PubMed] [Google Scholar]
- Grefkes C, Geyer S, Schormann T, Roland P, Zilles K, 2001. Human somatosensory area 2: observer-independent cytoarchitectonic mapping, interindividual variability, and population map. Neuroimage 14, 617–631. [DOI] [PubMed] [Google Scholar]
- Gregoriou GG, Borra E, Matelli M, Luppino G, 2006. Architectonic organization of the inferior parietal convexity of the macaque monkey. J. Comp. Neurol 496, 422–451. [DOI] [PubMed] [Google Scholar]
- Hillis AE, 2006. Neurobiology of unilateral spatial neglect. Neuroscientist 12, 153–163. [DOI] [PubMed] [Google Scholar]
- Hua K, Oishi K, Zhang J, Wakana S, Yoshioka T, Zhang W, Akhter KD, Li X, Huang H, Jiang H, van Zijl P, Mori S, 2009. Mapping of functional areas in the human cortex based on connectivity through association fibres. Cereb. Cortex 19, 1889–1895. [DOI] [PMC free article] [PubMed] [Google Scholar]
- Husain M, Nachev P, 2007. Space and the parietal cortex. Trends Cogn. Sci 42, 766–773. [DOI] [PMC free article] [PubMed] [Google Scholar]
- Hyvärinen J, 1982. Posterior parietal lobe of the primate brain. Physiol. Rev 62, 1060–1129. [DOI] [PubMed] [Google Scholar]
- Iacoboni M, 2005. Neural mechanisms of imitation. Curr. Opin. Neurobiol 15, 632–637. [DOI] [PubMed] [Google Scholar]
- Iacoboni M, Dapretto M, 2006. The mirror neuron system and the consequences of its dysfunction. Nat. Rev. Neurosci 7, 942–951. [DOI] [PubMed] [Google Scholar]
- Jakobs O, Wang LE, Dafotakis M, Grefkes C, Zilles K, Eickhoff SB, 2009. Effects of timing and movement uncertainty implicate the temporo-parietal junction in the prediction of forthcoming motor actions. NeuroImage 47 (2), 667–677. [DOI] [PMC free article] [PubMed] [Google Scholar]
- Johansen-Berg H, Behrens TE, Robson MD, Drobnjak I, Rushworth MF, Brady JM, Smith SM, Higham DJ, Matthews PM, 2004. Changes in connectivity profiles define functionally distinct regions in human medial prefrontal cortex. Proc. Natl. Acad. Sci. U. S. A 101 (36), 13335–13340. [DOI] [PMC free article] [PubMed] [Google Scholar]
- Jones DK, Simmons A, Williams SC, Horsfield MA, 1999. Non-invasive assessment of axonal fiber connectivity in the human brain via diffusion tensor MRI. Magn. Reson. Med 42, 37–41. [DOI] [PubMed] [Google Scholar]
- Kaas JH, 2000. Why is brain size so important: design problems and solutions as neocortex gets bigger and smaller. Brain Mind 1, 7–23. [Google Scholar]
- Kaas JH, 2006. Evolution of the neocortex. Curr. Biol 16 (21), R910–R914. [DOI] [PubMed] [Google Scholar]
- Kaas JH, Preuss TM, 2003. Human brain evolution, In: Squire LR (Ed.), Fundamental Neuroscience, 2nd ed. Elsevier, pp. 1147–1166. [Google Scholar]
- Karnath HO, 2001. New insights into the functions of the superior temporal cortex. Nat. Rev. Neurosci 2, 568–576. [DOI] [PubMed] [Google Scholar]
- Kelly C, Uddin LQ, Shehzad Z, Margulies DS, Castellanos FX, Milham MP, Petrides M, 2010. Broca’s region: linking human brain functional connectivity data and non-human primate tracing anatomy studies. Eur. J. Neurosci 32 (3), 383–398. [DOI] [PMC free article] [PubMed] [Google Scholar]
- Keysers C, Gazzola V, 2009. Expanding the mirror: vicarious activity for actions, emotions, and sensations. Curr. Opin. Neurobiol 19, 666–671. [DOI] [PubMed] [Google Scholar]
- Klein JC, Behrens TEJ, Johansen-Berg H, 2009. Connectivity fingerprinting of gray matter. In: Johansen-Berg H, Behrens TEJ (Eds.), Diffusion MRI—From Quantitative Measurement to In vivo Neuroanatomy. Academic Press, San Diego, pp. 377–402. [Google Scholar]
- Köbbert C, Apps R, Bechmann I, Lanciego JL, Mey J, Thanos S, 2000. Current concepts in neuroanatomical tracing. Prog. Neurobiol 62, 327–351. [DOI] [PubMed] [Google Scholar]
- Krubitzer L, 2009. In search of a unifying theory of complex brain evolution. Ann. N. Y. Acad. Sci 1156, 44–67. [DOI] [PMC free article] [PubMed] [Google Scholar]
- Kurth F, Eickhoff SB, Schleicher A, Hoemke L, Zilles K, Amunts K, 2010. Cytoarchitecture and probabilistic maps of the human posterior insular cortex. Cereb. Cortex 20 (6), 1448–1461. [DOI] [PMC free article] [PubMed] [Google Scholar]
- Lewis JW, Van Essen DC, 2000. Corticocortical connections of visual, sensorimotor, and multimodal processing areas in the parietal lobe of the macaque monkey. J. Comp. Neurol 428, 112–137. [DOI] [PubMed] [Google Scholar]
- Luppino G, Matelli M, Camarda R, Rizzolatti G, 1993. Corticocortical connections of area F3 (SMA-proper) and area F6 (pre-SMA) in the macaque monkey. J. Comp. Neurol 338, 114–140. [DOI] [PubMed] [Google Scholar]
- Makris N, Kennedy DN, McInerney S, Sorensen AG, Wang R, Caviness VS Jr., Pandya DN, 2005. Segmentation of subcomponents within the superior longitudinal fascicle in humans: a quantitative, in vivo, DT-MRI study. Cereb. Cortex 15 (6), 854–869. [DOI] [PubMed] [Google Scholar]
- Malikovic A, Amunts K, Schleicher A, Mohlberg H, Eickhoff SB, Wilms M, Palomero-Gallagher N, Armstrong E, Zilles K, 2007. Cytoarchitectonic analysis of the human extrastriate cortex in the region of V5/MT+: a probabilistic, stereotaxic map of area hOc5. Cereb. Cortex 17 (3), 562–574. [DOI] [PubMed] [Google Scholar]
- Mars RB, Jbabdi S, Sallet J, O’Reilly JX, Croxson PL, Olivier E, Noonan MP, Bergmann C, Mitchell AS, Baxter MG, Behrens TEJ, Johansen-Berg H, Tomassini V, Miller KL, Rushworth MFS, 2011. Diffusion-weighted imaging tractography-based parcellation of the human parietal cortex and comparison with human and macaque resting-state functional connectivity. J. Neurosci 31 (11), 4087–4100. [DOI] [PMC free article] [PubMed] [Google Scholar]
- Matelli M, Luppino G, 2001. Parietofrontal circuits for action and space perception in the macaque monkey. Neuroimage 14, S27–S32. [DOI] [PubMed] [Google Scholar]
- Morosan P, Rademacher J, Schleicher A, Amunts K, Schormann T, Zilles K, 2001. Human primary auditory cortex: cytoarchitectonic subdivisions and mapping into a spatial reference system. Neuroimage 13 (4), 684–701. [DOI] [PubMed] [Google Scholar]
- Mountcastle VB, Lynch JC, Georgopoulos A, Sakata H, Acuna C, 1975. Posterior parietal association cortex of the monkey: command functions for operations within extrapersonal space. J. Neurophysiol 38, 871–908. [DOI] [PubMed] [Google Scholar]
- Neal JW, Pearson RCA, Powell TPS, 1990a. The ipsilateral cortico-cortical connections of area 7b, PF, in the parietal and temporal lobes of the monkey. Brain Res. 524, 119–132. [DOI] [PubMed] [Google Scholar]
- Neal JW, Pearson RCA, Powell TPS, 1990b. The connections of area PG, 7a, with cortex in the parietal, occipital, and temporal lobes of the monkey. Brain Res. 532, 249–264. [DOI] [PubMed] [Google Scholar]
- Nieder A, 2005. Counting on neurons: the neurobiology of numerical competence. Nat. Rev. Neurosci 6, 177–190. [DOI] [PubMed] [Google Scholar]
- Pandya DN, Seltzer B, 1982. Intrinsic connections and architectonics of posterior parietal cortex in the rhesus monkey. J. Comp. Neurol 204, 196–210. [DOI] [PubMed] [Google Scholar]
- Parker GJM, Luzzi S, Alexander DC, Wheeler-Kingshott CAM, Ciccarelli O, Lambon Ralph MA, 2005. Lateralization of ventral and dorsal auditory-language pathways in the human brain. Neuroimage 24, 656–666. [DOI] [PubMed] [Google Scholar]
- Passingham RE, Stephan KE, Kötter R, 2002. The anatomical basis of functional localization in the cortex. Nat. Rev. Neurosci 3 (8), 606–616. [DOI] [PubMed] [Google Scholar]
- Petrides M, Pandya DN, 1984. Projections to the frontal cortex from the posterior parietal region in the rhesus monkey. J. Comp. Neurol 228, 105–116. [DOI] [PubMed] [Google Scholar]
- Petrides M, Pandya DN, 2007. Efferent association pathways from the rostral prefrontal cortex in the macaque monkey. J. Neurosci 27, 11573–11586. [DOI] [PMC free article] [PubMed] [Google Scholar]
- Petrides M, Pandya DN, 2009. Distinct parietal and temporal pathways to the homologues of Broca’s area in the monkey. PLoS Biol. 7 (8), e1000170. [DOI] [PMC free article] [PubMed] [Google Scholar]
- Price CJ, 2000. The anatomy oflanguage: contributions from functional neuroimaging. J. Anat 197, 335–359. [DOI] [PMC free article] [PubMed] [Google Scholar]
- Ramnani N, Behrens TE, Johansen-Berg H, Richter MC, Pinsk MA, Andersson JL, Rudebeck P, Ciccarelli O, Richter W, Thompson AJ, Gross CG, Robson MD, Kastner S, Matthews PM, 2006. The evolution of prefrontal inputs to the corticopontine system: diffusion imaging evidence from macaque monkeys and humans. Cereb. Cortex 16 (6), 811–818. [DOI] [PubMed] [Google Scholar]
- Rilling JK, Glasser MF, Preuss TM, Ma X, Zhao T, Hu X, Behrens TEJ, 2008. The evolution ofthe arcuate fasciculus revealed with comparative DTI. Nat. Neurosci 11 (4), 426–428. [DOI] [PubMed] [Google Scholar]
- Rizzolatti G, 2005. The mirror neuron system and its function in humans. Anat. Embryol 210 (5–6), 419–421. [DOI] [PubMed] [Google Scholar]
- Rizzolatti G, Arbib MA, 1998. Language within our grasp. Trends Neurosci. 21 (5), 188–194. [DOI] [PubMed] [Google Scholar]
- Rizzolatti G, Craighero L, 2004. The mirror-neuron system. Annu. Rev. Neurosci 27, 169–192. [DOI] [PubMed] [Google Scholar]
- Rottschy C, Eickhoff SB, Schleicher A, Mohlberg H, Kújovic M, Zilles K, Amunts K, 2007. The ventral visual cortex in humans: cytoarchitectonic mapping of two extrastriate areas. Hum. Brain Mapp 28 (10), 1045–1059. [DOI] [PMC free article] [PubMed] [Google Scholar]
- Rozzi S, Calzavara R, Belmalih A, Borra E, Gregoriou GG, Matelli M, Luppino G, 2006. Cortical connections of the inferior parietal cortical convexity of the macaque monkey. Cereb. Cortex 16 (10), 1389–1417. [DOI] [PubMed] [Google Scholar]
- Rozzi S, Ferrari PF, Bonini L, Rizzolatti G, Fogassi L, 2008. Functional organization of inferior parietal lobule convexity in the macaque monkey: electrophysiological characterization of motor, sensory and mirror responses and their correlation with cytoarchitectonic areas. Eur. J. Neurosci 28 (8), 1569–1588. [DOI] [PubMed] [Google Scholar]
- Rushworth MFS, Behrens TEJ, Johansen-Berg H, 2006. Connection patterns distinguish 3 regions of human parietal cortex. Cereb. Cortex 16, 1418–1430. [DOI] [PubMed] [Google Scholar]
- Rushworth MFS, Boorman E, Mars RB, 2009. Comparing brain connections in different species using diffusion weighted imaging. In: Johansen-Berg H, Behrens TEJ. (Eds.), Diffusion MRI. : From Quantitative Measurement to In vivo Neuroanatomy. Academic Press, Amsterdam, pp. 445–460. [Google Scholar]
- Saur D, Kreher BW, Schnell S, Kümmerer D, Kellmeyer P, Vry MS, Umarova R, Musso M, Glauche V, Abel S, Huber Rijntjes M, Hennig J, Weiller C, 2008. Ventral and dorsal pathways for language. PNAS 105 (46), 18035–18040. [DOI] [PMC free article] [PubMed] [Google Scholar]
- Scheperjans F, Eickhoff SB, Hömke L, Mohlberg H, Hermann K, Amunts K, Zilles K, 2008a. Probabilistic maps, morphometry, and variability of cytoarchitectonic areas in the human superior parietal cortex. Cereb. Cortex 18 (9), 2141–2157. [DOI] [PMC free article] [PubMed] [Google Scholar]
- Scheperjans F, Hermann K, Eickhoff SB, Amunts K, Schleicher A, Zilles K, 2008b. Observer-independent cytoarchitectonic mapping of the human superior parietal cortex. Cereb. Cortex 18 (4), 846–867. [DOI] [PubMed] [Google Scholar]
- Schmahmann JD, Pandya DN, 2006. Fiber Pathways of the Brain. Oxford University Press, Oxford. [Google Scholar]
- Schmahmann JD, Pandya DN, Wang R, Dai G, D’Arceuil HE, de Crespigny AJ, Wedeen VJ, 2007. Association fibre pathways of the brain: parallel observations from diffusion spectrum imaging and autoradiography. Brain 130, 630–653. [DOI] [PubMed] [Google Scholar]
- Seltzer B, Pandya DN, 1984. Further observations on parieto-temporal connections in the rhesus monkey. Exp. Brain Res 55, 301–312. [DOI] [PubMed] [Google Scholar]
- Semendeferi K, Armstrong E, Schleicher A, Zilles K, Van Hoesen GW, 2001. Prefrontal cortex in humans and apes: a comparative study of area 10. Am.J. Phys. Anthropol 114, 224–241. [DOI] [PubMed] [Google Scholar]
- Simon O, Kherif F, Flandin G, Poline JB, Rivière D, Mangin JF, Le Bihan D, Dehaene S, 2004. Automatized clustering and functional geometry of human parietofrontal networks for language, space, and number. Neuroimage 23, 1192–1202. [DOI] [PubMed] [Google Scholar]
- Smith SM, Jenkinson M, Woolrich MW, Beckmann CF, Behrens TEJ, Johansen-Berg H, Bannister PR, De Luca M, Drobnjak I, Flitney DE, Niazy R, Saunders J, Vickers J, Zhang Y, De Stefano N, Brady JM, Matthews PM, 2004. Advances in functional and structural MR image analysis and implementation as FSL. Neuroimage 23 (1), 208–219. [DOI] [PubMed] [Google Scholar]
- Stephan KE, Kamper L, Bozkurt A, Burns GAPC, Young MP, Kötter R, 2001. Advanced database methodology for the Collation of Connectivity data of the Macaque brain (CoCoMac). Philos. Trans. R. Soc. Lond. B 356, 1159–1186. [DOI] [PMC free article] [PubMed] [Google Scholar]
- Striedter GF, 2005. Principles of Brain Evolution. Sinauer. [Google Scholar]
- Tomassini V, Jbabdi S, Klein JC, Behrens TEJ, Pozzilli C, Matthews PM, Rushworth MFS, Johansen-Berg H, 2007. Diffusion-weighted imaging tractography-based parcellation of the human lateral premotor cortex identifies dorsal and ventral subregions with anatomical and functional specializations. J. Neurosci 27 (38), 10259–10269. [DOI] [PMC free article] [PubMed] [Google Scholar]
- Uddin LQ, Supekar K, Amin H, Rykhlevskaia E, Nguyen DA, Greicius MD, Menon V, 2010. Dissociable connectivity within human angular gyrus and intraparietal sulcus: evidence from functional and structural connectivity. Cereb. Cortex 20 (11), 2636–2646. [DOI] [PMC free article] [PubMed] [Google Scholar]
- Ungerleider LG, Haxby JV, 1994. ‘What’ and ‘Where’ in the human brain. Curr. Opin. Neurobiol 4 (2), 157–165. [DOI] [PubMed] [Google Scholar]
- Vigneau M, Beaucousin V, Hervé PY, Duffau H, Crivello F, Houdé O, Mazoyer B, Tzourio-Mazoyer N, 2006. Meta-analyzing left hemisphere language areas: phonology, semantics, and sentence processing. Neuroimage 30, 1414–1432. [DOI] [PubMed] [Google Scholar]
- Zhong YM, Rockland KS, 2003. Inferior parietal lobule projections to anterior inferotemporal cortex (area TE) in macaque monkey. Cereb. Cortex 13, 527–540. [DOI] [PubMed] [Google Scholar]
- Zilles K, Amunts K, 2010. Centenary of Brodmann’s map – conception and fate. Nat. Rev. Neurosci 11 (2), 1448–1461. [DOI] [PubMed] [Google Scholar]
Associated Data
This section collects any data citations, data availability statements, or supplementary materials included in this article.