

Abstract
Objectives
The aims of this study were to document the presence and prevalence of feline lipiduria and renal lipid deposition on CT, and to search for associations between the presence of lipiduria and sex, urinary tract abnormalities and urolithiasis.
Methods
The CT examinations of 252 cats were reviewed for the presence of an antigravitational hypodense bubble in the urinary bladder with density values between −180 Hounsfield units (HU) and −20 HU. To identify associations between lipiduria and sex, urinary tract abnormalities and urolithiasis, Fisher’s exact test was used. Renal cortical density measurement was performed in all cats. The Mann−Whitney test was performed to compare renal cortical density between lipiduric and unaffected cats.
Results
A total of 27 domestic cats (10.7%) had CT evidence of lipiduria. Lipiduric cats had a significantly lower renal cortical density than unaffected cats (P <0.01). Male neutered cats had a significantly higher frequency of lipiduria and lower renal cortical density compared with female neutered cats (P <0.01). There was no significant difference between the groups regarding renal, ureteral or urethral abnormalities.
Conclusions and relevance
Lipiduria is a common physiological phenomenon in cats that can be detected on routine CT examinations. Decreased renal cortical density is associated with lipiduria. This may aid in the diagnosis of feline lipiduria and help to differentiate its presence from other pathological depositions and excretions.
Keywords: CT, fat droplets, lipiduria, fat-fluid level
Introduction
Feline lipiduria is a common urinalysis finding that is widely believed to be incidental; in contrast, in humans, it is a marker of nephrotic syndrome and other conditions.1–7
Urine lipid droplets can be misinterpreted as erythrocytes, bacterial cocci or cryptococci on unstained cytology, and can result in a false-positive reading for leuko-cytosis on urine dipstick analysis.1,8 Ultrasonographically, lipiduria may appear as suspended echoes in the urinary bladder. 9 Grossly, lipiduria causes the urine to look cloudy. It is important to differentiate this finding from pathological urinary abnormalities such as haematuria, pyuria and crystalluria.
Lipid droplets accumulate in cats in the epithelial cells of the renal cortical proximal convoluted tubules, causing the more intensely yellow colour of the feline renal cortex on gross pathology, compared with other species.10–13 Exfoliation of tubular epithelial cells into the urine is thought to be the cause of lipiduria. Renal interstitial lipid accumulation has been observed histologically in cats with interstitial inflammation.14–17 Renal lipid accumulation has also been associated with renal disease in humans.7,18–23
Abundant lipid accumulation has been associated with hyperechoic feline renal cortices on ultrasonographic examination and a low density on CT.24,25
CT is a promising technique to detect the presence of lipid droplets in urine owing to its high sensitivity to differentiate materials of different physical density. Lipid retention in the urinary bladder in humans has been described on CT as an area in the non-dependent urinary bladder lumen.26–30 CT detection of feline lipiduria has not been described.
The aims of this study were to document the prevalence of feline lipiduria on CT and to investigate its clinical relevance. We hypothesised that: (1) feline lipiduria is visible on CT as an antigravitational urinary fat signal (UFS) in the urinary bladder lumen; (2) the presence of lipiduria on CT correlates with decreased renal cortical CT density values; (3) but it does not correlate with disease status of the urinary tract or other organs; (4) nor does it correlate with serum biochemical and urine analysis indicators of urinary disease.
Materials and methods
Animals
This retrospective study was conducted on domestic cats presenting to the Royal (Dick) School of Veterinary Studies between May 2009 and June 2018 that received a CT examination including the abdomen and pelvis. The Institutional Ethics and Welfare Committee granted approval for this study (approval reference 60.20). Patient records were searched according to the date of the CT examination and data were extracted, including signalment, body weight, body condition score (BCS; grades 1−9), clinical signs of urinary disease, final diagnosis and outcome. Final diagnosis data were categorised into exocrine pancreatic disease, diabetic ketoacidosis, diabetes mellitus, hepatic disease, hyperthyroidism, mycobacteriosis, neoplasia, pleural and pulmonary disease, and renal disease, where applicable. Urinalysis values (from dipstick and/or sediment examination) and renal serum biochemistry concentrations obtained within 7 days of CT acquisition included serum creatinine concentrations (µmol/l), urine specific gravity, urine pH, urine protein (g/dl), haematuria (0 to 4+), leukocyturia (0 to 4+), glucosuria (0 to 4+), urine sediment lipids droplets, urine sediment casts and crystals, and urine culture. Cats were also classified as azotaemic (serum creatinine >177 µmol/l) or as having a urinary tract infection (positive urine culture). Minimal criteria for patients to be included in the study were: (1) complete signalment, body weight and final diagnosis data; and (2) a diagnostic quality precontrast CT examination, including the abdomen and pelvis without urinary catherisation.
CT scanning was performed using a four-slice helical CT scanner (Volume Zoom; Siemens) before October 2016 and a 64-slice helical CT scanner (Somatom Definition AS; Siemens) after that time using standardised protocols. Standardised CT parameters included 120 kV tube voltage, adaptive reference tube current 80 mA, tube rotation time of 0.5 s, helical acquisition mode, bone and soft tissue kernel image reconstructions (Siemens proprietary kernels B40f and B70f), 1 mm or 3 mm slice thickness, 0.5 mm image reconstruction interval and a collimator pitch of 1. Image quality parameters were similar between both CT units, except for the slightly higher slice width in the older CT. Images were stored in DICOM format and were reviewed on a computer workstation (MacBook Pro) and a medical-grade DICOM viewer software (Osirix v5.8.5, 64 bit; Pixmeo).
All examinations were pseudonymised in a spreadsheet file. Two authors (ES and TS) performed the scoring relating to the UFS in consensus mode; they were unaware of the confirmation of clinical diagnosis at the time of scoring.
CT images were reviewed for UFS by making a subjective evaluation of the most non-dependent portion of the urinary bladder lumen with a standardised window width of 300 Hounsfield units (HU) and window level of 40 HU. The most non-dependent portion of the urinary bladder lumen was inspected on the original transverse plane CT images and reconstructed sagittal plane images, using the Sagittal Orientation Tool, for the presence of a UFS and the mean urine density of that area was measured with a closed polygon region of interest (ROI). The UFS was defined as an area within the urinary bladder lumen with a mean density between −180 HU and −20 HU, based on published human lipiduria studies.27,29 In cases with UFS, the urinary lipid volume was determined by measurement of the cross-sectional areas of all affected slices with the closed polygon ROI and use of a volume calculation tool. Two groups were subsequently defined based on the presence or absence of UFS and were considered to be positive or negative for lipiduria, respectively.
Density measurements were separately obtained for each renal cortex and medulla in the transverse plane of the kidney at the level of the renal hilus. The transverse slice that most accurately represented the renal hilus was chosen by viewing it in the corresponding sagittal view. A 5 mm diameter ROI was placed along a line bisecting the renal pelvis 1.5 mm from the kidney edge in the renal cortex and 10 mm from the kidney edge in the renal medulla. ROI centre distances were established in a pilot series of 10 cats with contrast-enhanced renal CT images with different renal cortical and medullary contrast enhancement. The ROI was reduced in size to 2.5 mm for a single hypoplastic kidney in the study. The urinary bladder diameter was measured at maximal height in millimetres along its y-axis. Urine density was measured in HU using three circular 5 mm diameter ROIs centred at three levels of the urinary bladder lumen: top, middle and bottom. The ROIs were placed 5 mm from the bladder wall and centre of the maximum height line to avoid interference with the UFS or sediment.
The kidneys, ureters, urinary bladder and urethra were screened for the presence of uroliths, and their location, size and density were recorded. Additionally, any abnormalities of size, shape, luminal patency and density were noted and recorded. For urolithiasis location, the kidneys and ureters were summarised as upper urinary tract and the urinary bladder and urethra as lower urinary tract. The presence and nature of artefacts were noted, and cases in which the artefact was deemed to be severe were excluded from the study.
Statistical analysis
Statistical analysis was performed using a commercially available software package (GraphPad Prism). Clinical data were entered into a spreadsheet and summarised using median and range. A D’Agostino−Pearson normality test was conducted on the data to test for normality of distribution. Group comparisons were performed using an unpaired t-test for normally distributed data or Mann−Whitney test for data sets that failed normality testing. To identify associations between lipiduria and sex, urinary abnormalities and urolithiasis, Fisher’s exact test was used. The Mann−Whitney test was performed to compare renal cortical density between lipiduric and unaffected cats. Differences with P <0.05 were considered significant. The first visit during which a CT examination was performed was used for statistical analysis.
Results
Animals
A total of 252 feline patients met the inclusion criteria. All CT studies were performed as a whole-body CT with a standard protocol in conscious patients in a specific containing device (VetMouseTrap; Figure 1). Twenty-four additional cases were excluded for the following reasons: two CT studies did not include the urinary bladder in its entirety; one study had poor serosal detail due to low body condition; two studies contained only postcontrast images; seven studies had severe metal/streak artefacts; and 12 studies had severe motion artefacts. The median age was 10 years (range 4 months to 21 years), the median BCS was 4 (range 1–9) and the median body weight was 4.41 kg (range 1.35–12.25 kg). The population was represented by domestic shorthair (n = 165/252 [65.5%]); Bengal (n = 14/252 [5.6%]); Maine Coon (n = 13/252 [5.2%]); domestic longhair (n = 12/252 [4.8%]); Siamese (n = 10/252 [4.0%]); Ragdoll (n = 7/252 [2.8%]); other breeds (n = 28/252 [11.1%]); and three mixed-breed cats (1.2%). The sex distribution of the population was 139 male cats (128 male neutered) and 113 female cats (106 female neutered).
Figure 1.
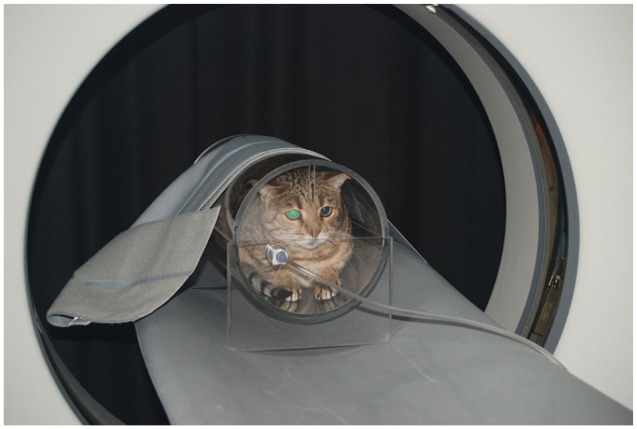
A conscious cat sitting in the VetMouseTrap device, as used for the CT studies
CT
Studies in 27 cats (10.7%) were positive for UFS, of which 70.4% were domestic shorthair or domestic longhair cats, and 29.6% were pure breeds (Figure 2). The median age of the lipiduric group of cats was 10.5 years (range 1−18 years), the median BCS was 4 (range 1−9) and the median weight was 4.55 kg (range 2.9−7.89 kg). There were no significant differences in the age, BCS or body weight between lipiduric and unaffected cats.
Figure 2.

CT images of the urinary bladder of six conscious domestic cats placed in a VetMouseTrap device, showing aggregation of lipid droplets in the most non-dependent part of the urinary bladder lumen, ranging in volume from (a) 0.0236 ml to (f) 0.1214 ml. Only the cats in (c) and (f) are sitting in true sternal recumbency, with the lipid droplets rising to an exact dorsal bladder location. Window width and level were adjusted for illustration purposes
A UFS was detected in 15.8% of male cats (n = 22/139; 21 male neutered) and in 4.4% (n = 5/113) of female cats (all female neutered), resulting in a significantly higher lipiduria prevalence in male neutered cats compared with female neutered cats (P <0.01), with an odds ratio of 3.964 (95% confidence interval 1.508−9.899; Figure 3a).
Figure 3.

(a) Bar graph showing a significantly higher prevalence of lipiduria in male neutered cats (n = 128) compared with female neutered cats (n = 106). Box plots showing a significantly lower (b) left and (c) right renal cortical density in male neutered cats compared with female neutered cats. HU = Hounsfield unit
In the entire study population, male neutered cats had a significantly lower density of their renal cortices compared with female neutered cats (left renal cortex P <0.0001, all male neutered median 29.25 HU [range 3.136−60.87 HU], all female neutered median 36.10 HU [range 6.651−56.8 HU]; right renal cortex P <0.0001, all male neutered median 30.38 HU [range 3.204−51.47 HU], all female neutered median 36.78 HU [range 16.41− 54.23 HU]; Figure 3b,c). The same was also true in cats without UFS (left renal cortex P <0.0001, unaffected male neutered median 30.58 HU [range 3.136−60.87 HU], unaffected female neutered median 36.30 HU [range 6.651−56.8 HU]; right renal cortex P <0.0001, unaffected male neutered median 31.07 HU [range 3.204−51.47 HU], unaffected female neutered median 36.35 HU [range 16.41−54.23 HU]). In cats with lipiduria, the median density of both renal cortices was significantly lower compared with unaffected cats (left renal cortex P <0.01, lipiduria median 27.97 HU [range 10.27−41.93 HU], unaffected median 33.76 HU [range 3.136−60.87 HU]; right renal cortex P <0.01, lipiduria median 27.48 HU [range 4.144−43.23 HU], unaffected median 34.44 HU [range 3.204−54.23 HU]; Figure 4). There was no significant difference in the median density of the renal medullae between groups. The number of non-neutered cats was too small for inclusion in sex-related statistical analysis.
Figure 4.

Box plots showing a significantly lower median density of (a) the left and (b) the right renal cortex in the lipiduria group (n = 27) compared with the unaffected population (n = 225). HU = Hounsfield unit
The median density of the UFS was −44 HU (range −128 to −21 HU) and the median volume was 0.0154 ml (range 0.0012−0.1214 ml). In all measured areas of the urinary bladder lumen, the median urine density was significantly lower in lipiduric cats compared with the unaffected control group. The difference between both groups was highest in the top-level urinary bladder area (P <0.0001, lipiduria median 18.25 HU [range −31.5 to 78.33 HU], unaffected median 34.66 HU [range −4.012 to 79.51 HU]), decreased in the mid-level area (P <0.01, lipiduria median 21.54 HU [range 0.205−76.97 HU], un-affected median 35.15 HU [range 1.899−95.18 HU]) and smallest in the bottom-level urinary bladder area (P <0.01, lipiduria median 26.46 HU [range 4.048−58.97 HU], un-affected median 38.83 HU [range 3.739−287 HU]).
Urolithiasis was present in 47/252 cats (18.7%). Uroliths were found within the upper urinary tract only in 87.2% (n = 41/47) of cases, lower urinary tract only in 6.4% (n = 3/47) and both upper and lower urinary tract in 6.4% (n = 3/47). There were 1−5 uroliths in 85.1% (n = 40/47), 6−12 uroliths in 12.8% (n = 6/47) and >12 uroliths in 2.1% (n = 1/47) of all cases. The median urolith size was 2.73 mm (range 1.3−7.42 mm) and the median urolith density was 241.5 HU (range 69.504−1109.5 HU). Urolithiasis was present in 25.9% (n = 7/27) of lipiduric cats vs 17.8% (n = 40/225) of unaffected cats. There was no significant difference in urolith frequency between groups.
Renal CT abnormalities were detected in 15.1% of cats (n = 38/252), in 25.9% (n = 7/27) of lipiduric cats and in 13.8% (n = 31/225) of unaffected cats. Renal CT abnormalities included irregular shape, cystic lesions, infarcts, pyelectasia, hydronephrosis, perinephric urinoma and hypoplasia. Ureteral or urethral CT abnormalities were detected in 4.4% of cats (n = 11/252), all of which were in unaffected cats. Abnormalities included dilatation and urinoma. No urinary bladder abnormalities were detected. There was no significant difference between the groups in renal, ureteral or urethral abnormalities.
Renal biochemistry and urine analysis
Serum biochemistry data were available in 168/252 cases (15 lipiduric and 153 unaffected cats). Azotaemia was present in 27/168 cats; in 5/15 (33.3%) lipiduric cats vs 22/153 (14.4%) unaffected cats. There was no statistical difference in serum azotaemia frequency between groups.
Urinalysis data were present in 79/252 cats (six lipiduric and 73 unaffected cats). Lipid was mentioned in the sediment analysis of only one case, which was an unaffected cat. In the six lipiduric cases the median urine specific gravity was 1.028 (range 1.013−1.040) and the median pH was 6.25 (range 5−7.5). Urinary infection was not identified in any lipiduric cat. Statistical analysis was not performed for parameters other than serum azotaemia due to insufficient numbers tested in the lipiduric group.
Final clinical diagnosis
Final clinical diagnosis of all cases was typical for our feline hospital population undergoing CT examination. There was no significant difference between lipiduric and unaffected cats in the final clinical diagnosis disease categories.
Discussion
Physiologically, lipid droplets accumulate in cats in the tubular epithelial cells of the renal cortex and in the urine through epithelial shedding. Our study demonstrates that these lipid aggregates are visible on CT in the feline urinary bladder lumen and their presence is correlated with decreased renal cortical density, but is not associated with increased frequency of azotaemia or a final diagnosis of urinary tract or other organ diseases, confirming our first three hypotheses and partially confirming our fourth.
In humans, lipiduria has been identified on CT within the non-dependent portion of the urinary bladder as a fat-fluid level, typically having density values between −180 HU and −20 HU.27,29 Differential diagnoses for this finding include chyluria, trauma and urine-induced lipolysis. 29 Our findings are similar to those described in humans.26–30 Lipid aggregates float on top of urine volume owing to their relative insolubility and lower density, and are distinctly visible on CT. The only other low-density structure floating in a urine volume would be gas. However, CT-density values of gas are typically between −800 HU and −1000 HU and even very small gas bubbles are distinctly visible and distinguishable from fat. The prevalence of lipiduria in this study is likely under-representative of this phenomenon because aggregation of a macroscopic fat droplet requires a certain quantity of urinary lipid. Also, each CT scan was performed within a very short time span from handling the cat, which may be insufficient for urine to segregate and form a floating lipid droplet. The VetMouseTrap device was designed as a restraining device for thoracic CT examinations of awake cats with respiratory disease, providing a clinically supportive environment reducing the stress that otherwise would be associated with patient handling in radiography. 31 At our institution we use the devicefor thoracic and abdominal CT in sedated cats, to further minimise patient stress and motion artefacts. In our experience, it is comparable to or less stressful than other clinical procedures involved in urine sampling and is therefore unlikely to result in higher lipiduria levels than in other forms of urine sampling.
Urine is a suspension and contains many particles that segregate gravitationally. Therefore, the presence of a vertical urine density gradient cannot be attributed solely to lipiduria. However, the fact that urine in cats with a UFS was significantly less dense than in unaffected cats, and that this difference was largest in the top compartment of the urinary bladder, supports the negative association of urine density and lipiduria.
Renal cortical density measurements were significantly lower in cases that were positive for lipiduria, corroborating the theory that lipiduria arises as a result of exfoliation of vacuolated renal tubular epithelial cells. This is also consistent with an ultrasonographic study, in which cats with hyperechoic renal cortices had an increased number of non-shadowing echoes in the urinary bladder lumen. 9 It has been suggested that renal cortical lipid accumulation may be associated with the progression of renal disease, both in cats and humans.16,20 Further research is necessary to correlate CT findings with other biomarkers of feline chronic renal disease. Consistent with findings in our study, increased renal cortical lipid deposition has been shown in neutered or aged male cats and in female cats during the luteal phase of the oestrus cycle, and it has been suggested that at least some of the renal lipids may be steroid in nature and be allied to oestrogens. 12
A likely reason for lipid droplets to be infrequently reported in urinalysis is that they are deemed to be incidental and, consequently, are not always mentioned. In our experience, urine sediment examination is frequently performed on centrifuged samples, where lipid droplets are less easily visible than in fresh, unspun urine.
The main limitations of this study relate to its retrospective design, resulting in it being impossible to make a definitive diagnosis of lipiduria or renal cortical lipid deposition, and yielding insufficient numbers of urinalysis. Additionally, concurrent renal pathology that may have affected cortical density measurements could not be definitively ruled out. Owing to a low number of patients in which lipiduria was identified and the overlap between the groups, one cannot completely disregard the potential for a type I statistical error in the current study.
Conclusions
Feline lipiduria is a common physiological finding that can be detected on CT. This is seen more commonly in male neutered cats than in female neutered cats. It appears as an antigravitational hypodense area with density values of fat. The presence of lipiduria on CT is associated with relatively lower renal cortical density values. No association was found between the presence of lipiduria, urolithiasis or renal abnormalities.
Acknowledgments
The authors would like to thank all cats included in this study, their guardians and staff involved in their care.
Footnotes
Accepted: 8 August 2020
Author note: Some of the results from this study were presented as an abstract at the ACVR Annual Scientific Meeting, Baltimore, MD, USA, 30 October to 2 November 2019.
The authors declared no potential conflicts of interest with respect to the research, authorship, and/or publication of this article.
Funding: The authors received no financial support for the research, authorship, and/or publication of this article.
Ethical approval: This work involved the use of non-experimental animals (including owned or unowned animals and data from prospective or retrospective studies). Established internationally recognised high standards (‘best practice’) of individual veterinary clinical patient care were followed. Ethical approval from a committee, while not necessarily required, was nonetheless obtained, as stated in the manuscript.
Informed consent: Informed consent (either verbal or written) was obtained from the owner or legal custodian of all animal(s) described in this work (either experimental or non-experimental animals) for the procedure(s) undertaken (either prospective or retrospective studies). For any animals or humans individually identifiable within this publication, informed consent (either verbal or written) for their use in the publication was obtained from the people involved.
ORCID iD: Tobias Schwarz  https://orcid.org/0000-0001-8412-573X
References
- 1. Fry MM. Urinalysis. In: Bartges J, Polzin D. (eds). Nephrology and urology of small animals. Chichester: Wiley-Blackwell, 2011, pp 46–57. [Google Scholar]
- 2. Skeldon N, Ristić J. Urinalysis. In: Villiers E, Ristić J. (eds). BSAVA manual of canine and feline clinical pathology. 3rd ed. Quedgeley: British Small Animal Veterinary Association, 2016, pp 183–218. [Google Scholar]
- 3. Klahr S, Tripathy K, Bolanos O. Qualitative and quantitative analysis of urinary lipids in the nephrotic syndrome. J Clin Invest 1967; 46: 1475–1481. [DOI] [PMC free article] [PubMed] [Google Scholar]
- 4. Martin RS, Small DM. Physicochemical characterization of the urinary lipid from humans with nephrotic syndrome. J Lab Clin Med 1984; 103: 798–810. [PubMed] [Google Scholar]
- 5. Macé C, Chugh SS. Nephrotic syndrome: components, connections, and angiopoietin-like 4-related therapeutics. J Am Soc Nephrol 2014; 25: 2393–2398. [DOI] [PMC free article] [PubMed] [Google Scholar]
- 6. Duncan KA, Cuppage FE, Grantham JJ. Urinary lipid bodies in polycystic kidney disease. Am J Kidney Dis 1985; 5: 49–53. [DOI] [PubMed] [Google Scholar]
- 7. Becker GJ, Nicholls K. Lipiduria – with special relevance to Fabry disease. Clin Chem Lab Med 2015; 53 Suppl 2: s1465–s1470. [DOI] [PubMed] [Google Scholar]
- 8. Holan KM, Kruger JM, Gibbons SN, et al. Clinical evaluation of a leukocyte esterase test-strip for detection of feline pyuria. Vet Clin Pathol 1997; 26: 126–131. [DOI] [PubMed] [Google Scholar]
- 9. Sislak MD, Spaulding KA, Zoran DL, et al. Ultrasonographic characteristics of lipiduria in clinically normal cats. Vet Radiol Ultrasound 2014; 55: 195–201. [DOI] [PubMed] [Google Scholar]
- 10. Smith C. A study of the lipoid content of the kidney tubule. Am J Anat 1920; 27: 69–94. [Google Scholar]
- 11. Modell W. Observations on the lipids in the renal tubule of the cat. Anat Rec 1993; 57: 13–24. [Google Scholar]
- 12. Lobban MC. Some observations on the intracellular lipid in the kidney of the cat. J Anat 1955; 89: 92–99. [PMC free article] [PubMed] [Google Scholar]
- 13. Bargmann W, Krisch B, Leonhardt H. Lipids in the proximal convoluted tubule of the cat kidney and the reabsorption of cholesterol. Cell Tissue Res 1977; 177: 523–538. [DOI] [PubMed] [Google Scholar]
- 14. McLeland SM, Cianciolo RE, Duncan CG, et al. A comparison of biochemical and histopathologic staging in cats with chronic kidney disease. Vet Pathol 2015; 52: 524–534. [DOI] [PubMed] [Google Scholar]
- 15. Brown CA, Elliott J, Schmiedt CW, et al. Chronic kidney disease in aged cats: clinical features, morphology, and proposed pathogeneses. Vet Pathol 2016; 53: 309–326. [DOI] [PubMed] [Google Scholar]
- 16. Martino-Costa AL, Malhão F, Lopes C, et al. Renal interstitial lipid accumulation in cats with chronic kidney disease. J Comp Pathol 2017; 157: 75–79. [DOI] [PubMed] [Google Scholar]
- 17. Schmiedt CW, Brainard BM, Hinson W, et al. Unilateral renal ischemia as a model of acute kidney injury and renal fibrosis in cats. Vet Pathol 2016; 53: 87–101. [DOI] [PubMed] [Google Scholar]
- 18. Sato H, Takahashi N, Sato E, et al. Pathology of glomerular lipidosis. Clin Exp Nephrol 2014; 18: 194–196. [DOI] [PubMed] [Google Scholar]
- 19. Portilla D, Li S, Nagothu KK, et al. Metabolomic study of cisplatin-induced nephrotoxicity. Kidney Int 2006; 69: 2194–2204. [DOI] [PubMed] [Google Scholar]
- 20. Herman-Edelstein M, Scherzer P, Tobar A, et al. Altered renal lipid metabolism and renal lipid accumulation in human diabetic nephropathy. J Lipid Res 2014; 55: 561–572. [DOI] [PMC free article] [PubMed] [Google Scholar]
- 21. Kang HM, Ahn SH, Choi P, et al. Defective fatty acid oxidation in renal tubular epithelial cells has a key role in kidney fibrosis development. Nat Med 2015; 21: 37–46. [DOI] [PMC free article] [PubMed] [Google Scholar]
- 22. Declèves AE, Zolkipli Z, Satriano J, et al. Regulation of lipid accumulation by AMP-activated kinase in high fat diet-induced kidney injury. Kidney Int 2014; 85: 611–612. [DOI] [PMC free article] [PubMed] [Google Scholar]
- 23. Khan S, Abu Jawdeh BG, Goel M, et al. Lipotoxic disruption of NHE1 interaction with PI(4,5)P2 expedites proximal tubule apoptosis. J Clin Invest 2014; 124: 1057–1068. [DOI] [PMC free article] [PubMed] [Google Scholar]
- 24. Yeager AE, Anderson WI. Study of association between histologic features and echogenicity of architecturally normal cat kidneys. Am J Vet Res 1989; 50: 860–863. [PubMed] [Google Scholar]
- 25. Oliveira DC, Costa LAVS, Silva ICC, et al. Quantitative computed tomography of the renal cortex in healthy dogs and cats. Arq Bras Med Vet Zootec 2013; 65: 1253–1256. [Google Scholar]
- 26. Miller FH, Keppke AL, Yaghmai V, et al. CT diagnosis of chyluria after partial nephrectomy. Am J Roentgenol 2007; 188: W25–W28. [DOI] [PubMed] [Google Scholar]
- 27. Schneider J, Zaid UB, Breyer BN, et al. Chyluria associated with radiofrequency ablation of renal cell carcinoma. J Comput Assist Tomogr 2010; 34: 210–212. [DOI] [PMC free article] [PubMed] [Google Scholar]
- 28. Panchal VJ, Chen R, Ghahremani GG. Non-tropical chyluria: CT diagnosis. Abdom Imaging 2012; 37: 494–500. [DOI] [PubMed] [Google Scholar]
- 29. Hoven N, Fister M, Niendorf E. Lipiduria presenting following right hemicolectomy: a case presentation and brief review of the literature. Radiol Case Rep 2015; 10: 49–52. [DOI] [PMC free article] [PubMed] [Google Scholar]
- 30. Kazaoka J, Kusakabe M, Ottomo T, et al. CT detection of fat retention in the bladder after partial nephrectomy. Abdom Radiol 2017; 42: 1819–1824. [DOI] [PubMed] [Google Scholar]
- 31. Oliveira CR, Ranallo FN, Pijanowski GJ, et al. The VetmouseTrapTM: a device for computed tomographic imaging of the thorax of awake cats. Vet Radiol Ultrasound 2011; 52: 41–52. [PubMed] [Google Scholar]