Abstract
Background:
Aeromedical retrieval is an essential component of contemporary emergency care systems. However, in many locations, ground emergency medical services are dispatched to the scene of an incident first to assess the patient and then call for a helicopter if needed. The time to definitive care therefore includes the helicopter’s flight to the scene, flight to the trauma center, and nonflying time. Mission ground time (MGT) includes the time required to get the helicopter airborne, as well as time spent at the scene, packaging and loading the casualty into the aircraft. Estimates of MGT typically vary from 10 to 30 min. The impact of MGT duration on population coverage—the number of residents that could be taken to a trauma center within a set time—is not known. The aim of this study was to compare population coverage for different durations of MGT in a single state.
Methods:
Coverage was calculated using elliptical coverage areas (“isochrones”) based on the location of helicopter bases and Level I and Level II trauma centers. The calculations were performed using Microsoft Excel, assuming a cruising speed of 133 knots (246 km/h), and mapped using arcGIS. The access time threshold was set at 60 min, and we evaluated MGTs of 10, 15, 20, 25, and 30 min.
Results:
MGT has a marked impact on population coverage. The effect is, furthermore, not linear. When considering the state’s three Level I trauma centers, decreasing MGT from 30 to 10 min increased population coverage from 61.2% to 84.2%. When also considering Level II centers, decreasing MGT from 30 min to 10 min increased coverage by 20%.
Conclusions:
Elliptical isochrones, with allowance for MGT, provide realistic estimates of population coverage. MGT significantly impacts the proportion of the population that can be taken to a Level I and/or Level II Trauma Center within a set time. The impact is not linear, reflecting the uneven distribution of the population. Consideration should be given to minimizing MGT to preserve the benefits of aeromedical retrieval.
Keywords: Aeromedical retrieval, Mission ground time, Trauma, Population coverage, Helicopter, Emergency medicine, Emergency transport, Rural trauma
Background
Trauma is a major cause of morbidity and mortality in patients aged <46 y.1 The time to definitive care is an important predictor of survival,2–5 and trauma systems are designed to maximize the number of people who have access to such specialist care. The accessibility of a trauma center is often measured in terms of the number or proportion of residents who can reach such a center within a set time—typically 60 min. Helicopters are a recognized means of extending this geographical envelope and improving access to specialist trauma care. First used during the Korean war, aeromedical transport has become a key component of civilian emergency care systems.6 Each year, approximately 400,000 medical retrieval flights take place in the United States,7 and helicopter transport is often viewed as critically important by communities.
Using helicopters to improve accessibility is not without problems. In most trauma systems, helicopters are only called once the casualty has been assessed by a ground-based emergency medical service (EMS) crew, and the aircraft has to fly to the scene before it can take the patient to hospital. If more time is spent flying to the casualty, then less time is available to take the patient to the trauma center. The resulting area (and therefore population) from which patients can be taken to a trauma within a set time is described by an ellipse. This ellipse is central to evaluating the population coverage of aeromedical retrieval networks and accessibility of trauma systems. In addition, these evaluations must consider the “mission ground time” (MGT). The clock starts with the receipt of the call by the aeromedical retrieval team. MGT, which includes both the time required to get the helicopter airborne, as well as time spent at the scene, packaging and loading the casualty into the aircraft—cuts into the 60 min and reduces the number of residents, by reducing the size of the ellipse, who can reach a trauma center within this time frame.
The impact of MGT duration on population coverage is likely to be nonlinear, as the distribution of the population is highly clustered, rather than uniform. The aim of this project was to evaluate the impact of varying MGT on population coverage, using the state of Alabama as a case study.
Methods
Setting
The state of Alabama is a southeastern state that contains both urban populations and dispersed rural communities. Alabama has a population of 4,779,736 and covers an area of 52,419 mi2. The centrally located Birmingham metro area has a population of approximately 1.1 million. There are three adult Level I trauma centers (one verified by the American College of Surgeons, in Birmingham, and the other two state designated, in Huntsville and Mobile), two state-designated Level II trauma centers, and 59 Level III trauma centers. There are 13 medical helicopter bases in Alabama (Fig. 1.). We evaluated the population coverage of these aircraft with regard to access to Level I trauma centers, Level I and Level II trauma centers, and all levels of trauma centers (Levels I-III).
Fig. 1 –
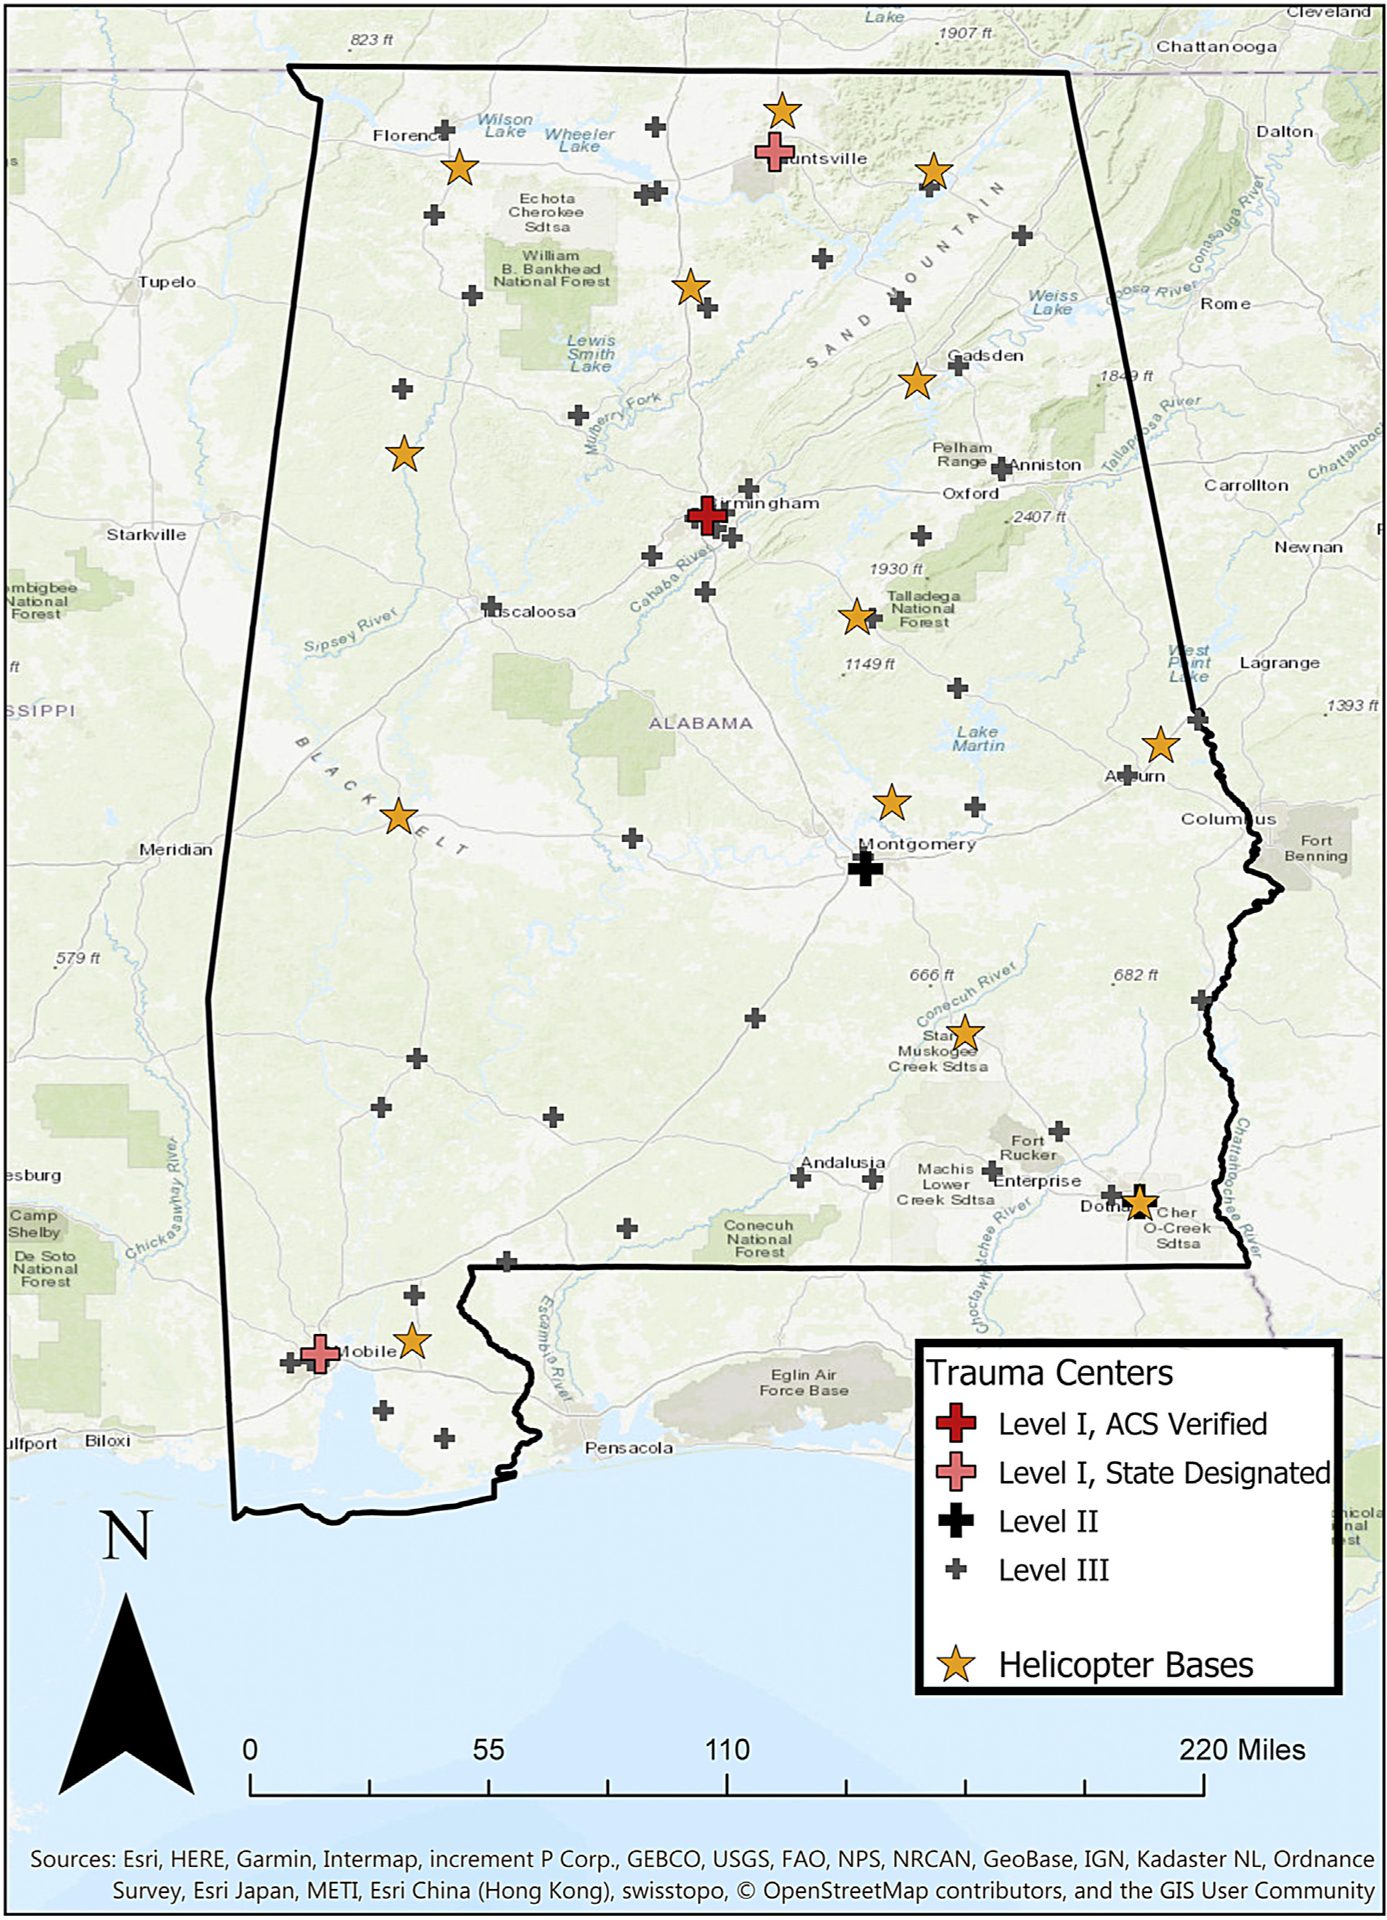
Alabama and Alabama trauma system.
Access time threshold and MGT
We used an access time threshold (ATT) of 60 min, which is defined as the maximum allowable time for a casualty to reach a trauma center from the scene before diversion to a lower level facility would have to be considered. MGT was defined as the total time not spent in the air after receipt of an aeromedical mission call. We evaluated different durations of MGT, ranging from 10 to 30 min, in 5-min intervals. We recognize that an MGT of 10 min is extremely difficult to achieve but have included this cutoff for illustration and completeness. Available flying time (for outbound and inbound flights) was defined as the ATT less the MGT. For example, if MGT was 20 min, then 40 min total flying would be used to calculate the area from which casualties could be retrieved and taken to a trauma center in <60 min.
Calculation of ellipses
The locations of the trauma centers and helicopter locations were geocoded using Google Maps (Google, Mountain View, CA). The ellipses were calculated using Microsoft Excel (Microsoft, Redwood, CA) using pairs of trauma center and helicopter locations, individual helicopters’ cruising speeds, and the available flying time, yielding the major and minor ellipse radii, the midpoint, and its bearing. Distance between coordinates was calculated using the spherical law of cosines. Bearing and midpoint between coordinates were calculated using a rhumb line (a line of constant bearing) approach.8,9 The major and minor radius of the ellipse were calculated with standard approach—the major radius was the maximum distance that could be traveled by the helicopter in the available flying time, and the minor radius was calculated using Cartesian geometry.10
Spatial analysis
The ellipse parameters were then imported into ArcGIS (Figs. 2–4) and overlaid with 2010 census U.S. Census Bureau TIGER/Line files containing population related to 252,265 individual census blocks. We then analyzed the aggregated number of blocks within each ellipse, thus providing the population served by each helicopter within a specified flight time. This method was repeated for each duration of MGT.
Fig. 2 –
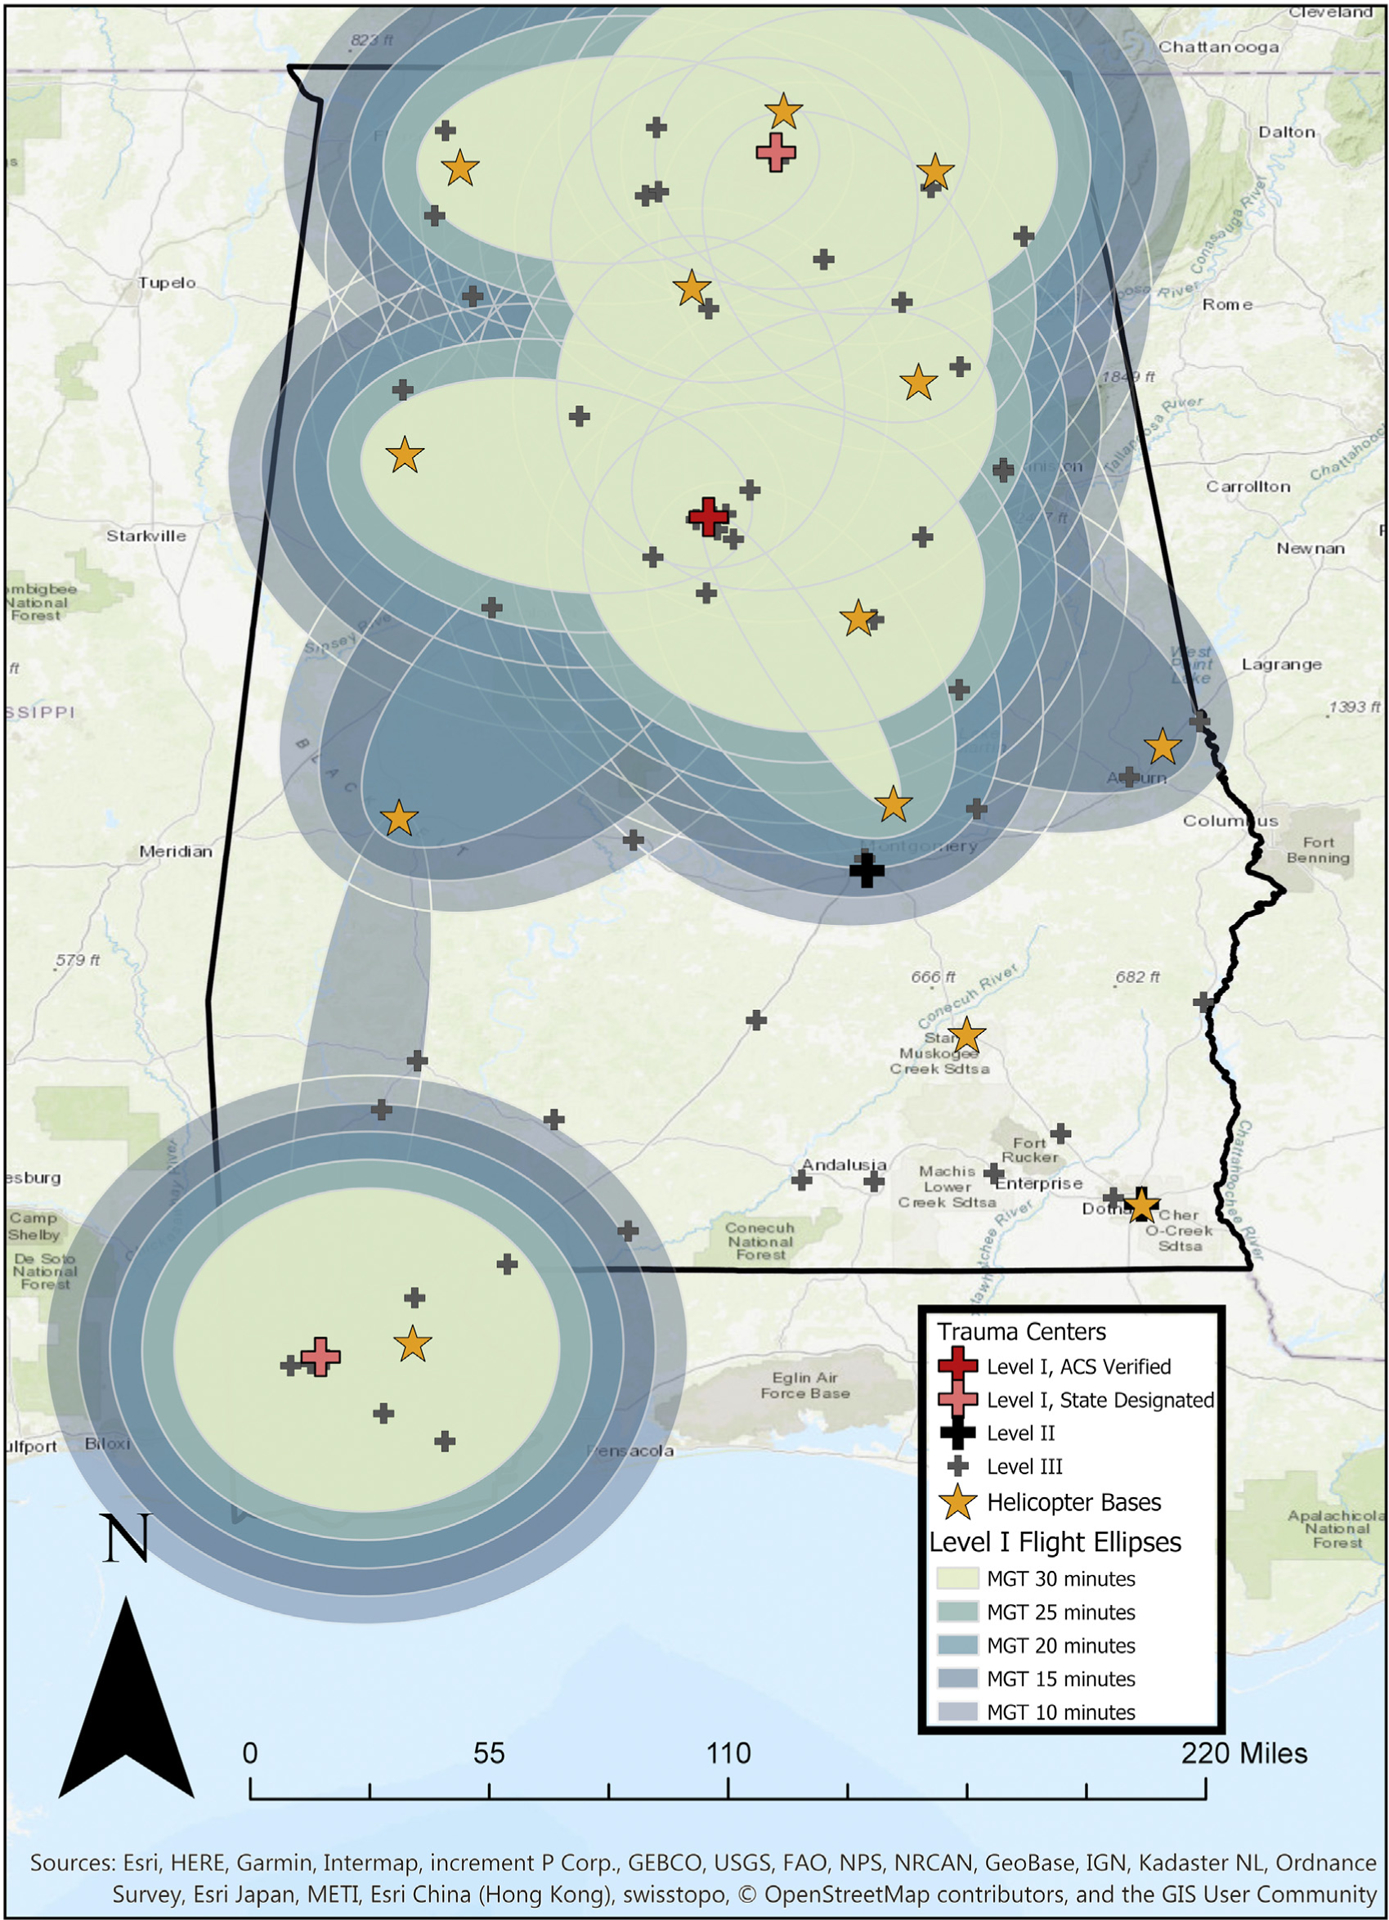
Coverage ellipses for Level I trauma centers, 30/25/20/15/10 min MGT.
Fig. 4 –
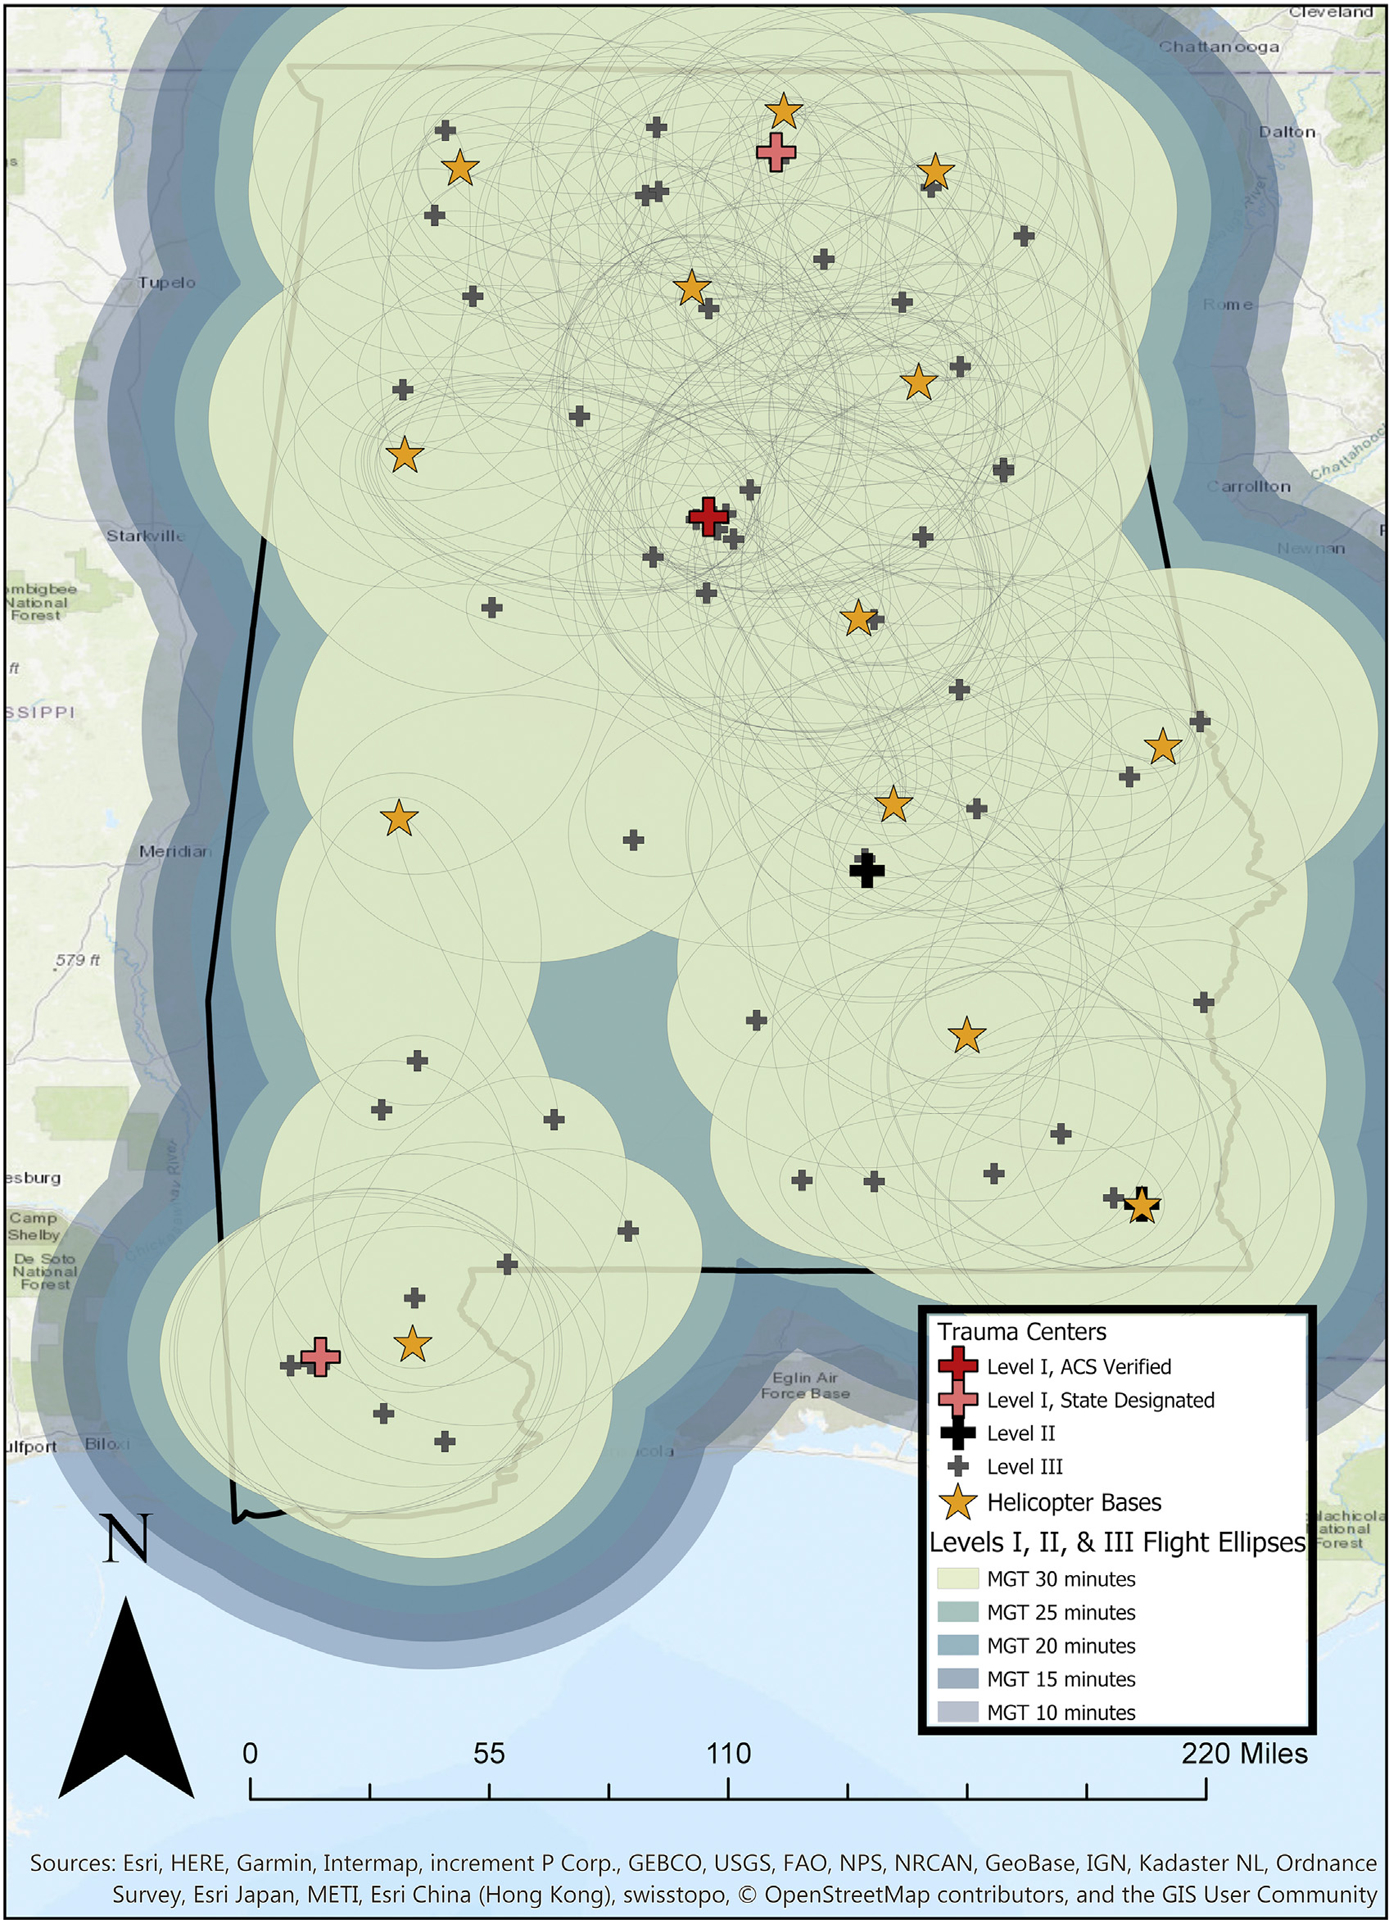
Coverage ellipses for Level I, II, and III trauma centers, 30/25/20/15/10 min MGT.
Results
With a 1 h ATT and an MGT of 30 min, we identified 11 coverage ellipses (formed by pairs of helicopter and hospital locations) that fell within the 30 min flying time threshold (Fig. 2). Similarly, there were 17 ellipses when both Level I and Level II trauma centers were considered (Figs. 3) and 226 ellipses when all available trauma centers (Level I, II, or III) were analyzed (Fig. 4). The resulting population coverage was 2.9 million (61.2% of the state’s population) for Level I trauma centers accessed by helicopter, 3.7 million (78.8%) for Level I and II centers, and 4.7 (98.8%) million for all levels (Table).
Fig. 3 –
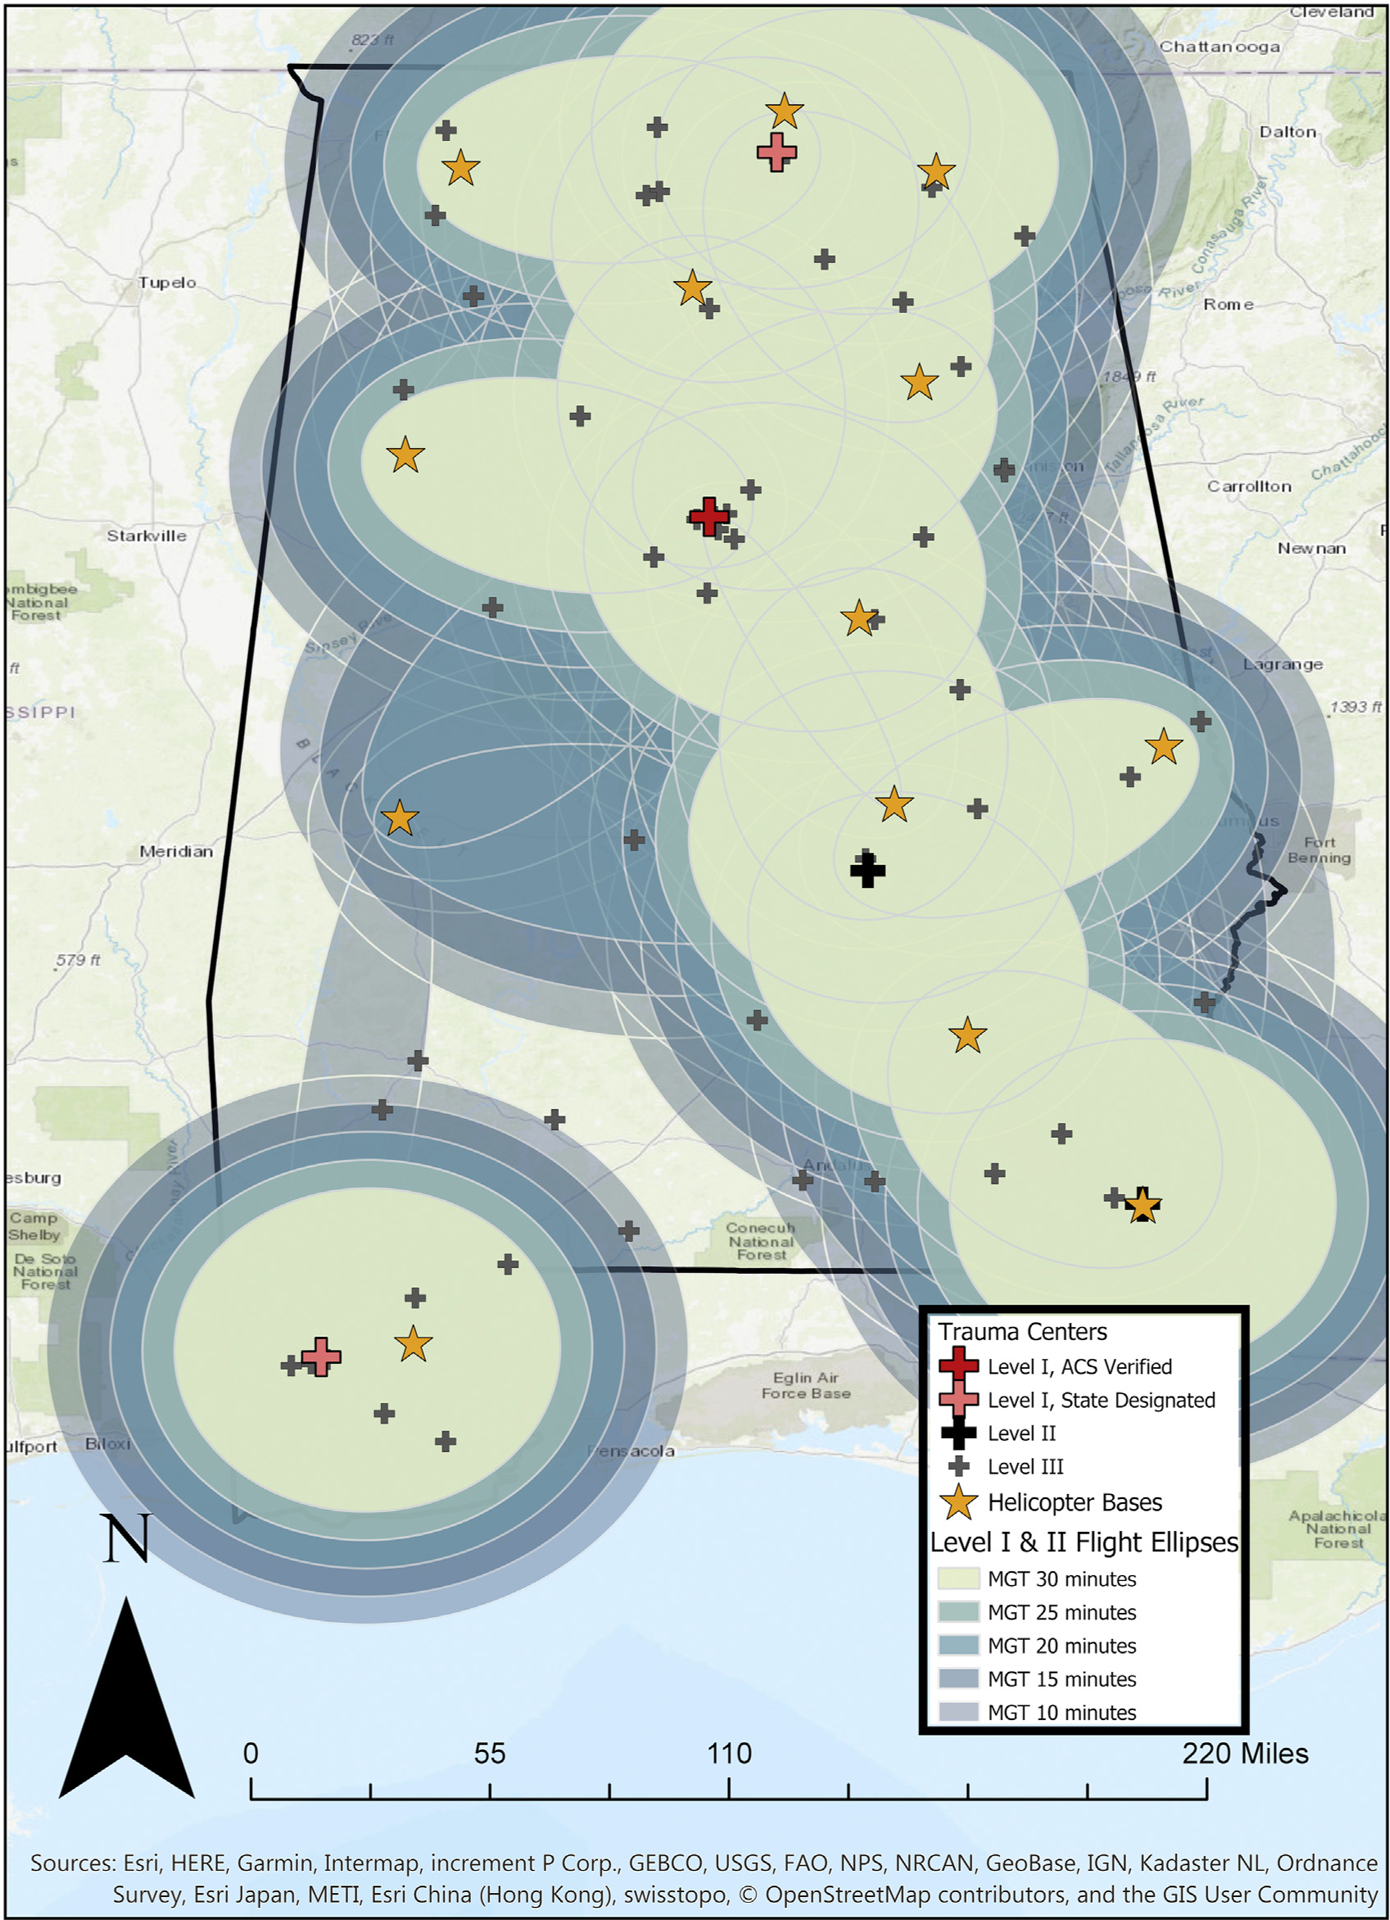
Coverage ellipses for Level I and II trauma centers, 30/25/20/15/10 min MGT.
Table –
Calculated helicopter population coverage, for different durations of MGT.
| Transport time (min) | Level I trauma centers (n = 3) | Level I and II centers (n = 5) | Level I, II, and III centers (n = 64) | ||||
|---|---|---|---|---|---|---|---|
| Flight time | Mission ground time | Number of patients, n (%) | Flight ellipses, n | Number of patients, n (%) | Flight ellipses, n | Number of patients, n (%) | Flight ellipses, n |
| 30 | 30 | 2,925,875 (61.2) | 11 | 3,764,368 (78.8) | 17 | 4,721,793 (98.8) | 226 |
| 35 | 25 | 3,372,513 (70.6) | 11 | 4,204,779 (88.0) | 17 | 4,770,977 (99.8) | 259 |
| 40 | 20 | 3,735,675 (78.2) | 16 | 4,515,326 (94.5) | 24 | 4,779,354 (99.9) | 348 |
| 45 | 15 | 4,023,577 (84.2) | 18 | 4,630,297 (96.9) | 29 | 4,779,736 (100) | 399 |
| 50 | 10 | 4,197,313 (87.8) | 19 | 4,717,890 (98.7) | 30 | 4,779,736 (100) | 443 |
Reducing MGT by 5 min, from 30 to 25 min, and increasing available flying time to 35 min resulted in an increase patient coverage of 9.4% (for access to level I centers), 9.2% (for access to Level I and II centers), and 1.0% (for access to all centers). Reducing MGT resulted in additional pairs of hospitals and helicopters base locations falling within the distance that can be covered within the available flying time. If MGT could be lowered to only 10 min, resulting in 50 min of flying time, the population that could reach a Level I trauma center by helicopter within 60 min increased to 4,197,313 (87.8% of the state’s population). In total, 98.7% of the population would be able to access a Level I or Level II center within 60 min, and the state’s entire population would be able to reach a Level I, II, or III center within 60 min (Table). The results are summarized in Figure 5.
Fig. 5 –
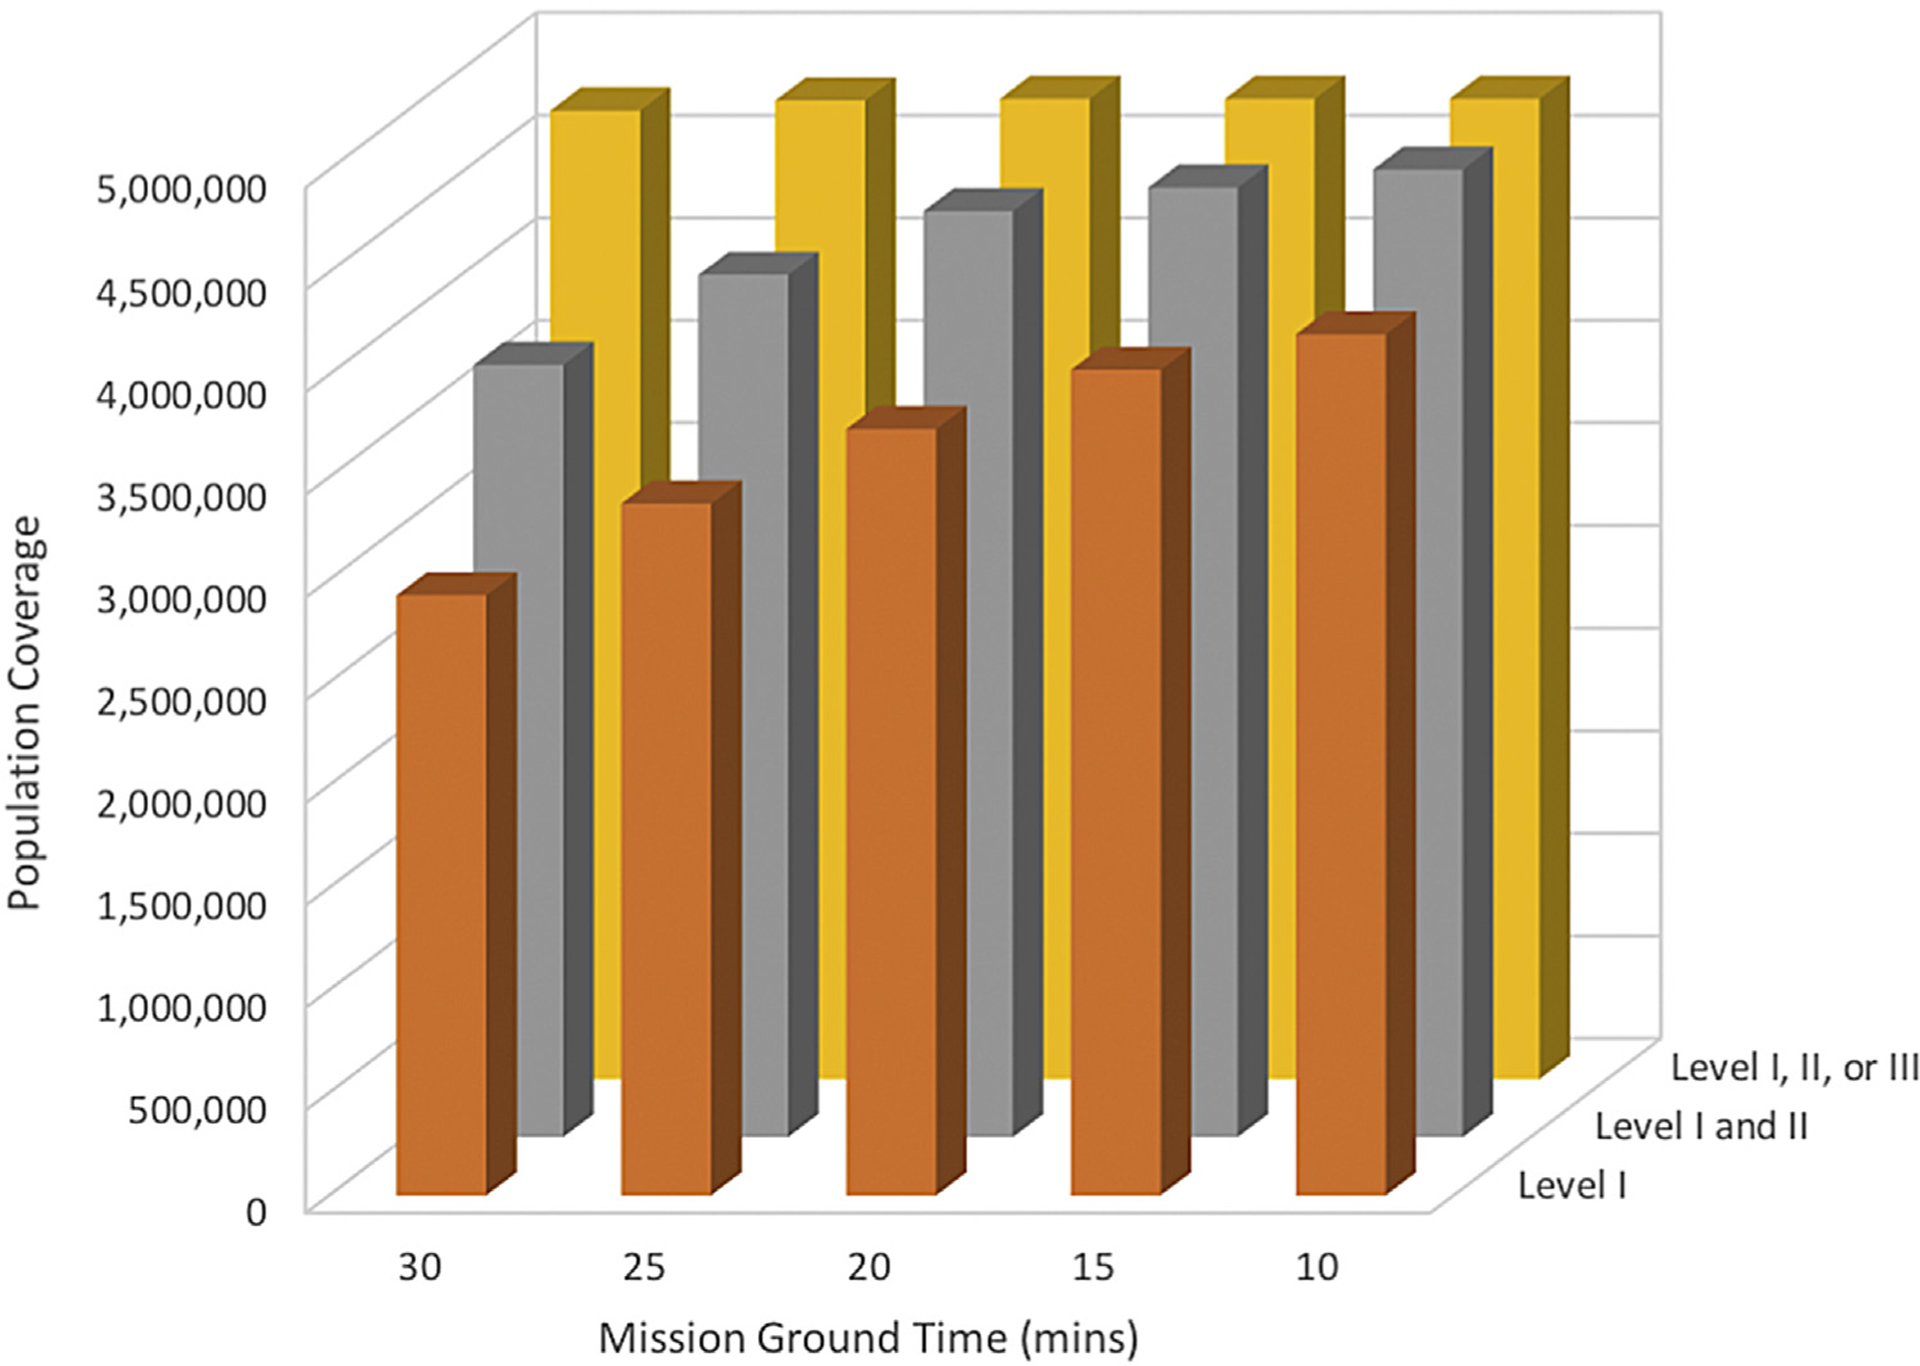
Impact of MGT on population coverage, for Level I trauma centers (orange); Level I and II trauma centers (gray); and Level I, II, and III trauma centers (yellow).
Discussion
This study has examined the effect of MGT on population coverage. Population coverage for helicopter access to Level I, II, or III trauma centers in Alabama is almost universal, regardless of MGT duration. Population coverage for helicopter access to Level I and II centers is less and reduced even further when only Level I centers are considered. Population coverage increases, nonlinearly, as MGT decreases.
Access to specialist care—and access to trauma centers, in particular—is an important and contentious issue.11–13 Trauma centers have been shown to improve mortality and functional outcomes in injured patients14,15 but require sufficient case volumes to build institutional and personal experience.16 It is therefore not possible to establish Level I trauma centers in all locations, and trauma system administrators have to balance accessibility of trauma centers and the availability of specialist care.
Helicopters are widely recognized as playing an important role in increasing accessibility and reducing the inherent inequity associated with suffering a serious injury in a remote location. Most trauma systems conduct an assessment—whether implicit or explicit—of whether a patient can be delivered to the right level of care within a reasonable time (usually 60 min). In fact, population coverage is a key metric for communities, health care professionals, and also operators of helicopter services. If delivery to a higher level trauma center is not possible, then either the patient has to be taken to a lower-than-desired trauma level facility or aeromedical transport has to be considered; therefore, the degree to which helicopters can facilitate access to high-level trauma care is important.
Our study adds to the literature on this subject by examining the impact of MGT on population coverage. Helicopters take time to mobilize, and the packing and loading of casualties at the scene of an incident is also not an instantaneous process. Our results demonstrate that the amount of time spent on becoming airborne, at both the base and incident locations, impacts the proportion of the population that could reach a trauma center within good time using rotary-wing transport.
Although there is good access to Level III (and above) trauma centers in Alabama, seriously injured casualties—who warrant aeromedical retrieval—almost invariably require Level I or, at the least, Level II trauma center care. Our results demonstrate that, with an MGT of 30 min, less than two-thirds of the population of Alabama could reach a Level I trauma center by helicopter within 60 min. Shortening the MGT has a profound effect on population coverage. Furthermore, the relationship of MGT and population coverage is nonlinear, related to the differences in population density around Level I and Level II trauma centers. This relationship may not hold true for all settings. In large urban settings, in particular, the relationship may be different. This is worthy of further study.
One approach to decreasing MGT is the primary dispatch of a helicopter to the scene—sometimes referred to as “autolaunch.” Primary dispatch is used by some services often using a combination of clinical and geographic criteria. Autolaunch has the potential to dramatically increase population coverage17 but also has profound resource implications.
This strength of this study is that it explicitly considers the most common flight path model—that is, a model in which helicopter services are called after patients have been assessed by local EMS agencies. However, our study also has limitations. Mathematical and geospatial modeling cannot consider all possibilities. For example, in some instances, a helicopter may be called while ground rescue services are still extricating a casualty, preventing the transport via helicopter to begin. Similarly, there may be considerable variation between ground times for different missions. The impact of such variation is difficult to predict. The georeferenced population data used for this study originate from the 2010 decennial census data, which is the most recently available. Finally, this study did not consider the availability of aircraft (which may be on another mission) or starting locations other than the base.
Conclusion
In summary, this study shows that the accessibility of trauma centers by helicopter and the population coverage offered by helicopters are closely related to the MGT. For time-critical missions, such as trauma scene retrievals, this is an important issue, and every effort should be made to minimize MGT. Future work should evaluate the impact of autolaunch policies and improved landing zone coordination.
Acknowledgment
Authors’ contributions: W.A.S. performed data collection, statistical analysis in ArcGIS, and authored the article. J.K. designed and wrote the formulas for ellipse models used in ArcGIS. K.L.S. aided in data collection and article review. S.W.S. provided emergency aeromedical data and contributed to the design of the project in regard to aeromedical transport within the region. R.L.G. guided statistical analysis and design. D.B.C. and J.D.K. were integral in reviewing and editing the abstract and article for submission. J.O.J. was the senior faculty advisor for this project and was involved in design, data collection, statistical analysis and review, and article revisions.
Footnotes
Disclosure
J.D.K. is a medical director for an emergency medical service agency in Alabama.
An abstract of this work has been presented at the 2019 14th Annual Academic Surgical Congress in Houston, TX.
REFERENCES
- 1.Pigneri DA, Beldowicz B, Jurkovich GJ. Trauma systems: origins, evolution, and current challenges. Surg Clin North Am. 2017;97:947–959. [DOI] [PubMed] [Google Scholar]
- 2.Clarke JR, Trooskin SZ, Doshi PJ, Greenwald L, Mode CJ. Time to laparotomy for intra-abdominal bleeding from trauma does affect survival for delays up to 90 minutes. J Trauma Acute Care Surg. 2002;52:420–425. [DOI] [PubMed] [Google Scholar]
- 3.McCoy CE, Menchine M, Sampson S, Anderson C, Kahn C. Emergency medical services out-of-hospital scene and transport times and their association with mortality in trauma patients presenting to an urban level I trauma center. Ann Emerg Med. 2013;61:167–174. [DOI] [PubMed] [Google Scholar]
- 4.Tien HC, Jung V, Pinto R, Mainprize T, Scales DC, Rizoli SB. Reducing time-to-treatment decreases mortality of trauma patients with acute subdural hematoma. Ann Surg. 2011;253:1178–1183. [DOI] [PubMed] [Google Scholar]
- 5.Vernon DD, Furnival RA, Hansen KW, et al. Effect of a pediatric trauma response team on emergency department treatment time and mortality of pediatric trauma victims. Pediatrics. 1999;103:20–24. [DOI] [PubMed] [Google Scholar]
- 6.McGinnis KK, Judge T, Nemitz B, et al. Air medical services: future development as an integrated component of the emergency medical services (EMS) system: a guidance document by the Air Medical Task Force of the National Association of State EMS Officials, National Association of EMS Physician. Prehosp Emerg Care. 2007;11:353–368. [DOI] [PubMed] [Google Scholar]
- 7.The Association of Air Medical Services. Air med “101”. 2018. Available at: http://aams.org/wp-content/uploads/2014/01/AIRMED101.pdf.pdf. Accessed November 24, 2019.
- 8.Vezie K Mercator’s projection: a comparative analysis of rhumb lines and great circles. 2016. Available at: https://www.whitman.edu/Documents/Academics/Mathematics/2016/Vezie.pdf. Accessed September 24, 2018.
- 9.Smart WM, Green RM. Textbook on Spherical Astronomy. 6th ed. Cambridge, NY: Cambridge University Press; 1977. [Google Scholar]
- 10.Research W. Ellipse. Available at: http://mathworld.wolfram.com/Ellipse.html. Accessed September 24, 2018.
- 11.Minei JP, Schmicker RH, Kerby JD, et al. Severe traumatic injury: regional variation in incidence and outcome. Ann Surg. 2010;252:149–157. [DOI] [PMC free article] [PubMed] [Google Scholar]
- 12.Gomez D, Berube M, Xiong W, et al. Identifying targets for potential interventions to reduce rural trauma deaths: a population-based analysis. J Trauma. 2010;69:633–639. [DOI] [PubMed] [Google Scholar]
- 13.Peek-Asa C, Zwerling C, Stallones L. Acute traumatic injuries in rural populations. Am J Public Health. 2004;94:1689–1693. [DOI] [PMC free article] [PubMed] [Google Scholar]
- 14.MacKenzie EJ, Rivara FP, Jurkovich GJ, et al. A national evaluation of the effect of trauma-center care on mortality. N Engl J Med. 2006;354:366–378. [DOI] [PubMed] [Google Scholar]
- 15.Gabbe BJ, Simpson PM, Sutherland AM, et al. Improved functional outcomes for major trauma patients in a regionalized, inclusive trauma system. Ann Surg. 2012;255:1009–1015. [DOI] [PubMed] [Google Scholar]
- 16.American College of Surgeons. In: Rotondo MF, Cribari C, Stephen Smith R, eds. Resources for the Optimal Care of the Injured Patient; 2014. Chicago, IL: American College of Surgeons; 2014. Available at: https://www.facs.org/~/media/files/quality programs/trauma/vrc resources/resources for optimal care.ashx. Accessed November 24, 2019. [Google Scholar]
- 17.Stone KL, Smedley WA, Killian J, et al. Aeromedical retrieval of trauma patients: impact of flight path model on estimates of population coverage. Am J Surg. 2020;220:765–772. [DOI] [PMC free article] [PubMed] [Google Scholar]


