

Abstract
The facilitation of proper blood flow through the heart depends on proper function of heart valve components, and alterations to any component can lead to heart disease or failure. Comprehension of these valvular diseases is reliant on thorough characterization of healthy heart valve structures for use in computational models. Previously, computational models have treated these leaflet structures as a structurally and mechanically homogenous material, which may not be an accurate description of leaflet mechanical response. In this study, we aimed to characterize the mechanics of the heart valve leaflet as a structurally heterogenous material. Specifically, porcine mitral valve and tricuspid valve anterior leaflets were sectioned into six regions and biaxial mechanical testing with various loading ratios and stress-relaxation test were performed on each regional tissue sample. Three main findings from this study were summarized as follows: (i) the central regions of the leaflet had a more anisotropic nature than edge regions, (ii) the mitral valve anterior leaflet was more extensible in regions closer to the annulus, and (iii) there was variance in the stress-relaxation behavior among all six regions, with mitral valve leaflet tissue regions exhibiting a greater decay than the tricuspid valve regions. This study presents a novel investigation of the regional variations in the heart valve biomechanics that has not been comprehensively examined. Our results thus allow for a refinement of computational models for more accurately predicting diseased or surgically-intervened condition, where tissue heterogeneity plays an essential role in the heart valve function.
Keywords: Biaxial mechanical testing, heart valve biomechanics, regional mechanical properties, the mitral valve, the tricuspid valve
1. Introduction
Blood flow through the heart is regulated by four heart valves, among which each valve is composed of collagenous tissue membranes referred to as heart valve leaflets. The mitral and tricuspid valves, named the atrioventricular heart valves (AHVs), facilitate the blood flow between the atria and ventricles through proper opening and closure of their leaflets. The mitral valve (MV) comprises two leaflets designated by their anatomical location as the anterior leaflet (MVAL) and the posterior leaflet (MVPL), whereas the tricuspid valve (TV) is organized by three leaflets designated similarly as the anterior leaflet (TVAL), posterior leaflet (TVPL), and septal leaflet (TVSL). Each AHV leaflet is affixed to the surrounding valvular annulus and its motion during systole is supported by the valve chordae tendineae anchoring the leaflets to the papillary muscles. The synergistic function of these structures is critical to the healthy function of the heart, and any alterations in the AHV components can potentially lead to heart disease or failure. For example, changes in the valvular structure and geometry, including valvular stenosis, leaflet prolapse, and annular dilation, result in blood backflow from the ventricle into the atrium during ventricular contraction. This regurgitation often leads to compensatory overworking of the heart which further worsens life conditions (Waller et al., 1994, 1995) and oftentimes requires a surgical intervention.
In situations where the valve has maintained the tissue’s physiologic structure and integrity, such as annular dilation, surgical repair often follows as the installation of an annuloplasty ring or the mitral clip (Tang et al., 2006; Van de Veire et al., 2011). The annuloplasty ring approach uses a soft-plastic device sutured to the valvular annulus with the goal of restoring the annulus geometry to facilitate more coaptation and full closure of the leaflets. While this treatment option has been shown to be successful, it is an open-heart procedure with an undesirable recurrence rate of approximately 15%−20% 3–5 years after the initial operation (Condado and Velez‐Gimon, 2003; Flameng et al., 2003; Taramasso et al., 2016). Alternatively, the mitral clip offers a suitable non-open-heart treatment for the MV whereby the two leaflets are clipped together. Despite its short- and mid-term success, it can be difficult to attach the clip appropriately, sometimes requiring re-operation for additional clips (Taramasso et al., 2015).
On the other hand, in more severe scenarios where the structural function of the valve is significantly damaged, including severe valvular stenosis and leaflet calcification, treatment requires replacement of the valve by a mechanical or biological prosthesis. The mechanical valves are made of metals, ceramics, or polymers, which require undesirable life-long anticoagulant prescriptions to prevent thromboembolism. In contrast, bioprosthetic valves, constructed of grafted porcine or bovine tissues, require no anticoagulant treatment, but often suffer from valvular degeneration issues and require reoperation within 15 years for 40% of patients (Chiang et al., 2014; Hammermeister et al., 2000; Jamieson et al., 2005; Schoen, 2001). In the past two decades, research effort has been devoted to better understand the failure mechanisms and to enhance the long-term durability of the therapeutics.
With recent advances in computer power and numerical methods, it becomes possible for computational models to provide key insights into the behaviors and function of the AHVs. Predictive computer simulations could be employed in determining possible failure mechanisms of current treatments and in supplementing patient-specific surgery planning. Previous investigations have been made towards refining computational models to incorporate complex microstructure, distinct layers, and structural heterogeneity of the leaflets (Amini et al., 2012; Arzani and Mofrad, 2017; Kunzelman et al., 1997; Lee et al., 2015a; Li et al., 2001; Prot and Skallerud, 2009; Rego and Sacks, 2017; Sacks, 2003). These investigations were primarily based upon the experimental data available in literature, which has mostly focused on the bulk tissue-level mechanical properties and the microstructure for the MV as well as distinct layers for the aortic valve (Ayoub et al., 2017; Grashow et al., 2006a; Grashow et al., 2006b; Huang et al., 2012; Sacks et al., 2004; Stella and Sacks, 2007). The structural heterogeneity of the dense collagen networks of the heart valve has been qualitatively examined via organ-level computational studies (Lee et al., 2014; Lee et al., 2015b; Sacks, 2003). However, most of these computational models assumed spatially-homogeneous material properties, which may not be adequate to represent the aforementioned structural heterogeneities. Hence, there is a critical need to investigate the variance in the regional mechanical properties of AHVs for further enhancement of existing computational models.
The goal of this research is therefore to address this need through novel characterizations of the regional mechanical properties and the stress relaxation behaviors of both the MV and TV leaflet tissues. Specifically, the anterior leaflets (MVAL and TVAL) were selected to represent each atrioventricular heart valve based on their anisotropic, highly nonlinear nature as observed in previous studies (Grashow et al., 2006b; Jett et al., 2018; Khoiy and Amini, 2016). Mechanical testing with various biaxial mechanical loading and stress relaxation protocols was conducted for each of the six smaller delimited tissue regions of the MVAL and TVAL to examine the regional variance/similarity in the tissue mechanics of both AHVs.
2. Methods
2.1. Tissue acquisition and sectioning
Healthy, adult porcine hearts (80–140 kg, 1–1.5 years of age) were obtained from a local USDA approved slaughterhouse (Country Home Meat Co., Edmond, OK). Hearts were obtained on the same day of excision from the animal, promptly cleaned of clots, and placed in a freezer at −14⁰C. This freezing-based storage procedure was adopted according to previous studies, which demonstrated a minimal effect of freezing on the mechanical properties of collagenous tissues (Foutz et al., 1992; Stemper et al., 2007; Woo et al., 1986). For dissection, hearts were thawed and the MV and TV anterior leaflets were excised (Fig. 1a–b). Next, the leaflets were laid flat and further sectioned into six regions of a 6mm × 6mm dimension (Fig. 1c). Here, regions B and E were the central regions, while regions A, C, D, and F were the edge regions. The sectioned tissue samples were then stored in phosphate buffered saline (PBS) solution and refrigerated in a 4⁰C environment for testing within two days of dissection.
Figure 1 –
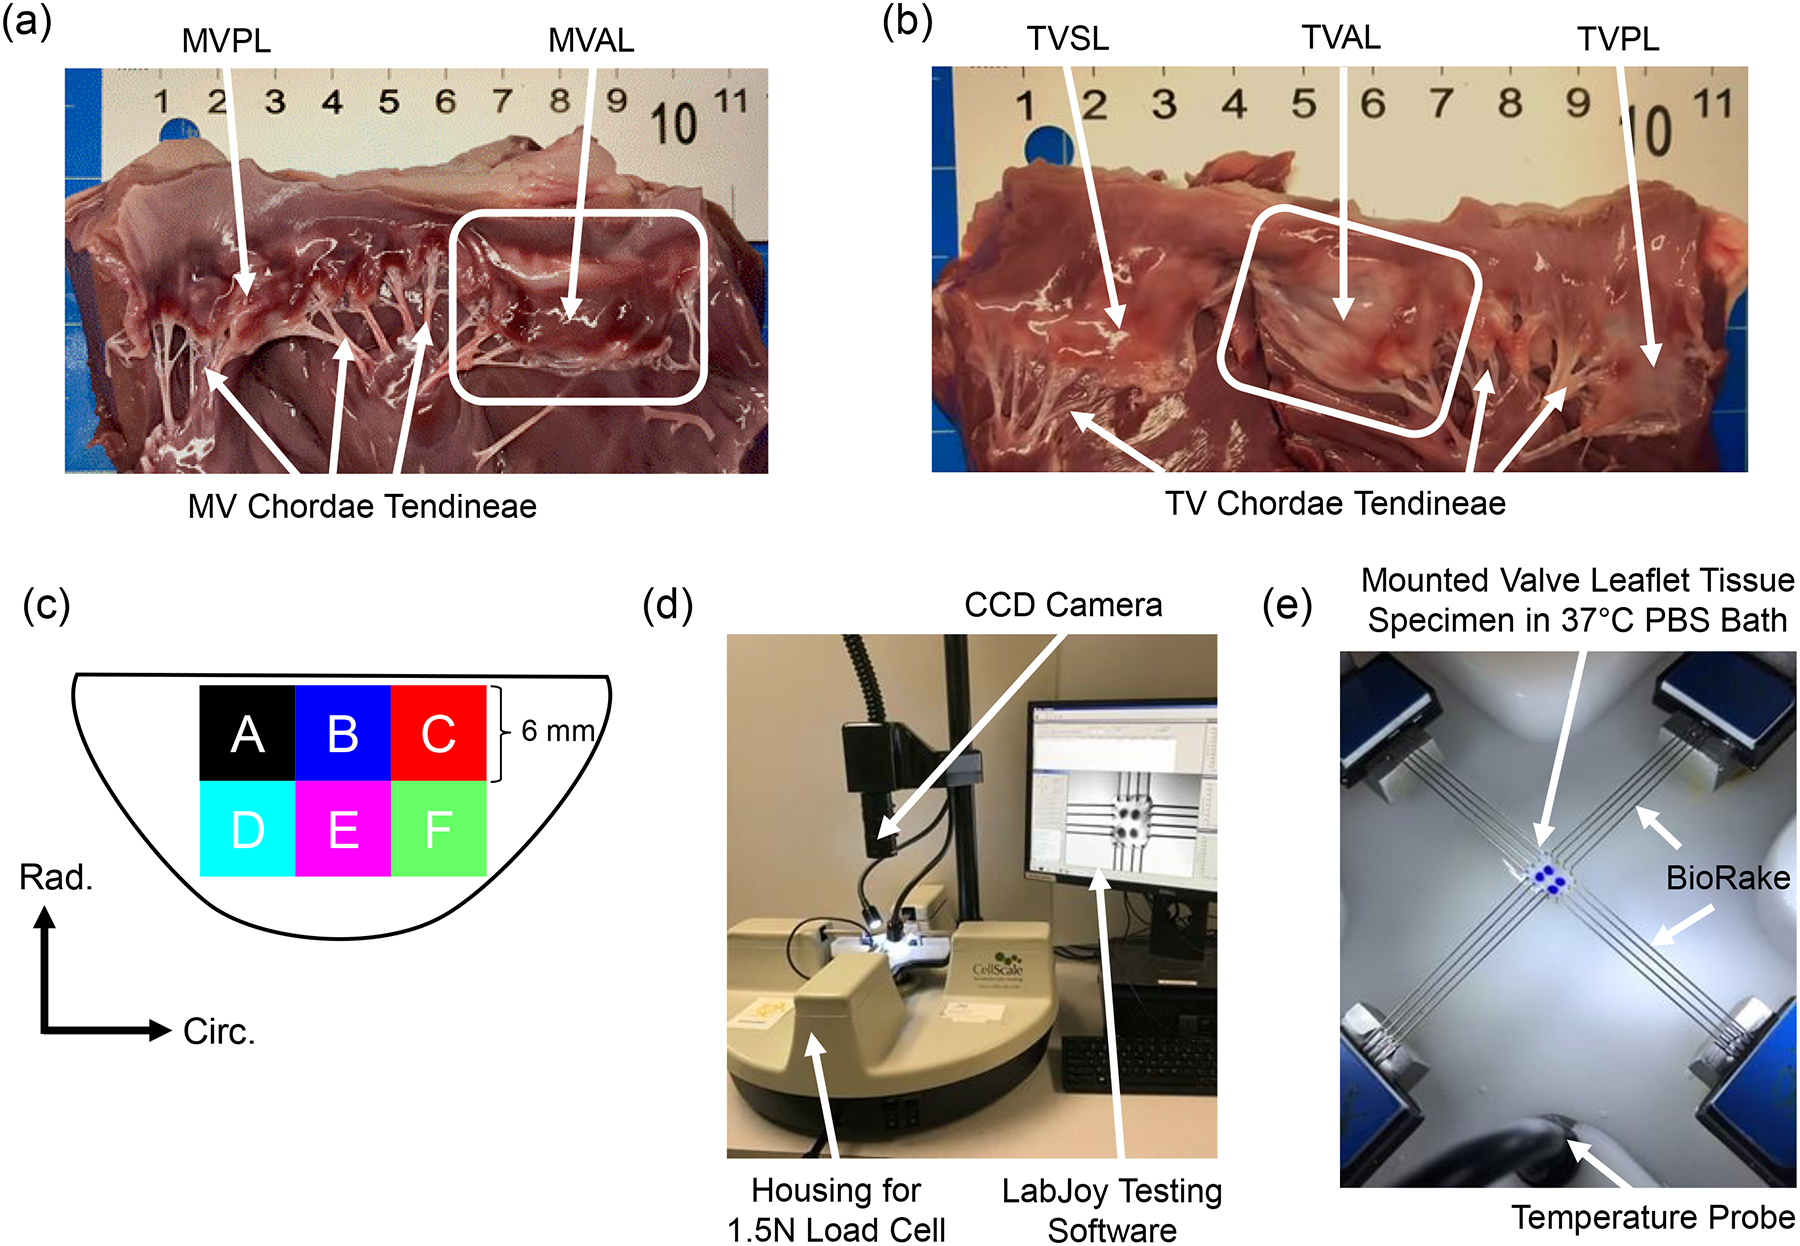
Dissected porcine hearts showing (a) the mitral valve and (b) the tricuspid valve with the anterior leaflet highlighted for both atrioventricular heart valves. (c) Schematic of a valve anterior leaflet with the six tested regions. Experimental images of (d) the biaxial mechanical tester (BioTester) used in this study and (e) a mounted tissue sample with labelled components of the biaxial mechanical testing system.
2.2. Tissue sample preparation
At the time of testing, the sectioned tissues’ thicknesses were recorded at three locations using digital calipers (Westward 1AAU4 – 0.01mm resolution) and then averaged. The specimen was then mounted, with an effective testing region of 4mm × 4mm that is the separation distance between two Biorake tissue mounters, onto a commercial biaxial mechanical testing system (BioTester–CellScale, Canada) equipped with a 1.5N load cell capacity (Fig. 1d). The circumferential and radial directions were aligned with the testing x- and y-directions (Fig. 1e). Four fiducial markers were placed in an array via a surgical pen on the central region of the tissue for optical tracking-based strain calculations (c.f. Section 2.4). The tissue was then submerged in a 37°C PBS bath to emulate the valve’s physiological conditions for the subsequent biaxial mechanical testing.
2.3. Biaxial mechanical testing
Following the experimental procedure developed in our previous study (Jett et al., 2018) biaxial mechanical testing was performed to investigate the differences and similarities in the mechanical responses of the MVAL and TVAL tissue regions. In brief, the maximum applied membrane tension in the circumferential and radial directions (Tcirc,max and Trad,max) of 100 N/m and 50 N/m were used for the MVAL and TVAL, respectively, according to their physiologically functioning pressure level (Khoiy and Amini, 2016; Pierlot et al., 2015). A two-step force-controlled biaxial testing procedure was used to characterize the mechanical behavior of each of the six tissue regions of both the MVAL and TVAL. First, a preconditioning protocol was used to restore the valve leaflet tissue to its in vivo configuration, in which Tcirc,max and Trad,max were applied in each direction at a rate of 2.29 N/min for 8 repeated loading/unloading cycles with a preload as 2.5% of Tcirc,max and Trad,max . Next, five varying loading ratios (Tcirc,max:Trad,max = 1:1, 0.75:1, 1:0.75, 0.5:1, and 1:0.5) with 8 loading/unloading cycles were employed to investigate all possible physiological tissue deformations and to demonstrate the cross-coupling of fiber directions under varied deformations. Throughout the test, the Biorake separation distance and force were continuously recorded, and a series of 1280×960 images were collected at 15 Hz using a high-resolution CCD camera. Data from the last cycle of each loading protocol were used in the tissue stress and strain analyses as described in the next subsection. In addition, a biaxial stress-relaxation test was employed to observe the regional variance in the stress decaying response. For this testing, tissue specimens were loaded to Tcirc,max and Trad,max using the maximum displacements recorded previously. Then, the specimens were held to relax over 15 minutes. The force readings were retrieved at a rate of 5 Hz for the subsequent stress reduction analysis. Although 3-hour stress relaxation experiments have been previously adopted for the semilunar valves by Huang et al. (Huang and Huang, 2015) and the mitral valve by Sacks et al. (Grashow et al., 2006a; Sacks et al., 2004), the majority of stress reduction occurs within the first 1000 seconds. Hence, the 15-minute stress-relaxation period was chosen in this study as it was sufficient to observe noticeable differences in the relaxation behaviors between the regions of both the MVAL and TVAL tissues.
2.4. Tissue strain and stress calculations
For more details about tissue strain and stress calculations, please refer to our previous study (Jett et al., 2018). Briefly, the time-dependent locations of the four applied fiducial markers were determined through analysis of the acquired images using the data-image correlation (DIC) functionality in the LabJoy software of the BioTester system. Then, the four fiducial markers were considered as a four-node bilinear finite element to compute the deformation gradient F through
| (1) |
where the BXI’s and BYI’s are the derivatives of the shape function for node I in the x- and y-directions, and uI and vI are the displacements of node I in the x- and y- directions. The stretches in each direction were then computed by taking the square roots of the principle values of the right Cauchy deformation tensor, C = FTF. The load cell readings and effective testing region edge length were then used to compute the membrane tension by
| (2) |
where fC and fR are the recorded force in the circumferential and radial direction, respectively, and L is the effective edge length. Various stress measures can be readily computed using the membrane tension values and the associated specimen’s thickness: P = diag[PCC,PRR] = diag[Tcirc,Trad]/t, S = F−1P, and σ = J−1PFT (Reddy, 2013; Tadmor et al., 2012), for making comparisons with tissue stress results in other studies. Here, P is the first Piola-Kirchhoff stress tensor, S is the second Piola-Kirchhoff stress tensor, σ is the Cauchy stress tensor, and J = det(F) is the Jacobian of F. Finally, to facilitate a quantitative comparison of regional anisotropy, an anisotropy index (AI) was used in our analyses, which was defined as the ratio of the peak stretch in the radial direction to that in the circumferential direction, i.e., .
For analyses of the stress decaying responses from stress relaxation testing, force readings were converted to membrane tensions. The reported membrane tension values were normalized by the peak values with respect to each direction for evaluating the percent relaxation over the 15-minute duration.
2.5. Statistical analysis
To determine statistically significant differences in the regional responses of the MVAL and TVAL, one-way Analysis of Variance (ANOVA) was performed using an in-house MATLAB program to analyze the total tissue stretch values associated with the peak applied membrane tension ( and ).
For quantitative interpretations of our statistical analysis results, this peak stretch value was further broken into two parts as described in our previous work (Jett et al., 2018): (i) the preconditioning stretches ( and ) which are defined as the tissue deformations due to the preconditioning effect, and (ii) the mechanical stretches ( and ) corresponding to the tissue deformation in response to mechanical loading with respect to the post-preconditioning configuration. These stretch values were compared between the circumferential and radial directions for each leaflet region to determine the material anisotropy.
Comparisons were also made between any two regions of each valve leaflet to determine statistically significant differences in the regional biaxial mechanical responses. All analyses were performed with p<0.05 considered as statistically significant, and p<0.10 considered as nearly statistically significant. All results are reported as mean ± standard error of the mean (SEM).
3. Results
3.1. Thickness of Leaflet Regions
The measured thickness was generally consistent for all the six regions with maximum variations of 0.106 mm for the MVAL and 0.104 mm for the TVAL. Thickness measurements for the MVAL were found to be: 0.633±0.033 mm (region A), 0.600±0.045 mm (region B), 0.657±0.041 mm (region C), 0.554±0.039 mm (region D), 0.551±0.045 mm (region E), and 0.584±0.061 mm (region F). As for the TVAL, thicknesses were: 0.309±0.028 mm (region A), 0.287±0.038 mm (region B), 0.378±0.032 mm (region C), 0.301±0.039 mm (region D), 0.368±0.048 mm (region E), and 0.391±0.041 mm (region F).
3.2. Biaxial mechanical testing
Biaxial mechanical testing provided insight into the variance in stretch experienced by the MVAL and TVAL tissue regions. Equi-biaxial testing results (Tcirc,max:Trad,max = 1:1) for the MVAL and TVAL total tissue stretch are reported in Figs. 2–3, respectively, whereas results for the non-equibiaxial loading protocols are reported in Figs. S1–S8. Results regarding the anisotropy index are presented in Fig. 4. Moreover, the average preconditioning stretches are provided in Fig. 5 and average mechanical stretches are provided in Figs. 6–7. The preconditioning and mechanical stretches as well as the anisotropy index are summarized in Tables 1–3 for quantitative comparisons between tissue regions.
Figure 2 –
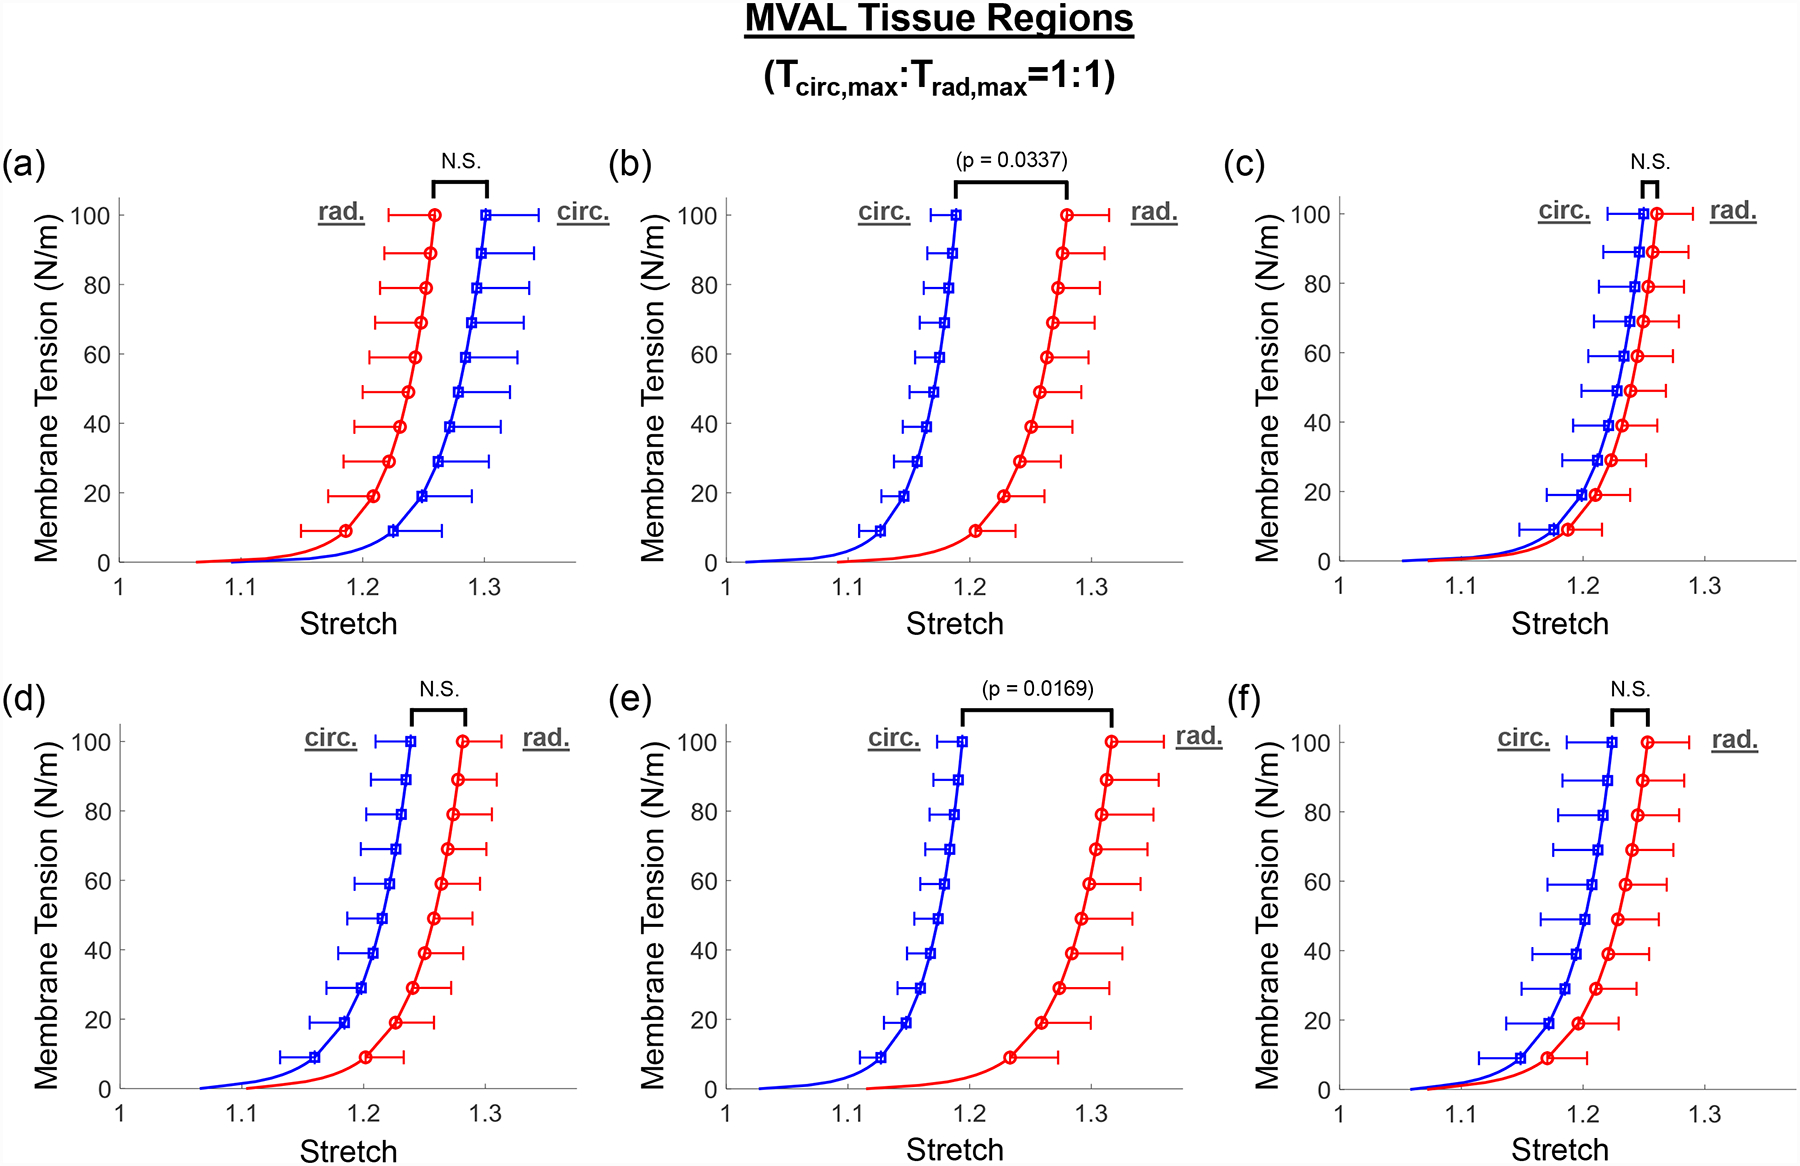
Mean ± SEM of membrane tension versus total tissue stretch results for the six MVAL tissue regions under equi-biaxial loading protocol (Tcirc,max:Trad,max = 1:1). The labels (a-f) correspond to the region label defined in Fig. 1c. N.S.: non-statistically significant.
Figure 3 –
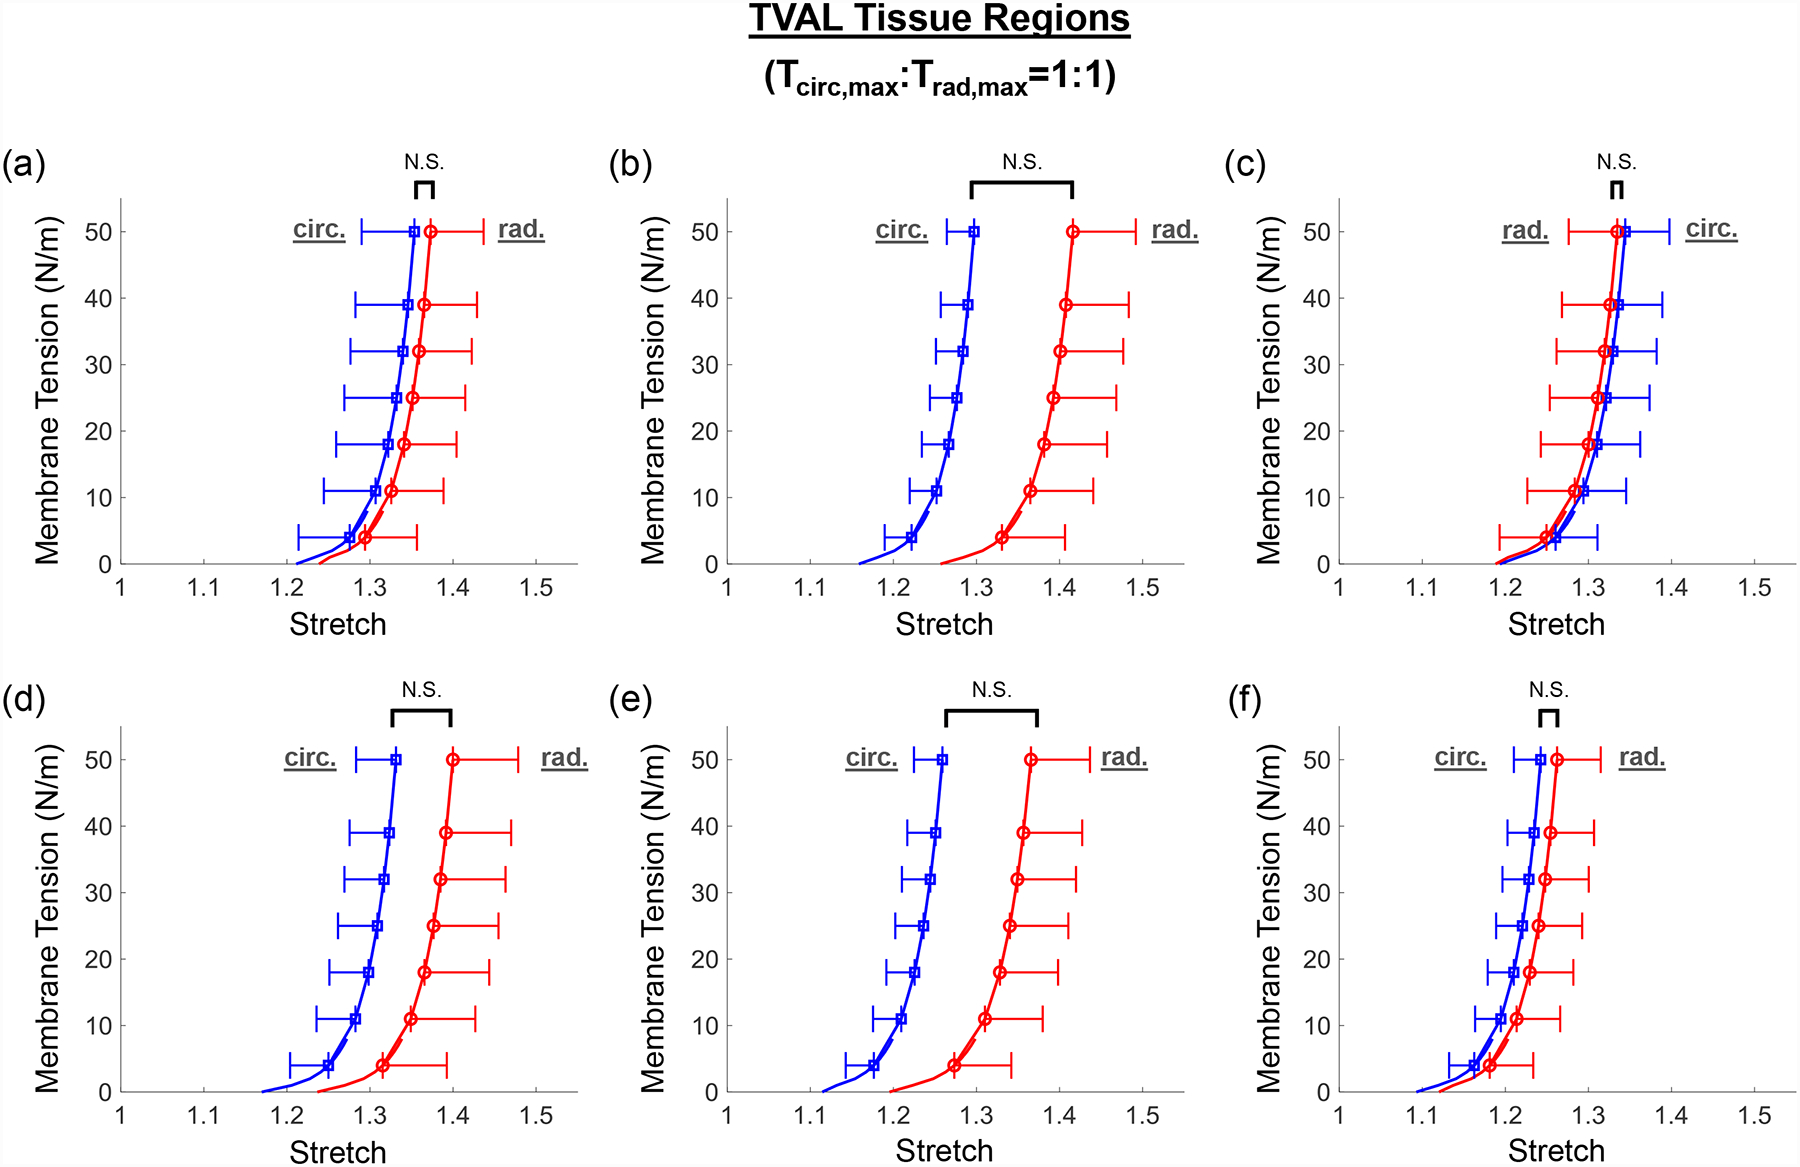
Mean ± SEM of membrane tension versus total tissue stretch results for the six TVAL tissue regions under equi-biaxial loading protocol (Tcirc,max:Trad,max = 1:1). The labels (a-f) correspond to the region label defined in Fig. 1c. N.S.: non-statistically significant.
Figure 4 –
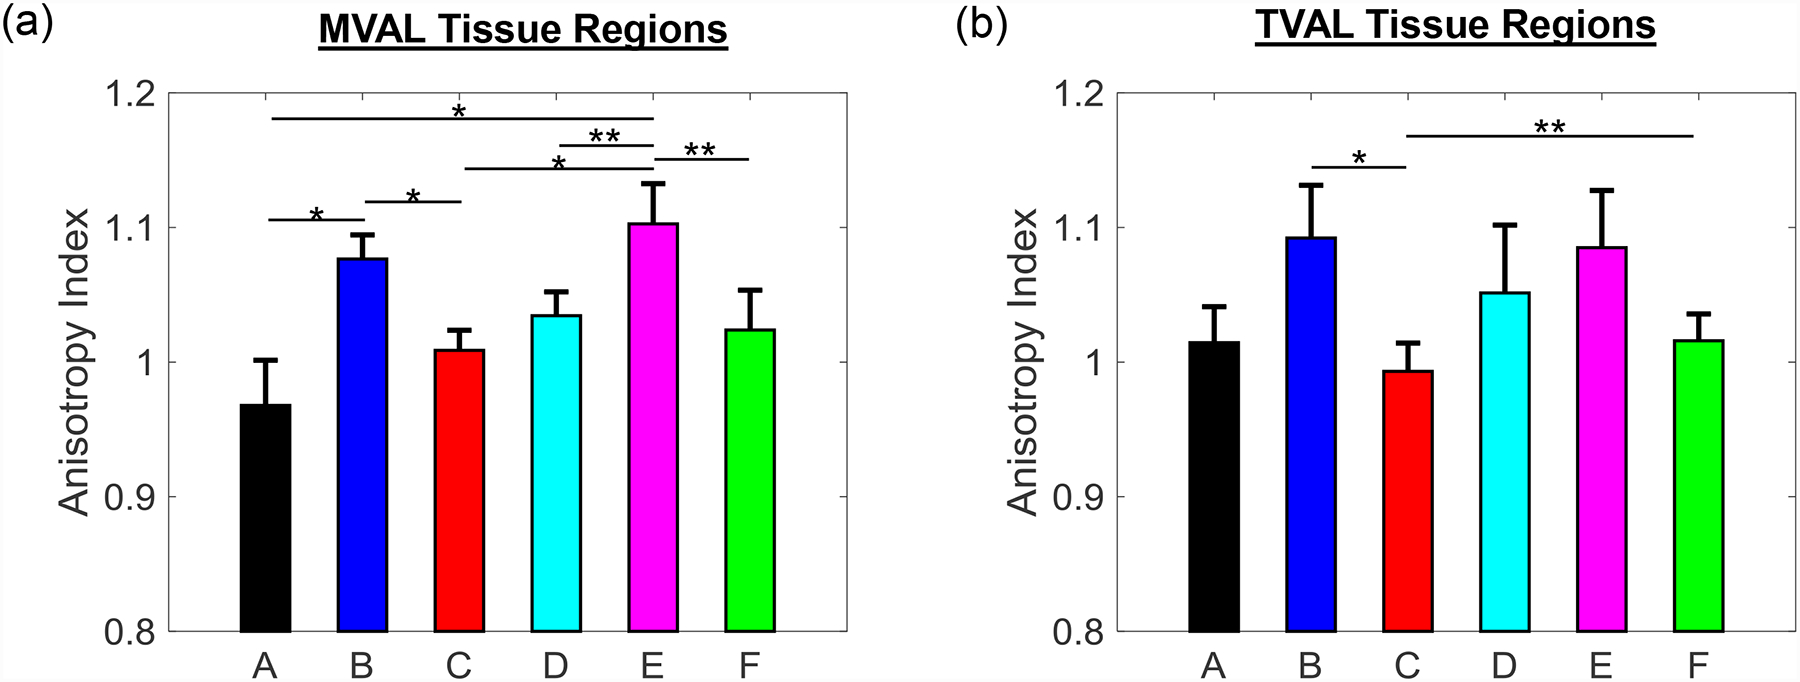
Mean ± SEM of anisotropy index for total tissue stretch of the six tissue regions of the (a) MVAL and (b) TVAL. The labels (a-f) correspond to the region label defined in Fig. 1c.
Figure 5 –
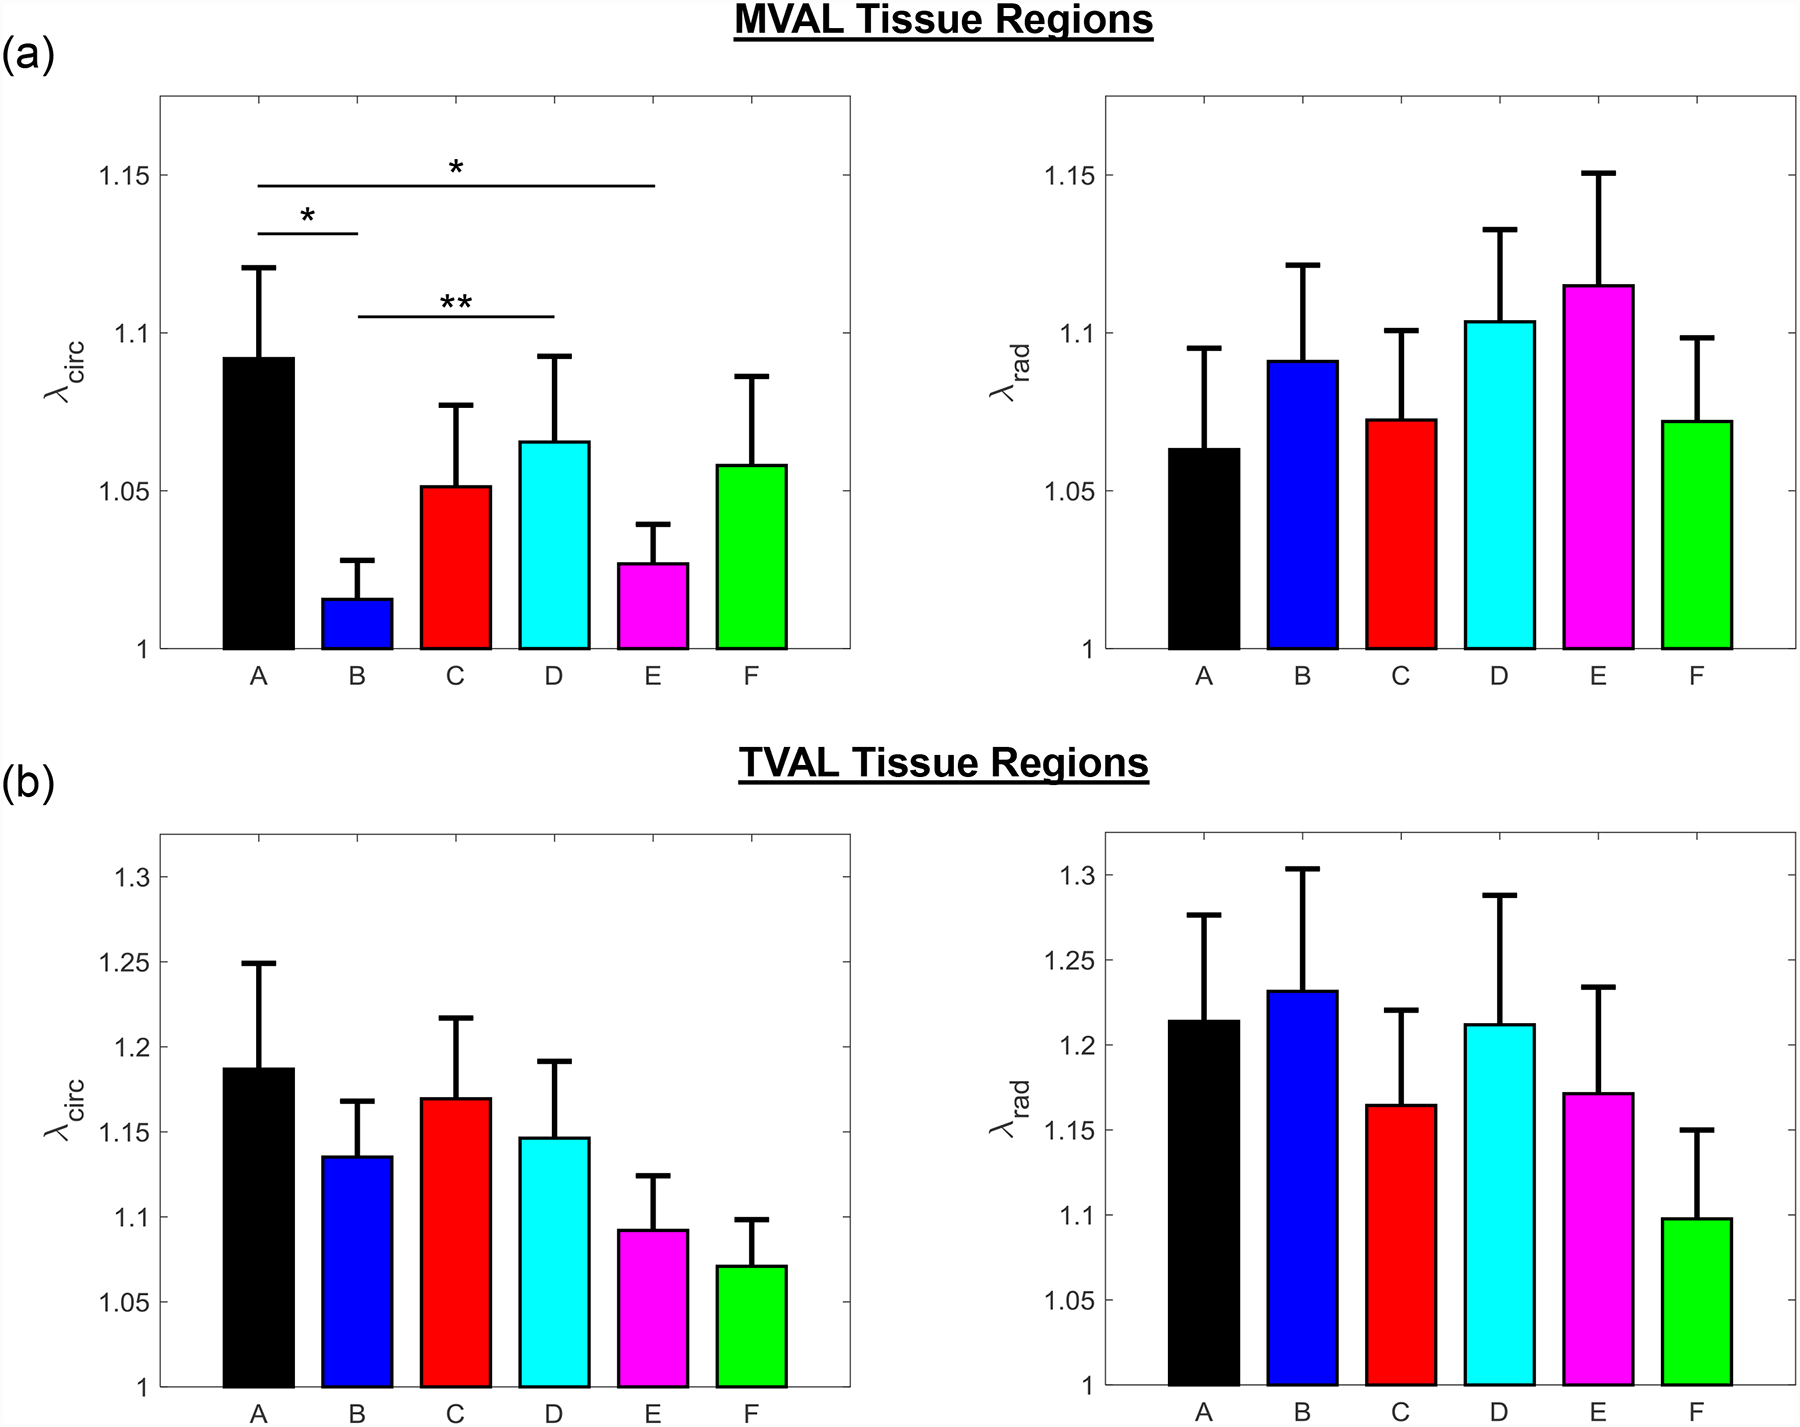
Mean ± SEM of the preconditioning stretches ( and ) of (a) the six MVAL tissue regions and (b) the six TVAL tissue regions in both the circumferential (left) and radial (right) directions. (*) denotes statistically significant (p<0.05) difference between groups and (**) denotes nearly statistically significant (0.05<p<0.10) difference between groups; otherwise, not statistically significant (p>0.10).
Figure 6 –
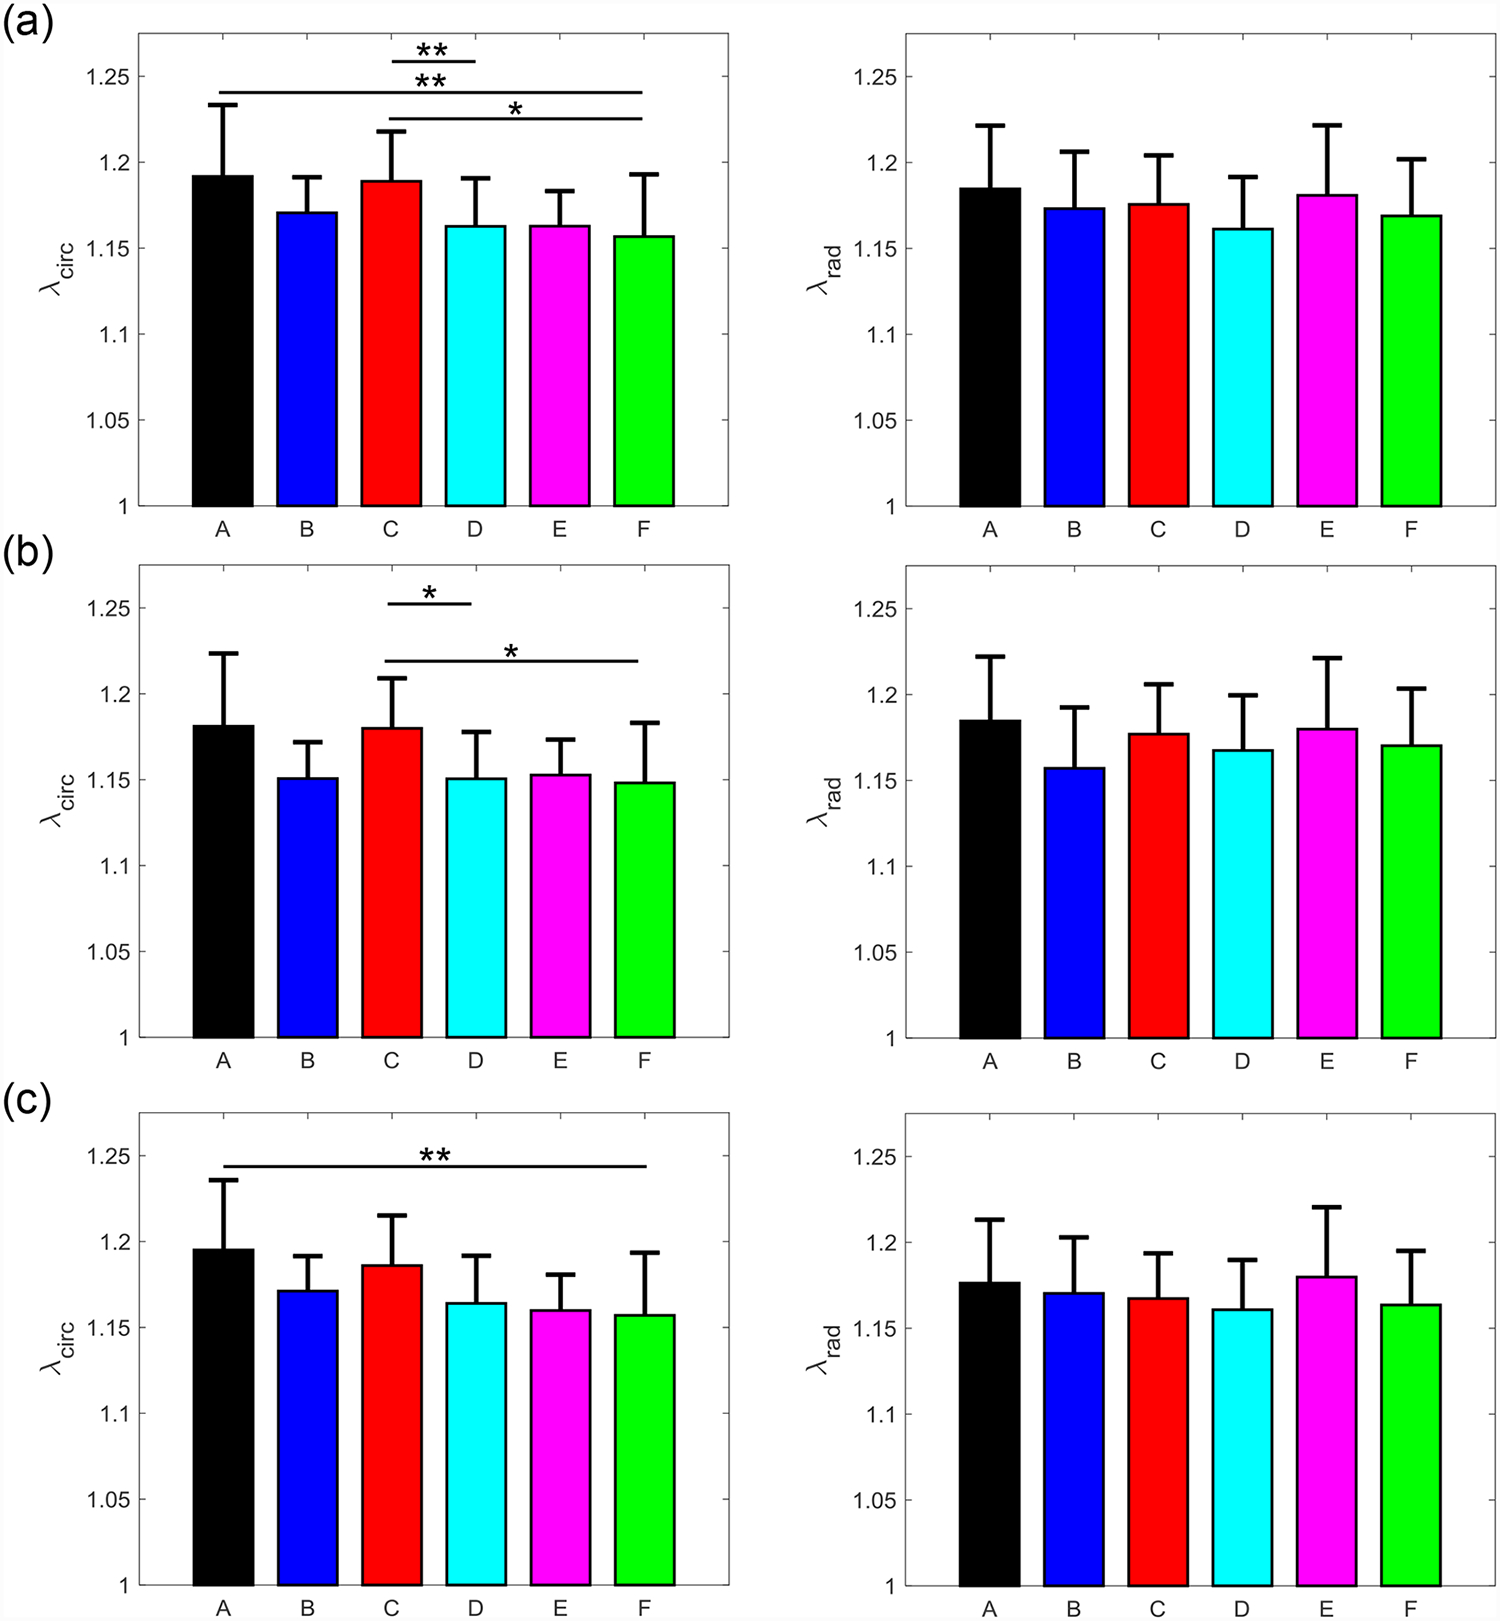
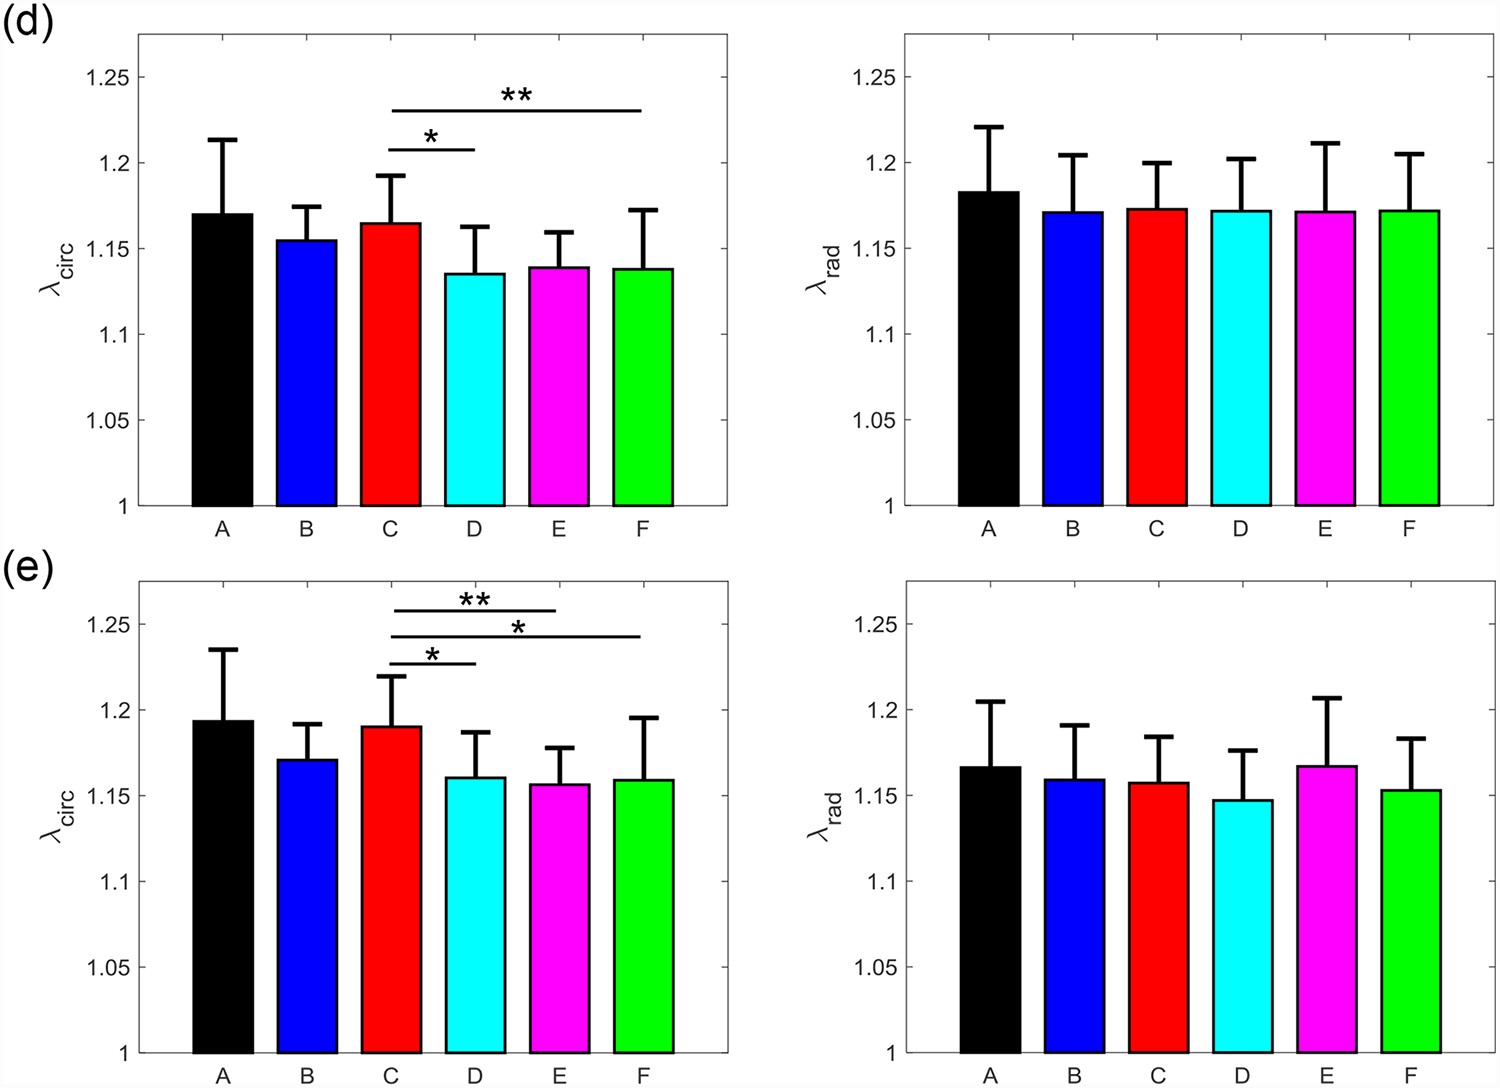
Mean ± SEM of the mechanical stretches of all the six MVAL tissue regions in both the circumferential (left) and radial (right) directions under 5 loading protocols: Tcirc,max:Trad,max = (a) 1:1, (b) 0.75:1, (c) 1:0.75 (d) 0.5:1, and (e) 1:0.5. (*) denotes statistically significant (p<0.05) difference between groups and (**) denotes nearly statistically significant (0.05<p<0.10) difference between groups; otherwise, not statistically significant (p>0.10).
Figure 7 –
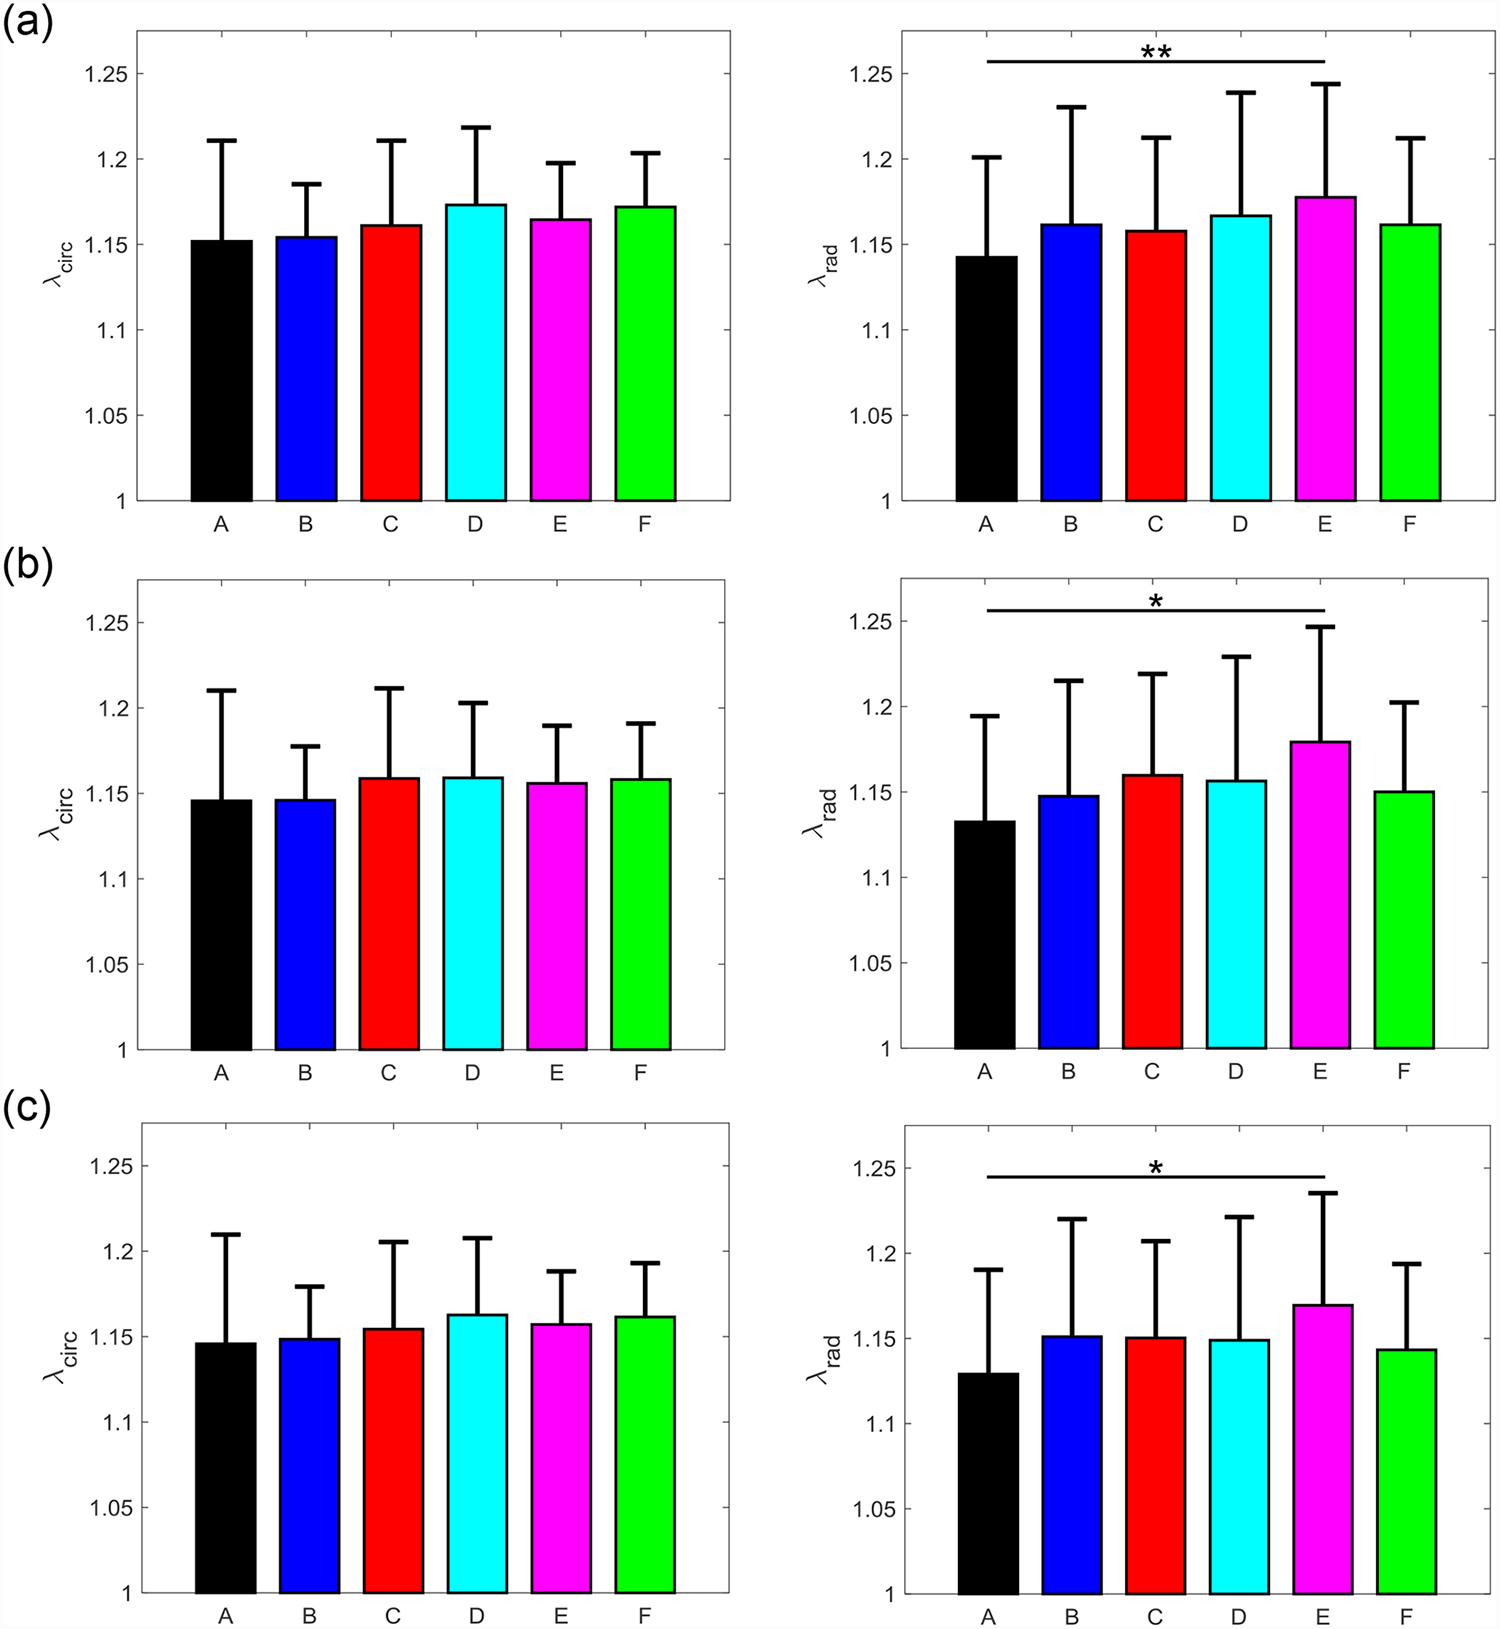
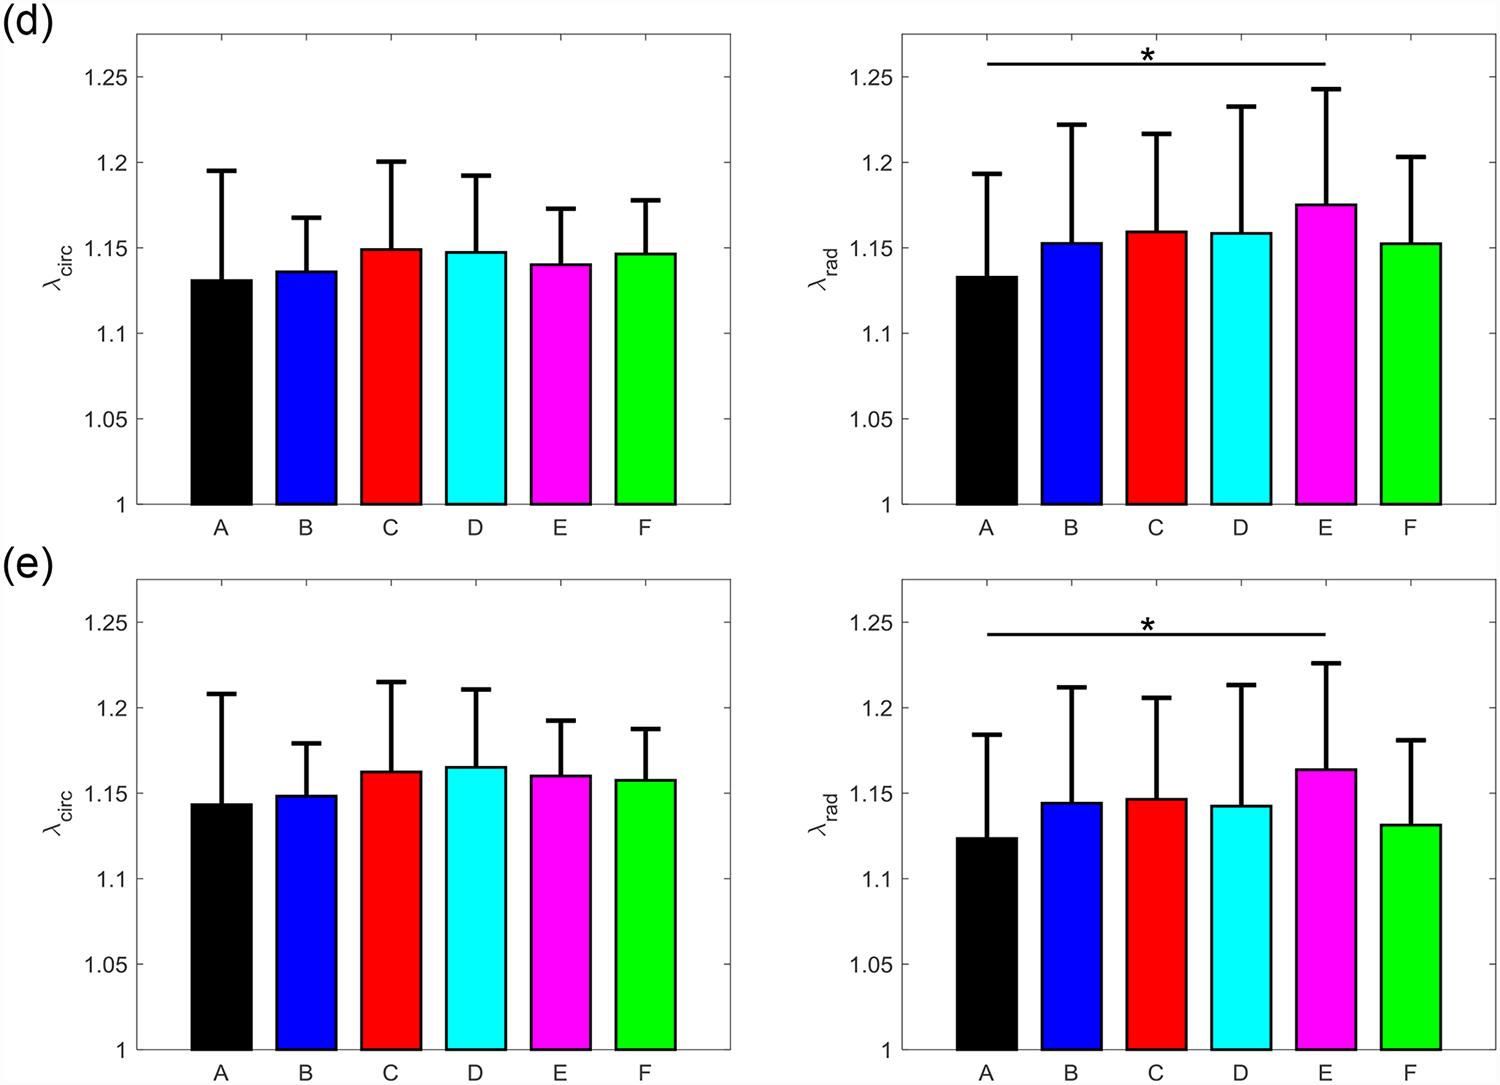
Mean ± SEM of the mechanical stretches of all the six TVAL tissue regions in both the circumferential (left) and radial (right) directions under 5 loading protocols: Tcirc,max:Trad,max = (a) 1:1, (b) 0.75:1, (c) 1:0.75 (d) 0.5:1, and (e) 1:0.5. (*) denotes statistically significant (p<0.05) difference between groups and (**) denotes nearly statistically significant (0.05<p<0.10) difference between groups; otherwise, not statistically significant (p>0.10).
Table 1 –
Total tissue stretches ( and ) and anisotropy index of each region for the MVAL and TVAL leaflets (c.f. Fig. 2 & Fig. 3). Reported values are for equibiaxial testing protocol (Tcirc,max:Trad,max = 1:1). All values are reported as mean ± SEM.
| Valve | Region | Anisotropy Index | ||
|---|---|---|---|---|
| MVAL | A (n=13) | 1.301±0.043 | 1.259±0.038 | 0.977 ± 0.034 |
| B (n=13) | 1.189±0.021 | 1.280±0.035 | 1.076 ± 0.018 | |
| C (n=13) | 1.250±0.030 | 1.261±0.030 | 1.010 ± 0.015 | |
| D (n=12) | 1.239±0.029 | 1.281±0.032 | 1.036 ± 0.018 | |
| E (n=13) | 1.194±0.021 | 1.317±0.043 | 1.103 ± 0.030 | |
| F (n=13) | 1.224±0.037 | 1.253±0.034 | 1.030 ± 0.030 | |
| TVAL | A (n=13) | 1.380±0.065 | 1.400±0.035 | 1.019 ± 0.027 |
| B (n=13) | 1.322±0.033 | 1.444±0.076 | 1.086 ± 0.039 | |
| C (n=13) | 1.371±0.054 | 1.362±0.060 | 0.993 ± 0.021 | |
| D (n=12) | 1.358±0.049 | 1.428±0.080 | 1.054 ± 0.051 | |
| E (n=13) | 1.285±0.035 | 1.394±0.072 | 1.083 ± 0.043 | |
| F (n=10) | 1.268±0.033 | 1.288±0.053 | 1.013 ± 0.020 |
Variation in the sample size (n) was due to tests in which tissue data was not successfully completely. For example: tissue tearing, testing failure, or dissection in which edge regions were not sufficiently large for biaxial mechanical testing.
Table 3 –
Mechanical stretches ( and ) of each region for the MVAL and TVAL. All values are reported as mean (SEM).
| Ratio | Stretch | MVAL | TVAL | ||||||||||
|---|---|---|---|---|---|---|---|---|---|---|---|---|---|
| A | B | C | D | E | F | A | B | C | D | E | F | ||
| 1:1 | Circ. | 1.155 (0.017) | 1.136 (0.013) | 1.154 (0.011) | 1.129 (0.006) | 1.128 (0.014) | 1.122 (0.010) | 1.122 (0.015) | 1.122 (0.016) | 1.129 (0.017) | 1.142 (0.025) | 1.131 (0.010) | 1.138 (0.017) |
| Rad. | 1.150 (0.012) | 1.139 (0.012) | 1.142 (0.010) | 1.128 (0.008) | 1.147 (0.014) | 1.134 (0.010) | 1.112 (0.011) | 1.132 (0.013) | 1.127 (0.015) | 1.138 (0.016) | 1.144 (0.011) | 1.130 (0.014) | |
| 0.75:1 | Circ. | 1.290 (0.044) | 1.169 (0.021) | 1.240 (0.030) | 1.224 (0.028) | 1.184 (0.021) | 1.215 (0.036) | 1.372 (0.071) | 1.313 (0.034) | 1.369 (0.058) | 1.341 (0.047) | 1.276 (0.035) | 1.253 (0.035) |
| Rad. | 1.259 (0.039) | 1.262 (0.037) | 1.262 (0.030) | 1.287 (0.034) | 1.315 (0.044) | 1.254 (0.034) | 1.387 (0.069) | 1.427 (0.075) | 1.364 (0.065) | 1.416 (0.081) | 1.396 (0.074) | 1.274 (0.055) | |
| 1:0.75 | Circ. | 1.305 (0.043) | 1.189 (1.247) | 1.247 (0.030) | 1.240 (0.029) | 1.191 (0.021) | 1.224 (0.038) | 1.372 (0.070) | 1.315 (0.033) | 1.363 (0.056) | 1.345 (0.049) | 1.276 (0.033) | 1.256 (0.033) |
| Rad. | 1.250 (0.038) | 1.277 (0.034) | 1.252 (0.027) | 1.281 (0.030) | 1.315 (0.043) | 1.247 (0.033) | 1.382 (0.068) | 1.430 (0.077) | 1.352 (0.062) | 1.405 (0.080) | 1.384 (0.072) | 1.266 (0.053) | |
| 0.5:1 | Circ. | 1.133 (0.019) | 1.120 (0.013) | 1.131 (0.012) | 1.102 (0.006) | 1.105 (0.014) | 1.104 (0.010) | 1.099 (0.014) | 1.105 (0.017) | 1.116 (0.018) | 1.117 (0.023) | 1.108 (0.011) | 1.114 (0.019) |
| Rad. | 1.148 (0.013) | 1.137 (0.012) | 1.140 (0.011) | 1.138 (0.011) | 1.137 (0.016) | 1.137 (0.011) | 1.102 (0.010) | 1.123 (0.014) | 1.128 (0.016) | 1.128 (0.016) | 1.141 (0.011) | 1.121 (0.015) | |
| 1:0.5 | Circ. | 1.157 (0.018) | 1.136 (0.014) | 1.156 (0.012) | 1.127 (0.005) | 1.122 (0.014) | 1.124 (0.010) | 1.111 (0.012) | 1.117 (0.016) | 1.129 (0.014) | 1.134 (0.020) | 1.127 (0.010) | 1.124 (0.016) |
| Rad. | 1.132 (0.014) | 1.126 (0.012) | 1.125 (0.011) | 1.114 (0.013) | 1.133 (0.014) | 1.119 (0.010) | 1.092 (0.012) | 1.115 (0.013) | 1.113 (0.013) | 1.114 (0.016) | 1.133 (0.015) | 1.100 (0.013) | |
Three main trends were observed for all loading ratios (Tcirc,max:Trad,max = 1:1, 0.75:1, 1:0.75, 0.5:1, and 1:0.5) in our biaxial mechanical testing results as described below. (1) We found that the central regions had a greater difference in the total tissue stretch between the circumferential and radial directions than the edge regions for the MVAL (region B: p=0.034, region E: p=0.017) and TVAL (region B: p=0.162, region E: p=0.189). (2) By analyzing the anisotropy index, the central regions were more anisotropic than the edge regions for the MVAL (statistically significant difference comparing B-A: p=0.016, B-C: p=0.010, and E-A: p=0.010, and nearly statistically significant difference in D-E: p=0.072, and E-F: p=0.096). This trend was also observed in the TVAL regions (statistically significant difference comparing B-C: p=0.048, and nearly statistically significant difference in E-C: p=0.070). (3) It was found that the peak mechanical stretches in the circumferential direction of the MVAL were higher in regions near the annulus (regions A, B, and C) than those in regions near the free edge (regions D, E, and F) (circumferential direction, 0.036<p<0.703; radial direction, 0.136<p<0.842). This trend was not observed for the TVAL as the peak mechanical stretches were fairly uniform across the entire leaflet (circumferential direction, 0.496<p<0.910; radial direction, 0.050<p<0.930). Specifically, the peak mechanical stretches in the circumferential direction were 1.122–1.155 and 1.122–1.142 for the MVAL and TVAL tissue regions, respectively, whereas the peak mechanical stretches in the radial direction were 1.128–1.150 and 1.112–1.144 for the MVAL and TVAL tissue regions, respectively (Tables 1–3).
3.3. Stress relaxation testing
A general trend of anisotropic exponential decays in the normalized membrane tension was found for both the MVAL and TVAL tissue regions (Fig. 8a–f and Fig. 9a–f). Average values of the prescribed engineering strain are summarized in Table 4 for both the MVAL and TVAL regions. For the MVAL, all regions were observed to have a similar stress decay, except for region C, which decayed slightly more in the circumferential direction (Fig. 8c). As for the TVAL, decays in the membrane tension magnitude were observed to be similar across all regions (Fig. 9). Comparing between the MVAL and the TVAL, an approximately 20%−25% decay in stress reduction was observed for the MVAL tissue regions, whereas approximately 15%−20% stress reduction was found across all TVAL tissue regions.
Figure 8 –
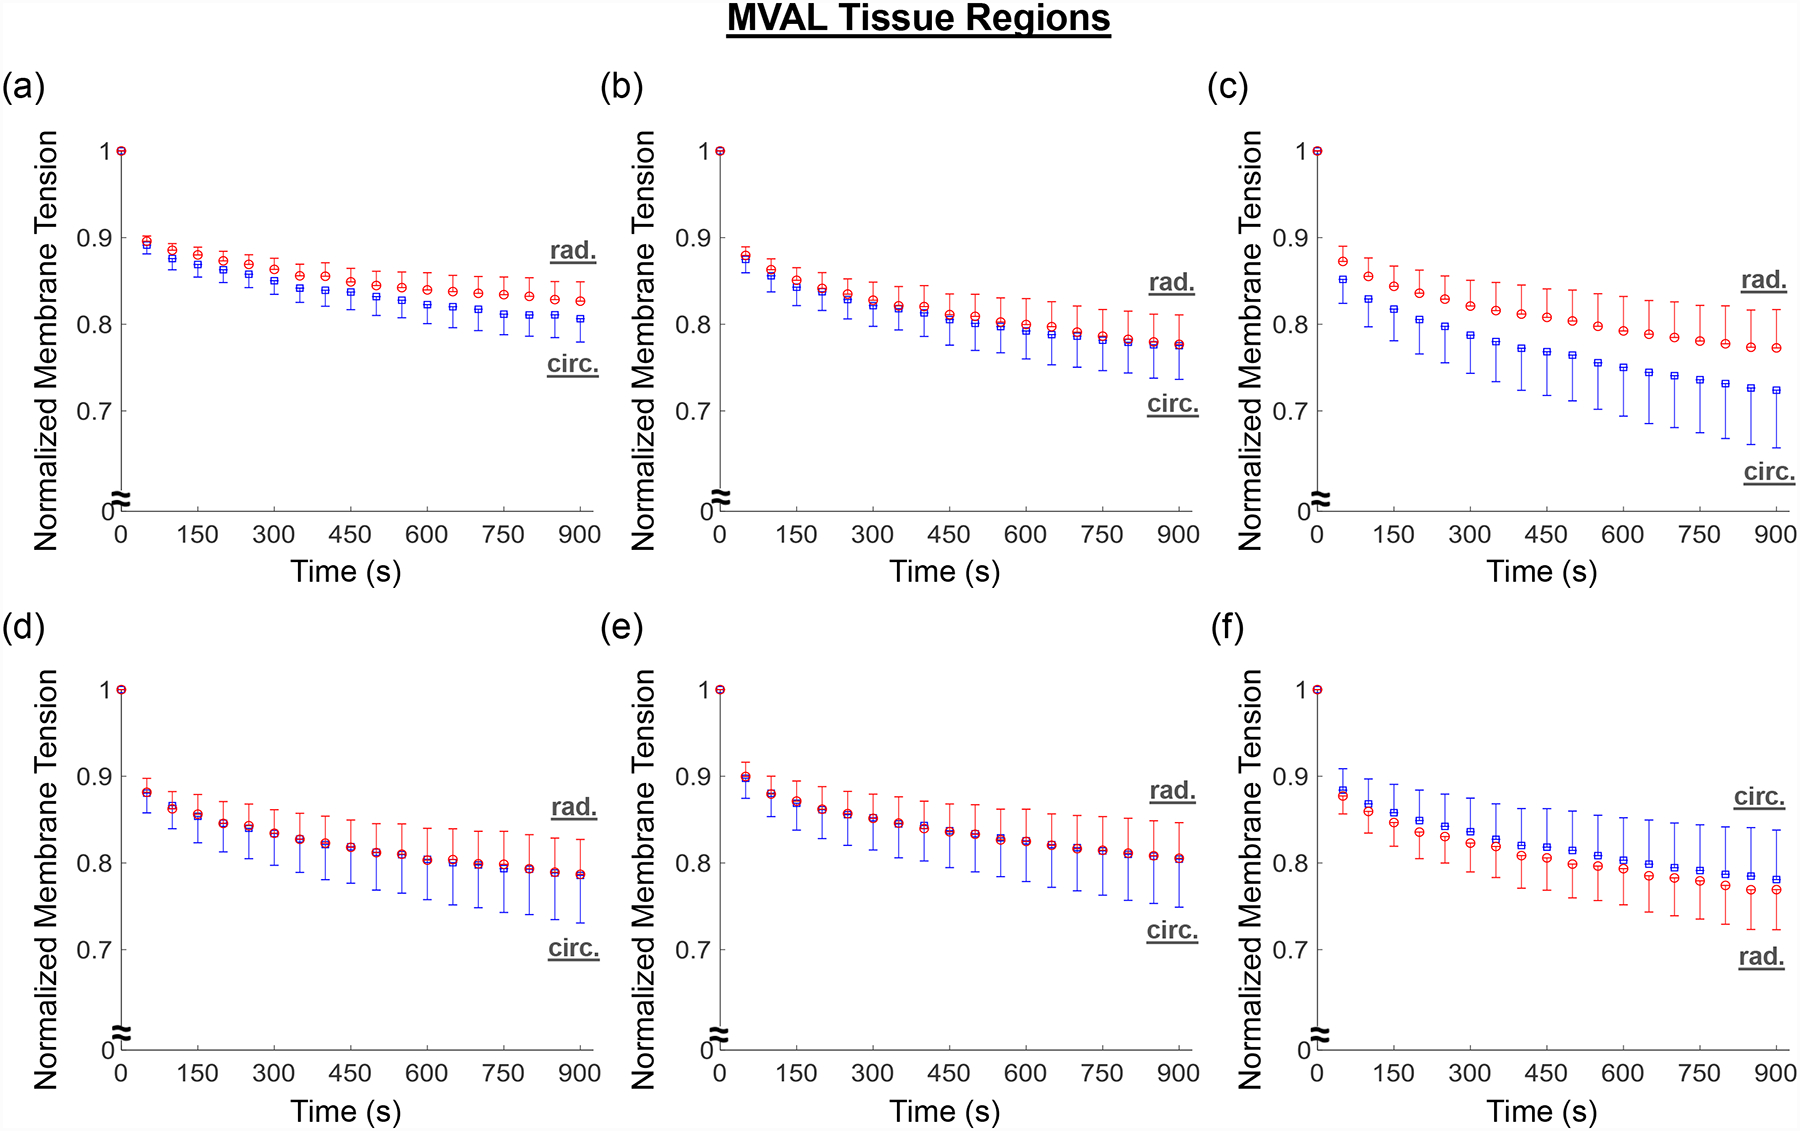
Mean ± SEM of the normalized membrane tension versus time results from the stress relaxation testing for all the six MVAL tissue regions.
Figure 9 –
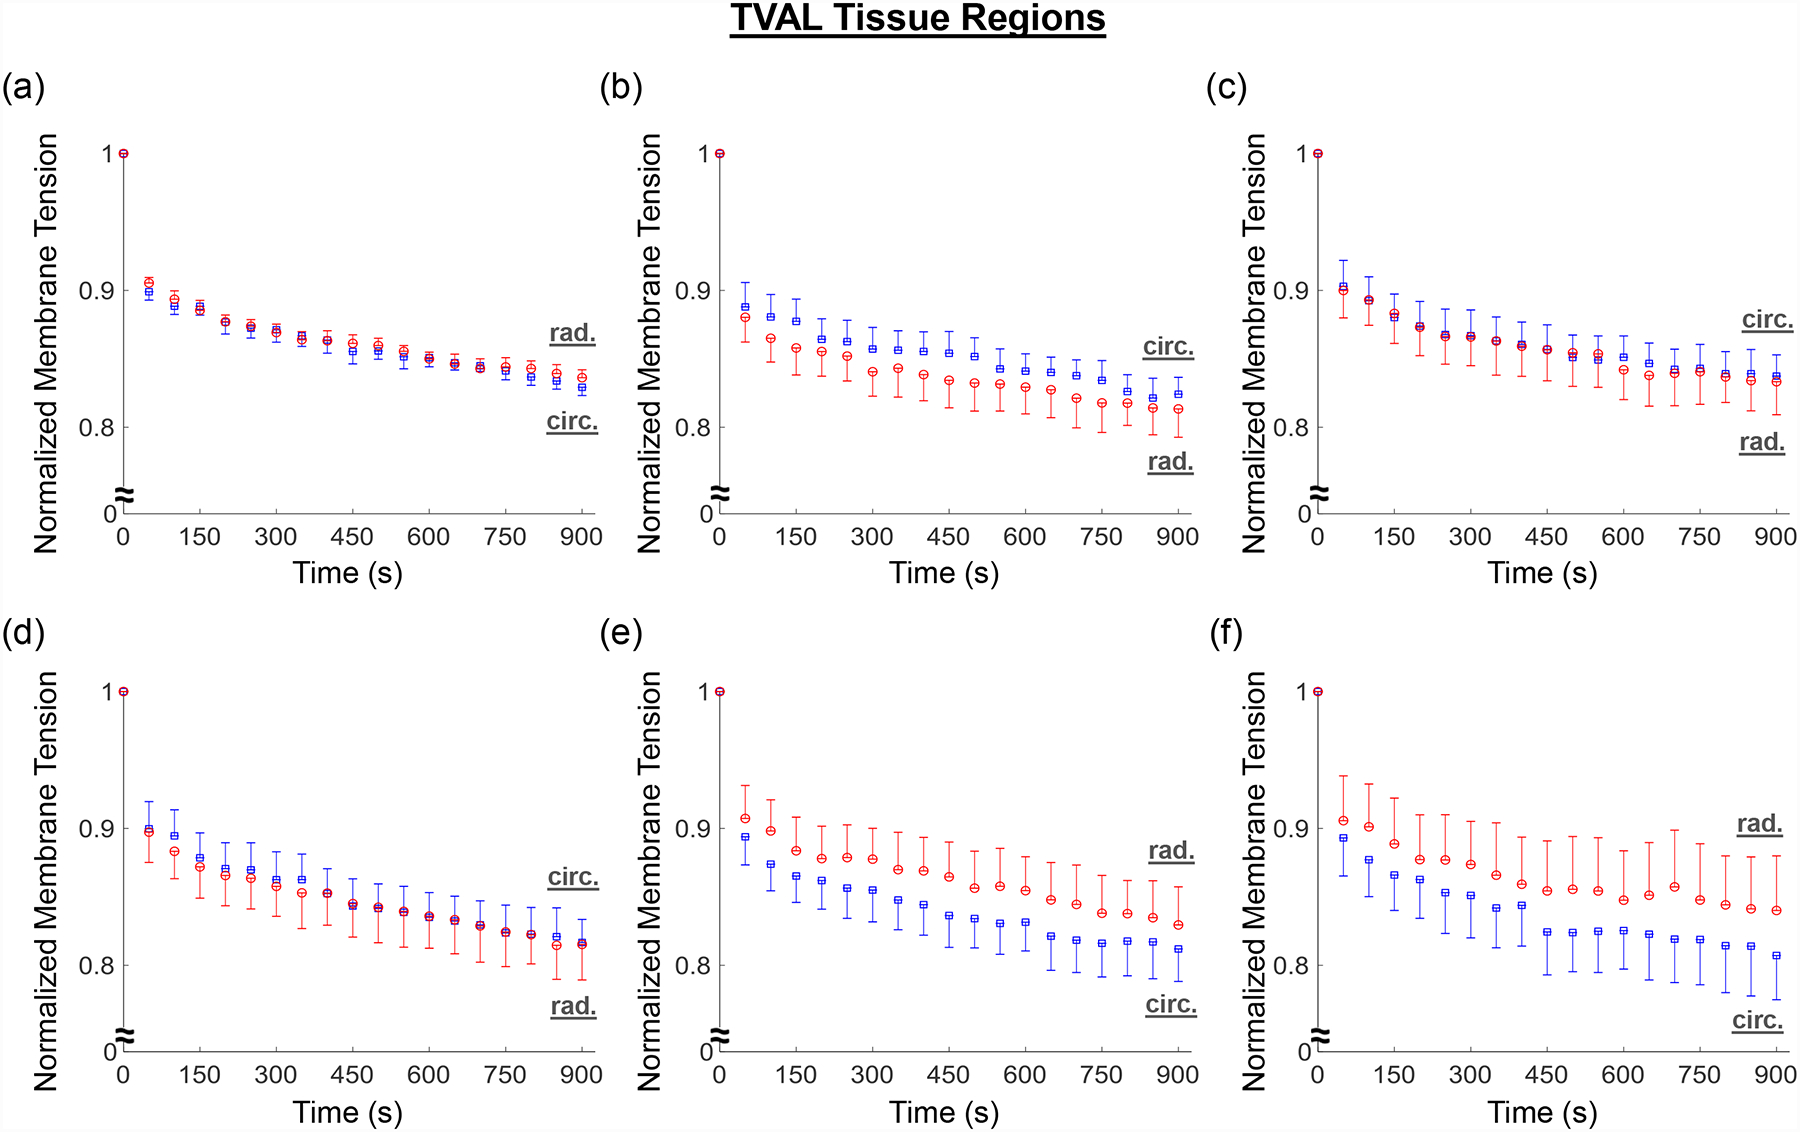
Mean ± SEM of the normalized membrane tension versus time results from the stress relaxation testing for all the six TVAL tissue regions.
Table 4 –
Engineering strains (ε=L/L0) in the circumferential and radial directions during the biaxial stress-relaxation tests for six MVAL and TVAL tissue regions.
| Valve Leaflet | Tissue Region | Circumferential Strain | Radial Strain |
|---|---|---|---|
| MVAL | A | 0.275±0.054 | 0.283±0.034 |
| B | 0.203±0.033 | 0.348±0.035 | |
| C | 0.277±0.034 | 0.276±0.080 | |
| D | 0.371±0.060 | 0.371±0.086 | |
| E | 0.171±0.040 | 0.440±0.090 | |
| F | 0.211±0.035 | 0.473±0.065 | |
| TVAL | A | 0.431±0.044 | 0.327±0.084 |
| B | 0.395±0.074 | 0.369±0.077 | |
| C | 0.517±0.228 | 0.345±0.044 | |
| D | 0.334±0.036 | 0.466±0.058 | |
| E | 0.276±0.029 | 0.489±0.185 | |
| F | 0.400±0.050 | 0.344±0.161 |
4. Discussion
4.1. Overall findings and comparisons with previous work
Biaxial mechanical characterization of the six regions of the MVAL and TVAL allowed for comparisons of the leaflet tissue’s regionally-varied mechanical properties. It was found that the central regions (region B and region E, Fig. 1c) of both leaflets had a more distinct difference in the peak total tissue stretches, but this difference was found to be statistically significant only for the MVAL. The mechanical properties and material anisotropy for the MVAL tissue regions characterized in this study agree with previous work considering the central belly region (Jett et al., 2018, in press). However, from our statistical analyses for the TVAL, we found that the p-values of the material anisotropy for the central regions were much lower than those for the edge regions, suggesting a more distinct difference in the peak total tissue stretches for the TVAL central regions, which would agree with previous investigations (Khoiy and Amini, 2016). The disparity between this study’s and previous studies’ observance of significant anisotropy in the TVAL could be possibly attributed to the variability in mechanical characteristics of collagenous tissues and in different porcine animal subjects.
The observation of the belly regions being more anisotropic was further supported when comparing the anisotropy indices (AI’s) between any two tissue regions. Statistically significant differences in the anisotropy index were found to be more pronounced for the MVAL tissue regions, especially when comparing the central regions (B and E) to the edge regions (A, C, and D). In contrast, statistically significant differences were only found for the TVAL between regions B and C as well as between regions E and C. This novel finding suggests there is a noticeable regional variance in the mechanical behaviors of the MVAL and TVAL, typically when comparing the central belly regions to those edge regions as closer to the free edge and commissures of the valve.
From our analyses of the peak mechanical stretches for the MVAL and TVAL tissue regions, a general trend was observed with the circumferential stretches being greater in regions closer to the annulus than those near the free edge for the MVAL. Although other regional comparisons for the TVAL did not yield observable trends, the regional variances in tissue’s stretch response suggest spatially-varied mechanical characteristics of the AHV leaflets.
Lastly, regional variance was also exemplified through stress relaxation testing. Our results indicated a general trend of anisotropic, exponential decaying in the stress magnitude for the MVAL and TVAL tissue regions. The stress decay was also reflective of previous studies considering the bulk leaflet tissues, especially in those central belly regions (Grashow et al., 2006a; Sacks et al., 2009; Sacks and Yoganathan, 2007). Moreover, a fair amount of variation in stress decay was also observed between the six tissue regions. The general trend of greater stress decay in the MVAL regions compared to the TVAL regions suggests that the MVAL regions may have greater stress-relaxation potential than the TVAL regions, but future investigations are required for confirmation.
4.2. Study limitations and future extensions
General study limitations for our biaxial testing framework have been discussed in our previous study (Jett et al., 2018): (i) shear stress was neglected from our calculations due to its negligibility, which is typical for biaxial testing protocols, and (ii) the freezing effect on the mechanical behaviors of AHV components’ has not been extensively investigated and is an assumption from studies involving other soft tissues. In addition, there were two specific limitations for this investigation involving the regional mechanical characterization procedures. Firstly, the effective testing size in this study was much smaller than our previous investigation (6.5 mm versus 3.5 mm) and, to our knowledge, there is no study on the effect of specimen size on the characterized mechanical behavior of the leaflets. Further investigation may be warranted on the specimen size effect to determine the optimal testing size for the most accurate mechanical characterization of the AHV leaflet regions, which is currently underway in our lab. Secondly, a hold time of 15-minutes was considered for the stress relaxation testing in this study. An ongoing study from our group and other previous investigations have shown that a holding time of approximately 4 hours may be warranted to observe the full pattern of the stress relaxation behavior (Grashow et al., 2006a; Sacks et al., 2009; Sacks and Yoganathan, 2007). Nevertheless, as we know the valve leaflets experience loading cycles in a time scale of ~1 second, the fast relaxation has been well captured in the 15-minute stress relaxation test, and our results have shown that the 15-minute stress relaxation period is sufficient to observe general regional similarities/differences in the stress reduction behaviors of the MVAL and TVAL tissue regions (Figs. 8–9).
The future extensions of this novel study are two-fold. Firstly, regional variances were observed in mechanical responses of representative MV and TV leaflets. Thus, extensions are warranted into the other untested leaflets which will provide researchers with richer information regarding regional variance for all five AHV leaflets. Second, the biaxial data obtained from our investigations necessitate the use of region-specific constitutive model parameters in computational modeling of functioning atrioventricular heart valves. Integration of such spatially-varied mechanical properties into the constitutive model development will facilitate more accurate representation of the heart valve function than those models developed based on biaxial mechanical data of bulk leaflet tissues. Computational models of the AHV leaflets utilizing such spatially heterogenous tissue mechanics could provide better insight into regionally dependent treatments for valvular disease, such as suture-based valvuloplasty or annuloplasty surgical repair (Gillinov et al., 1998; Jensen et al., 2011).
4.3. Conclusion
This research has, for the first time, examined the regional variance and similarity of the mechanical properties of the AHVs. Our novel findings in this work could provide a better understanding of the regionally-varying mechanics of AHVs and suggests that further refinements of existing heart valve computational models are necessary to more realistically and accurately represent the valve’s function. Moreover, the biaxial mechanical testing results of representative MV and TV leaflets in this study have demonstrated a significant difference in the material anisotropy when comparing the central tissue regions to the edge regions. Variance was observed in the peak mechanical stretch across the six tissue regions with greater extensibility observed near the annulus of the MVAL. Our stress relaxation results further showed an anisotropic, exponential stress decay trend with variations in the stress reduction between some tissue regions. These experimental findings in tissue biomechanics open the door to future investigations of the regional mechanical variance for other AHV leaflets.
Supplementary Material
Figure S1 – Mean ± SEM of membrane tension versus total tissue stretch results for the six MVAL tissue regions under loading protocol Tcirc,max:Trad,max = 0.75:1. The labels (a-f) correspond to the region label defined in Fig. 1c.
Figure S2 – Mean ± SEM of membrane tension versus total tissue stretch results for the six MVAL tissue regions under loading protocol Tcirc,max:Trad,max = 1:0.75. The labels (a-f) correspond to the region label defined in Fig. 1c.
Figure S3 – Mean ± SEM of membrane tension versus total tissue stretch results for the six MVAL tissue regions under loading protocol Tcirc,max:Trad,max = 0.5:1. The labels (a-f) correspond to the region label defined in Fig. 1c.
Figure S4 – Mean ± SEM of membrane tension versus total tissue stretch results for the six MVAL tissue regions under loading protocol Tcirc,max:Trad,max = 1:0.5. The labels (a-f) correspond to the region label defined in Fig. 1c.
Figure S5 – Mean ± SEM of membrane tension versus total tissue stretch results for the six TVAL tissue regions under loading protocol Tcirc,max:Trad,max = 0.75:1. The labels (a-f) correspond to the region label defined in Fig. 1c.
Figure S6 – Mean ± SEM of membrane tension versus total tissue stretch results for the six TVAL tissue regions under loading protocol Tcirc,max:Trad,max = 1:0.75. The labels (a-f) correspond to the region label defined in Fig. 1c.
Figure S7 – Mean ± SEM of membrane tension versus total tissue stretch results for the six TVAL tissue regions under loading protocol Tcirc,max:Trad,max = 0.5:1. The labels (a-f) correspond to the region label defined in Fig. 1c.
Figure S8 – Mean ± SEM of membrane tension versus total tissue stretch results for the six TVAL tissue regions under loading protocol Tcirc,max:Trad,max = 1:0.5. The labels (a-f) correspond to the region label defined in Fig. 1c.
Table 2 –
Preconditioning stretches ( and ) for each region of the MVAL and TVAL leaflets (c.f. Fig. 2 & Fig. 3). All values are reported as mean ± SEM.
| Valve | Region | ||
|---|---|---|---|
| MVAL | A | 1.114 ± 0.029 | 1.085 ± 0.033 |
| B | 1.036 ± 0.013 | 1.113 ± 0.031 | |
| C | 1.073 ± 0.026 | 1.094 ± 0.029 | |
| D | 1.087 ± 0.028 | 1.126 ± 0.030 | |
| E | 1.048 ± 0.013 | 1.138 ± 0.036 | |
| F | 1.080 ± 0.029 | 1.094 ± 0.027 | |
| TVAL | A | 1.211 ± 0.064 | 1.239 ± 0.064 |
| B | 1.158 ± 0.034 | 1.257 ± 0.074 | |
| C | 1.193 ± 0.048 | 1.188 ± 0.057 | |
| D | 1.170 ± 0.046 | 1.237 ± 0.078 | |
| E | 1.114 ± 0.033 | 1.195 ± 0.064 | |
| F | 1.093 ± 0.028 | 1.120 ± 0.053 |
Acknowledgments
Support from the American Heart Association Scientist Development Grant (SDG) Award (16SDG27760143) is gratefully acknowledged. CHL was in part supported by the institutional start-up funds from the School of Aerospace and Mechanical Engineering (AME) and the research funding through the Faculty Investment Program from the Research Council at the University of Oklahoma (OU). DL, CR, and SJ were supported by the Mentored Research Fellowship from the Office of Undergraduate Research at OU. DL and CR were supported by the Undergraduate Research Opportunities Program from the Honors College at OU. We also acknowledge undergraduate researchers Jacob Richardson and Ryan Bodlak for their assistance with the biaxial mechanical testing.
Footnotes
Conflicts of Interest
The authors of this paper have no financial or personal relationships with other people or organizations that could inappropriately influence (bias) our work.
References
- Amini R, Eckert CE, Koomalsingh K, McGarvey J, Minakawa M, Gorman JH, Gorman RC, Sacks MS, 2012. On the in vivo deformation of the mitral valve anterior leaflet: effects of annular geometry and referential configuration. Ann. Biomed. Eng 40, 1455–1467. [DOI] [PMC free article] [PubMed] [Google Scholar]
- Arzani A, Mofrad MR, 2017. A strain-based finite element model for calcification progression in aortic valves. J. Biomech 65, 216–220. [DOI] [PubMed] [Google Scholar]
- Ayoub S, Lee C-H, Driesbaugh KH, Anselmo W, Hughes CT, Ferrari G, Gorman RC, Gorman JH, Sacks MS, 2017. Regulation of valve interstitial cell homeostasis by mechanical deformation: implications for heart valve disease and surgical repair. Journal of The Royal Society Interface 14, 20170580. [DOI] [PMC free article] [PubMed] [Google Scholar]
- Chiang YP, Chikwe J, Moskowitz AJ, Itagaki S, Adams DH, Egorova NN, 2014. Survival and long-term outcomes following bioprosthetic vs mechanical aortic valve replacement in patients aged 50 to 69 years. JAMA 312, 1323–1329. [DOI] [PubMed] [Google Scholar]
- Condado JA, Velez‐Gimon M, 2003. Catheter‐based approach to mitral regurgitation. J. Interv. Cardiol 16, 523–534. [DOI] [PubMed] [Google Scholar]
- Flameng W, Herijgers P, Bogaerts K, 2003. Recurrence of mitral valve regurgitation after mitral valve repair in degenerative valve disease. Circulation 107, 1609–1613. [DOI] [PubMed] [Google Scholar]
- Foutz T, Stone E, Abrams JC, 1992. Effects of freezing on mechanical properties of rat skin. Am. J. Vet. Res 53, 788–792. [PubMed] [Google Scholar]
- Gillinov AM, Cosgrove DM, Blackstone EH, Diaz R, Arnold JH, Lytle BW, Smedira NG, Sabik JF, McCarthy PM, Loop FD, 1998. Durability of mitral valve repair for degenerative disease. J. Thorac. Cardiovas. Surg 116, 734–743. [DOI] [PubMed] [Google Scholar]
- Grashow JS, Sacks MS, Liao J, Yoganathan AP, 2006a. Planar Biaxial Creep and Stress Relaxation of the Mitral Valve Anterior Leaflet. Ann. Biomed. Eng 34, 1509–1518. [DOI] [PubMed] [Google Scholar]
- Grashow JS, Yoganathan AP, Sacks MS, 2006b. Biaixal stress–stretch behavior of the mitral valve anterior leaflet at physiologic strain rates. Ann. Biomed. Eng 34, 315–325. [DOI] [PubMed] [Google Scholar]
- Hammermeister K, Sethi GK, Henderson WG, Grover FL, Oprian C, Rahimtoola SH, 2000. Outcomes 15 years after valve replacement with a mechanical versus a bioprosthetic valve: final report of the Veterans Affairs randomized trial. J. Am. Coll. Cardiol 36, 1152–1158. [DOI] [PubMed] [Google Scholar]
- Huang H-YS, Balhouse BN, Huang S, 2012. Application of simple biomechanical and biochemical tests to heart valve leaflets: implications for heart valve characterization and tissue engineering. Proceedings of the Institution of Mechanical Engineers, Part H: Journal of Engineering in Medicine 226, 868–876. [DOI] [PubMed] [Google Scholar]
- Huang S, Huang H-YS, 2015. Biaxial stress relaxation of semilunar heart valve leaflets during simulated collagen catabolism: Effects of collagenase concentration and equibiaxial strain state. Proceedings of the Institution of Mechanical Engineers, Part H: Journal of Engineering in Medicine 229, 721–731. [DOI] [PubMed] [Google Scholar]
- Jamieson W, Von Lipinski O, Miyagishima R, Burr L, Janusz M, Ling H, Fradet G, Chan F, Germann E, 2005. Performance of bioprostheses and mechanical prostheses assessed by composites of valve-related complications to 15 years after mitral valve replacement. J. Thorac. Cardiovas. Surg 129, 1301–1308. [DOI] [PubMed] [Google Scholar]
- Jensen MO, Jensen H, Levine RA, Yoganathan AP, Andersen NT, Nygaard H, Hasenkam JM, Nielsen SL, 2011. Saddle-shaped mitral valve annuloplasty rings improve leaflet coaptation geometry. J. Thorac. Cardiovas. Surg 142, 697–703. [DOI] [PMC free article] [PubMed] [Google Scholar]
- Jett S, Laurence D, Kunkel R, Babu AR, Kramer K, Baumwart R, Towner R, Wu Y, Lee C-H, 2018. An investigation of the anisotropic mechanical properties and anatomical structure of porcine atrioventricular heart valves. J. Mech. Behav. Biomed. Mater 87, 155–171. [DOI] [PMC free article] [PubMed] [Google Scholar]
- Jett S, Laurence D, Kunkel R, Babu AR, Kramer K, Baumwart R, Towner R, Wu Y, Lee C-H, 2018, in press. Biaxial mechanical data of porcine atrioventricular valve leaflets. Data in Brief. doi: 10.1016/j.dib.2018.09.073 [DOI] [PMC free article] [PubMed] [Google Scholar]
- Khoiy KA, Amini R, 2016. On the biaxial mechanical response of porcine tricuspid valve leaflets. J. Biomech. Eng 138, 104504. [DOI] [PubMed] [Google Scholar]
- Kunzelman K, Reimink M, Cochran R, 1997. Annular dilatation increases stress in the mitral valve and delays coaptation: a finite element computer model. Cardiovasc. Surg 5, 427–434. [DOI] [PubMed] [Google Scholar]
- Lee C-H, Amini R, Gorman RC, Gorman JH, Sacks MS, 2014. An inverse modeling approach for stress estimation in mitral valve anterior leaflet valvuloplasty for in-vivo valvular biomaterial assessment. J. Biomech 47, 2055–2063. [DOI] [PMC free article] [PubMed] [Google Scholar]
- Lee C-H, Carruthers CA, Ayoub S, Gorman RC, Gorman JH, Sacks MS, 2015a. Quantification and simulation of layer-specific mitral valve interstitial cells deformation under physiological loading. J. Theor. Biol 373, 26–39. [DOI] [PMC free article] [PubMed] [Google Scholar]
- Lee C-H, Rabbah J-P, Yoganathan AP, Gorman RC, Gorman JH, Sacks MS, 2015b. On the effects of leaflet microstructure and constitutive model on the closing behavior of the mitral valve. Biomech. Model. Mechanobiol 14, 1281–1302. [DOI] [PMC free article] [PubMed] [Google Scholar]
- Li J, Luo X, Kuang Z, 2001. A nonlinear anisotropic model for porcine aortic heart valves. J. Biomech 34, 1279–1289. [DOI] [PubMed] [Google Scholar]
- Pierlot CM, Moeller AD, Lee JM, Wells SM, 2015. Biaxial creep resistance and structural remodeling of the aortic and mitral valves in pregnancy. Ann. Biomed. Eng 43, 1772–1785. [DOI] [PubMed] [Google Scholar]
- Prot V, Skallerud B, 2009. Nonlinear solid finite element analysis of mitral valves with heterogeneous leaflet layers. Computational Mechanics 43, 353–368. [Google Scholar]
- Reddy JN, 2013. An introduction to continuum mechanics. Cambridge university press. [Google Scholar]
- Rego BV, Sacks MS, 2017. A functionally graded material model for the transmural stress distribution of the aortic valve leaflet. J. Biomech 54, 88–95. [DOI] [PMC free article] [PubMed] [Google Scholar]
- Sacks MS, 2003. Incorporation of experimentally-derived fiber orientation into a structural constitutive model for planar collagenous tissues. J. Biomech. Eng 125, 280–287. [DOI] [PubMed] [Google Scholar]
- Sacks MS, David Merryman W, Schmidt DE, 2009. On the biomechanics of heart valve function. J. Biomech 42, 1804–1824. [DOI] [PMC free article] [PubMed] [Google Scholar]
- Sacks MS, Grashow J, Yoganathan AP, Year Viscoelastic behavior of heart valve tissues under biaxial stretch. In ASME 2004 International Mechanical Engineering Congress and Exposition. [Google Scholar]
- Sacks MS, Yoganathan AP, 2007. Heart valve function: a biomechanical perspective. Philosophical Transactions of the Royal Society of London B: Biological Sciences 362, 1369–1391. [DOI] [PMC free article] [PubMed] [Google Scholar]
- Schoen F, 2001. Pathology of heart valve substitution with mechanical and tissue prostheses. Cardiovasc. Pathol 3. [Google Scholar]
- Stella JA, Sacks MS, 2007. On the biaxial mechanical properties of the layers of the aortic valve leaflet. J. Biomech. Eng 129, 757–766. [DOI] [PubMed] [Google Scholar]
- Stemper BD, Yoganandan N, Stineman MR, Gennarelli TA, Baisden JL, Pintar FA, 2007. Mechanics of fresh, refrigerated, and frozen arterial tissue. J. Surg. Res 139, 236–242. [DOI] [PubMed] [Google Scholar]
- Tadmor EB, Miller RE, Elliott RS, 2012. Continuum mechanics and thermodynamics: from fundamental concepts to governing equations. Cambridge University Press. [Google Scholar]
- Tang GH, David TE, Singh SK, Maganti MD, Borger MA, 2006. Tricuspid valve repair with an annuloplasty ring results in improved long-term outcomes. Circulation. [DOI] [PubMed] [Google Scholar]
- Taramasso M, Denti P, Latib A, Guidotti A, Buzzatti N, Pozzoli A, Di Giannuario G, La Canna G, Colombo A, Alfieri O, 2015. Clinical and anatomical predictors of MitraClip therapy failure for functional mitral regurgitation: single central clip strategy in asymmetric tethering. Int. J. Cardiol 186, 286–288. [DOI] [PubMed] [Google Scholar]
- Taramasso M, Pozzoli A, Guidotti A, Nietlispach F, Inderbitzin DT, Benussi S, Alfieri O, Maisano F, 2016. Percutaneous tricuspid valve therapies: the new frontier. Eur. Heart J 38, 639–647. [DOI] [PubMed] [Google Scholar]
- Van de Veire NR, Braun J, Delgado V, Versteegh MI, Dion RA, Klautz RJ, Bax JJ, 2011. Tricuspid annuloplasty prevents right ventricular dilatation and progression of tricuspid regurgitation in patients with tricuspid annular dilatation undergoing mitral valve repair. J. Thorac. Cardiovas. Surg 141, 1431–1439. [DOI] [PubMed] [Google Scholar]
- Waller BF, Howard J, Fess S, 1994. Pathology of mitral valve stenosis and pure mitral regurgitation—Part I. Clin. Cardiol 17, 330–336. [DOI] [PubMed] [Google Scholar]
- Waller BF, Howard J, Fess S, 1995. Pathology of tricuspid valve stenosis and pure tricuspid regurgitation—part I. Clin. Cardiol 18, 97–102. [DOI] [PubMed] [Google Scholar]
- Woo SL-Y, Orlando CA, Camp JF, Akeson WH, 1986. Effects of postmortem storage by freezing on ligament tensile behavior. J. Biomech 19, 399–404. [DOI] [PubMed] [Google Scholar]
Associated Data
This section collects any data citations, data availability statements, or supplementary materials included in this article.
Supplementary Materials
Figure S1 – Mean ± SEM of membrane tension versus total tissue stretch results for the six MVAL tissue regions under loading protocol Tcirc,max:Trad,max = 0.75:1. The labels (a-f) correspond to the region label defined in Fig. 1c.
Figure S2 – Mean ± SEM of membrane tension versus total tissue stretch results for the six MVAL tissue regions under loading protocol Tcirc,max:Trad,max = 1:0.75. The labels (a-f) correspond to the region label defined in Fig. 1c.
Figure S3 – Mean ± SEM of membrane tension versus total tissue stretch results for the six MVAL tissue regions under loading protocol Tcirc,max:Trad,max = 0.5:1. The labels (a-f) correspond to the region label defined in Fig. 1c.
Figure S4 – Mean ± SEM of membrane tension versus total tissue stretch results for the six MVAL tissue regions under loading protocol Tcirc,max:Trad,max = 1:0.5. The labels (a-f) correspond to the region label defined in Fig. 1c.
Figure S5 – Mean ± SEM of membrane tension versus total tissue stretch results for the six TVAL tissue regions under loading protocol Tcirc,max:Trad,max = 0.75:1. The labels (a-f) correspond to the region label defined in Fig. 1c.
Figure S6 – Mean ± SEM of membrane tension versus total tissue stretch results for the six TVAL tissue regions under loading protocol Tcirc,max:Trad,max = 1:0.75. The labels (a-f) correspond to the region label defined in Fig. 1c.
Figure S7 – Mean ± SEM of membrane tension versus total tissue stretch results for the six TVAL tissue regions under loading protocol Tcirc,max:Trad,max = 0.5:1. The labels (a-f) correspond to the region label defined in Fig. 1c.
Figure S8 – Mean ± SEM of membrane tension versus total tissue stretch results for the six TVAL tissue regions under loading protocol Tcirc,max:Trad,max = 1:0.5. The labels (a-f) correspond to the region label defined in Fig. 1c.