Abstract
Valvular heart diseases are complex disorders, varying in pathophysiological mechanism and affected valve components. Understanding the effects of these diseases on valve functionality requires a thorough characterization of the mechanics and structure of the healthy heart valves. In this study, we performed biaxial mechanical experiments with extensive testing protocols to examine the mechanical behaviors of the mitral valve and tricuspid valve leaflets. We also investigated the effect of loading rate, testing temperatures, species (porcine versus ovine hearts), and age (juvenile vs adult ovine hearts) on the mechanical responses of the leaflet tissues. In addition, we evaluated the structure of chordae tendineae within each valve and performed histological analysis on each atrioventricular leaflet. We found all tissues displayed a characteristic nonlinear anisotropic mechanical response, with radial stretches on average 30.7% higher than circumferential stretches under equibiaxial physiological loading. Tissue mechanical responses showed consistent mechanical stiffening in response to increased loading rate and minor temperature dependence in all five atrioventricular heart valve leaflets. Moreover, our anatomical study revealed similar chordae quantities in the porcine mitral (30.5 ± 1.43 chords) and tricuspid valves (35.3 ± 2.45 chords), but significantly more chordae in the porcine than the ovine valves (p<0.010). Our histological analyses quantified the relative thicknesses of the four distinct morphological layers in each leaflet. This study provides a comprehensive database of the mechanics and structure of the atrioventricular valves, which will be beneficial to development of subject-specific atrioventricular valve constitutive models and toward multi-scale biomechanical investigations of heart valve function to improve valvular disease treatments.
Keywords: biaxial mechanical testing, the mitral and tricuspid valves, soft tissue biomechanics and microstructure, morphological analysis
1. Introduction
Efficient heart function relies on the proper mechanical behavior of the mitral and tricuspid valves. Aptly classified as the atrioventricular valves, the mitral and tricuspid valves are located between the atrium and the ventricle of the left heart and the right heart, respectively. These functionally-similar and morphologically-distinct valves are each enclosed by ring-like structures known as the valvular annuli and regulate blood flow between the heart chambers through the motion of membranous tissue known as leaflets. Two anatomically distinct leaflets comprise the mitral valve (MV), namely the anterior leaflet (MVAL) and posterior leaflet (MVPL), whereas the tricuspid valve (TV) is made up of three leaflets: the anterior leaflet (TVAL), posterior leaflet (TVPL), and septal leaflet (TVSL) (Fig. 1a). During systole of the cardiac cycle, these leaflets are closed by pressure gradients to enforce the unidirectional blood flow from the ventricles to the arteries. The leaflets are mechanically reinforced by a network of structurally robust tendons known as chordae tendineae. These chordae tendineae connect the valve leaflets to the papillary muscles of the ventricular wall to provide necessary supporting forces for the atrioventricular leaflets during cardiac function [1].
Figure 1 –
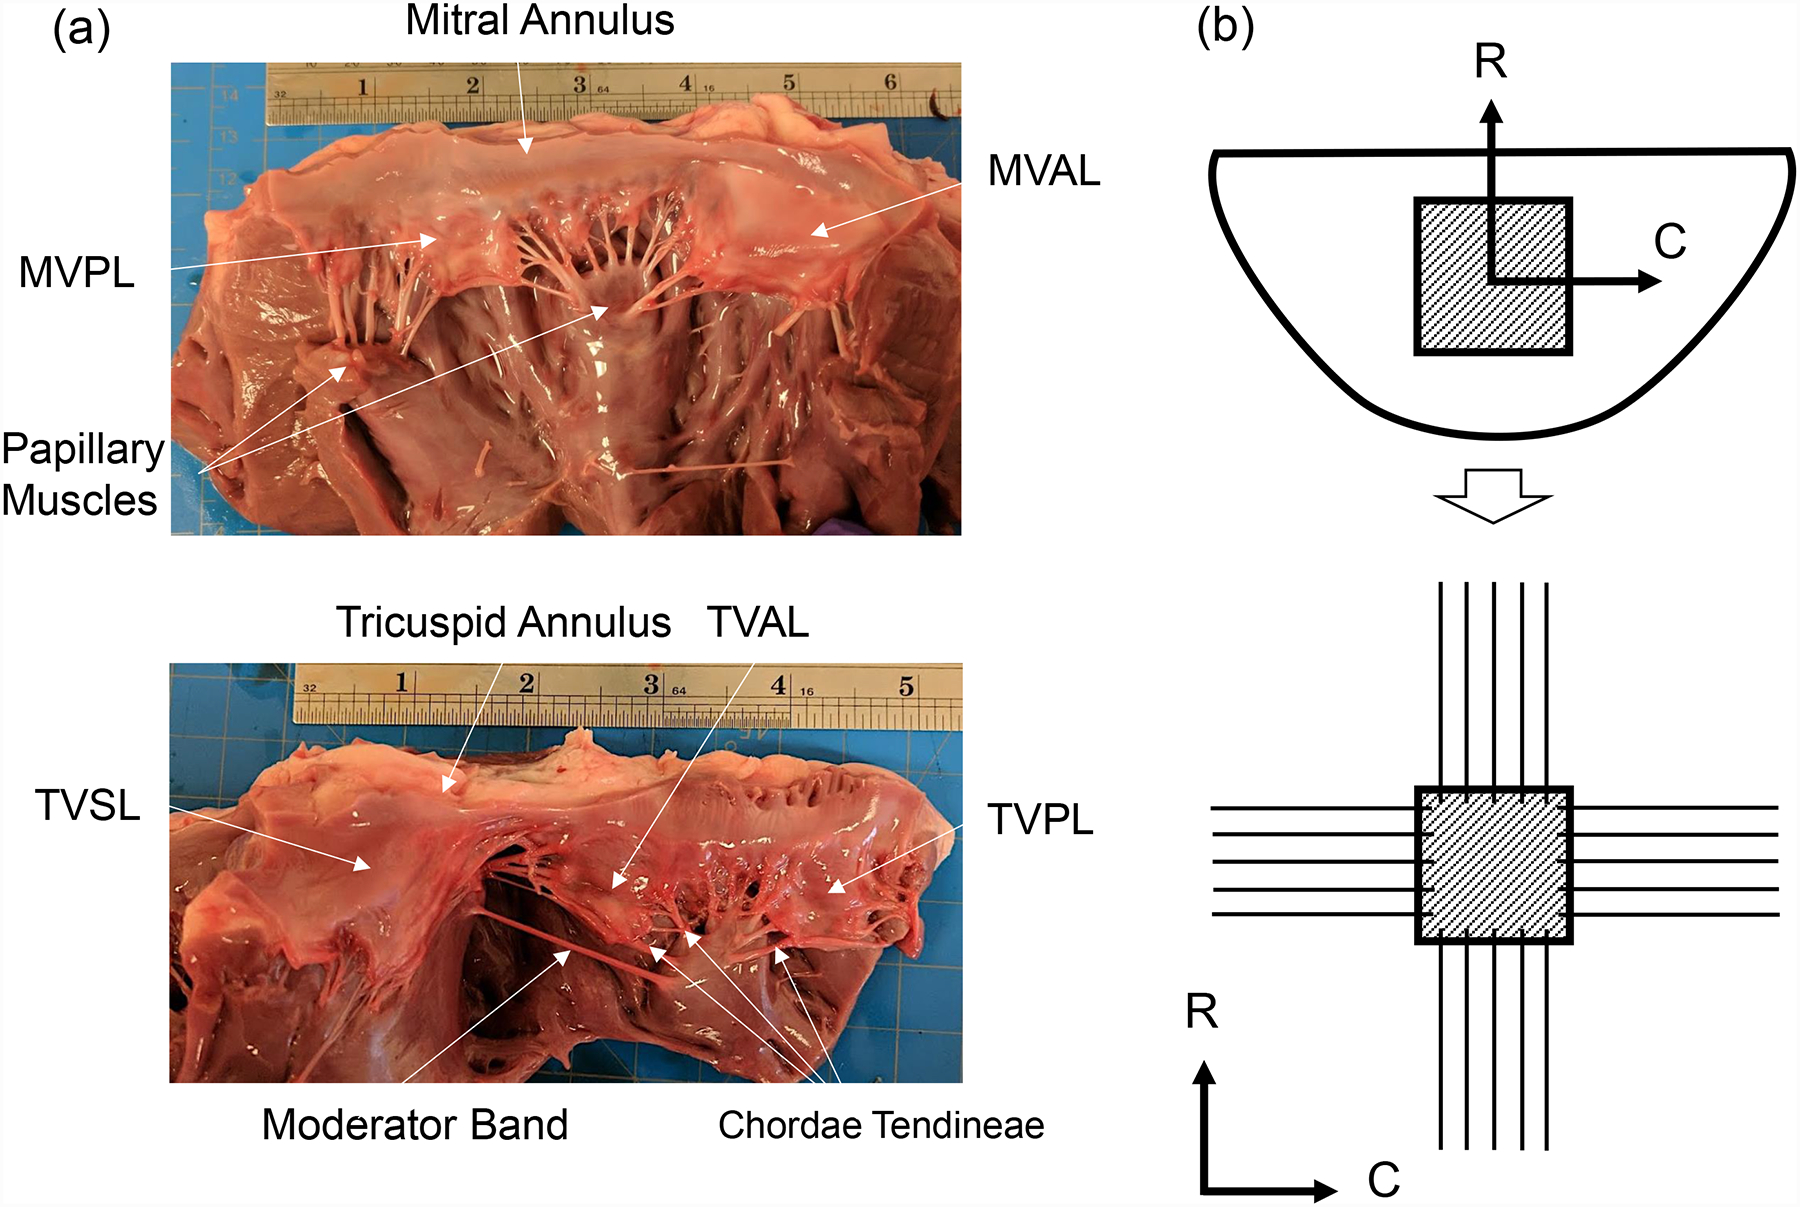
(a) A dissected porcine heart showing the mitral valve (top) and tricuspid valve (bottom), with labels describing key anatomical components: valve leaflets, annulus, papillary muscles, and chordae tendineae (ruler shows inches). (b) Schematic of the excised leaflet and the central bulk region (top), and the mounted tissue specimen with preferred collagen fiber orientation on the biaxial mechanical testing system (C: circumferential direct, R: radial direction).
In healthy individuals, blood circulates through the heart with minimal backflow (or regurgitation) via proper opening and closing of the atrioventricular valves. However, valvular heart diseases, such as valve leaflet stenosis, valve prolapse, chordae rupture, leaflet damage and/or congenital defects, can affect the overall function of the valve and eventually lead to significant regurgitation [2–5]. The regurgitation increases the strain on the heart and is a corollary and precedent to the development of other, more threatening, heart conditions. Various treatments have been developed for valve regurgitation, including traditional open-heart surgical repair via an annuloplasty ring, surgical valve replacement with a bio-prosthetic or mechanical valve, transcatheter-based valve replacement, or the novel transcatheter deployable mitral clip device [6–12]. Currently, numerous imaging techniques, such as cardiac magnetic resonance imaging (MRI), cardiac computed tomography (CT) and echocardiographic imaging, are employed to examine the degree of heart valve regurgitation and to select the proper treatment for regurgitated valves [13,14]. However, these clinical imaging modalities may be inadequate to characterize the severity of the valve regurgitation, especially to accurately determine relevant parameters, such as the volume of blood backflow and the orifice area [15]. Recently, significant efforts have been focused on the development of predictive computational modeling tools to provide objective recommendation for cardiologists and cardiac surgeons in the diagnosis of valvular regurgitation and in the improvement of patient-specific treatment. For example, high-fidelity models have been employed toward precision medicine by incorporating patient-specific valve geometries and essential microstructure information to simulate healthy and diseased heart valves [16–19]. These computational models can then be applied to predictions of various potential patient-specific treatment scenarios to examine the stresses, hemodynamics, and valve functional mechanics for the purpose of determining the optimal treatment solution [20–23].
In order to validate and accurately utilize these computational models in treatment selection, characterization of mechanical and anatomical data of heart valve leaflets is essential [24,25]. In soft tissue biomechanics, planar biaxial mechanical testing employing multiple loading ratios has been utilized to investigate the anisotropic material response of membrane-like connective tissue [26–31]. The observed anisotropic and nonlinear material response of many soft tissues, including heart valve leaflets, stems from microstructural collagen and elastin fiber networks with preferred orientations [32–35]. May-Newman et al. was the first to establish biaxial mechanical testing procedures for heart valve leaflets in her characterization of the material properties of the porcine MVAL and MVPL [36]. Further biaxial testing examined the mechanical dependence of the MVAL on the loading rate [37,38]. A similar study was conducted to examine stress relaxation of the tissue mechanical response, and minor hysteresis was found in the MVAL independent of the loading rate applied [28]. More recently, biaxial mechanical evaluation was used to characterize the leaflet-specific anisotropic nonlinear response of porcine tricuspid valve leaflets [35].
Despite the prior studies on heart valve leaflet biomechanical responses, biaxial testing results can vary significantly based on specific experimental procedures [39]. Therefore, it would be useful to compare leaflet material properties from both mitral and tricuspid valves tested from the same heart under a unified mechanical quantification procedure. Moreover, the relationship between mechanics of the mitral and tricuspid valves is important toward understanding the link between mitral valve surgical intervention and the development of functional tricuspid regurgitation (FTR) which has been observed in clinical studies [40–42].
Hence, the goal of this work is to utilize biaxial testing experiments to compare the unique material response of each mitral and tricuspid valve leaflet. Porcine atrioventricular leaflets were tested at various temperature levels and loading rates to characterize the dependence of tissue response on these selected experimental parameters. In addition, the stretch responses of leaflets from juvenile ovine and adult ovine hearts were characterized and compared to understand the effects of species and animal age on testing results. Lastly, an anatomical study was conducted to examine chordae distributions in porcine and ovine valves, and histological methods were employed to study and examine the layered microstructure of the porcine atrioventricular valve leaflets.
2. Methods
2.1. Tissue acquisition
To characterize the material properties of porcine atrioventricular heart valve leaflets, porcine heart tissues from physically healthy pigs (80–140 kg, 1–1.5 years of age) were acquired from a local USDA approved abattoir (Country Home Meat Company, Edmond, OK). To further compare the leaflet mechanical behaviors between different species and ages, we acquired adult ovine hearts (65–90 kg, 2–5 years of age) and juvenile ovine hearts (35–60 kg, 6–12 months of age) from Chickasha Meat Company (Chickasha, OK). The fresh heart tissues were frozen within 12 hours post-mortem in a standard freezer at −14°C for storage purposes. This tissue storage procedure was based on the previous studies which found that freezing has a minimal impact on the mechanics of collagenous tissues [43–45]. In preparation for testing, the hearts were thawed and leaflets from both the mitral and tricuspid valves were dissected (Fig. 1a). The excised leaflets were preserved in phosphate buffered saline (PBS) and refrigerated at 4°C to maintain material properties until testing [46].
2.2. Tissue preparation
For biaxial mechanical testing, a square specimen (8mm × 8mm) was dissected from the central region (called the clear zone) of each valve leaflet. The thickness of the specimen was measured at 3 different locations using digital calipers (WestWard Company, Lake Forest, IL) to determine an average tissue thickness. The tissue specimen was then mounted on a commercial biaxial mechanical testing system (Fig. 2a)—BioTester (CellScale, Waterloo, ON, Canada) with a load cell capacity of 1,500 mN, by using 4 BioRakes to create a 6.5mm × 6.5mm effective testing region (Fig. 2b). The primary axes of the testing system were aligned with the circumferential and radial directions of the tissue (Fig.1b). Four glass beads (with diameters of 300–500 μm) were attached to the specimen in a square configuration (Fig. 2c) for measuring the in-plane deformation and strain using a non-contact image-based technique as described in Section 2.4. To ensure the tissue remained hydrated, the specimen was submerged in a heated bath of PBS solution for the duration of each biaxial test.
Figure 2 –
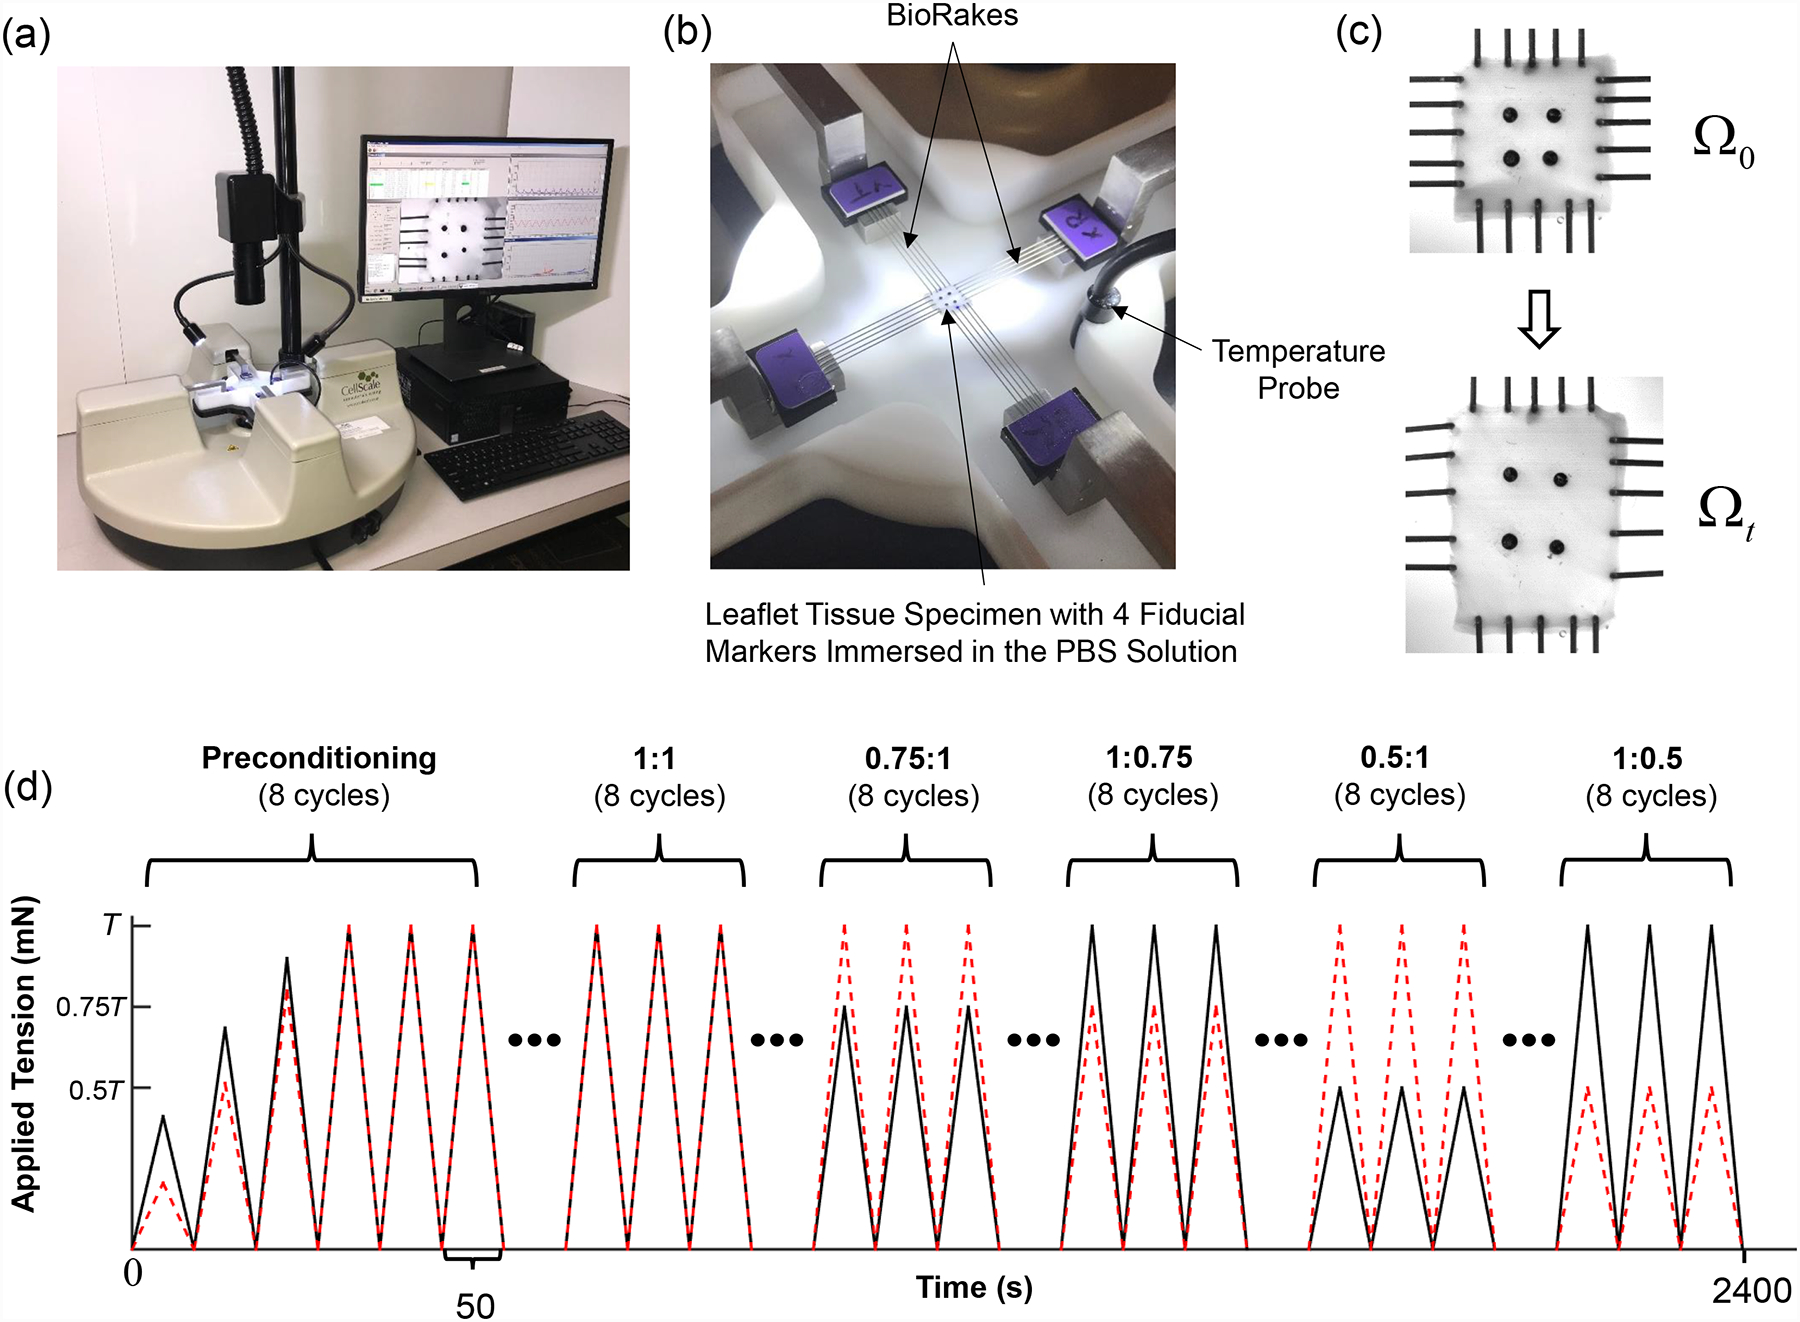
(a) Image of the biaxial mechanical testing system (BioTester), (b) image of the mounted tissue, with labelled components of the testing system, (c) schematics of the valve leaflet specimen before and after prescribed loading, and (d) illustration of the force-controlled protocols (with a loading rate of 4.42 N/min) employed in both the baseline and temperature-controlled tests (T: maximum applied load, black solid line: tension in the circumferential direction, and red dashed line: tension in the radial direction).
2.3. Biaxial mechanical testing protocols
Comprehensive characterization of the mechanical behaviors of both atrioventricular valve leaflet tissues was then conducted, which included investigations of the material anisotropy, loading rate effect, temperature effect, and the differences within and across species. In brief, we performed force-controlled biaxial mechanical testing on four experimental groups: (i) the baseline testing group (porcine tissues) with a loading rate of 4.42 N/min at room temperature (22°C), (ii) the loading rate effect group (porcine tissues) with three loading rates of 2.29 N/min, 4.42 N/min, and 7.92 N/m at room temperature (22°C), (iii) the temperature effect group (porcine tissues) with a loading rate of 4.42 N/min at three temperature levels (27°C, 32°C and 37°C), and (iv) the species and age group (porcine, adult ovine, and juvenile ovine tissues) with a loading rate of 4.42 N/min at the physiological temperature (37°C). The sample size for each of these groups was n=6 for each mitral and tricuspid valve leaflet, i.e., MVAL, MVPL, TVAL, TVPL, and TVSL.
For each biaxial mechanical test, the physiological stress levels of the MV and TV leaflets were estimated to be 240 kPa and 115 kPa, respectively, based on the Laplace’s law for a spherical surface assuming the mean radius of curvature of the coapted MV and TV to be 2 cm [35] and the transvalvular pressure gradients to be 100 mmHg [47] and 40 mmHg [35], respectively. Then, the applied membrane tensions in both the circumferential and radial directions, i.e., TC,max and TR,max, were calculated based on the specimen size and the measured thickness of the leaflet tissue.
Each test began with a preconditioning protocol, during which estimated membrane tensions TC,max and TR,max were applied for 8 repeated loading-unloading cycles (Fig. 2d), considering a preload of 1% of TC,max and TR,max, to restore the dissected tissue to its respective in vivo functional configuration [48,49]. Then, biaxial testing protocols with various loading ratios (TC,max:TR,max = 1:1, 0.75:1, 1:0.75, 0.5:1, and 1:0.5) were conducted (Fig. 2d). In addition to the monitored forces and Biorake separation distance in both directions, a series of 1280×960 images were collected by a high-resolution CCD camera (The Imaging Source LLC, Charlotte, NC) at a rate of 15 Hz. These images were then used in the non-contact in-plane strain calculations as described in the next section.
2.4. Tissue strain and stress calculations
Digital image correlation (DIC) based techniques have been widely utilized in the biomechanics society to track the deformations of a tissue specimen. To avoid the Saint-Venant effects on tissue deformations during our biaxial mechanical testing [50], four fiducial markers (glass beads) were placed in the central delimited region (3mm × 3mm) of the valve leaflet specimen (Fig. 2c). A series of images of the tissue specimen were collected by the high-resolution CCD camera and the time-dependent positions of the four fiducial markers were analyzed based on the acquired images using the DIC-based technique in the LabJoy software of the BioTester system:
| (1) |
where XI’s and xI’s are the marker positions at the undeformed (reference) configuration (Ω0) and at the deformed configuration (Ωt), respectively, and dI’s are the displacement vectors of the fiducial markers, i.e., dI = [uI(t), vI(t)]T.
To compute the in-plane strain of the tissue specimen, a four-node bilinear finite element was used based on the 4 markers, and the deformation gradient tensor F was determined using an in-house MATLAB program (R2016a, The MathWorks, Natick, MA) based on the strain-calculation technique developed previously [31,33]:
| (2) |
where BxI’s and ByI’s are the shape function derivatives associated with node I with respect to the x and y coordinates, respectively. Note the x-y coordinates were aligned with the tissue’s circumferential and radial directions, respectively (Figs. 1b & 2b). The right Cauchy-Green deformation tensor C and the Green strain tensor E can then be computed by
| (3) |
where I is the 2nd-order identity tensor. The circumferential and radial stretches, λC and λR, were determined by the square roots of the principal values of C. Next, the first Piola-Kirchhoff (1st-PK) stress tensor P was computed from the applied membrane tensions, TC and TR, as follows:
| (4) |
Here, L is the valve leaflet specimen edge length, and t is the tissue thickness.
2.5. Quantification of anatomical structure of valve apparatus
To complement the mechanical response data from biaxial mechanical testing, we further investigated the anatomical and structural features of both the porcine and ovine atrioventricular heart valves (n=6). Briefly, we measured the number of chordae and each chord’s length and classified the chordae according to their respective supporting leaflet. Adopting the chordae classification convention by Toma et al. [51], tertiary chordae were not measured, and no distinction was made between primary and secondary chordae in our measurements. The length of the chord was measured from proximal attachment at the papillary muscles to distal attachment at the inferior surface of the leaflets. We also measured each leaflet’s thickness in 3 separate locations using digital calipers with a resolution of 0.01 mm.
2.6. Histological analysis
To examine the microstructural organization of the extracellular matrix (ECM) components in the valve leaflets, specimens from all five atrioventricular valve leaflets were fixed in 10% formalin at room temperature. These tissue specimens were then dehydrated in graded solutions of alcohol and embedded in paraffin. Sections of 5–7 μm thickness were sectioned and stained with Masson’s trichrome stain. For the morphological characterization, all stained sections were examined with a halogen illumination microscope (AmScope, Irvine, CA) at a magnification of 2X. Images of leaflets were captured using a 10 Mega Pixel camera and analyzed with ImageJ software (National Institute of Health, Bethesda, MD). A single image of each valve leaflet was captured from the stained sections and thickness was measured at three random locations in the collected image. Further, the color deconvolution and image threshold plugins in ImageJ [52] were used to quantify the collagen content in each leaflet specimen.
2.7. Statistical analysis
To focus our statistical analyses of biaxial mechanical testing results on relevant relationships, we chose to analyze only the circumferential and radial stretch values at the peak stress from the equibiaxial tension protocol. These circumferential and radial peak stretches (and ) were analyzed using a one-way Analysis of Variance (ANOVA). This method was also utilized to examine differences between mechanical responses of valve leaflets (MVAL, MVPL, TVAL, TVPL, and TVSL) from our baseline testing group.
Previous studies have demonstrated a difference between the stretch responses due to the preconditioning effect and the applied loading to the tissue [53]. Thus, we decomposed the peak stretches (and ) into two components: (i) the preconditioning stretches ( and ), defined as the tissue stretch from the mounting configuration to the post-preconditioning state, and (ii) the mechanical stretches ( and ), defined as the tissue stretch from the post-preconditioning configuration to the peak loading state. We compared these stretch measures using the ANOVA approach described previously to isolate the effects of the loading rate, temperature, and species on the atrioventricular valve leaflet’s mechanical response.
In the anatomical study, leaflet thicknesses, chordae lengths, and chordae quantities were all compared using the standard one-way ANOVA method.
All statistical analyses were performed with MATLAB, considering a p-value < 0.05 as statistically significant and a p-value < 0.10 as nearly statistically significant.
3. Results
3.1. Baseline testing
Results for the MV and TV leaflets for loading protocols (TC,max:TR,max =1:1, 0.5:1, and 1:0.5) are presented in Figures 3–4, respectively. Tables 1–3 provide the mean ± standard error of the mean (SEM) of the stretches for the MV and TV leaflets at specified stress values for loading protocols TC,max:TR,max = 1:1, 0.5:1, 1:0.5, respectively. Similarly, we report the results associated with the intermediate loading protocols (TC,max:TR,max = 0.75:1 and 1:0.75) in the Appendix (Figs. A1–A2). Datasets of each of the atrioventricular heart valve leaflets under all 5 biaxial loading protocols are provided in an accompanying article in the Data in Brief Journal [54].
Figure 3 –
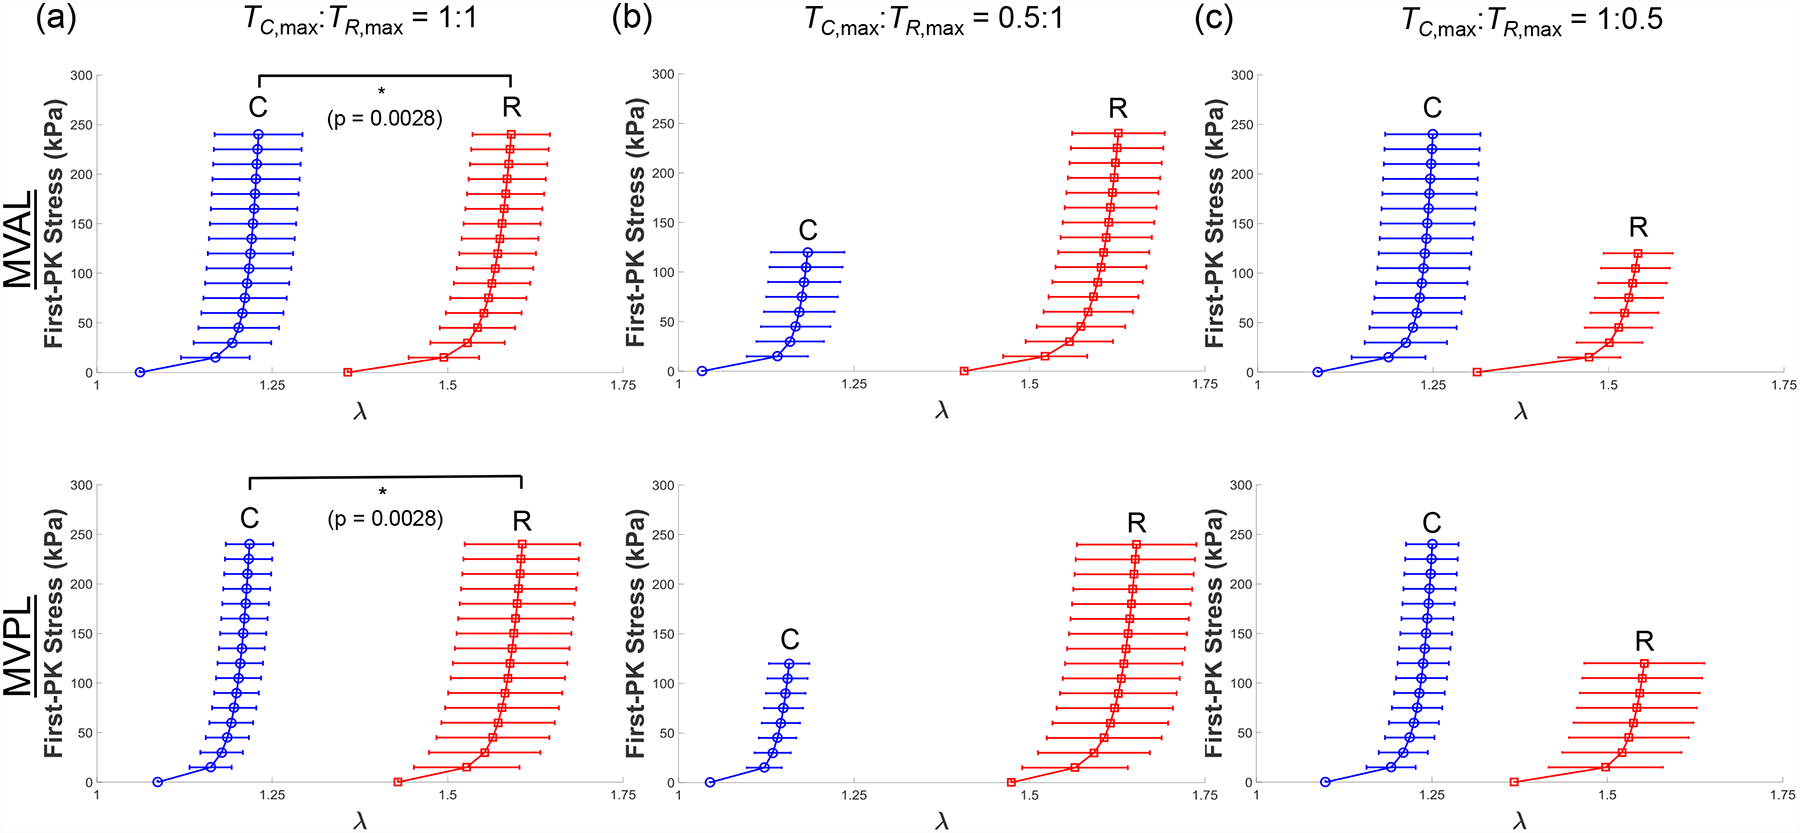
Mean ± SEM of the 1st-PK stress versus stretch results of the porcine MVAL and MVPL tissues (n=6) under various biaxial loading protocols at room temperature (22°C): (a) equibiaxial tension (TC,max:TR,max = 1:1), (b) TC,max:TR,max = 0.5:1, and (c) TC,max:TR,max = 1:0.5.
Figure 4 –
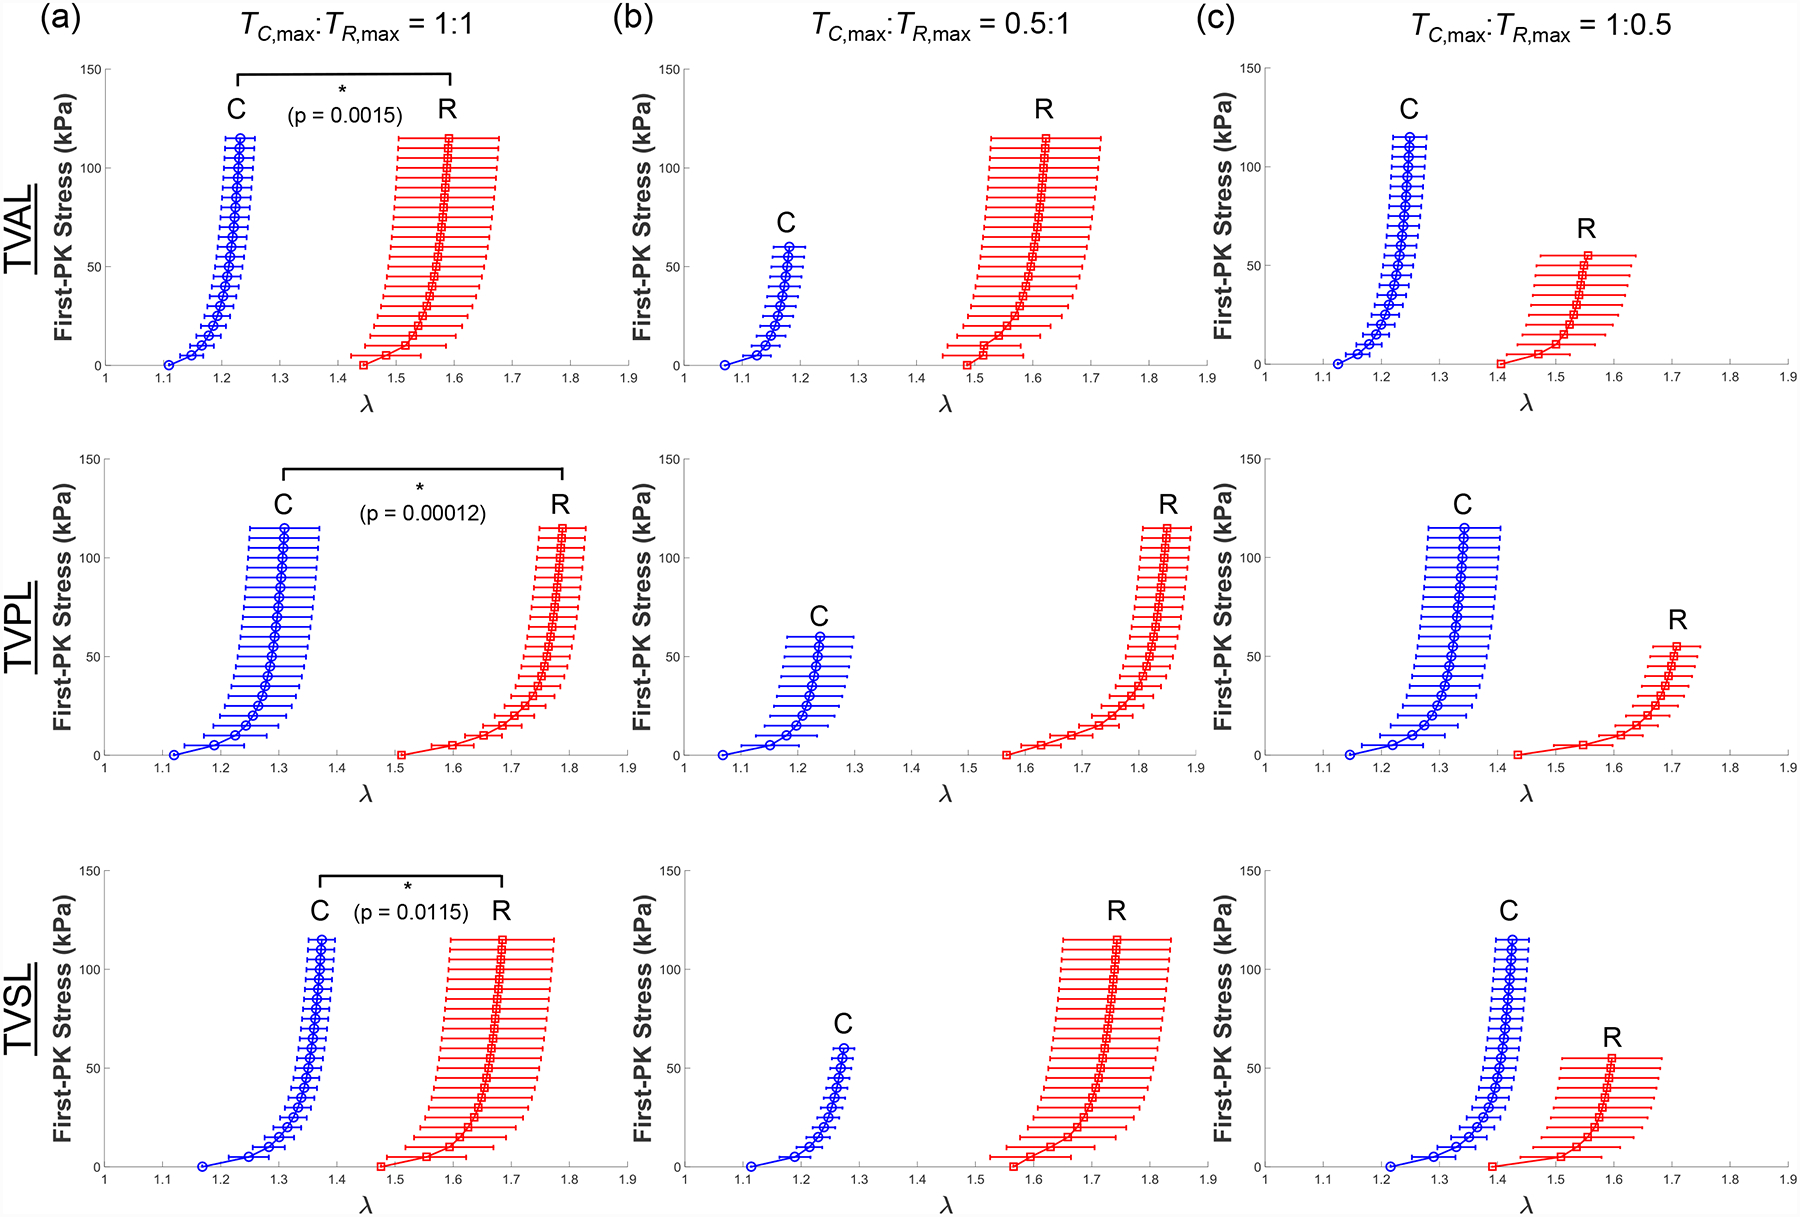
Mean ± SEM of the 1st-PK stress versus stretch results of the porcine TVAL, TVPL, and TVSL tissues (n=6) under various biaxial loading protocols at room temperature (22°C): (a) equibiaxial tension (TC,max:TR,max = 1:1), (b) TC,max:TR,max = 0.5:1, and (c) TC,max:TR,max = 1:0.5.
Table 1 –
Circumferential and radial stretches of porcine atrioventricular heart valves (n=6) at selected stress levels (% of maximum 1st-PK stress) under equibiaxial (1:1) tension protocol (Fig. 3a and 4a). Values are presented as mean ± SEM.
| % of P11,max | λ | MVAL | MVPL | TVAL | TVPL | TVSL |
|---|---|---|---|---|---|---|
| 0% | 1.061 ± 0.049 | 1.087 ± 0.032 | 1.089 ± 0.023 | 1.120 ± 0.041 | 1.168 ± 0.035 | |
| 1.358 ± 0.042 | 1.429 ± 0.069 | 1.434 ± 0.050 | 1.511 ± 0.035 | 1.476 ± 0.066 | ||
| 25% | 1.207 ± 0.058 | 1.192 ± 0.031 | 1.172 ± 0.026 | 1.270 ± 0.058 | 1.331 ± 0.023 | |
| 1.551 ± 0.054 | 1.572 ± 0.081 | 1.569 ± 0.072 | 1.735 ± 0.037 | 1.641 ± 0.035 | ||
| 50% | 1.219 ± 0.061 | 1.204 ± 0.032 | 1.194 ± 0.026 | 1.292 ± 0.059 | 1.355 ± 0.023 | |
| 1.572 ± 0.055 | 1.589 ± 0.082 | 1.624 ± 0.084 | 1.766 ± 0.040 | 1.664 ± 0.088 | ||
| 75% | 1.225 ± 0.062 | 1.212 ± 0.034 | 1.204 ± 0.026 | 1.303 ± 0.060 | 1.367 ± 0.023 | |
| 1.583 ± 0.055 | 1.599 ± 0.082 | 1.640 ± 0.087 | 1.780 ± 0.040 | 1.676 ± 0.089 | ||
| 100% | 1.231 ± 0.063 | 1.217 ± 0.034 | 1.210 ± 0.027 | 1.310 ± 0.060 | 1.374 ± 0.023 | |
| 1.591 ± 0.055 | 1.606 ± 0.082 | 1.651 ± 0.089 | 1.788 ± 0.040 | 1.685 ± 0.089 |
Table 3 –
Circumferential and radial stretches of porcine atrioventricular heart valves (n=6) at selected stress levels (% of maximum 1st-PK stress in the circumferential direction) under 1:0.5 tension protocol (Figs. 3c and 4c). Values are presented as mean ± SEM.
| % of P11,max | λ | MVAL | MVPL | TVAL | TVPL | TVSL |
|---|---|---|---|---|---|---|
| 0% | 1.085 ± 0.035 | 1.099 ± 0.039 | 1.110 ± 0.023 | 1.146 ± 0.043 | 1.216 ± 0.037 | |
| 1.313 ± 0.036 | 1.367 ± 0.075 | 1.377 ± 0.049 | 1.435 ± 0.044 | 1.391 ± 0.070 | ||
| 25% | 1.226 ± 0.063 | 1.224 ± 0.036 | 1.187 ± 0.029 | 1.302 ± 0.060 | 1.382 ± 0.029 | |
| 1.502 ± 0.047 | 1.520 ± 0.085 | 1.488 ± 0.063 | 1.643 ± 0.038 | 1.552 ± 0.078 | ||
| 50% | 1.239 ± 0.066 | 1.237 ± 0.036 | 1.206 ± 0.031 | 1.325 ± 0.061 | 1.407 ± 0.028 | |
| 1.523 ± 0.048 | 1.537 ± 0.085 | 1.503 ± 0.069 | 1.679 ± 0.040 | 1.579 ± 0.084 | ||
| 75% | 1.245 ± 0.067 | 1.245 ± 0.037 | 1.214 ± 0.032 | 1.336 ± 0.062 | 1.419 ± 0.028 | |
| 1.533 ± 0.049 | 1.546 ± 0.085 | 1.512 ± 0.071 | 1.697 ± 0.040 | 1.591 ± 0.085 | ||
| 100% | 1.249 ± 0.068 | 1.251 ± 0.038 | 1.221 ± 0.033 | 1.343 ± 0.062 | 1.426 ± 0.029 | |
| 1.542 ± 0.049 | 1.553 ± 0.086 | 1.516 ± 0.072 | 1.708 ± 0.040 | 1.598 ± 0.086 |
Through the statistical analysis, we found both the MV and TV leaflets exhibited anisotropic material behavior with the peak stretches smaller in the circumferential direction than the radial direction (p < 0.012 for all leaflets, Figs. 3a & 4a). Our results also revealed statistically significant differences in the mechanical responses of the atrioventricular heart valve leaflets. Specifically, the MVPL and TVAL were stiffer in the circumferential direction than the TVSL (p=0.050), and the TVPL was more compliant in the radial direction than the MVAL (p=0.024).
3.2. Loading rate effect
We present representative results of our loading rate effect group from the equibiaxial loading protocol (TC,max:TR,max = 1:1) for all mitral and tricuspid valve leaflets in Fig. 5. Representative results from the same group under loading protocols TC,max:TR,max = 0.5:1 and 1:0.5 are reported in the Appendix (Figs. A3–A4). Statistical analysis results of the circumferential and radial stretches of the MVAL are presented in Figure 6 and Table 4. The MVAL was selected as a representative leaflet owing to its similarity to the other leaflets’ trends. We have included the statistical analysis results for all other leaflets (MVPL, TVAL, TVPL, and TVSL) in the Supplementary Material (Figs. S1–S4 and Tables S1–S4).
Figure 5 –
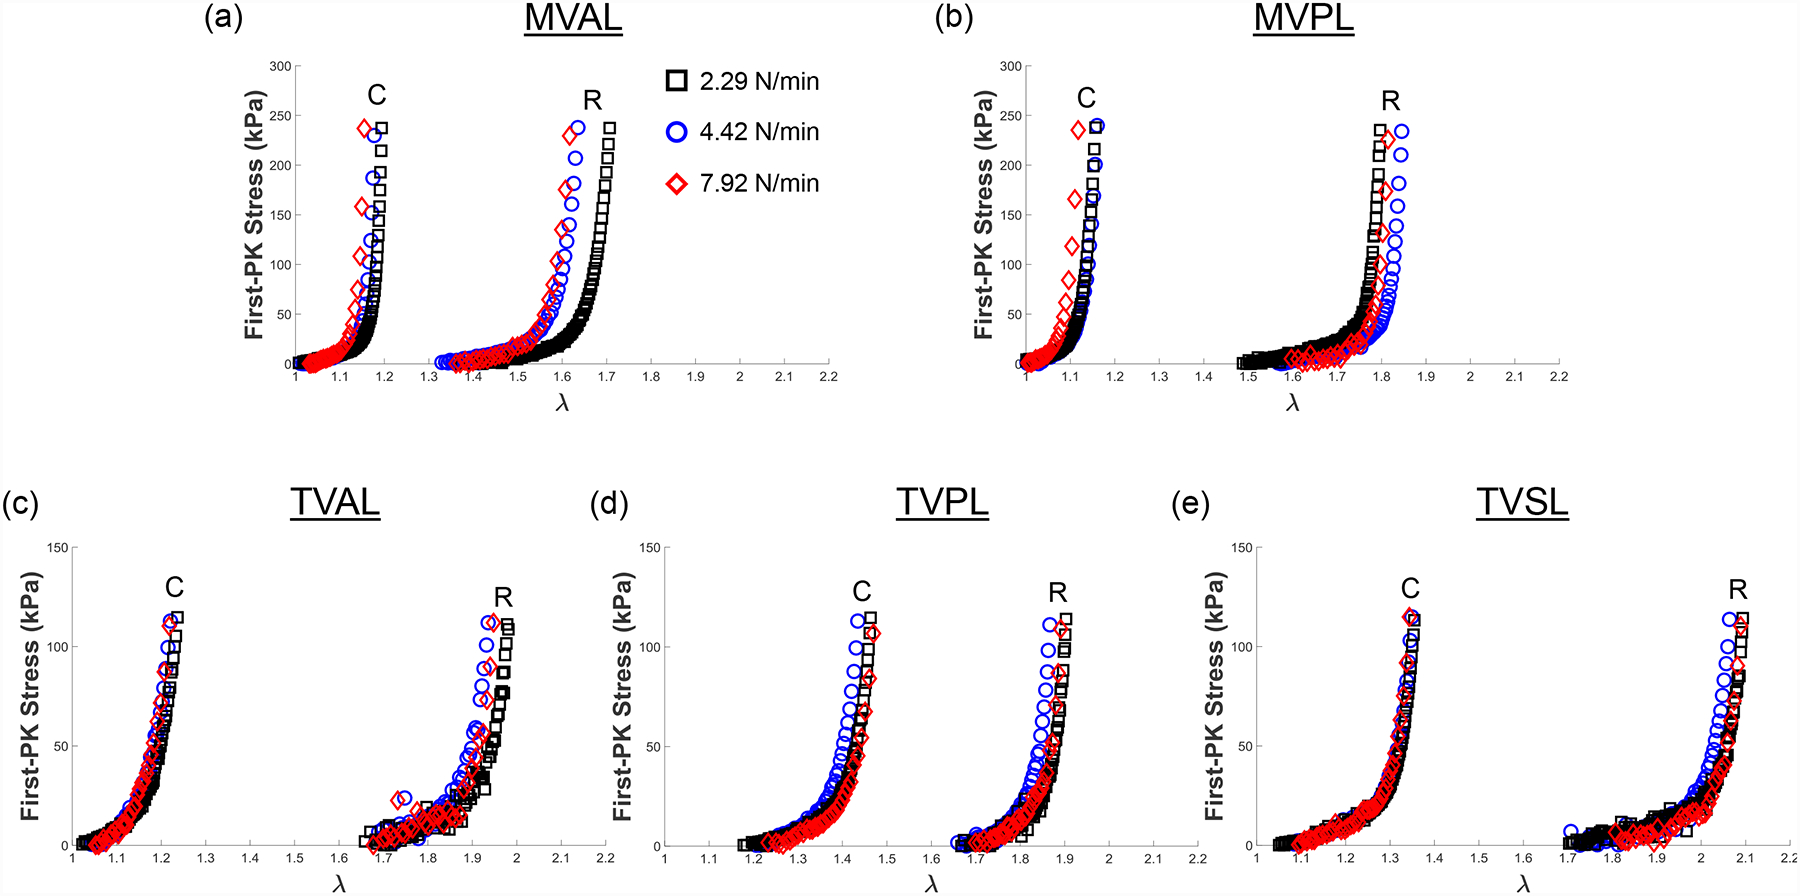
Representative biaxial mechanical testing results of each porcine atrioventricular leaflet under equibiaxial tension (TC,max:TR,max = 1:1) at room temperature (22°C), showing the effect of varied loading rates on the quantified 1st-PK stress versus stretch results: (a) MVAL, (b) MVPL, (c) TVAL, (d) TVPL, and (e) TVSL.
Figure 6 –
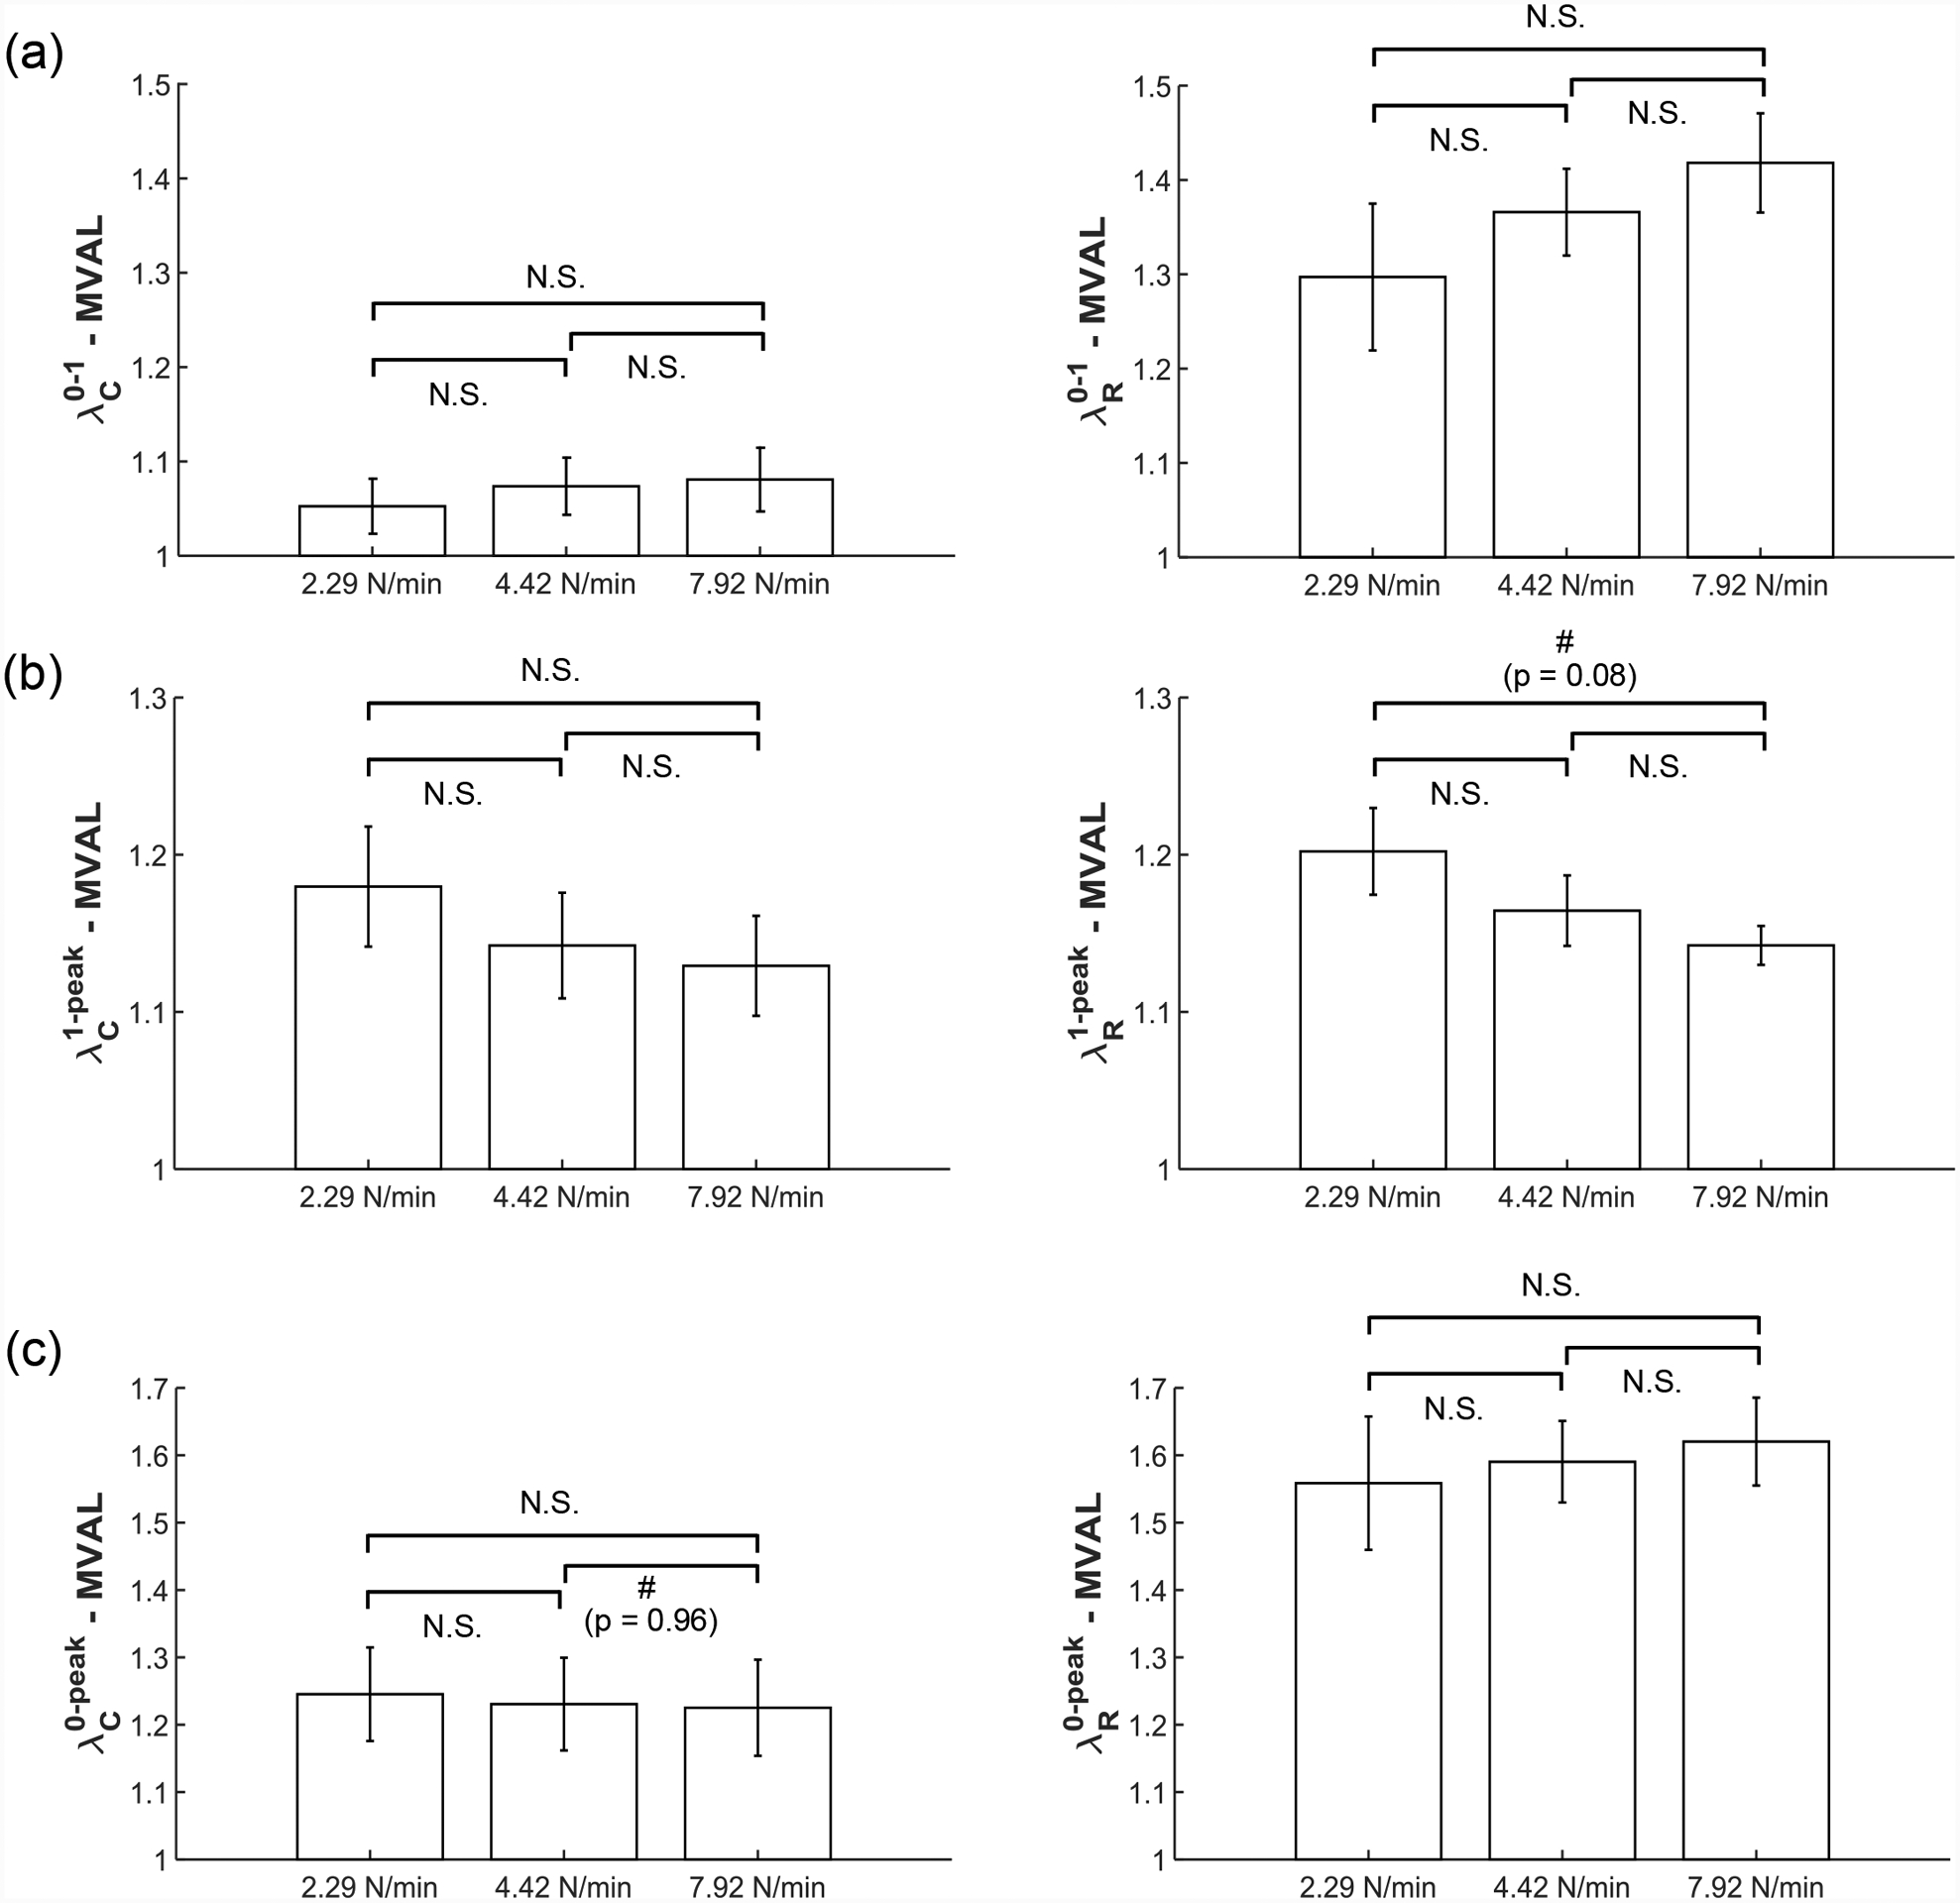
Statistical analyses of the MVAL from the loading rate effect group (n=6), with plots showing trends in (a) preconditioning stretches, (b) mechanical stretches, and (c) peak stretches. All bars show mean ± SEM. (N.S.: no statistically significant difference, p>0.10, and #: nearly statistically significant difference, p<0.10)
Table 4 –
Statistical analysis of the loading rate effect on the preconditioning stretches ( and ), mechanical stretches ( and ), and peak stretches (and ) of the MVAL (n=6). All quantities are presented as mean ± SEM.
| Circ. | 2.29 N/min | 4.42 N/min | 7.92 N/min | p value (2.29–4.42) |
p value (4.42–7.92) |
p value (2.29–7.92) |
|---|---|---|---|---|---|---|
| 1.053 ± 0.029 | 1.074 ± 0.030 | 1.081 ± 0.034 | 0.624 | 0.879 | 0.539 | |
| 1.180 ± 0.038 | 1.142 ± 0.034 | 1.129 ± 0.032 | 0.479 | 0.785 | 0.334 | |
| 1.245 ± 0.069 | 1.231 ± 0.069 | 1.225 ± 0.071 | 0.884 | 0.956 | 0.844 | |
| Rad. | 2.29 N/min | 4.42 N/min | 7.92 N/min | p value (2.29–4.42) |
p value (4.42–7.92) |
p value (2.29–7.92) |
| 1.297 ± 0.078 | 1.366 ± 0.046 | 1.418 ± 0.053 | 0.464 | 0.472 | 0.227 | |
| 1.202 ± 0.028 | 1.164 ± 0.022 | 1.142 ± 0.012 | 0.315 | 0.408 | 0.077 | |
| 1.559 ± 0.099 | 1.590 ± 0.061 | 1.620 ± 0.065 | 0.789 | 0.744 | 0.614 |
Three observations could be drawn from the statistical analysis results: (1) the preconditioning stretches ( and ) increase as the loading rate increases in both the circumferential and radial directions (Fig. 6a); (2) the mechanical stretches ( and ) decrease as the loading rate increases in both directions (Fig. 6b); (3) as the loading rate increases, the peak stretch in the circumferential direction decreases while the peak stretch (and ) in the radial direction increases (Fig. 6c). These observed trends were not statistically significant but were generally consistent across MV and TV leaflets (Figs. S1–S4 and Tables S1–S4).
3.3. Temperature effect
To show the mechanical response of the leaflet to varied temperature levels, we presented representative results under equibiaxial tension for all the mitral and tricuspid valve leaflets in Figure 7. Similarly, the representative results associated with other loading protocols (TC,max:TR,max = 0.5:1 and 1:0.5) are provided in the Appendix (Figs. A5–A6). We found from our statistical analyses that the MVAL is typical of other atrioventricular leaflets (Fig. 8 and Table 5), whereas the statistical analysis results of the MVPL, TVAL, TVPL, and TVSL are provided in the Supplementary Material (Figs. S5–S8 and Tables S5–S8).
Figure 7 –
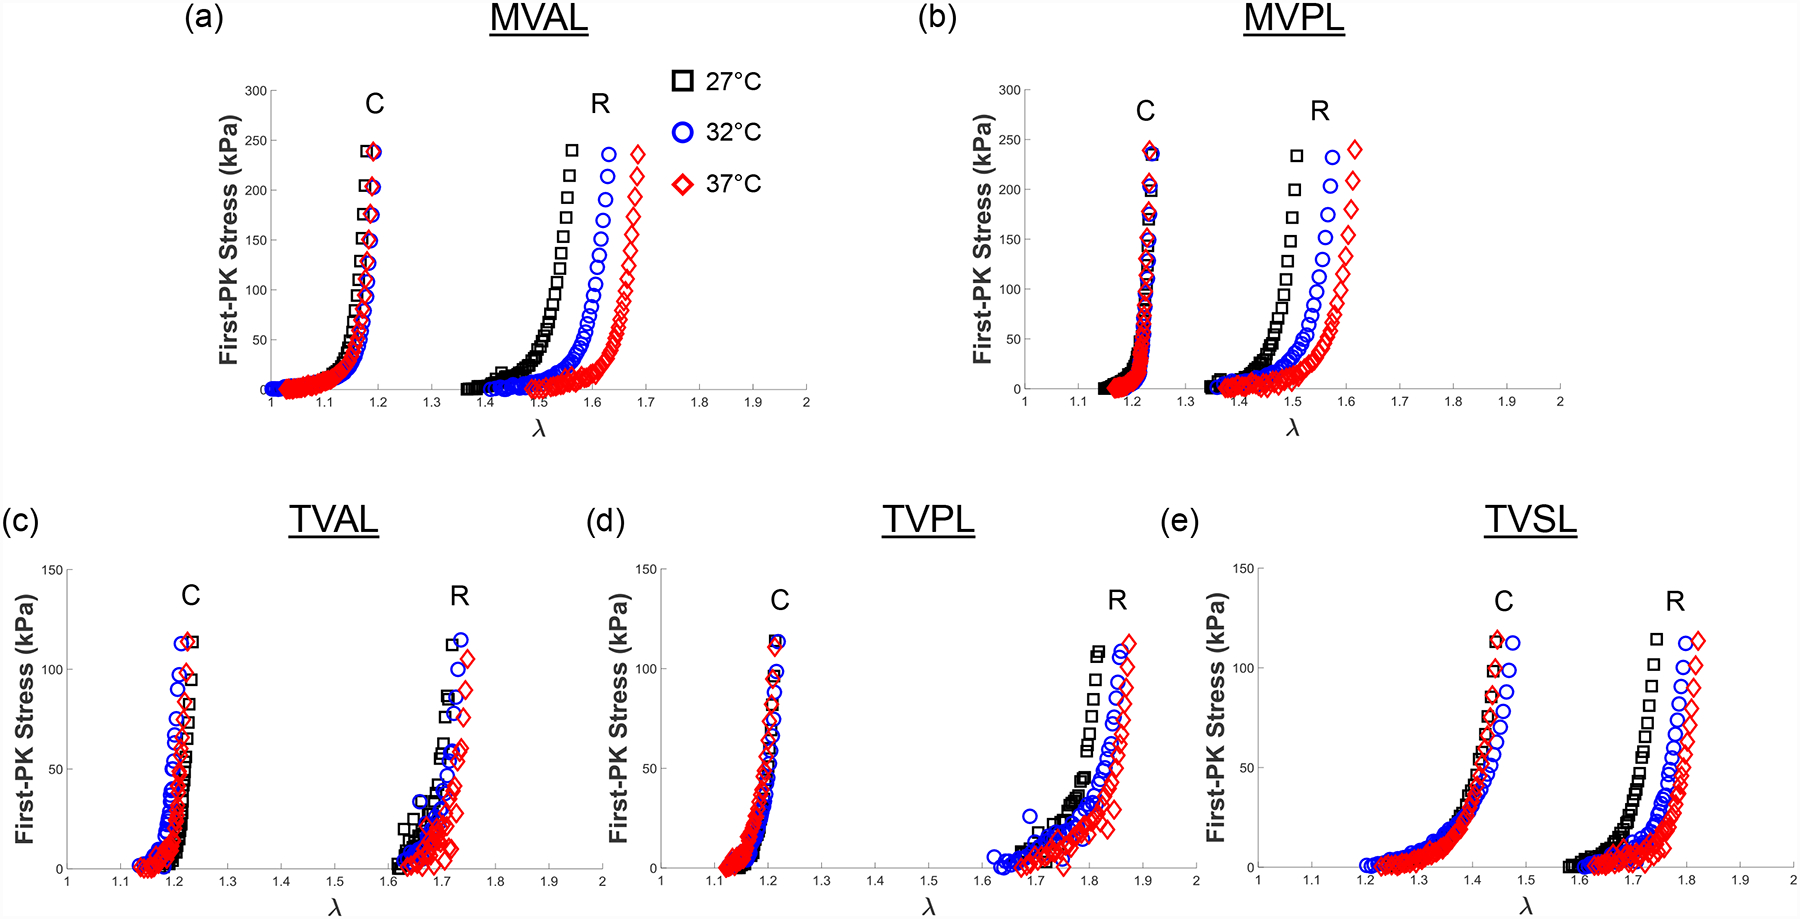
Representative biaxial mechanical testing results of each porcine atrioventricular leaflet under equibiaxial tension (TC,max:TR,max = 1:1), showing the effect of temperature on the quantified 1st-PK stress versus stretch results: (a) MVAL, (b) MVPL, (c) TVAL, (d) TVPL, and (e) TVSL.
Figure 8 –
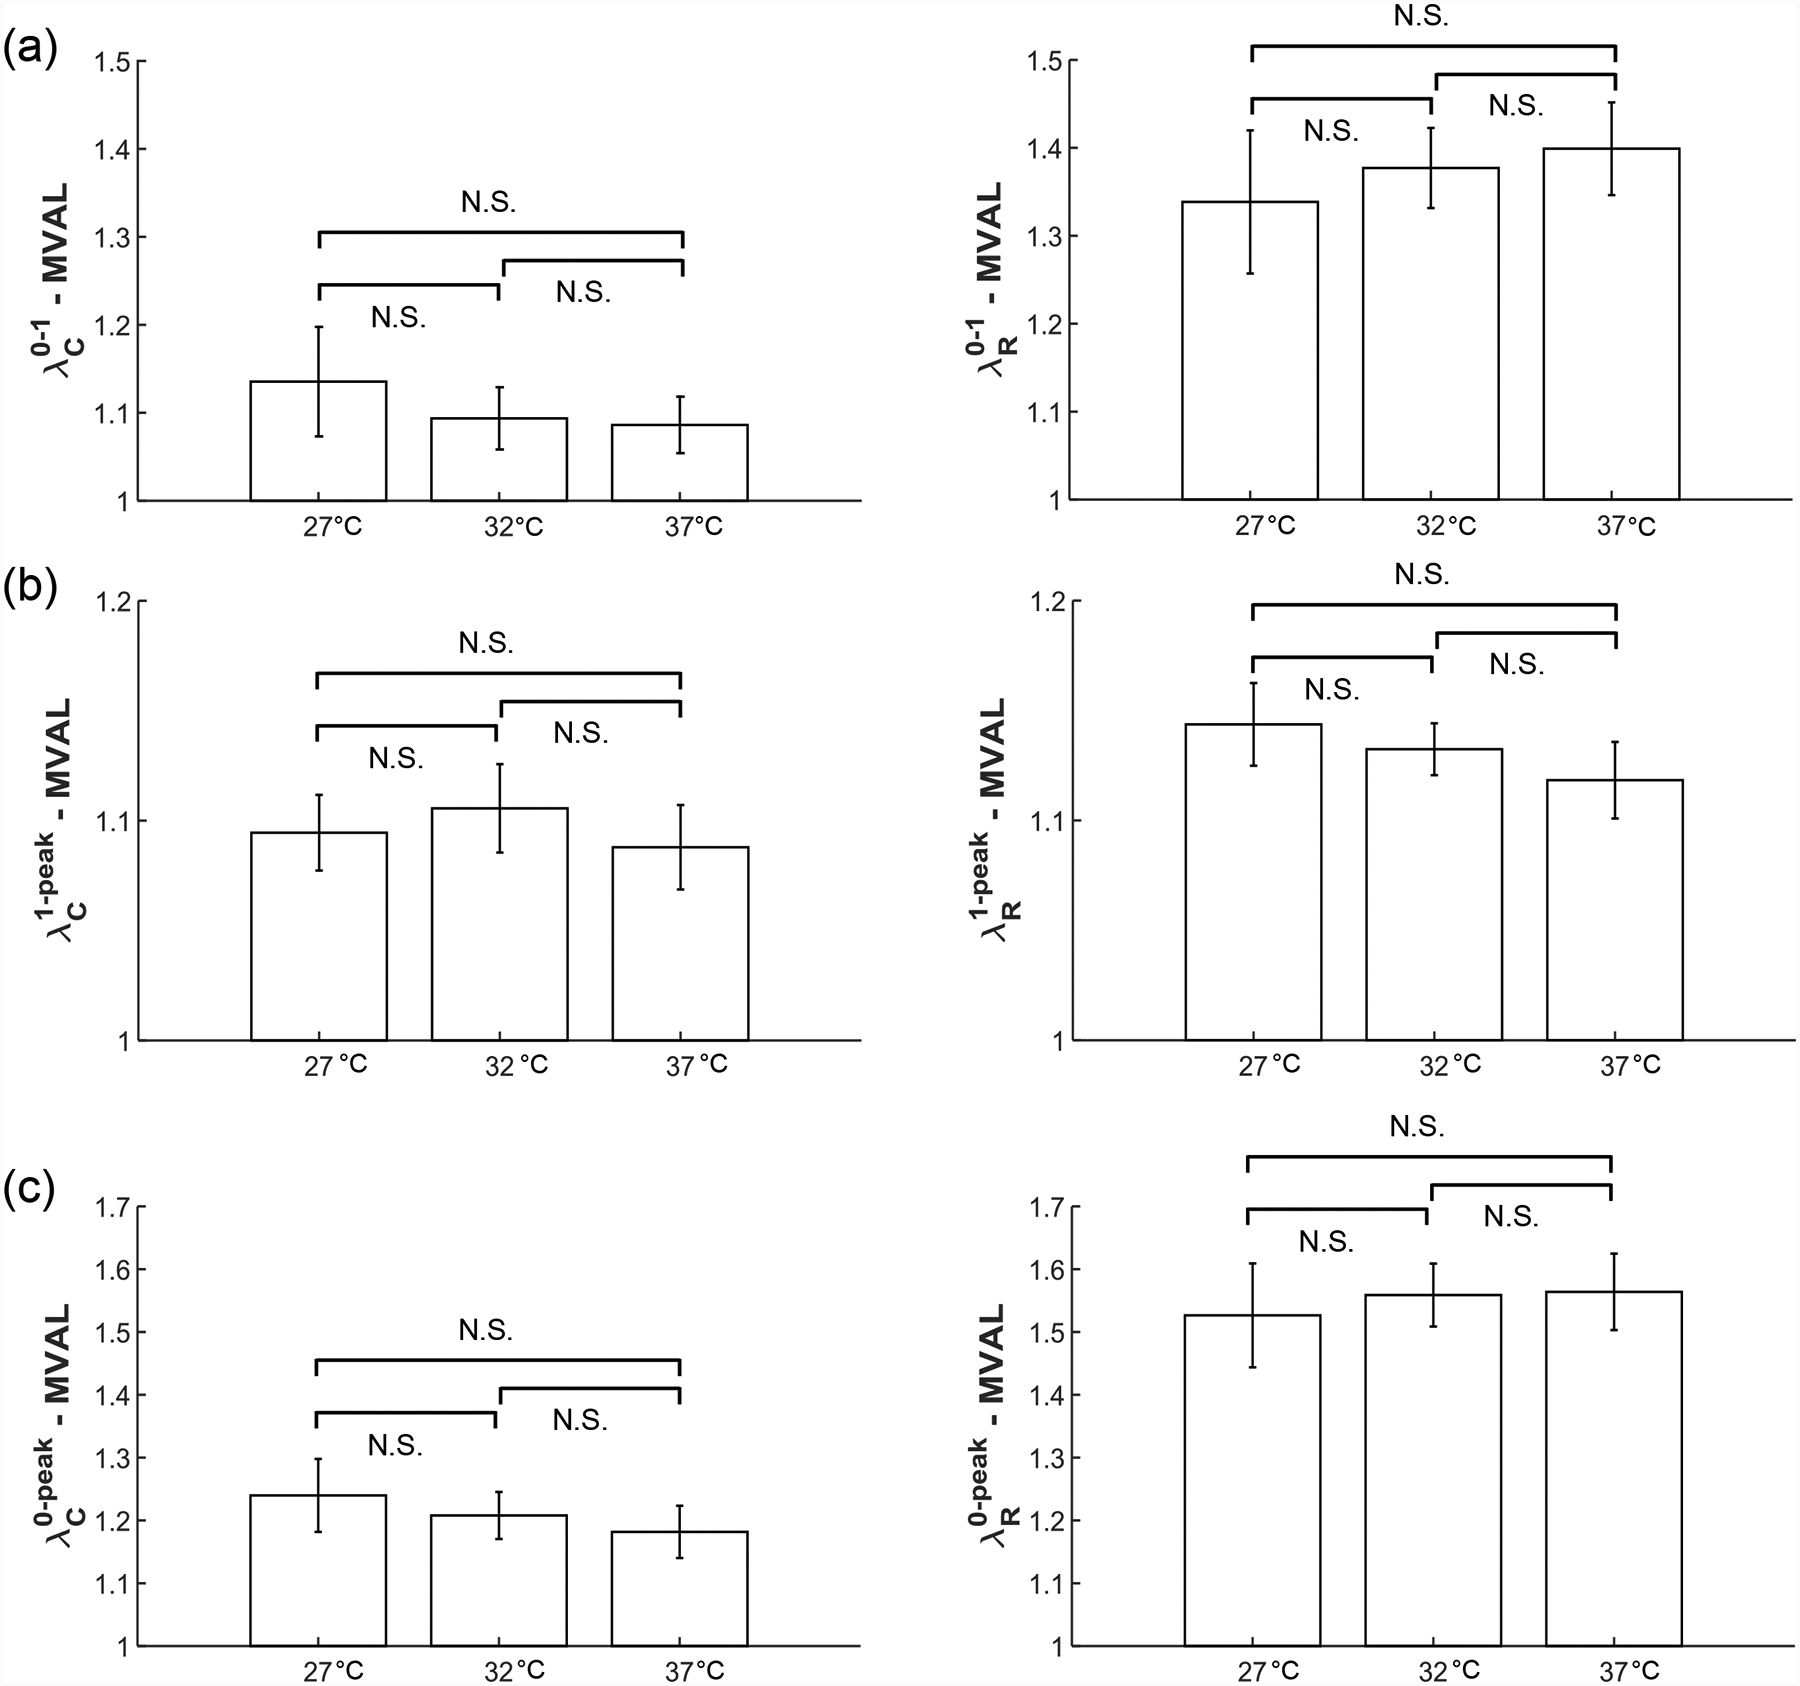
Statistical analyses of the MVAL from the temperature effect group (n=6), with plots showing trends in (a) preconditioning stretches, (b) mechanical stretches, and (c) peak stretches. All bars show mean ± SEM. (N.S.: no statistically significant difference, p>0.10)
Table 5 –
Statistical analysis of the temperature effect on the preconditioning stretches ( and ), mechanical stretches (and ), and peak stretches (and ) of the MVAL (n=6). All quantities are presented as mean ± SEM.
| Circ. | 2.29 N/min | 4.42 N/min | 7.92 N/min | p value (32–37) |
p value (32–37) |
p value (27–37) |
|---|---|---|---|---|---|---|
| 1.046 ± 0.023 | 1.088 ± 0.035 | 1.103 ± 0.042 | 0.349 | 0.787 | 0.268 | |
| 1.165 ± 0.035 | 1.121 ± 0.019 | 1.114 ± 0.019 | 0.295 | 0.808 | 0.235 | |
| 1.218 ± 0.039 | 1.218 ± 0.037 | 1.227 ± 0.045 | 0.999 | 0.871 | 0.873 | |
| Rad. | 2.29 N/min | 4.42 N/min | 7.92 N/min | p value (32–37) |
p value (32–37) |
p value (27–37) |
| 1.397 ± 0.081 | 1.424 ± 0.079 | 1.480 ± 0.084 | 0.812 | 0.639 | 0.492 | |
| 1.175 ± 0.017 | 1.129 ± 0.016 | 1.101 ± 0.007 | 0.077 | 0.159 | 0.0024 | |
| 1.638 ± 0.089 | 1.606 ± 0.090 | 1.630 ± 0.093 | 0.807 | 0.859 | 0.951 |
Three observations could be drawn from our statistical analysis results associated with the temperature effect group: (1) an increase in temperature led to the decrease in the circumferential preconditioning stretch () but an increase in the radial preconditioning stretch () (Fig. 8a); (2) the mechanical stretches ( and ) had no detectable or statistically significant correlation to the increase in temperature for both the circumferential and radial directions (Table 5); (3) through comparison of the peak stretches in the MVAL (Fig. 8c), we found that an increase in the temperature corresponded to a decrease in the peak circumferential stretch () but an increase in the peak radial stretch (). None of these observed trends were found to be statistically significant. Nevertheless, these trends were generally consistent across all the MV and TV leaflets despite the presence of some outliers, specifically for the mechanical responses of the MVPL (Fig. S5).
3.4. Comparison of mechanical responses between different species
In the presentation of results from the species effect experimental group, one representative leaflet was examined from each atrioventricular heart valve. Specifically, we chose the MVAL to represent the mitral valve and the TVAL to represent the tricuspid valve. The averaged mechanical responses (n=6) for these two leaflets under equibiaxial loading from porcine, adult ovine, and juvenile ovine hearts are presented in Figures 9a–c, respectively. We further present the statistical comparisons of the peak, preconditioning, and mechanical stretches (as defined in Section 2.7) between these species in the Supplementary Material (Tables S9–10).
Figure 9 –
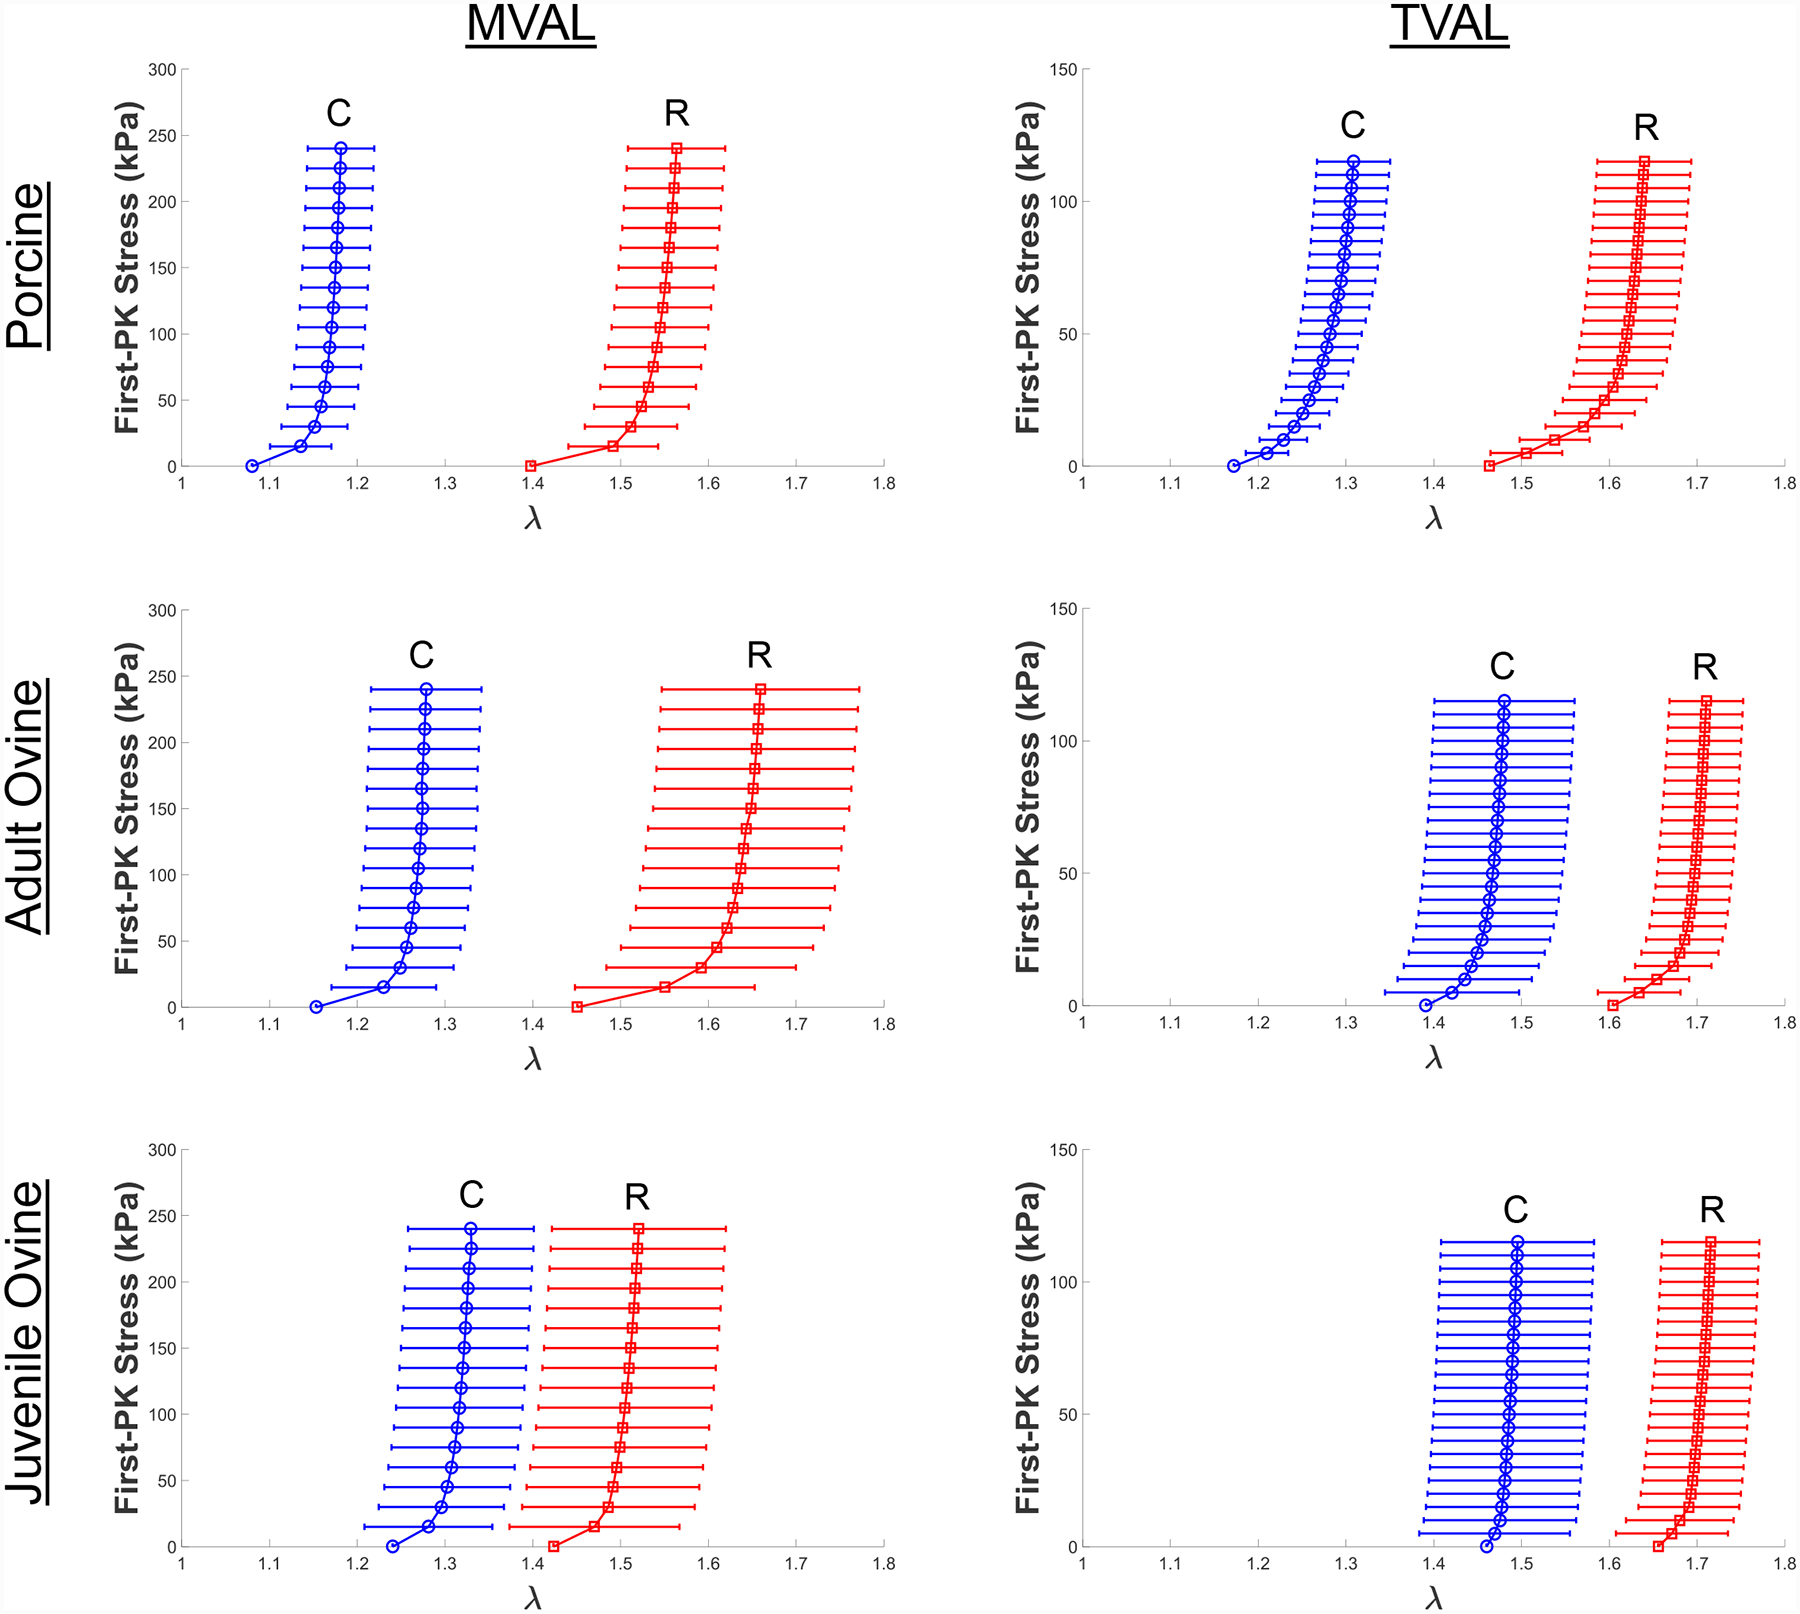
Comparisons of the biaxial mechanical responses of representative atrioventricular valve leaflet tissues under equibiaxial tension (TC,max:TR,max = 1:1) at body temperature (37°C) between different species (adult porcine, adult ovine/sheep, and juvenile ovine/lamb).
The cross-species (porcine versus ovine) and within-species (juvenile ovine versus adult ovine) observed behaviors were specific to MVAL or TVAL and did not support conclusions across leaflets. Through interpreting the statistical analysis results, we found three leaflet-specific relations: (1) the preconditioning stretches were lower for the porcine TVAL than the adult ovine TVAL in both circumferential (p=0.028) and radial directions (p=0.057) (Table S10); (2) the mechanical stretches were notably lower for the juvenile ovine MVAL than the adult ovine MVAL in the radial direction (p=0.052) but showed no consistent trends in the circumferential direction (p=0.614) (Table S9); (3) In the MVAL, the peak stretch was lower for the porcine tissue than the juvenile ovine tissue in the circumferential direction but higher in the radial direction. These results also showed the more isotropic behavior of the juvenile ovine compared to the porcine tissue (Table S9).
3.5. Anatomical quantification of the valve apparatus
The measurements of the anatomical and structural features of porcine and adult ovine atrioventricular valves are presented in Table 6. We found the porcine MVAL was significantly thicker than each porcine TV leaflet (p<0.040), and the porcine MVPL was thicker than the porcine TVPL and TVSL (p<0.006). We also observed the similarity in the length of the chordae anchoring porcine and ovine valve leaflets, as reflected in the MVAL where chordae anchoring porcine leaflets had a length 17.5 ± 1.32 mm while those anchoring the ovine leaflet had a comparable length of 17.9 ± 1.12 mm (Table 6). However, we observed the porcine MV and TV had more chordae than the ovine MV and TV (p<0.001 and p=0.002, respectively). These similarities in chordae lengths and significant differences in chordae quantities are explored further in Section 4.2.2.
Table 6 –
Anatomical measurements for chordae and leaflet tissues of both porcine and ovine atrioventricular valves (n=6, each valve leaflet). All quantities are presented as mean ± SEM.
| Anatomical Measurements | Mitral Valve | Tricuspid Valve | ||||
|---|---|---|---|---|---|---|
| MVAL | MVPL | TVAL | TVPL | TVSL | ||
| Porcine | Leaflet Thickness (mm) | 0.79 ± 0.10 | 0.70 ± 0.06 | 0.52 ± 0.06 | 0.46 ± 0.04 | 0.37 ± 0.02 |
| Number of Chordae | 10.0 ± 0.50 | 20.5 ± 1.20 | 11.2 ± 1.30 | 11.8 ± 1.00 | 12.3 ± 1.80 | |
| Chordae Length (mm) | 17.5 ± 1.32 | 14.1 ± 0.70 | 10.8 ± 0.80 | 11.3 ± 1.30 | 11.3 ± 0.77 | |
| Adult Ovine | Leaflet Thickness (mm) | 0.40 ± 0.03 | 0.36 ± 0.02 | 0.28 ± 0.03 | 0.26 ± 0.02 | 0.27 ± 0.03 |
| Number of Chordae | 4.7 ± 0.50 | 10.2 ± 0.80 | 6.8 ± 0.50 | 8.2 ± 0.50 | 8.7 ± 0.90 | |
| Chordae Length (mm) | 17.9 ± 1.12 | 14.8 ± 0.59 | 10.5 ± 0.79 | 10.9 ± 0.82 | 12.1 ± 0.83 | |
3.6. Histological analysis
The Masson’s trichrome-stained MV and TV leaflets from a representative porcine heart are shown in Figure 10. The average thickness obtained from the histology images of each leaflet are presented in Table 7. The MV leaflets were distinctly thicker than the TV leaflets to sustain higher transvalvular pressure loading [55]. The characteristic four layers of the leaflets: ventricularis (V), spongiosa (S), fibrosa (F), and atrialis (A) were histologically distinguishable in all the five leaflets. The fibrosa layer is primarily composed of a dense layer of collagen and comprises ~60% of the total thickness of the MV leaflets. Similarly, the histology image suggested the fibrosa is the dominant layer of the TVAL. Interestingly, we found the spongiosa, made of non-fibrous constituents (such as Glycosaminoglycans, or GAGs) and located between the fibrosa and atrialis layers, was the thickest layer in the TVPL and TVSL. The ventricularis layer, facing the ventricle in each atrioventricular leaflet, is twice as thick in the MVAL as the TVAL, whereas it is seven-times thicker in the MVPL than in the TVPL. Histology image-based collagen quantification of the valve leaflets indicated the MVAL and MVPL have 77.7%, and 69.1% collagen fiber contents, respectively, whereas the TVAL and TVPL have 68.5%, 45.2% collagen fiber content, respectively (Table 7). Interestingly, we also found the collagen fiber content is lower in the TVSL (~32%) than in other leaflets.
Figure 10 –
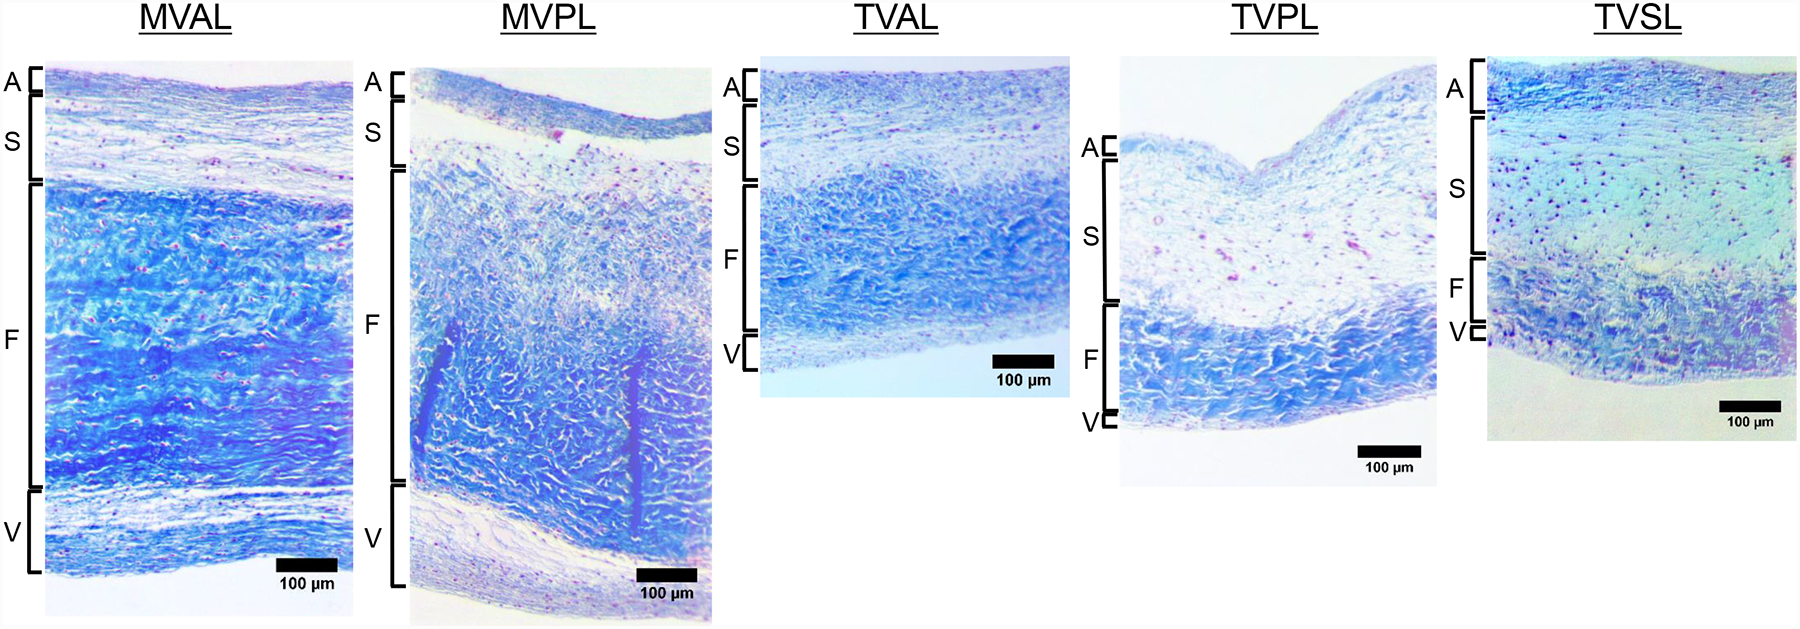
Histological sections of the MV and TV leaflets (MVAL, MVPL, TVAL, TVPL, and TVSL) stained with Masson’s Trichrome. Four morphologically distinct layers of the leaflets (atrialis: A, spongiosa: S, ventricularis: V, fibrosa: F) were identified.
Table 7 –
The thickness and collagen fiber content obtained from the histology sections of porcine MV and TV leaflets. Valve leaflet layers include A: atrialis, S: spongiosa, F: fibrosa, and V: ventricularis. All quantities except for collagen content (generated from image analysis) are presented as mean ± SEM with 3 repeated measurements.
| Mitral Valve | Tricuspid Valve | |||||
|---|---|---|---|---|---|---|
| MVAL | MVPL | TVAL | TVPL | TVSL | ||
| Thickness (μm) | A | 43.74 ± 4.22 | 54.84 ± 7.07 | 54.11 ± 5.32 | 50.27 ± 5.16 | 74.29 ± 4.78 |
| S | 135.21 ± 8.23 | 99.85 ± 6.93 | 108.53 ± 5.59 | 221.26 ± 7.40 | 260.31 ± 9.26 | |
| F | 477.82 ± 6.41 | 556.35 ± 11.72 | 250.77 ± 9.69 | 154.01 ± 10.95 | 149.21 ± 6.62 | |
| V | 121.14 ± 7.64 | 141.44 ± 15.18 | 35.93 ± 3.72 | 20.17 ± 2.78 | 20.82 ± 2.24 | |
| Intact | 777.92 ± 13.46 | 852.49 ± 7.00 | 449.33 ± 3.63 | 445.71 ± 7.51 | 504.62 ± 9.55 | |
| Collagen Content (%) | 77.65 | 69.13 | 68.51 | 45.16 | 32.30 | |
4. Discussion
The anisotropic and nonlinear mechanical responses of mitral and aortic valve leaflet tissues have been characterized in the past two decades [30,31,36,56–58]. However, relatively less attention has been paid to the tricuspid heart valve leaflets [35]. Therefore, this work represents a logical first step to a thorough understanding of the mechanics and structure of the tricuspid valve leaflets, as well as the differences of their mechanical behaviors compared to their relatively well-understood mitral valve counterparts.
4.1. Overall findings
4.1.1. Baseline force-controlled testing
Our baseline testing confirmed the previously quantified anisotropic, nonlinear elastic mechanical response of heart valve leaflets (Figs. 3–4), through the presence of a toe portion of the curve (near the low-stress region) and a highly stiff, nearly asymptotic region as the stress approached the maximum physiological stress experienced by the leaflets. All leaflets tested were significantly stiffer in the circumferential direction (p<0.010). Specifically, the average stretches in the circumferential and radial directions in our study differed by 0.360 for the MVAL, 0.389 for the MVPL, 0.441 for the TVAL, 0.444 for the TVPL, and 0.284 for the TVSL (Table 1). In general, the TV leaflets were more compliant than the MV leaflets at their respective physiological loadings in both circumferential radial directions.
In a prior study, planar biaxial testing was performed on porcine mitral valve tissue and stretches of 1.2 and 1.4 were found for the MVAL in the circumferential and radial directions under an equibiaxial loading protocol [37], whereas stretches of 1.232 ± 0.154 and 1.592 ± 0.136 were found in our study for the MVAL in the same directions (Table 1). Recent studies have shown that testing parameters, such as the mounting mechanism, the spacing of attachment points and the specimen size, could have an impact on the biaxial mechanical testing results [39]. Such discrepancy between our results and those of Grashow et al. (2006), particularly in the radial direction, may be attributed to procedural differences such as different tissue mounting mechanisms (rigid BioRake fixture in our study versus suture hooks in the study by Grashow et al. (2006)).
Our observed stretches of the TV leaflets were similar to those reported by Khoiy and Amini (2016) [35]. In their study, the TV posterior leaflet showed the most anisotropy, with the TVAL and TVSL exhibiting similar but less anisotropy than the TVPL. In general, our study’s results agreed with these findings for the tricuspid valve leaflets. Khoiy and Amini (2016) also found the TVPL was the most compliant leaflet in the radial direction. Our study affirmed this finding, with our observed peak radial stretches of 1.651 ± 0.089 for the TVAL, 1.788 ± 0.040 for the TVPL, 1.685 ± 0.089 for the TVSL (Table 1). Importantly, both studies found the same highly anisotropic and nonlinear behaviors of the tricuspid valve leaflets.
4.1.2. Effect of various loading rates on the mechanical response
We further conducted mechanical testing (Fig. 5, A3–A4) and statistical analysis (Fig. 6, S1–S4) on the response of the atrioventricular leaflets considering varied loading rates. An interesting result of this testing group is the decrease in mechanical stretch of the tissue in both tissue directions with an increased loading rate (Fig. 6b). Our results support the accepted viscoelastic nature of heart valve leaflets [59] and agrees with the time-dependent stress relaxation as observed in heart valve leaflets [38]. However, our results prove contrary to those of a prior study by Grashow et al. (2006), where a variety of loading rates were examined and no significant dependence of mechanical properties on loading rate was observed [37]. One possible reason for this discrepancy is Grashow et al. (2006) examined the peak stretch of the tissue, while we examined the decomposed components of the peak stretch. As for the MVAL, we observed minor differences in the peak stretch between the loading rates of 2.29 N/min and 7.92 N/min in the circumferential (p=0.844) and radial directions (p=0.614) (Fig. 6c and Table S1). Based on these peak stretch comparisons, it would be reasonable to draw a conclusion that there was no significant viscoelastic effect. However, by decomposing the peak stretch and examining only the tissue’s mechanical stretch, the statistical comparisons showed the tissue is stiffer under the loading rate of 7.92 N/min than the rate of 2.29 N/min in both the circumferential (p=0.334) and radial directions (p=0.077) (Table S1). These comparisons of mechanical stretches could shed light on the tissue’s response to varied loading rates, as decoupled from the preconditioning effect.
4.1.3. Effect of temperature on the mechanical responses
We also performed mechanical testing (Figs. 7 and A4–A5) and statistical analysis (Figs. 8 and S5–S8) on each atrioventricular leaflet to examine the temperature dependence of tissue mechanical properties. In examination of these results, we found distinct trends between the circumferential and radial directions (Figs. 8 and S5–S8). Specifically, we found that the preconditioning stretches (Fig. 8b) and peak stretches (Fig. 8c) decreased in the circumferential direction but increased in the radial direction with increased temperature. We also observed a general lack of temperature dependence in the mechanical stretches ( and ) of the atrioventricular heart valve leaflet tissues (Fig. 8c) which clarified how the temperature dependence observed in the peak stretches was primarily a result of similar temperature effects in the preconditioning stretches. These findings are potentially useful for informing experimental protocols where maintenance of valve tissue at body temperature would not be feasible. In such experiments, we expect valve tissue’s mechanical response would be unimpacted by the non-physiological temperature.
4.2. Comparisons between porcine and ovine atrioventricular valves
Both porcine and ovine hearts are commonly employed in animal studies as analogous to human hearts [60]. A proper comparison between human and ovine or porcine hearts first requires an intimate understanding of the mechanics and anatomy of the non-sapiens heart. To that end, we compared the biaxial mechanical responses of porcine, adult ovine, and juvenile ovine atrioventricular leaflet tissues (Fig. 9) and examined specific anatomical features of the atrioventricular valves from both porcine and ovine hearts (Table 6).
4.2.1. Mechanical responses
We examined the responses of the MVAL and TVAL of the porcine, adult ovine, and juvenile ovine heart (Figs. 9a–c) to show the differences in tissue response between different species and between the juvenile and adult ovine animals.
In this study group, we found that the preconditioning stretches were lower for the porcine heart valve than the ovine heart valves, and that the mechanical stretches of the porcine heart were generally higher than the mechanical stretches of the ovine hearts, particularly in the TVAL (Figs. 9a–c). We also observed that the peak stretches for the adult ovine TVAL were higher than the peak stretches for the porcine TVAL in both the circumferential (p=0.090) and radial (p=0.180) directions. These differences between the porcine and ovine atrioventricular valves imply the necessity to consider the mechanics of the specific analogous heart valve for computational modeling rather than assuming similar properties based on their similar function.
With regards to within-species examinations, we found the juvenile ovine MVAL behaved in a more isotropic manner as compared to the adult ovine heart, whereas the TVAL showed little stretch response differences between the adult and juvenile ovine hearts (Figs. 9b–c and Table S9). In addition, we also observed some discrepancy between the juvenile and adult ovine MVAL mechanical responses and the similarity between the juvenile and adult ovine TVAL mechanical responses. These findings suggest possible differences in the development rates between the mitral and tricuspid valves, and could motivate further examinations of heart valve growth and remodeling over the pubescent maturation period [61].
4.2.2. Anatomy and structure
Our anatomical comparison allowed a glimpse into the differences and similarities between valvular structures of different species (Table 6). We found substantial differences in leaflet thickness between the porcine and ovine valve, with the recorded porcine MVAL thickness of 0.79 ± 0.10 mm and the recorded ovine MVAL thickness of 0.40 ± 0.03 mm, but similar average chordae lengths between the porcine and ovine valves (Table 6). We interpret these leaflet thicknesses as proportional to the valvular capacity to bear pressure load. As such, it is intriguing that the mitral valves exhibit such similar chordae lengths, despite the apparent difference in load-bearing capacity/necessity [55]. In addition, we found the chordae quantity generally correlates with the leaflet thickness. For example, the porcine TVAL used 11.2 ± 1.30 anchoring chordae to support a leaflet of thickness 0.52 ± 0.06 mm, while the ovine TVAL had only 6.8 ± 0.50 anchoring chordae to support a leaflet of thickness 0.28 ± 0.05 mm. This relationship could provide insight into the growth and development process of chordae tendineae in the atrioventricular valves.
To examine the chordae quantities within human heart valves, Lam et al. (1970) and Silver et al. (1971) conducted anatomical studies on the human mitral and tricuspid valves, respectively [62,63]. They found human hearts have, on average, 25 chordae in both mitral and tricuspid valves. Our study revealed average chordae quantities of 30.5 ± 1.7 and 35.30 ± 2.8 chords for porcine mitral and tricuspid valves, respectively, and 14.9 ± 1.3 and 23.7 ± 1.9 chords for the adult ovine mitral and tricuspid valves, respectively. These differences in chordae quantities between species suggest unique valvular density and distribution of chordae tendineae within human, porcine, and ovine atrioventricular valves. The error presented in the chordae quantities also alludes to the inherent differences in physiological structures, and the inability to determine a precise expected value for the number of chordae within a healthy valve.
4.3. Histological results
Valve leaflets are composed of collagen, elastin, GAGs, and proteoglycans (PGs). The corresponding nonlinear anisotropic mechanical response of the valve leaflets is mainly determined by these constituents in the ECM. Studying the microstructural organization of leaflets is crucial to understanding the physiological functions of the leaflets. In this study, we investigated the difference in the thickness of individual leaflet layers as well as the collagen fiber distribution in the MV and TV leaflets based on quantitative histology analyses. The intact layer thickness measured from the histological images was in the same range as the thickness obtained from anatomical measurements (Section 3.5). The histological measurements allowed us to precisely quantify the discrepancies in the thickness of intact and individual layers of the MV and TV leaflets (Table 7). The measurements also showed the MV leaflets have thicker collagen-rich fibrosa and ventricularis layers compared to TV leaflets (Fig. 10). The atrialis layer, which is facing the atrium in each leaflet, occupies 6.42 ± 1.36% of the total thickness of the MVPL and 11.32 ± 2.31% of the total thickness of the TVPL (Table 7). Although both atrioventricular heart valves are located in between the atrium and the ventricle, their respective leaflets are subjected to distinct hemodynamic loading conditions and transvalvular pressure gradients. Such functional discrepancies lead to the difference in the microstructural organization of the MV and TV leaflets as observed in this study. In addition, the high collagen fiber content and the collagen-rich fibrosa layer in the MV leaflets may serve as a primary load bearing layer to sustain higher pressures during cardiac cycles compared to the TV counterparts.
4.4. Study limitations and future extensions
Biaxial testing methods are notoriously limited in their ability to capture and account for in-plane shear stresses [29]. In our study, planar shear stresses were examined and found to be negligible compared to their direct stress counterparts, and so were not included in the presentation of results. This is standard practice in biaxial testing experiments, and previous studies utilizing biaxial testing methods have found similarly negligible shear stresses [64]. In addition, we encountered difficulty in the determination of an average sample thickness due to the roughness and non-uniformity of heart valve leaflets, particularly in regions with chordae attachments [65]. To address this obstacle, our group averaged thickness data from three measurements taken from different regions of the testing sample. Another potential limitation of our study was in the use of frozen heart valve tissues. Although this is a standard practice in biaxial mechanical testing experiments [37,38], the effect of freezing on the mechanics of heart valve tissues has not been rigorously studied. In addition to these experimental limitations, the natural variance in biological material property and structure led to the substantial calculated errors in biaxial testing and anatomical study results. This challenge persists across many biological domains and leads to larger errors in experimental results compared to other fields.
The essential extension from this study is the development of a structurally-informed and computationally-tractable constitutive model for the atrioventricular valve leaflets, which is currently under investigation by our lab. In the meantime, we make our experimental results associated with all the five loading protocols available in the accompanying Data in Brief article [54], for other researcher groups’ development and validations of novel computational models for atrioventricular heart valve tissues.
With regards to the anatomical study, we only characterized a few dimensional parameters of the valvular complex. Further research on the annuli, moderator band, papillary muscles, and ventricular dimensions could allow potential early diagnosis of valvular regurgitation through the establishment of a healthy range of parameter values, and it could also be beneficial to the development of predictive computational models towards increasing the long-term durability of surgically repaired atrioventricular heart valves [25].
Another ongoing research effort from our lab is the investigation of the important relation between the tissue microstructure and its mechanical behavior. For example, the relatively thick and collagen-rich fibrosa layer (Fig. 10) accounts for much of the mechanical strength of the heart valves under physiological tensile loading [58,66]. Although the collagen fiber orientation in the fibrosa has been examined, very few studies have comprehensively related the characterized tissue’s mechanical responses to the dynamical changes in the collage fiber architecture (such as fiber orientation) under physiological and pathophysiological loading [67–69]. More rigorous studies on examining the interrelationship between the mechanics and collagenous structure of the leaflets will give a better insight into the atrioventricular heart valve function, especially under diseased and/or surgically-intervened conditions.
4.5. Conclusion
In this study, the response of each porcine atrioventricular leaflet has been thoroughly characterized. Our comprehensive results suggest the porcine MVAL and MVPL exhibit similar levels of material anisotropy, and the porcine TVPL was the most compliant in both circumferential and radial directions and the most anisotropic among the three tricuspid leaflets. These findings also suggest the necessity of employing different constitutive model parameters to describe the distinct mechanical behavior of each individual atrioventricular valve leaflet, rather than assuming homogeneous mechanical properties between leaflets. Moreover, we have demonstrated an increased loading rate is associated with a stiffer mechanical response, and increased temperature yields directionally-specific differences in the tissue stretches. We have also provided a novel quantification of the distinct mechanical responses of porcine and ovine leaflets and quantified the difference in leaflet mechanical response between different species and between juvenile and adult ovine animals. This study is also the first of this kind to examine the anatomic chordae distributions within porcine and ovine atrioventricular valves to quantify the structural differences between mitral and tricuspid valves. Future investigation may include the development of high-fidelity, multiscale models of atrioventricular valve function, and incorporation of the material responses acquired in this study into computational models [21,70,71]. These efforts will allow us to predict the response of the leaflet in vivo and to examine how the changes in the valve’s mechanical properties and structure can lead to suboptimal valvular performance.
Supplementary Material
Table 2 –
Circumferential and radial stretches of porcine atrioventricular heart valves (n=6) at selected stress levels (% of maximum 1st-PK stress in the radial direction) under 0.5:1 tension protocol (Figs. 3b and 4b). Values are presented as mean ± SEM.
| % of P22,max | λ | MVAL | MVPL | TVAL | TVPL | TVSL |
|---|---|---|---|---|---|---|
| 0% | 1.033 ± 0.025 | 1.045 ± 0.031 | 1.056 ± 0.029 | 1.068 ± 0.038 | 1.114 ± 0.033 | |
| 1.407 ± 0.057 | 1.474 ± 0.071 | 1.476 ± 0.058 | 1.567 ± 0.036 | 1.565 ± 0.075 | ||
| 25% | 1.158 ± 0.048 | 1.134 ± 0.026 | 1.121 ± 0.029 | 1.197 ± 0.056 | 1.229 ± 0.020 | |
| 1.583 ± 0.064 | 1.614 ± 0.083 | 1.602 ± 0.075 | 1.783 ± 0.039 | 1.693 ± 0.087 | ||
| 50% | 1.172 ± 0.051 | 1.145 ± 0.027 | 1.140 ± 0.029 | 1.219 ± 0.057 | 1.251 ± 0.019 | |
| 1.606 ± 0.065 | 1.535 ± 0.084 | 1.645 ± 0.083 | 1.824 ± 0.042 | 1.721 ± 0.091 | ||
| 75% | 1.179 ± 0.051 | 1.152 ± 0.028 | 1.150 ± 0.029 | 1.231 ± 0.058 | 1.264 ± 0.018 | |
| 1.618 ± 0.065 | 1.645 ± 0.085 | 1.675 ± 0.094 | 1.840 ± 0.042 | 1.734 ± 0.092 | ||
| 100% | 1.184 ± 0.052 | 1.158 ± 0.029 | 1.157 ± 0.029 | 1.239 ± 0.058 | 1.273 ± 0.018 | |
| 1.627 ± 0.066 | 1.652 ± 0.085 | 1.688 ± 0.096 | 1.850 ± 0.043 | 1.744 ± 0.093 |
Acknowledgments
Support from the American Heart Association Scientist Development Grant (SDG) Award (16SDG27760143) is gratefully acknowledged. CHL was in part supported by the institutional start-up funds from the School of Aerospace and Mechanical Engineering (AME) and the research funding through the Faculty Investment Program from the Research Council at the University of Oklahoma (OU). SJ, RK, and DL were supported by the Mentored Research Fellowship from the Office of Undergraduate Research at OU. KK and DL were supported by the Undergraduate Research Opportunities Program from the Honors College at OU. We also acknowledge undergraduate researchers Jacob Richardson and Colton Ross for their assistance with the anatomical study, as well as Dr. Kar-Ming Fung from the Department of Pathology at the OU Health Sciences Center for his help in the histology study.
Nomenclature
anatomy
- MVAL
mitral valve anterior leaflet
- MVPL
mitral valve posterior leaflet
- TVAL
tricuspid valve anterior leaflet
- TVPL
tricuspid valve posterior leaflet
- TVSL
tricuspid valve septal leaflet
valve tissue layers
- A
atrialis
- S
spongiosa
- F
fibrosa
- V
ventricularis
mechanics
- F
deformation gradient tensor
- C
right Cauchy-Green deformation tensor = FTF
- E
Green strain tensor = 0.5(C-I)
- I
2nd-order identity tensor
- σ
Cauchy stress tensor
- P
1st Piola-Kirchhoff (PK) stress tensor
- λ
Tissue stretch
- λC
Tissue stretch in the circumferential direction
- λR
Tissue stretch in the radial direction
Peak stretch in the circumferential direction
Peak stretch in the radial direction
Preconditioning stretch in the circumferential direction
Preconditioning stretch in the radial direction
Mechanical stretch in the circumferential direction
Mechanical stretch in the radial direction
tissue states
- Ω0
tissue sample at the unstressed reference configuration
- Ωt
tissue sample at the deformed configuration under loading
collagen fiber directions
- C
circumferential direction
- R
radial direction
Others
- SEM
standard error of the mean
- DIC
digital image correlation
- ECM
extracellular matrix
- GAG
glycosaminoglycan
- PG
proteoglycan
Appendix:
Biaxial Testing Results of Porcine Valve Leaflet Tissues under Intermediate Loading Protocols
As for the baseline biaxial testing (Section 3.1), the mechanical responses of porcine mitral and tricuspid valve leaflets under loading protocols TC,max:TR,max = 0.75:1 and TC,max:TR,max = 1:0.75 were presented in Fig. A1 and Fig. A2, respectively. Results under those intermediate loading protocols for the studies on the loading rate effect (Section 3.2) and the temperature effect (Section 3.3) were presented in Fig. A3–4 and in Fig. A5–6, respectively.
Figure A1 –
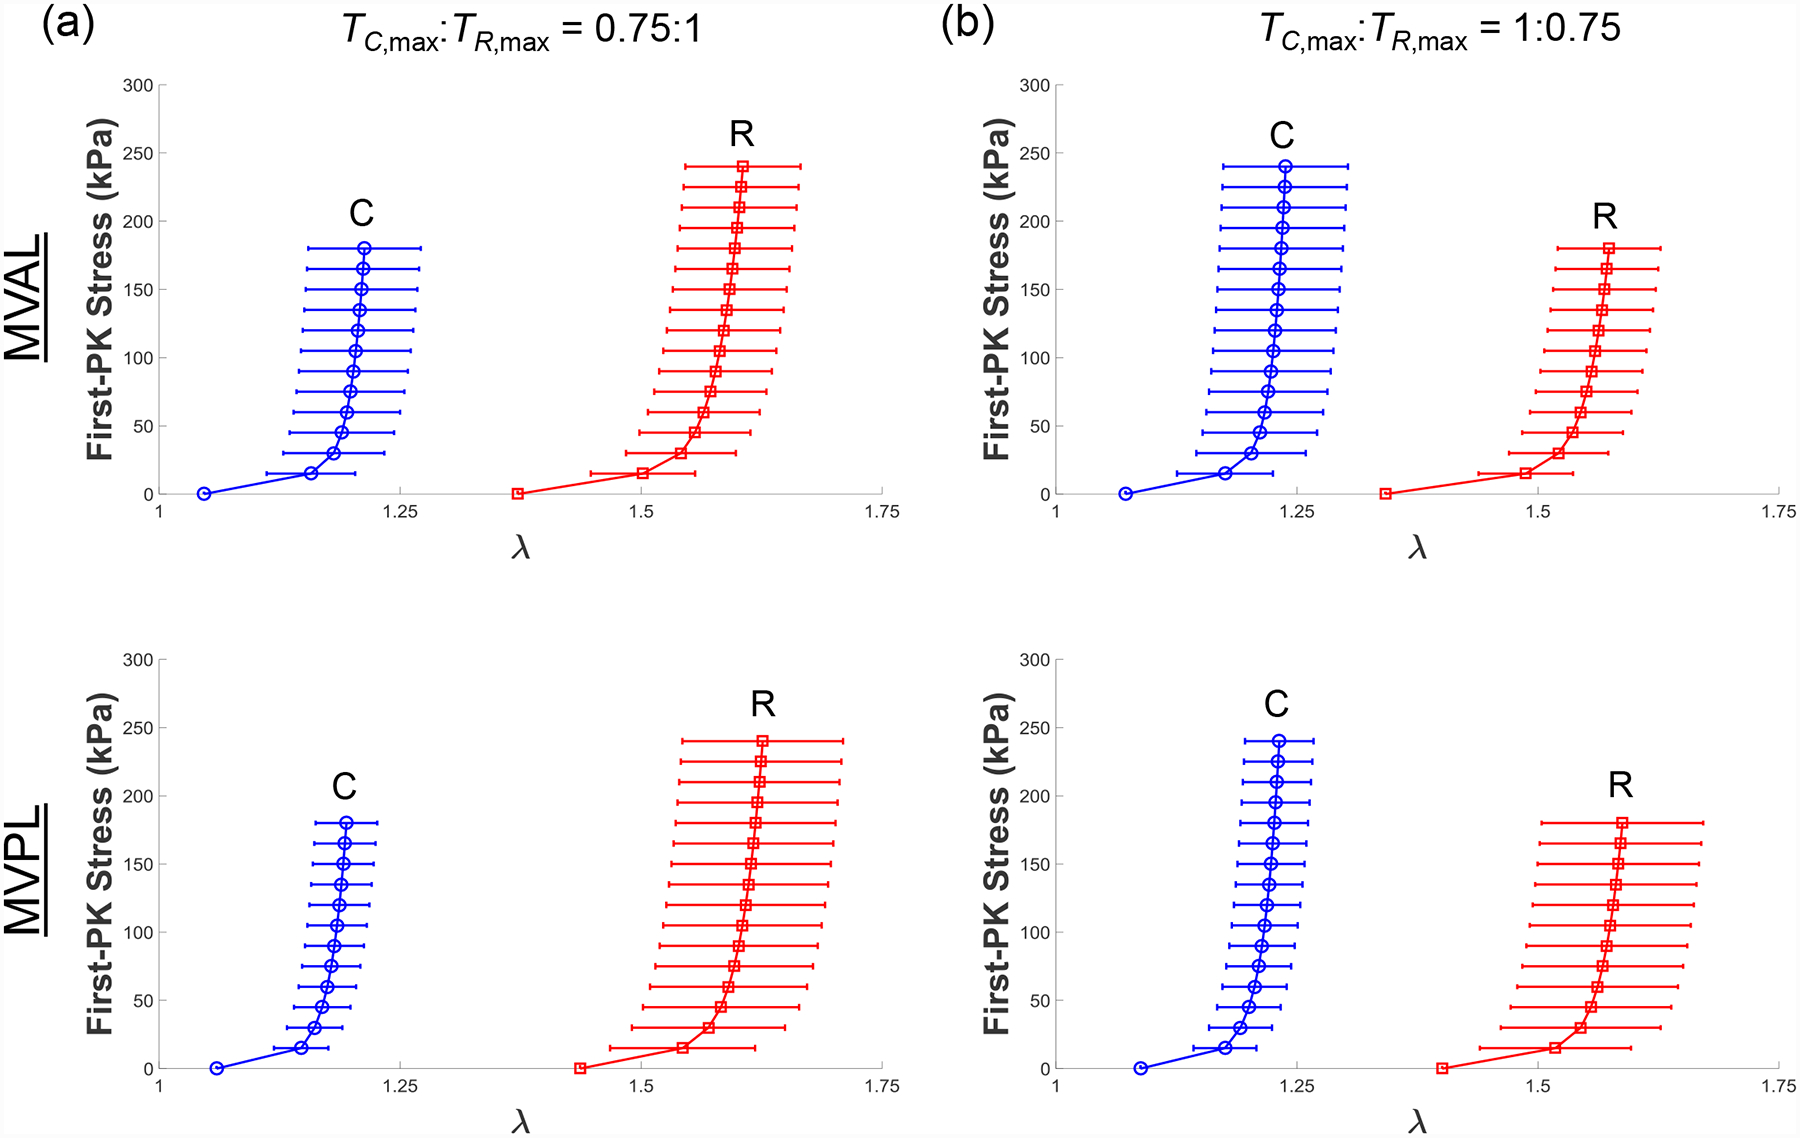
Mean ± SEM of the 1st-PK stress versus stretch results of the porcine MVAL and MVPL tissues (n=6) under intermediate biaxial loading protocols at room temperature (22°C): (a) TC,max:TR,max = 0.75:1, and (b) TC,max:TR,max = 1:0.75.
Figure A2 –
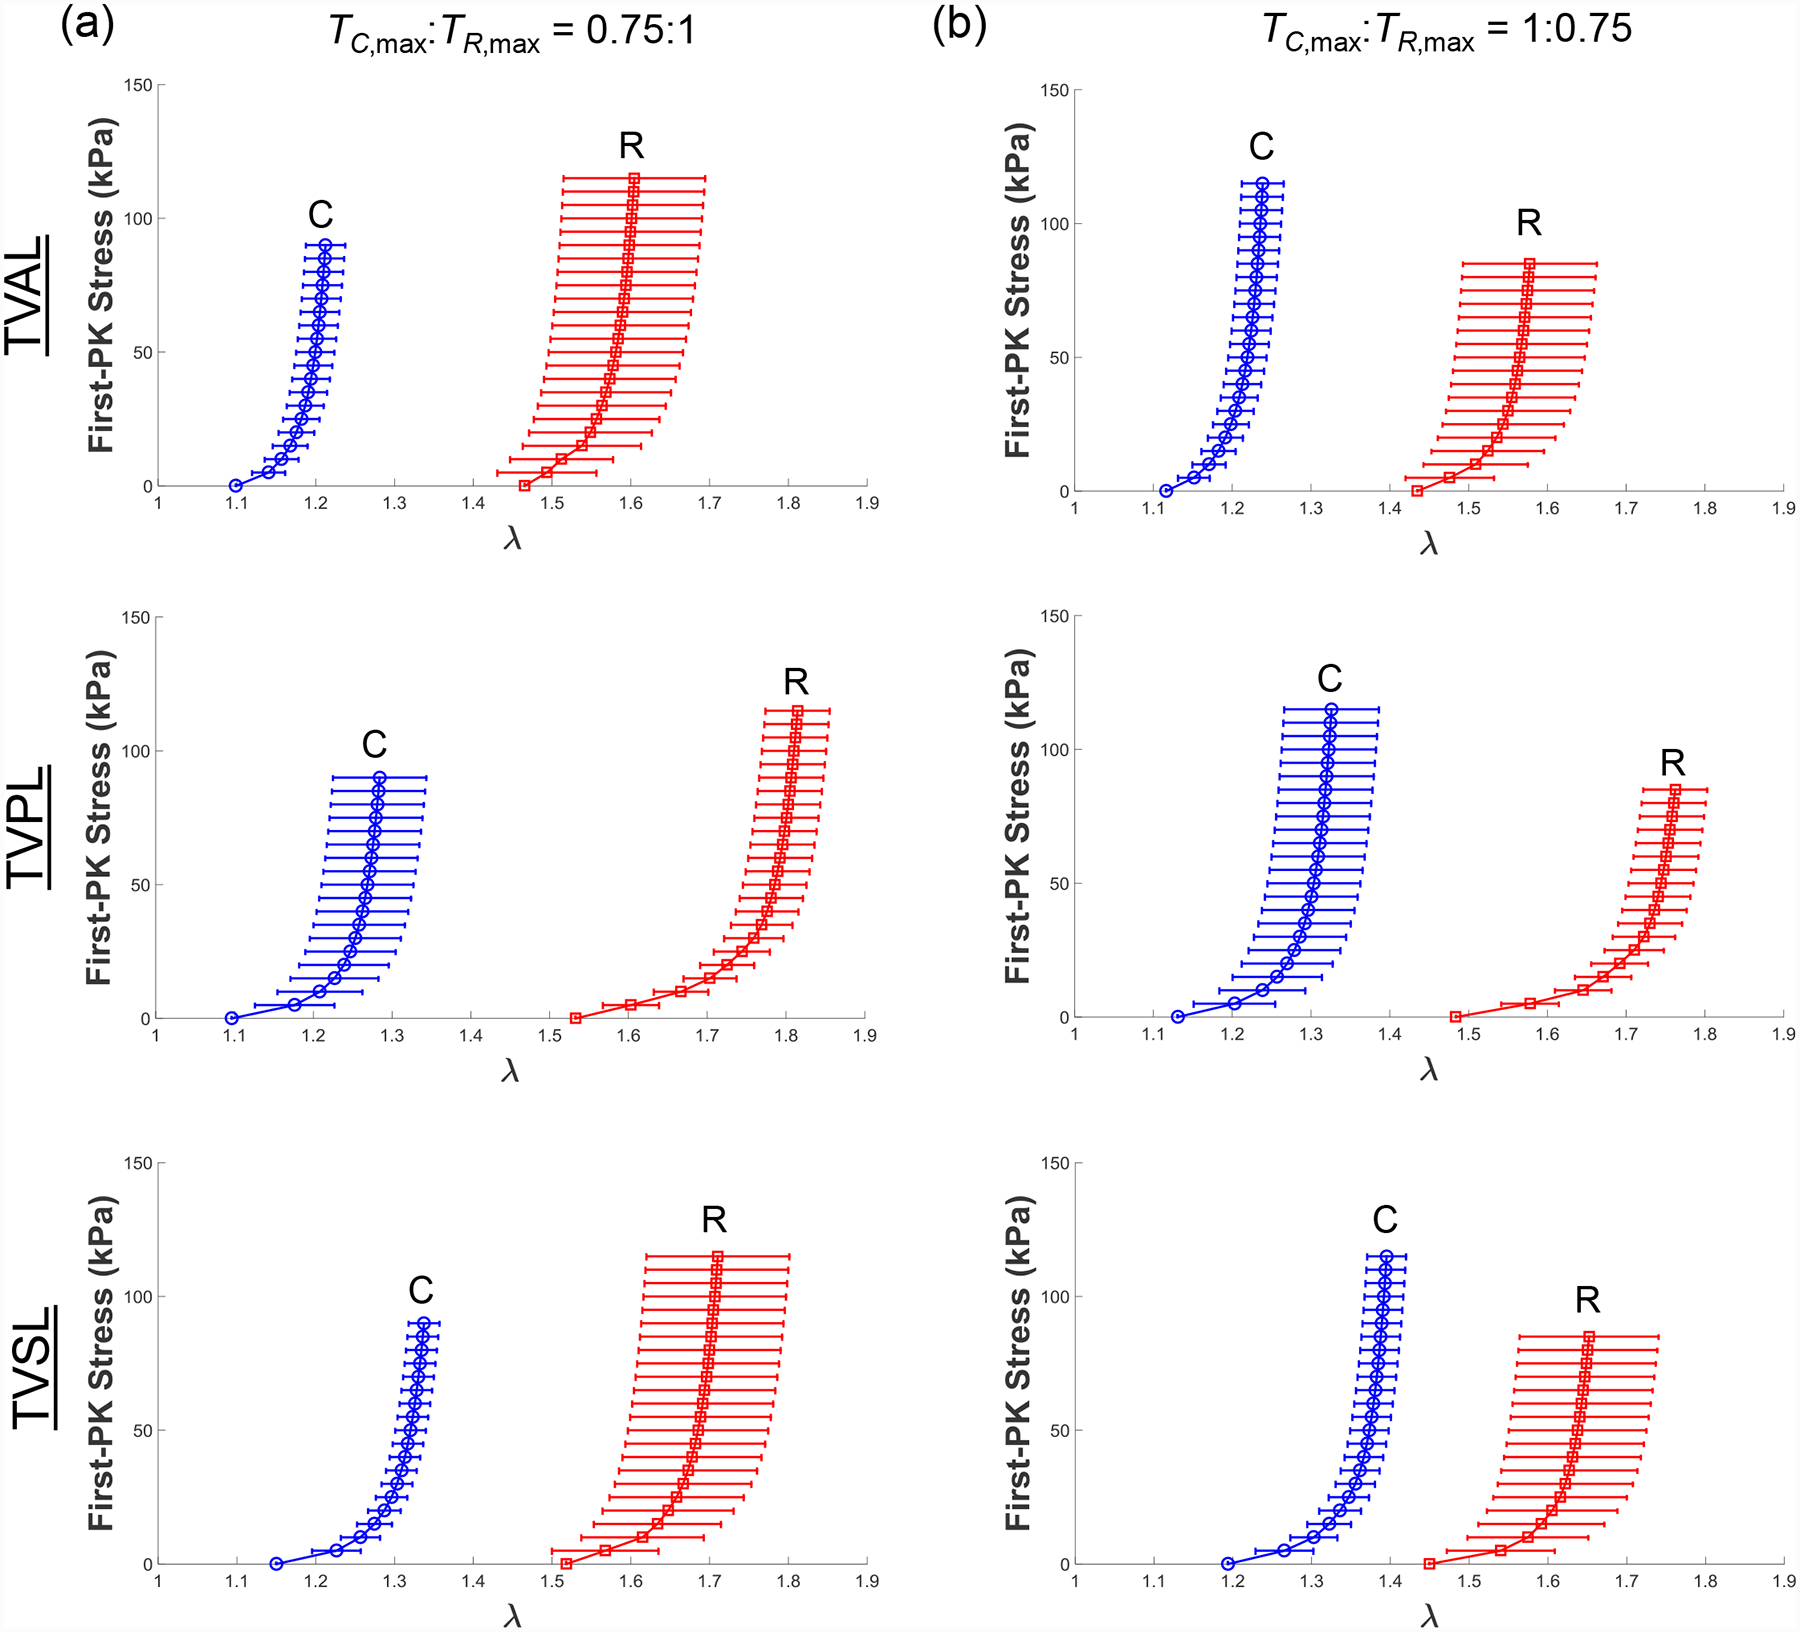
Mean ± SEM of the 1st-PK stress versus stretch results of the porcine TVAL, TVPL, and TVSL tissues (n=6) under intermediate biaxial loading protocols at room temperature (22°C): (a) TC,max:TR,max = 0.75:1, and (b) TC,max:TR,max = 1:0.75.
Figure A3 –
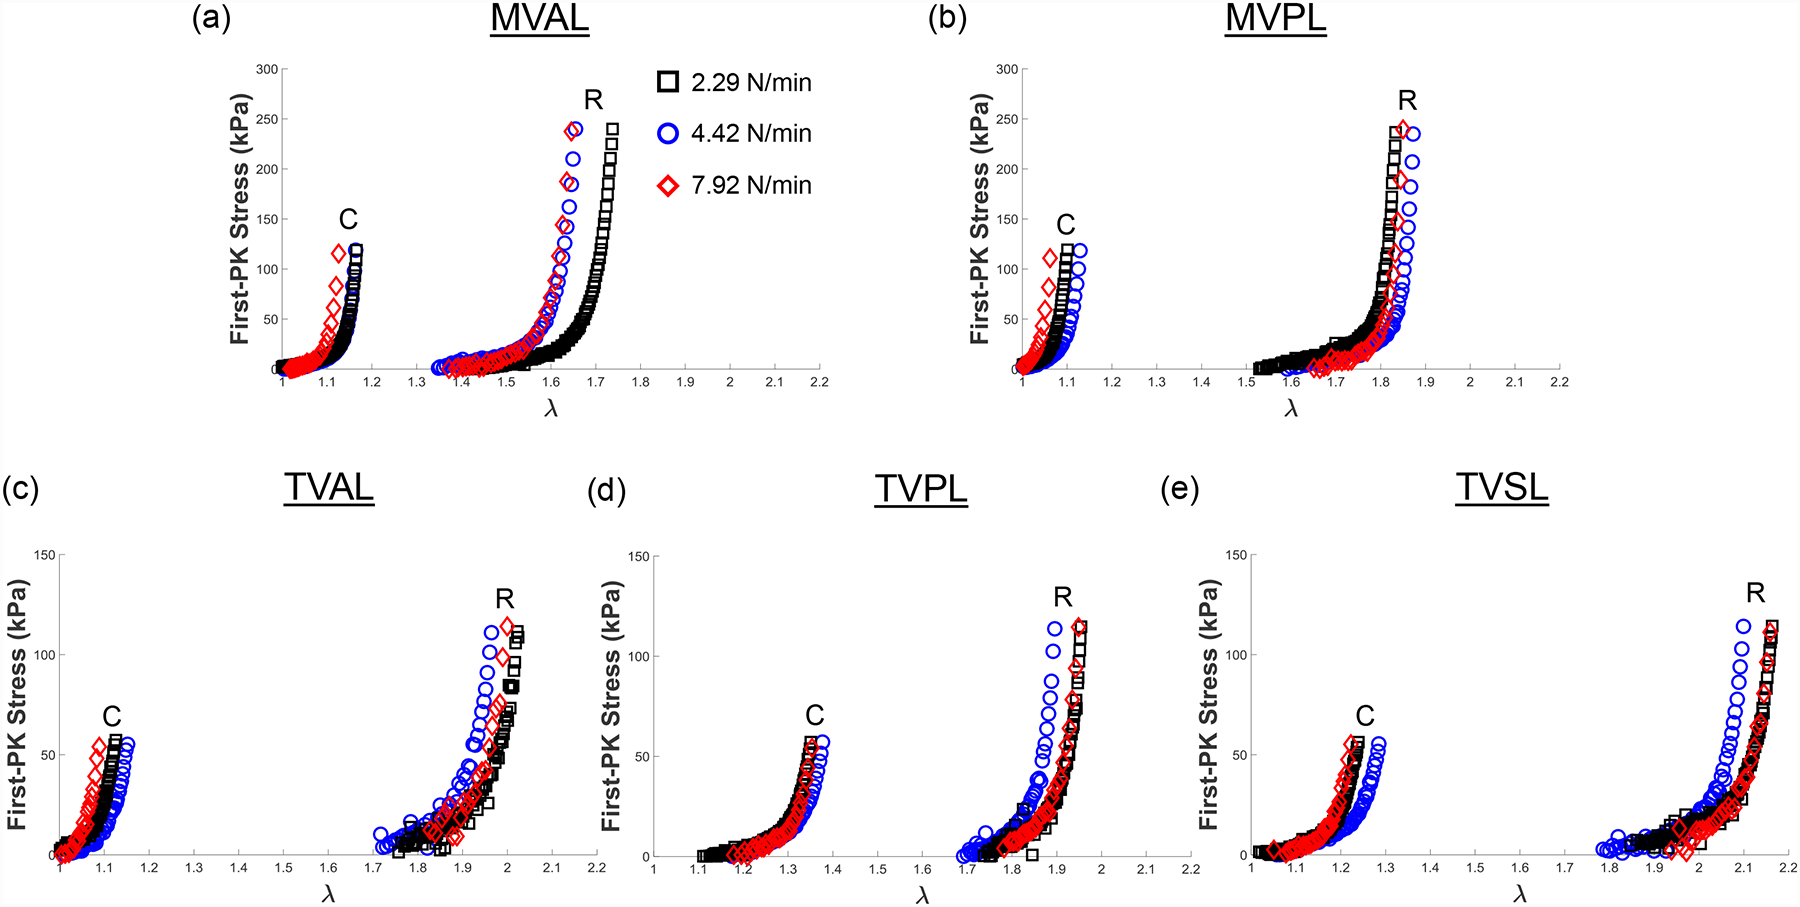
Representative biaxial mechanical testing results of each porcine atrioventricular leaflet under biaxial tensions (TC,max:TR,max = 0.5:1) at room temperature (22°C), showing the effect of varied loading rates on the quantified 1st-PK stress versus stretch results: (a) MVAL, (b) MVPL, (c) TVAL, (d) TVPL, and (e) TVSL.
Figure A4 –
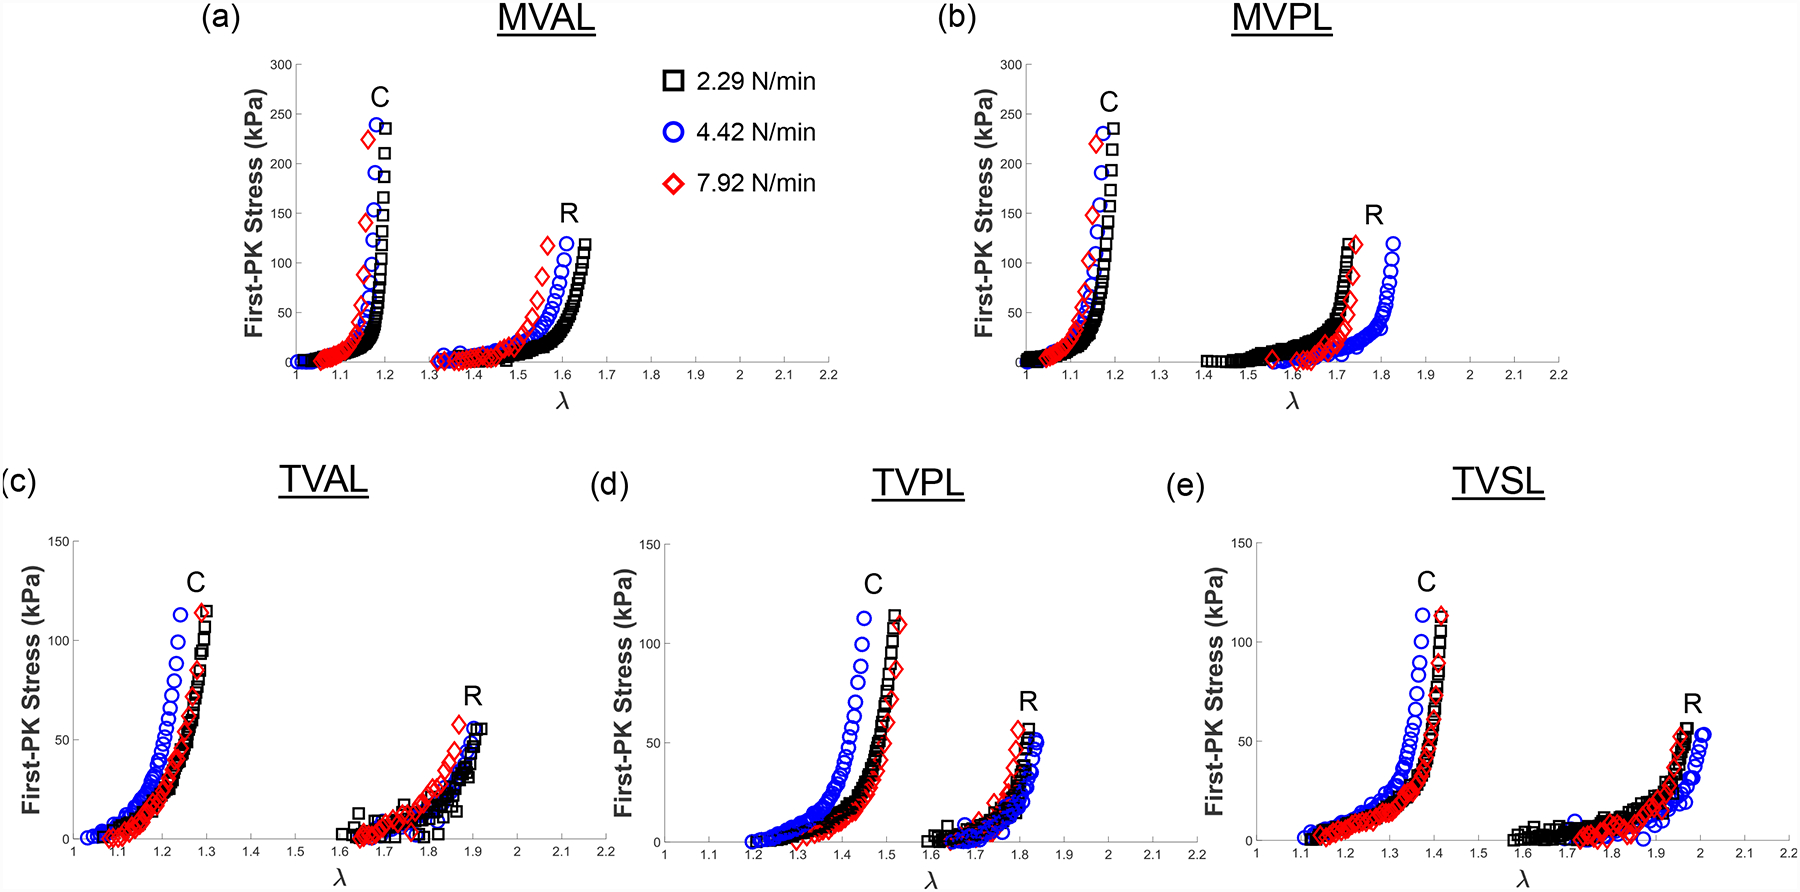
Representative biaxial mechanical testing results of each porcine atrioventricular leaflet under biaxial tensions (TC,max:TR,max = 1:0.5) at room temperature (22°C), showing the effect of varied loading rates on the quantified 1st-PK stress versus stretch results: (a) MVAL, (b) MVPL, (c) TVAL, (d) TVPL, and (e) TVSL.
Figure A5 –
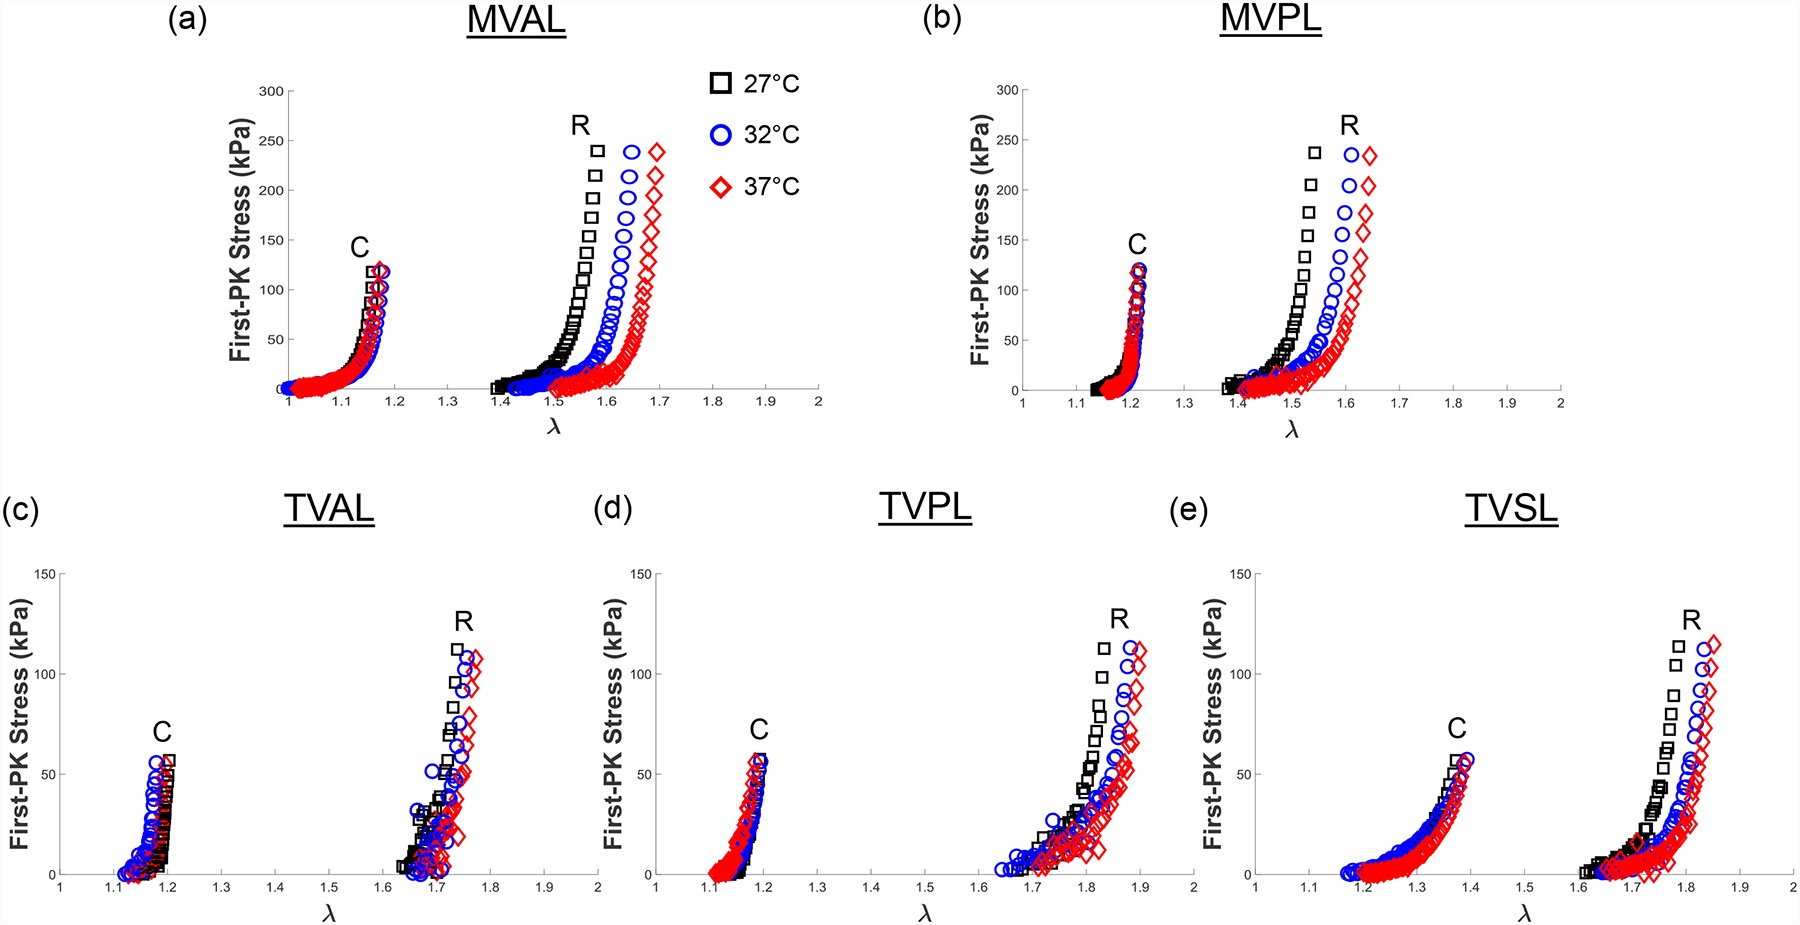
Representative biaxial mechanical testing results of each porcine atrioventricular leaflet under biaxial tensions (TC,max:TR,max = 0.5:1), showing the effect of temperature on the quantified 1st-PK stress versus stretch results: (a) MVAL, (b) MVPL, (c) TVAL, (d) TVPL, and (e) TVSL.
Figure A6 –
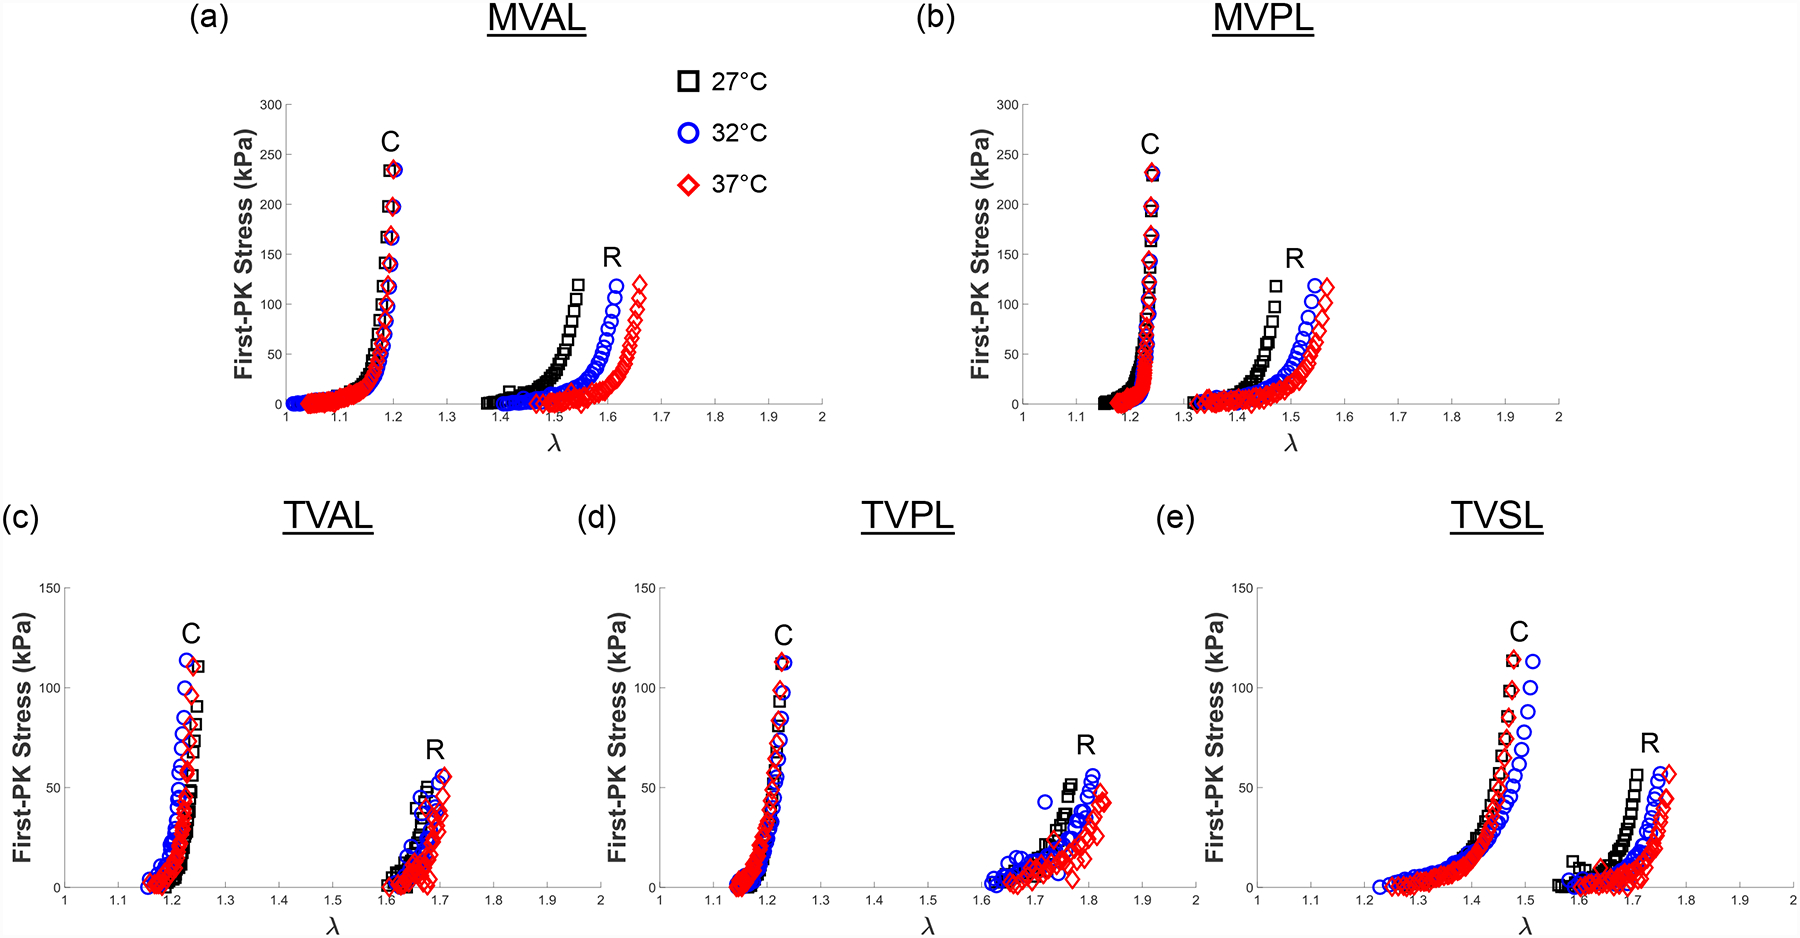
Representative biaxial mechanical testing results of each porcine atrioventricular leaflet under biaxial tensions (TC,max:TR,max = 1:0.5), showing the effect of temperature on the quantified 1st-PK stress versus stretch results: (a) MVAL, (b) MVPL, (c) TVAL, (d) TVPL, and (e) TVSL.
Footnotes
Conflicts of Interest
None of the authors have a conflict of interest with the present work.
References
- 1.Klabunde R Cardiovascular physiology concepts: Lippincott Williams & Wilkins; 2011. [Google Scholar]
- 2.Shiran A, and Sagie A (2009) Tricuspid regurgitation in mitral valve disease. Journal of the American College of Cardiology, 53(5):401–08. [DOI] [PubMed] [Google Scholar]
- 3.O’rourke RA, and Crawford MH (1984) Mitral valve regurgitation. Current Problems in Cardiology, 9(2):1–52. [DOI] [PubMed] [Google Scholar]
- 4.Nkomo VT, Gardin JM, Skelton TN, Gottdiener JS, Scott CG, and Enriquez-Sarano M (2006) Burden of valvular heart diseases: A population-based study. The Lancet, 368(9540):1005–11. [DOI] [PubMed] [Google Scholar]
- 5.Waller BF, Howard J, and Fess S (1994) Pathology of mitral valve stenosis and pure mitral regurgitation—part i. Clinical Cardiology, 17(6):330–36. [DOI] [PubMed] [Google Scholar]
- 6.Taramasso M, Pozzoli A, Guidotti A, Nietlispach F, Inderbitzin DT, Benussi S, Alfieri O, and Maisano F (2016) Percutaneous tricuspid valve therapies: The new frontier. European Heart Journal, 38(9):639–47. [DOI] [PubMed] [Google Scholar]
- 7.Preston-Maher GL, Torii R, and Burriesci G (2015) A technical review of minimally invasive mitral valve replacements. Cardiovascular Engineering and Technology, 6(2):174–84. [DOI] [PMC free article] [PubMed] [Google Scholar]
- 8.Rodés-Cabau J, Taramasso M, and T O’gara P (2016) Diagnosis and treatment of tricuspid valve disease: Current and future perspectives. The Lancet, 388(10058):2431–42. [DOI] [PubMed] [Google Scholar]
- 9.Schofer J, Bijuklic K, Tiburtius C, Hansen L, Groothuis A, and Hahn RT (2015) First-in-human transcatheter tricuspid valve repair in a patient with severely regurgitant tricuspid valve. Journal of the American College of Cardiology, 65(12):1190–95. [DOI] [PubMed] [Google Scholar]
- 10.Schoen FJ, and Gotlieb AI (2016) Heart valve health, disease, replacement, and repair: A 25-year cardiovascular pathology perspective. Cardiovascular Pathology, 25(4):341–52. [DOI] [PubMed] [Google Scholar]
- 11.Franzen O, Baldus S, Rudolph V, Meyer S, Knap M, Koschyk D, Treede H, Barmeyer A, Schofer J, and Costard-Jäckle A (2010) Acute outcomes of mitraclip therapy for mitral regurgitation in high-surgical-risk patients: Emphasis on adverse valve morphology and severe left ventricular dysfunction. European Heart Journal, 31(11):1373–81. [DOI] [PubMed] [Google Scholar]
- 12.Hammerstingl C, Schueler R, Malasa M, Werner N, and Nickenig G (2016) Transcatheter treatment of severe tricuspid regurgitation with the mitraclip system. European Heart Journal, 37(10):849–53. [DOI] [PubMed] [Google Scholar]
- 13.Grigioni F, Enriquez-Sarano M, Zehr KJ, Bailey KR, and Tajik AJ (2001) Ischemic mitral regurgitation. Circulation, 103(13):1759–64. [DOI] [PubMed] [Google Scholar]
- 14.Lancellotti P, Tribouilloy C, Hagendorff A, Moura L, Popescu BA, Agricola E, Monin J-L, Pierard LA, Badano L, and Zamorano JL (2010) European association of echocardiography recommendations for the assessment of valvular regurgitation. Part 1: Aortic and pulmonary regurgitation (native valve disease). European Journal of Echocardiography, 11(3):223–44. [DOI] [PubMed] [Google Scholar]
- 15.Shanks M, Siebelink H-MJ, Delgado V, Van De Veire NR, Ng AC, Sieders A, Schuijf JD, Lamb HJ, Marsan NA, and Westenberg JJ (2010) Quantitative assessment of mitral regurgitation. Circulation: Cardiovascular Imaging, 3(6):694–700. [DOI] [PubMed] [Google Scholar]
- 16.Lee C-H, Oomen PJ, Rabbah JP, Yoganathan A, Gorman RC, Gorman JH, Amini R, and Sacks MS A high-fidelity and micro-anatomically accurate 3d finite element model for simulations of functional mitral valve. International Conference on Functional Imaging and Modeling of the Heart; 2013: Springer. [DOI] [PMC free article] [PubMed] [Google Scholar]
- 17.Aggarwal A, Aguilar VS, Lee C-H, Ferrari G, Gorman JH, Gorman RC, and Sacks MS Patient-specific modeling of heart valves: From image to simulation. International Conference on Functional Imaging and Modeling of the Heart; 2013: Springer. [DOI] [PMC free article] [PubMed] [Google Scholar]
- 18.Lee C-H, Rabbah J-P, Yoganathan AP, Gorman RC, Gorman JH, and Sacks MS (2015) On the effects of leaflet microstructure and constitutive model on the closing behavior of the mitral valve. Biomechanics and Modeling in Mechanobiology, 14(6):1281–302. [DOI] [PMC free article] [PubMed] [Google Scholar]
- 19.Wang Q, and Sun W (2013) Finite element modeling of mitral valve dynamic deformation using patient-specific multi-slices computed tomography scans. Annals of Biomedical Engineering, 41(1):142–53. [DOI] [PubMed] [Google Scholar]
- 20.Taylor CA, and Figueroa C (2009) Patient-specific modeling of cardiovascular mechanics. Annual Review of Biomedical Engineering, 11:109–34. [DOI] [PMC free article] [PubMed] [Google Scholar]
- 21.Stevanella M, Maffessanti F, Conti CA, Votta E, Arnoldi A, Lombardi M, Parodi O, Caiani EG, and Redaelli A (2011) Mitral valve patient-specific finite element modeling from cardiac mri: Application to an annuloplasty procedure. Cardiovascular Engineering and Technology, 2(2):66–76. [Google Scholar]
- 22.Rim Y, Laing ST, Mcpherson DD, and Kim H (2014) Mitral valve repair using eptfe sutures for ruptured mitral chordae tendineae: A computational simulation study. Annals of Biomedical Engineering, 42(1):139–48. [DOI] [PMC free article] [PubMed] [Google Scholar]
- 23.Choi A, Rim Y, Mun JS, and Kim H (2014) A novel finite element-based patient-specific mitral valve repair: Virtual ring annuloplasty. Bio-Medical Materials and Engineering, 24(1):341–47. [DOI] [PMC free article] [PubMed] [Google Scholar]
- 24.Abbasi M, Barakat MS, Vahidkhah K, and Azadani AN (2016) Characterization of three-dimensional anisotropic heart valve tissue mechanical properties using inverse finite element analysis. Journal of the Mechanical Behavior of Biomedical Materials, 62:33–44. [DOI] [PubMed] [Google Scholar]
- 25.Lee C-H, Amini R, Gorman RC, Gorman JH, and Sacks MS (2014) An inverse modeling approach for stress estimation in mitral valve anterior leaflet valvuloplasty for in-vivo valvular biomaterial assessment. Journal of Biomechanics, 47(9):2055–63. [DOI] [PMC free article] [PubMed] [Google Scholar]
- 26.Huang H-YS, and Lu J (2017) Biaxial mechanical properties of bovine jugular venous valve leaflet tissues. Biomechanics and Modeling in Mechanobiology:1–13. [DOI] [PubMed] [Google Scholar]
- 27.Kavanagh EG, Grace PA, Mcgloughlin TM, and Doyle BJ (2014) The biaxial mechanical behaviour of abdominal aortic aneurysm intraluminal thrombus: Classification of morphology and the determination of layer and region specific properties. Journal of Biomechanics, 47(6):1430–37. [DOI] [PubMed] [Google Scholar]
- 28.Schmid F, Sommer G, Rappolt M, Regitnig P, Holzapfel GA, Laggner P, and Amenitsch H (2006) Bidirectional tensile testing cell for in situ small angle x-ray scattering investigations of soft tissue. Nuclear Instruments and Methods in Physics Research Section B: Beam Interactions with Materials and Atoms, 246(1):262–68. [Google Scholar]
- 29.Sacks M (1999) A method for planar biaxial mechanical testing that includes in-plane shear. Journal of Biomechanical Engineering, 121(5):551–55. [DOI] [PubMed] [Google Scholar]
- 30.Billiar KL, and Sacks MS (2000) Biaxial mechanical properties of the natural and glutaraldehyde treated aortic valve cusp-part i: Experimental results. Transactions-American Society of Mechanical Engineers Journal of Biomechanical Engineering, 122(1):23–30. [DOI] [PubMed] [Google Scholar]
- 31.Sacks MS (2000) Biaxial mechanical evaluation of planar biological materials. Journal of Elasticity, 61(1):199. [Google Scholar]
- 32.Balguid A, Rubbens MP, Mol A, Bank RA, Bogers AJ, Van Kats JP, De Mol BA, Baaijens FP, and Bouten CV (2007) The role of collagen cross-links in biomechanical behavior of human aortic heart valve leaflets—relevance for tissue engineering. Tissue Engineering, 13(7):1501–11. [DOI] [PubMed] [Google Scholar]
- 33.Billiar K, and Sacks M (1997) A method to quantify the fiber kinematics of planar tissues under biaxial stretch. Journal of Biomechanics, 30(7):753–56. [DOI] [PubMed] [Google Scholar]
- 34.De Hart J, Peters G, Schreurs P, and Baaijens F (2004) Collagen fibers reduce stresses and stabilize motion of aortic valve leaflets during systole. Journal of Biomechanics, 37(3):303–11. [DOI] [PubMed] [Google Scholar]
- 35.Khoiy KA, and Amini R (2016) On the biaxial mechanical response of porcine tricuspid valve leaflets. Journal of Biomechanical Engineering, 138(10):104504. [DOI] [PubMed] [Google Scholar]
- 36.May-Newman K, and Yin F (1995) Biaxial mechanical behavior of excised porcine mitral valve leaflets. American Journal of Physiology-Heart and Circulatory Physiology, 269(4):H1319–H27. [DOI] [PubMed] [Google Scholar]
- 37.Grashow JS, Yoganathan AP, and Sacks MS (2006) Biaixal stress–stretch behavior of the mitral valve anterior leaflet at physiologic strain rates. Annals of Biomedical Engineering, 34(2):315–25. [DOI] [PubMed] [Google Scholar]
- 38.Stella JA, and Sacks MS (2007) On the biaxial mechanical properties of the layers of the aortic valve leaflet. Journal of Biomechanical Engineering, 129(5):757–66. [DOI] [PubMed] [Google Scholar]
- 39.Potter S, Graves J, Drach B, Leahy T, Hammel C, Feng Y, Baker A, and Sacks MS (2018) A novel small-specimen planar biaxial testing system with full in-plane deformation control. Journal of Biomechanical Engineering, 140(5):051001. [DOI] [PMC free article] [PubMed] [Google Scholar]
- 40.Dreyfus GD, Corbi PJ, Chan KJ, and Bahrami T (2005) Secondary tricuspid regurgitation or dilatation: Which should be the criteria for surgical repair? The Annals of thoracic surgery, 79(1):127–32. [DOI] [PubMed] [Google Scholar]
- 41.Anyanwu AC, and Adams DH Functional tricuspid regurgitation in mitral valve disease: Epidemiology and prognostic implications. Seminars in Thoracic and Cardiovascular Surgery; 2010: Elsevier. [DOI] [PubMed] [Google Scholar]
- 42.Navia JL, Nowicki ER, Blackstone EH, Brozzi NA, Nento DE, Atik FA, Rajeswaran J, Gillinov AM, Svensson LG, and Lytle BW (2010) Surgical management of secondary tricuspid valve regurgitation: Annulus, commissure, or leaflet procedure? The Journal of Thoracic and Cardiovascular Surgery, 139(6):1473–82. e5. [DOI] [PubMed] [Google Scholar]
- 43.Woo SL-Y, Orlando CA, Camp JF, and Akeson WH (1986) Effects of postmortem storage by freezing on ligament tensile behavior. Journal of Biomechanics, 19(5):399–404. [DOI] [PubMed] [Google Scholar]
- 44.Stemper BD, Yoganandan N, Stineman MR, Gennarelli TA, Baisden JL, and Pintar FA (2007) Mechanics of fresh, refrigerated, and frozen arterial tissue. Journal of Surgical Research, 139(2):236–42. [DOI] [PubMed] [Google Scholar]
- 45.Foutz T, Stone E, and Abrams JC (1992) Effects of freezing on mechanical properties of rat skin. American Journal of Veterinary Research, 53(5):788–92. [PubMed] [Google Scholar]
- 46.Liao J, Joyce EM, and Sacks MS (2008) Effects of decellularization on the mechanical and structural properties of the porcine aortic valve leaflet. Biomaterials, 29(8):1065–74. [DOI] [PMC free article] [PubMed] [Google Scholar]
- 47.Pierlot CM, Moeller AD, Lee JM, and Wells SM (2015) Biaxial creep resistance and structural remodeling of the aortic and mitral valves in pregnancy. Annals of Biomedical Engineering, 43(8):1772–85. [DOI] [PubMed] [Google Scholar]
- 48.Chuong C-J, and Fung Y-C Residual stress in arteries. Frontiers in biomechanics: Springer; 1986. p. 117–29. [Google Scholar]
- 49.Fung Y, Fronek K, and Patitucci P (1979) Pseudoelasticity of arteries and the choice of its mathematical expression. American Journal of Physiology-Heart and Circulatory Physiology, 237(5):H620–H31. [DOI] [PubMed] [Google Scholar]
- 50.Humphrey JD, Vawter DL, and Vito RP (1987) Quantification of strains in biaxially tested soft tissues. Journal of Biomechanics, 20(1):59–65. [DOI] [PubMed] [Google Scholar]
- 51.Toma M, Jensen MØ, Einstein DR, Yoganathan AP, Cochran RP, and Kunzelman KS (2016) Fluid–structure interaction analysis of papillary muscle forces using a comprehensive mitral valve model with 3d chordal structure. Annals of Biomedical Engineering, 44(4):942–53. [DOI] [PMC free article] [PubMed] [Google Scholar]
- 52.Ruifrok AC, and Johnston DA (2001) Quantification of histochemical staining by color deconvolution. Analytical and Quantitative Cytology and Histology, 23(4):291–99. [PubMed] [Google Scholar]
- 53.Hosseini SM, Wilson W, Ito K, and Van Donkelaar CC (2014) How preconditioning affects the measurement of poro-viscoelastic mechanical properties in biological tissues. Biomechanics and Modeling in Mechanobiology, 13(3):503–13. [DOI] [PubMed] [Google Scholar]
- 54.Jett S, Laurence D, Kunkel R, Babu AR, Kramer K, Baumwart R, Towner R, Wu Y, and Lee C-H (submitted) Biaxial mechanical data of porcine atrioventricular valve leaflets. Data in Brief. [DOI] [PMC free article] [PubMed] [Google Scholar]
- 55.Bernacca GM, O’connor B, Williams DF, and Wheatley DJ (2002) Hydrodynamic function of polyurethane prosthetic heart valves: Influences of young’s modulus and leaflet thickness. Biomaterials, 23(1):45–50. [DOI] [PubMed] [Google Scholar]
- 56.Christie GW, and Barratt-Boyes BG (1995) Age-dependent changes in the radial stretch of human aortic valve leaflets determined by biaxial testing. The Annals of thoracic surgery, 60:S156–S59. [DOI] [PubMed] [Google Scholar]
- 57.Christie GW, and Barratt-Boyes BG (1995) Mechanical properties of porcine pulmonary valve leaflets: How do they differ from aortic leaflets? The Annals of thoracic surgery, 60:S195–S99. [DOI] [PubMed] [Google Scholar]
- 58.Huang H-YS, Balhouse BN, and Huang S (2012) Application of simple biomechanical and biochemical tests to heart valve leaflets: Implications for heart valve characterization and tissue engineering. Proceedings of the Institution of Mechanical Engineers, Part H: Journal of Engineering in Medicine, 226(11):868–76. [DOI] [PubMed] [Google Scholar]
- 59.Wang Z, Golob MJ, and Chesler NC Viscoelastic properties of cardiovascular tissues. Viscoelastic and viscoplastic materials: InTech; 2016. [Google Scholar]
- 60.Lelovas PP, Kostomitsopoulos NG, and Xanthos TT (2014) A comparative anatomic and physiologic overview of the porcine heart. Journal of the American Association for Laboratory Animal Science, 53(5):432–38. [PMC free article] [PubMed] [Google Scholar]
- 61.Hinton RB, and Yutzey KE (2011) Heart valve structure and function in development and disease. Annual review of physiology, 73:29–46. [DOI] [PMC free article] [PubMed] [Google Scholar]
- 62.Lam J, Ranganathan N, Wigle E, and Silver M (1970) Morphology of the human mitral valve. Circulation, 41(3):449–58. [DOI] [PubMed] [Google Scholar]
- 63.Silver M, Lam J, Ranganathan N, and Wigle E (1971) Morphology of the human tricuspid valve. Circulation, 43(3):333–48. [DOI] [PubMed] [Google Scholar]
- 64.Labrosse MR, Jafar R, Ngu J, and Boodhwani M (2016) Planar biaxial testing of heart valve cusp replacement biomaterials: Experiments, theory and material constants. Acta Biomaterialia, 45:303–20. [DOI] [PubMed] [Google Scholar]
- 65.Chen L, Yin FC, and May-Newman K (2004) The structure and mechanical properties of the mitral valve leaflet-strut chordae transition zone. Journal of Biomechanical Engineering, 126(2):244–51. [DOI] [PubMed] [Google Scholar]
- 66.Sacks MS, and Yoganathan AP (2007) Heart valve function: A biomechanical perspective. Philosophical Transactions of the Royal Society of London B: Biological Sciences, 362(1484):1369–91. [DOI] [PMC free article] [PubMed] [Google Scholar]
- 67.Hadian M, Corcoran BM, Han RI, Grossmann JG, and Bradshaw JP (2007) Collagen organization in canine myxomatous mitral valve disease: An x-ray diffraction study. Biophysical Journal, 93(7):2472–76. [DOI] [PMC free article] [PubMed] [Google Scholar]
- 68.Cole W, Chan D, Hickey A, and Wilcken D (1984) Collagen composition of normal and myxomatous human mitral heart valves. Biochemical Journal, 219(2):451–60. [DOI] [PMC free article] [PubMed] [Google Scholar]
- 69.Alavi SH, Sinha A, Steward E, Milliken JC, and Kheradvar A (2015) Load-dependent extracellular matrix organization in atrioventricular heart valves: Differences and similarities. American Journal of Physiology-Heart and Circulatory Physiology, 309(2):H276–H84. [DOI] [PubMed] [Google Scholar]
- 70.Lee C-H, Zhang W, Feaver K, Gorman RC, Gorman JH, and Sacks MS (2017) On the in vivo function of the mitral heart valve leaflet: Insights into tissue–interstitial cell biomechanical coupling. Biomechanics and Modeling in Mechanobiology, 16(5):1613–32. [DOI] [PMC free article] [PubMed] [Google Scholar]
- 71.Stevanella M, Votta E, Lemma M, Antona C, and Redaelli A (2010) Finite element modelling of the tricuspid valve: A preliminary study. Medical Engineering and Physics, 32(10):1213–23. [DOI] [PubMed] [Google Scholar]
Associated Data
This section collects any data citations, data availability statements, or supplementary materials included in this article.


