

Abstract
Cells sense the rigidity of their environment through localized pinching, which occurs when myosin molecular motors generate contractions within actin filaments anchoring the cell to its surroundings. We present high-resolution experiments performed on these elementary contractile units in cells. Our experimental results challenge the current understanding of molecular motor force generation. Surprisingly, bipolar myosin filaments generate much larger forces per motor than measured in single molecule experiments. Further, contraction to a fixed distance, followed by relaxation at the same rate, is observed over a wide range of matrix rigidities. Lastly, step-wise displacements of the matrix contacts are apparent during both contraction and relaxation. Building upon a generic two-state model of molecular motor collections, we interpret these unexpected observations as spontaneously emerging features of a collective motor behavior. Our approach explains why, in the cellular context, collections of resilient and slow motors contract in a stepwise fashion while collections of weak and fast motors do not. We thus rationalize the specificity of motor contractions implied in rigidity sensing compared to previous in vitro observations.
Integrin-mediated rigidity sensing is a rich system for discovering novel features of the interplay between molecular biology and mechanics [1, 2]. In response to differential substrate rigidity, integrin based adhesions modulate a variety of downstream signals that control processes such as cell growth, death, migration [3, 4] as well as invasion [5, 6] and differentiation [7].
Rigidity-sensing in early spreading cells is performed by sarcomere-like actomyosin contractile units anchored to integrins via the adaptor protein α-actinin [2]. One revealing aspect of cell rigidity sensing is that these contractile units scale force production with substrate rigidity to give constant displacements [8].
Here, we show on heterogeneous rigidity landscapes with up to twenty-fold differences in rigidity that contractions are always of the same rate (3 nm.s−1) and strain (around 60 nm per pillar) with a nearly constant overall density of active myosin heads. Over rigid pillars, the observation of a fixed strain implies the development of a large force per motor, which can be considerably larger than the forces previously measured in single molecule experiments based upon analyses of the number of active motor heads within the contractile unit. In addition, our new rigidity patterning technique with sub-cellular precision enables unambiguous comparison of the properties of contractile units in the same cell as a function of the substrate rigidity. Our experimental setup provides a quantitative estimate of the force generated per myosin II head within the large contractile units that are responsible for rigidity sensing, which provides insight into the biologically relevant patterns of force generation.
We find that, over rigid pillars, the maximal exerted force can exceed 40 pN per myosin head. This is nearly an order of magnitude larger than measured by in vitro experiments (in the 1.3 to 3.7 pN range, see [1] and references therein) and raises many questions about how such sarcomeric units function.
In addition, we observe that contractile motor assemblies contract pillar pairs in a stepwise fashion, with 2.5 nm steps (i.e. approximatively half the actin filament monomer periodicity) and at a characteristic 3 Hz frequency. Evidence for such 2.5 nm steps during the contraction phase are presented in [? ]. Here, guided by the prediction of our theoretical model, we further find that these 2.5 nm steps also occur in the relaxation phase. Such stepping behavior is particularly surprising given the large number of motors at work in an elementary contractile unit.
A simple model explains the large force generation per motor. We assume that a myosin motor needs to cross a conformational energy barrier to move to the next binding site on an actin filament [9]. The hydrolysis of adenosine triphosphate (ATP) provides the energy that is then converted into the mechanical work needed to perform a step; the corresponding force generated is given by the height of the barrier energy divided by the characteristic step length (i.e. 2.5 nm here). It is generally believed that, in order for a myosin head to move, the height of the step energy barrier needs to be lower than the energy of hydrolysis of an ATP molecule; and the stepping rate corresponds to the ATPase hydrolysis rate. Here, we present a model to explain these observations by assuming (i) that the stepping rate (in the 3 Hz range) is significantly lower than a typical ATPase hydrolysis rate (in the 100 Hz range [9]) and (ii) that the barrier energy crossed is larger than the ATP hydrolysis free energy (in the δµ ≈ 20 – 30 kbT range [10]). Indeed, our experiments show that forces as high as 60 pN per motor head are reached, which corresponds to the release of energies in the 60pN × 2.5 nm ≈ 40 kbT range. Such argument can explain both experimental observations of a large force and low stepping rate by assuming that the energy barrier can be larger than the energy of a single ATP reaction energy. In this case, most ATP hydrolysis events are unsuccessful in generating a step; but with thermal fluctuations, some ATP hydrolysis events cause energy barrier crossing. Thus, the ATP consumption rate (i.e. a barrier crossing attempt rate) is significantly larger than the stepping rate (i.e. the barrier crossing success rate). This view also predicts a large force generation, since the available energy after a successful step is relatively high. In agreement with the observation of lower contraction velocities in the presence of tropomyosin2.1 [8], we suggest that tropomyosin2.1 coating of actin increases the barrier crossing energy compared to the in vitro situation.
In this paper, our focus is on the collective level. We consider a simplified and coarse-grained description of single-motor stepping, in a two-state model. This approach is motivated by the success of two-state models in predicting the appearance of spontaneous oscillations in motor assemblies connected to an elastic element [11–16]. Each state represents a particular motor configuration set; transitions between these configurations occur through ATP hydrolysis events. Similar to predictions of spontaneous oscillations, this two-state model also can explain the similarity of the observed contraction and relaxation phases; in addition, our model predicts the experimental observation of 2.5 nm steps both in the contraction and relaxation phases. Our model explains why such step-wise collective contractions are specific to assemblies composed of high-force generating and ”slow” motors and why, conversely, smaller assemblies of ”fast” motors do not exhibit such stepping behavior – thus explaining differences between our experimental results and previous in vitro measurements.
I. TENSION GENERATION IS HIGHLY LOCALIZED AND TIGHTLY REGULATED
Rigidity sensing contractions were well characterized in early fibroblast spreading on fibronectin [2, 8, 17–20]. After an early rapid spreading phase, sarcomere-like contractile units appeared within 10–15 minutes of contact (see Fig. 1 and Movie 1).
Figure 1.
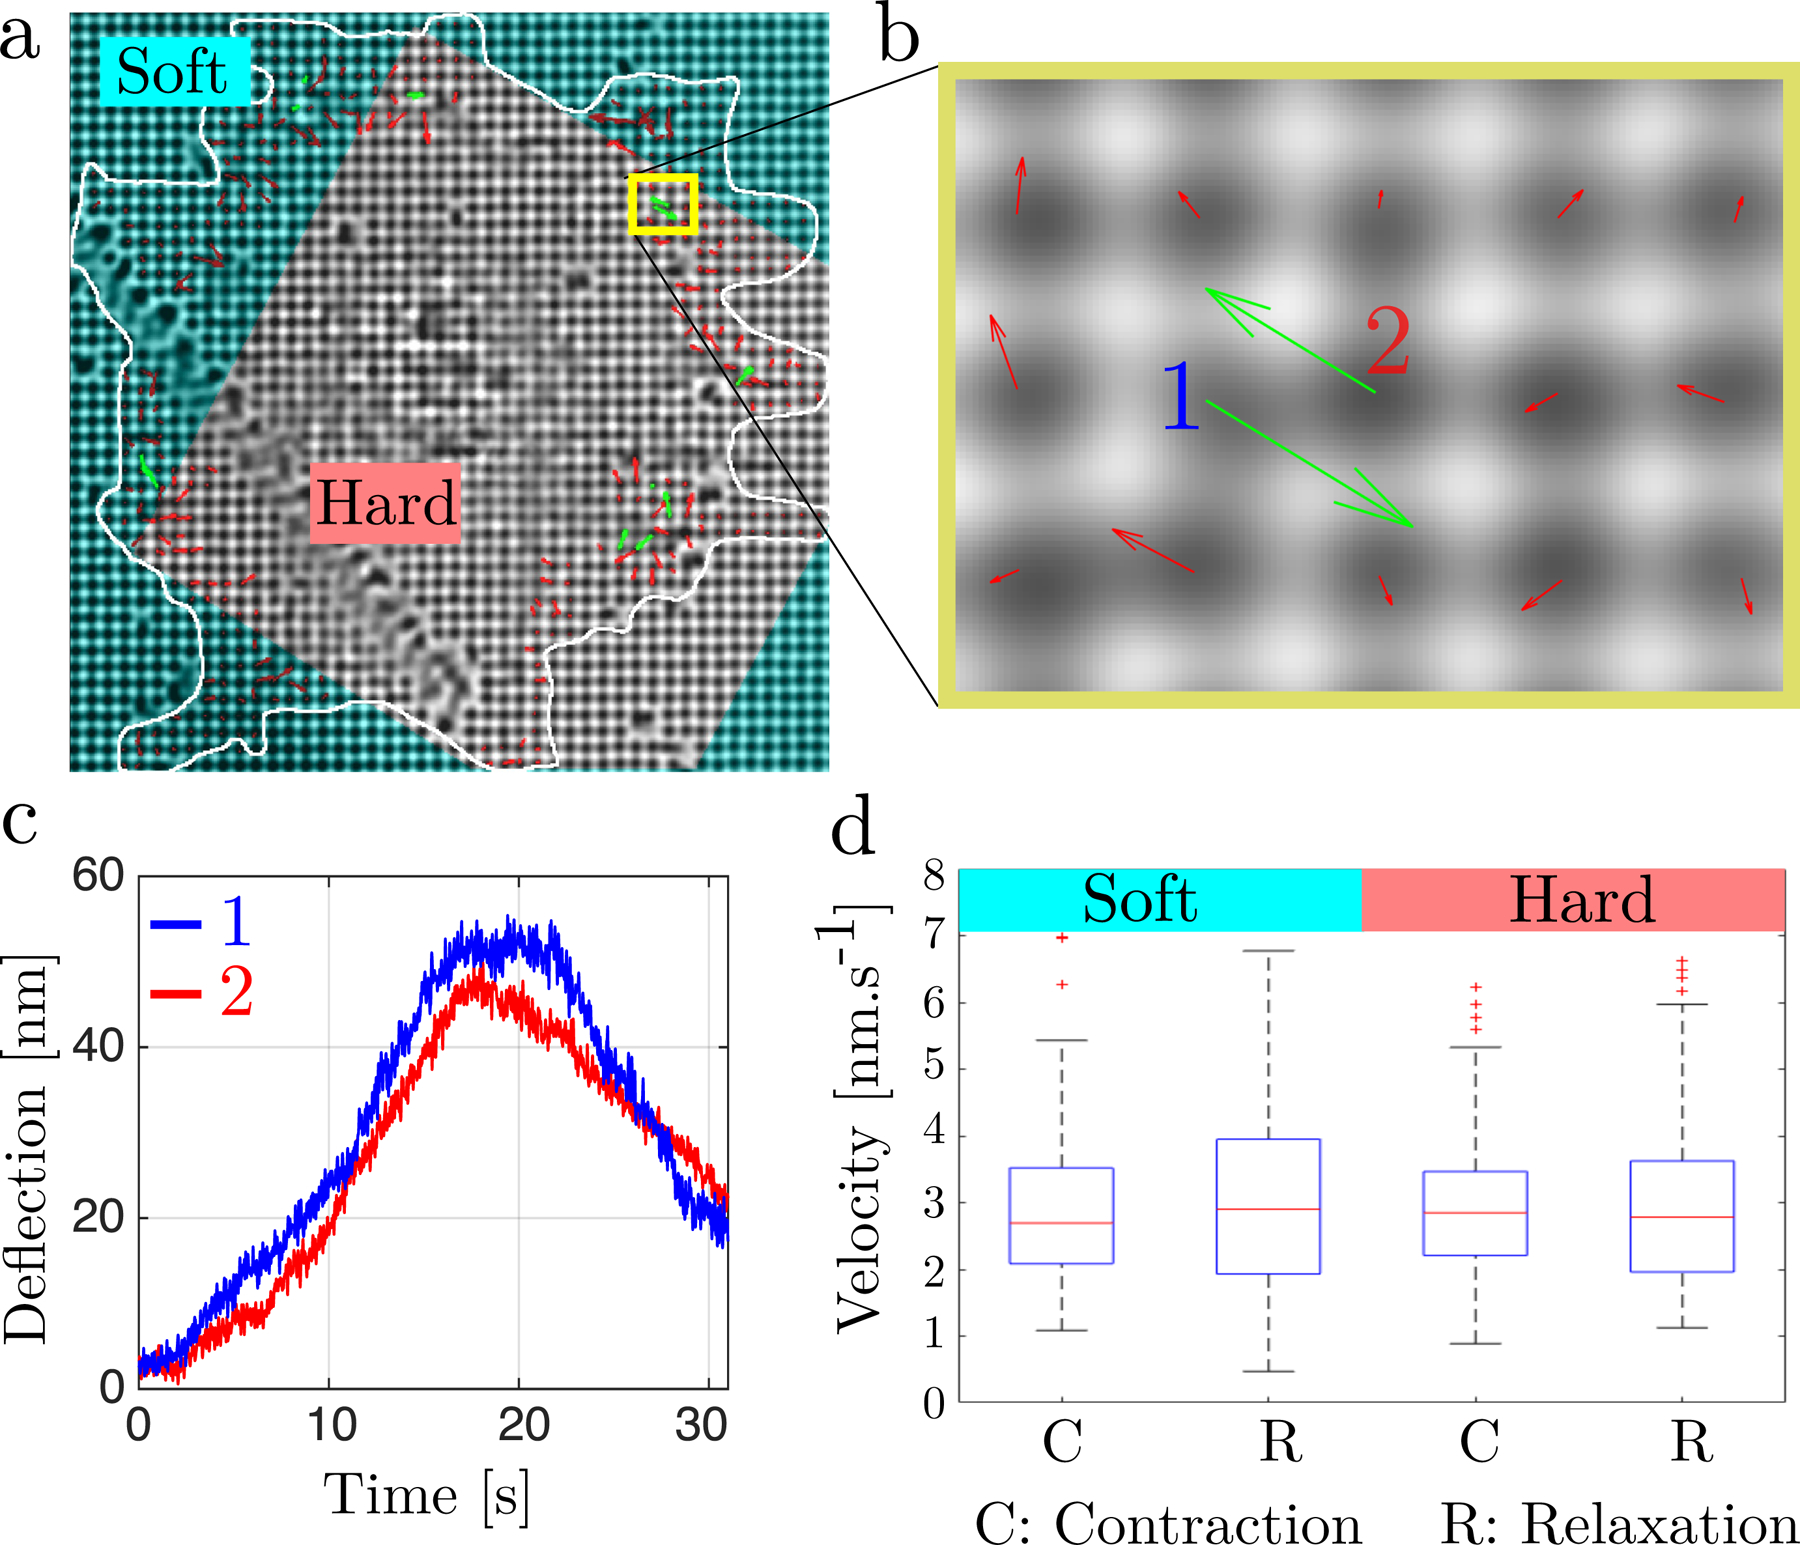
(a) Bright-field image of a cell spanning over rigidity separation lines (white line: contour of the cell) with superimposed pillar displacement field: (red arrows) uncoordinated pillar displacements and (green arrows) displacement vectors for anti-correlated pillar pairs. The cyan-shade region marks the region with softer pillars. (b) Blow-up of (a) showing anti-correlated pillars denoted 1 and 2. (c) Pillar deflection traces of the anti-correlated pillars 1 and 2 from (b). (d) Single pillar displacement velocities measured during the contraction and relaxation phases, both for soft (K = 3 pN.nm−1) and hard (K = 60 pN.nm−1) pillars (see Method for averaging procedure). Sample size: N > 500 for each condition from over 20 total cells over 5 different experiments.
We used pillars of 500 nm diameter, since mouse embryonic fibroblasts (MEFs) spread on those pillars as if they were on a continuous surface of the same elastic modulus(see Fig. 1a). Deep UV treatment enabled a tunable increase in pillar bending stiffness up to twenty fold, from K = 3 pN.nm−1 to K = 60 pN.nm−1 (see Methods section). Contractile units displaced pillars by about 60 nm both on hard pillars with rigidity K = 60 pN.nm−1 and on soft pillars with rigidity K = 3 pN.nm−1 (see SI Fig. S4). Further, the contraction and relaxation trajectories of single pillars occurred at nearly constant velocities of around v = 3 nm.s−1 both for soft and hard pillars (Fig. 1d). Thus, the contractility of these sarcomere-like units was not influenced by substrate rigidity. Surprisingly, a twenty-fold increase in the force on the contractile units did not alter the kinetics of contraction at this slow velocity, whereas most myosin contractions have an inverse force-velocity relationship reflecting slower release of myosin-ADP heads from actin with higher force [21–24]. However, the sarcomeric units at the leading edge of spreading cells showed no velocity dependence on load and the unloading velocity was similar. Thus, a factor other than force controlled the velocity of contraction, and tropomyosin2.1 inhibited the velocity of movement [8].
To dissect the contractions in more detail, we measured pillar displacements at high temporal and spatial resolution (100 Hz). Following Ref. [8], we detected individual myosin stepping events in traces of pillar displacement. Myosin stepping size was independent of pillar stiffness (see Fig. 4), and hence resistance load, in contrast with prior in-vitro findings [10]. Since both pillars moved simultaneously [8], a total 2.5 nm we postulated that there were step-wise displacements of the two pillars. Surprisingly, steps were also observed during the relaxation phase (see Model Prediction section) and the same 1.2 nm step size was found during both contraction and relaxation phases on hard and soft pillars. (SI Fig. S3). Thus, a total 2.4 nm step-wise displacements (since both pillars move simultaneously [8]) were a constant feature of contraction and relaxation.
Figure 4.
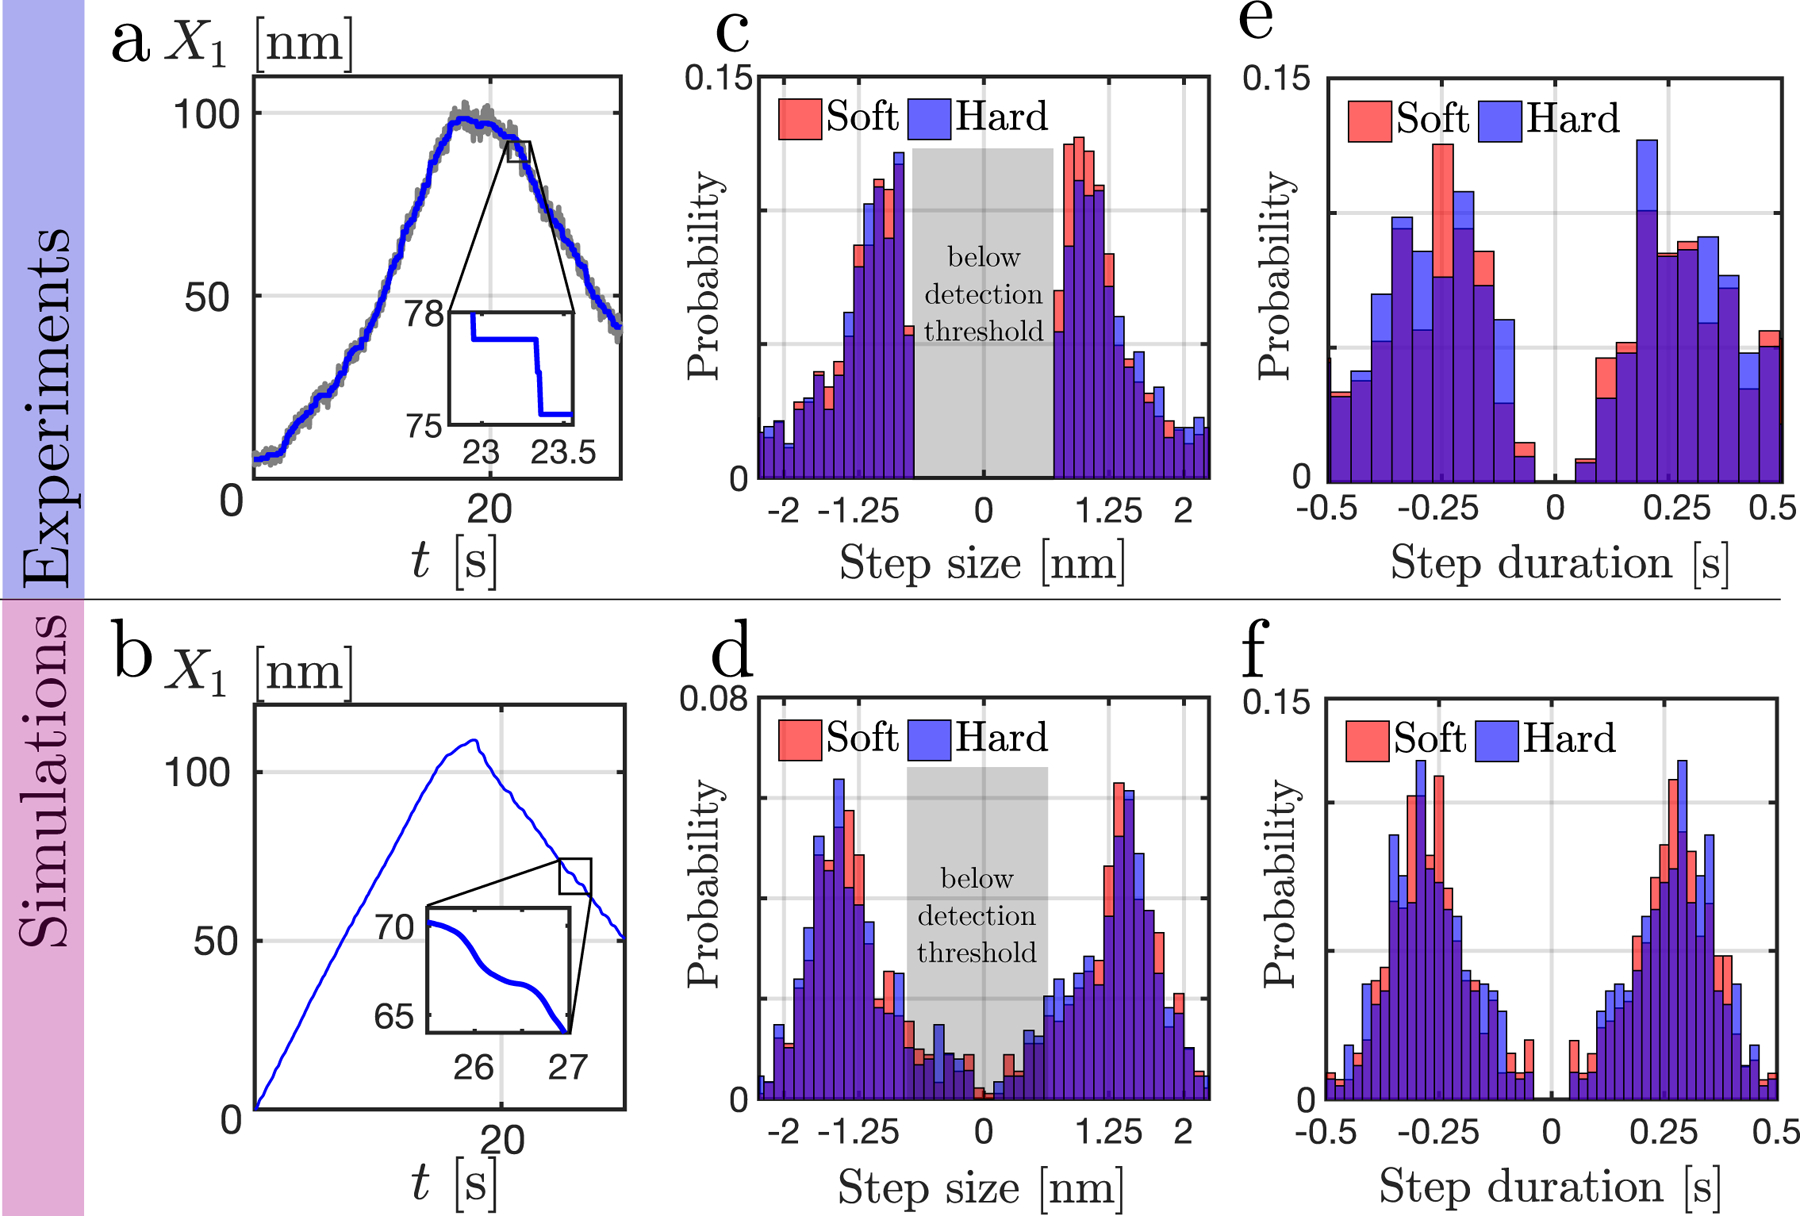
Comparison between experiments (top row) and simulations with localized transition rates at the minimum of the energy profiles (bottom row). Left column (a, b): total deflection of the two pillars with time. (a–inset) zoom on the step detection output (see Methods). Middle column (c, d): histogram of the step length for soft (red) and hard (blue) pillars. Negative values indicate steps during the relaxation phase. Right column (e, f): histogram of the duration between two steps, with negative values for steps during the relaxation phase. Soft pillar: K = 3 pN.nm−1; Hard pillar: K = 60 pN.nm−1 (see other parameter values in SI Tab. III). For each condition N = 767 steps from over 11 cells across 5 different experiments.
II. MYOSIN FILAMENT DENSITY IS INDEPENDENT OF SUBSTRATE RIGIDITY
To check if myosin activity, that was needed for integrin-based rigidity sensing [4] was altered with rigidity, we fixed cells during early spreading (20–30 min) and stained for myosin light chains doubly phosphorylated on T18/S19, which marked the highest activation state for non-muscle myosin II [25]. Image processing revealed local puncta of phospho-myosin staining in the periphery, indicative of single myosin bipolar filaments (Fig. 2a). The number of active myosin molecules per filament was determined by bleaching puncta until quantized steps in fluorescence intensity levels revealed the intensity of a single fluorophore (Fig. 2b). Using the average secondary antibody labeling density from a measure of the number of fluorophores per secondary antibody (see Fig. S8g), we estimated that the number of active myosin heads in each bipolar myosin filament was around 56 bisphosphorylated myosin heads on average in each bipolar filament, or 28 per half-filament (Fig. 2c; see also SI Fig. S8). This number was in perfect agreement with prior electron microscopy measurements of human platelet myosin mini-filaments [26] and in close agreement with measurements of fibroblast contractile units in lamellipodia [8, 27]. This number was the same for filaments in regions on soft pillars and in regions on continuous PDMS, and was thus invariant over 3 orders of magnitude in rigidity (Fig. 2c). The fluorescence signals of filament puncta were analyzed for area and length variations in soft and rigid regions, which further indicated that single puncta were single myosin bipolar filaments with an average size of about 60 active myosin heads. (Fig. 2c). The density of filaments was also independent of the substrate rigidity at 0.3 ± 0.1 per square micron of lamellipodial area, regardless of pillar rigidity. After 1–2 hours, the level of active myosin was significantly higher over rigid areas and cells moved toward those rigid areas as in durotaxis. However, there was no evidence of greater active myosin recruitment to lamellipodial regions over rigid pillars than soft at early times when local contractions occurred, nor did the balance of bulk lamellipodial myosin phosphorylation/dephosphorylation change in response to substrate rigidity. Thus, the measured number of active myosin heads per filament was consistent with previous em measurements and invariant with rigidity. In hard-pillar regions, however, the proportion of multi-filament puncta scaled with substrate rigidity. (Fig. 2d). Therefore, while local substrate rigidity did not change local levels of myosin activation, rigid regions caused multi-filament assemblies, that contributed to higher forces for peak displacements of stiff pillars.
Figure 2.
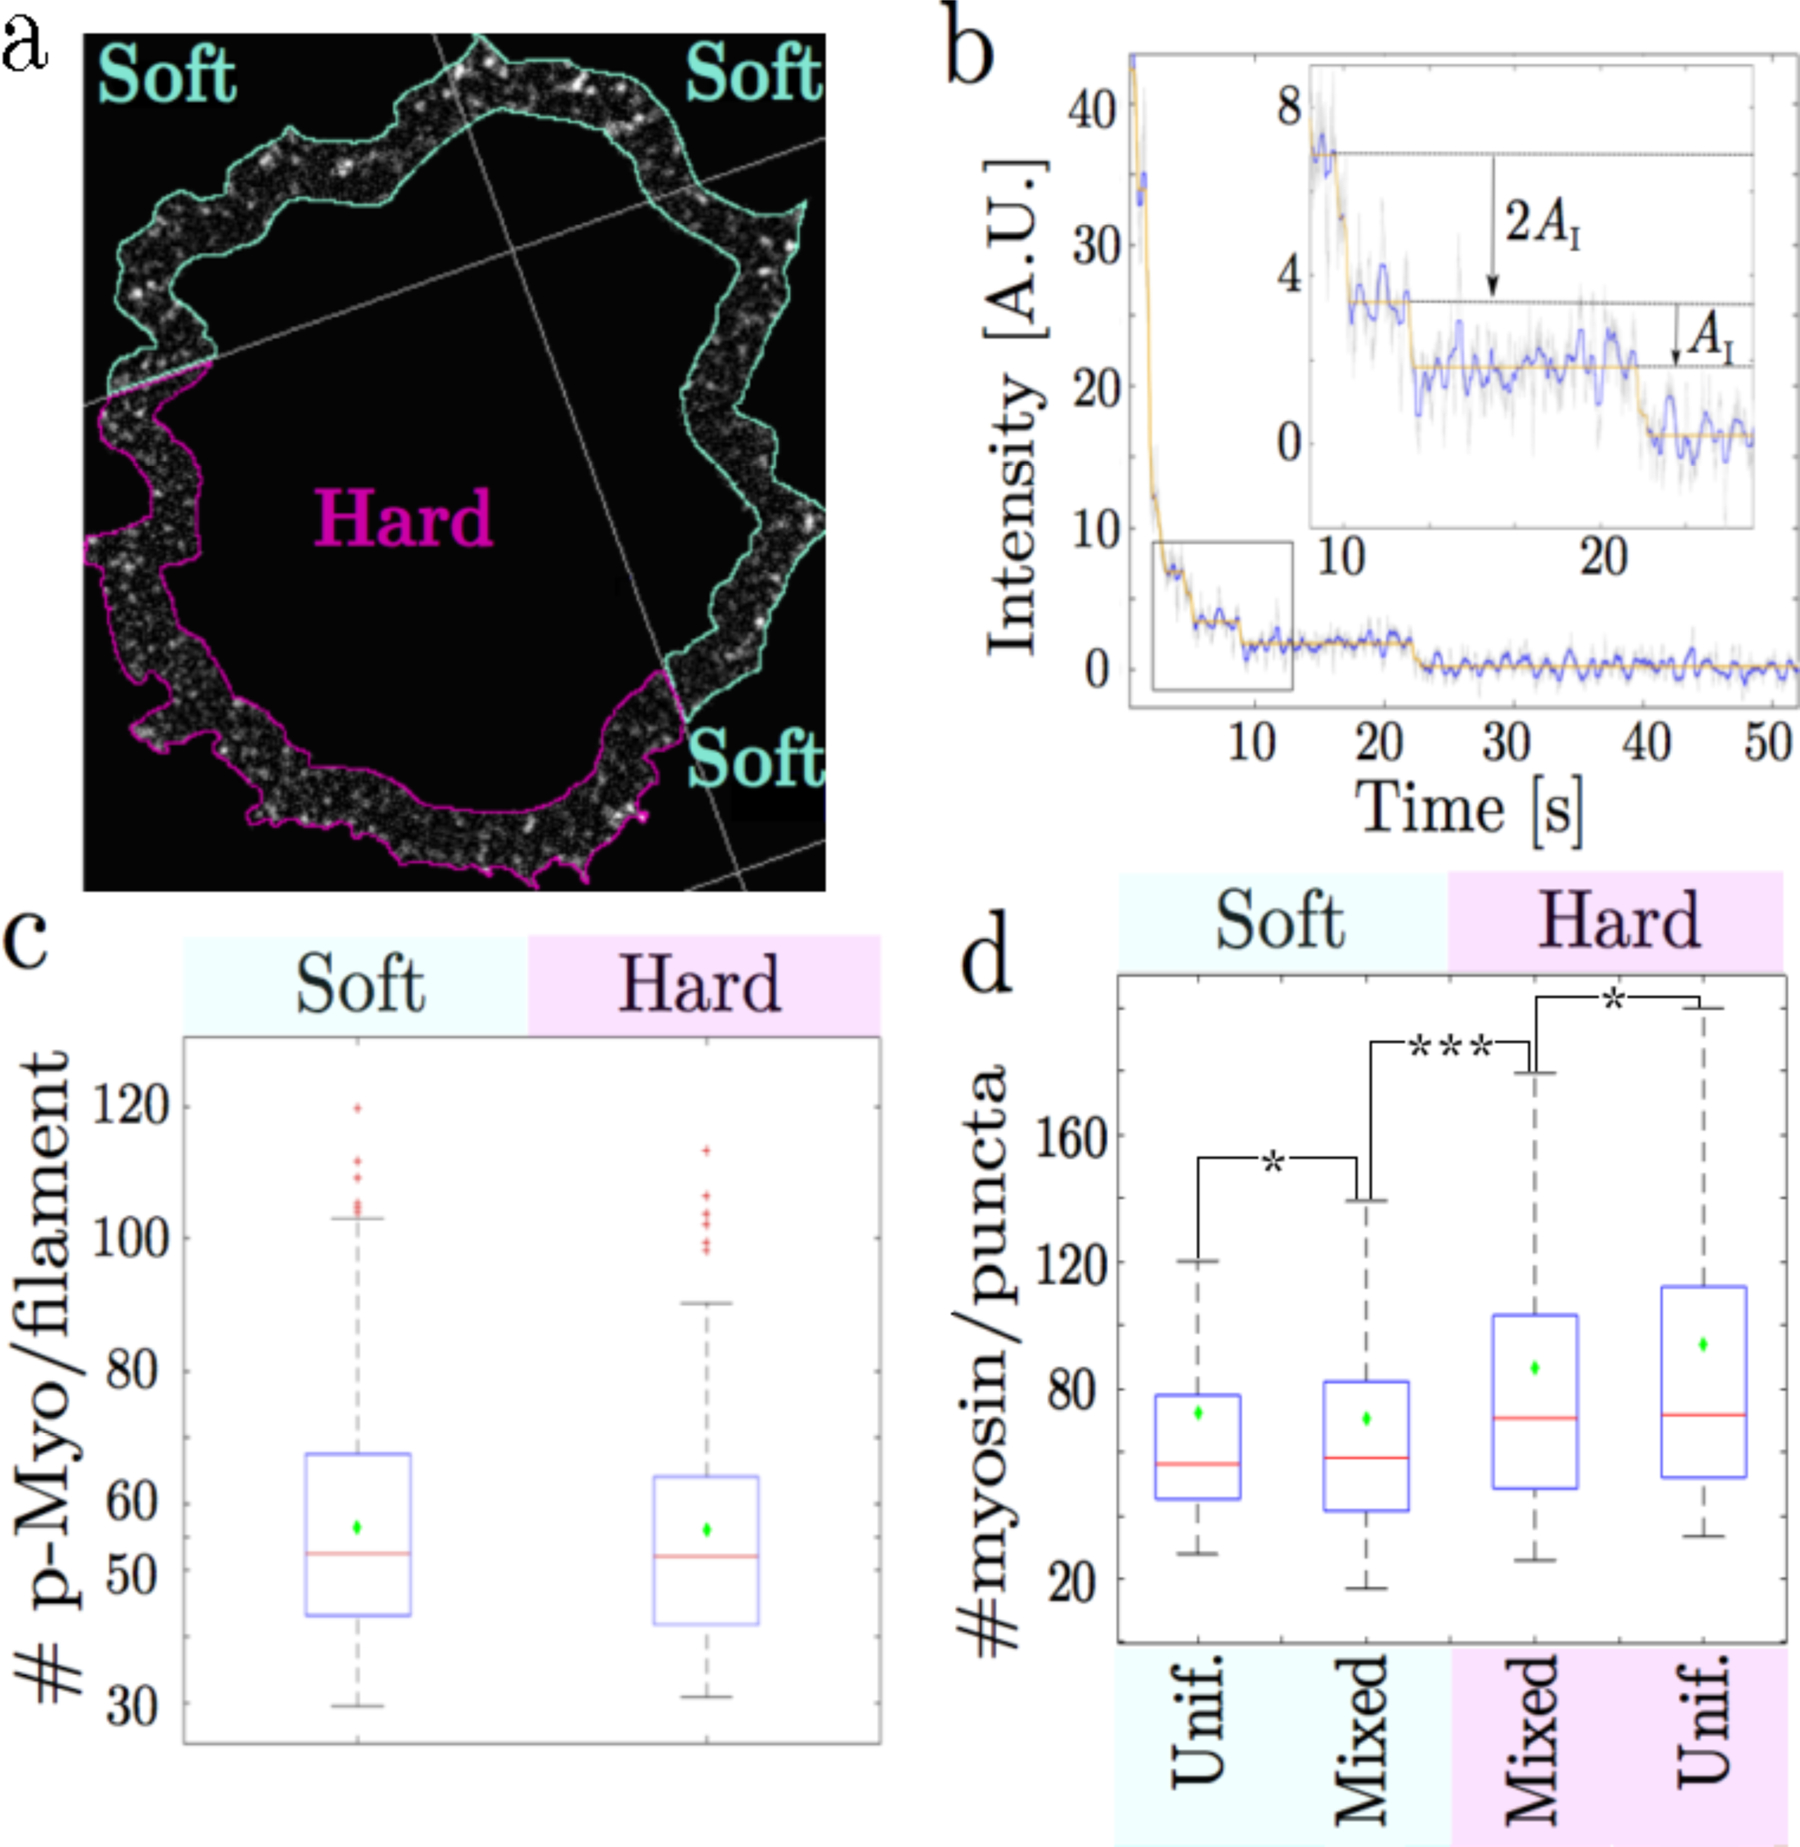
(a) pMLC staining in the lamellipodium of a cell spanning a rigidity boundary. The density of myosin filaments is uniform regardless of substrate rigidity. (b) Bleaching trace of a p-MLC punctum over 6000 exposures of 20 ms duration (raw data in grey, sliding median filter in blue, step fitting in orange). (b-insert) focus on the indicated part of the curve – double and single bleaching events are highlighted. (c) Average myosin filament size in the lamellipodium for cells spread on soft pillars (8.6 kPa and cells spread on continuous PDMS (6 Mpa): (red line) median and (green diamonds) mean values. The mean number of myosin heads per filament is approximatively 56 in both conditions ( ±2). Total number of filaments is n > 168 obtained from at least 10 cells for each substrate rigidity (d) Analysis of all lamellipodial p-MLC puncta shows that the proportion of myosin in multi-filament arrays is greater on more rigid surfaces, regardless of if the surface is uniform or dual rigidity. Only 1/5 of the puncta over soft surfaces have more molecules than two standard deviations above the single filament mean. Over hard surfaces, 1/3 of the puncta are above two standard deviations over the single filament mean. Red lines: median; green diamonds: mean; p-values: * : p > 0.05, *** p = 0.034. Soft pillar: K = 3 pN.nm−1; Hard pillar: K = 60 pN.nm−1. The ”Hard Unif.” category refers to uniformly flat PDMS. The lack of a difference in puncta size between stiff pillars and flat PDMS suggests our stiff pillars are above the stiffness level at which cells can differentiate rigidity.
III. MYOSIN FILAMENTS ASSOCIATED WITH ACTIVE SARCOMERIC UNITS
To determine when multiple filaments associated with the rigid pillar contraction units, cells were fixed during their rigidity sensing phase on dual rigidity platforms. This provided a snapshot of both the pillar displacements and the active myosin distribution. In soft pillar regions, single active filaments of average size pulled softer pillars to their maximal displacement. In contrast, on hard pillars, multiple filaments (2–3 filaments with 100–170 active heads) were associated with contractile units at peak displacements (see SI). Thus, the high force on the rigid pillars at maximum displacement (3600 pN) was generated by 100 to 170 active myosin heads. Since the bipolar filaments were symmetrical, this force was born by half that number of active myosin heads giving a maximum force of 40 to 60 pN per head.
IV. A COARSE-GRAINED MODEL FOR SINGLE-MOTOR STEPPING
The results described above raise the following theoretical challenge: (1) why is the deflection curve almost symmetrical, with equal velocities during the contraction and relaxation phases? (2) why is the amplitude of the total displacement constant (120 nm), irrespective of the pillar elasticity? (3) why is the force exerted per motor so large compared to in vitro estimates? (4) why do pillar contractions occur in steps, even though many motors are involved?
General framework
To address the challenges listed above, we adapted a two state model introduced earlier by Julicher et al. [13]. This formalism provided a simplified view of the multiple step-wise chemical reactions involved in the ATP-cycle (see [12, 28]). As was known, non-muscle myosin II, bipolar filaments contained two sets of myosin heads connected by a rigid, heavy chain domain, which interacted with anti-parallel actin filaments. In the following, the position of a myosin is labeled by its coordinates x corresponding to the contact point between this myosin and the backbone (see Fig. 3). We model its interaction with the double stranded actin filament (strands 1 and 2) through spatially varying potentials W1(x) and W2(x) which include the binding and motor conformational changes in free energies. Since each actin strand in the filament is composed of repeated G-actin monomers at l = 5 nm intervals along the filament [9], the potentials must follow the periodicity: Ws(x) = Ws(x + l), where s = 1, 2. In addition, since the two strands are shifted by half an actin period, the potentials must also satisfy the relation W1(x) = W2(x + l/2).
Figure 3.
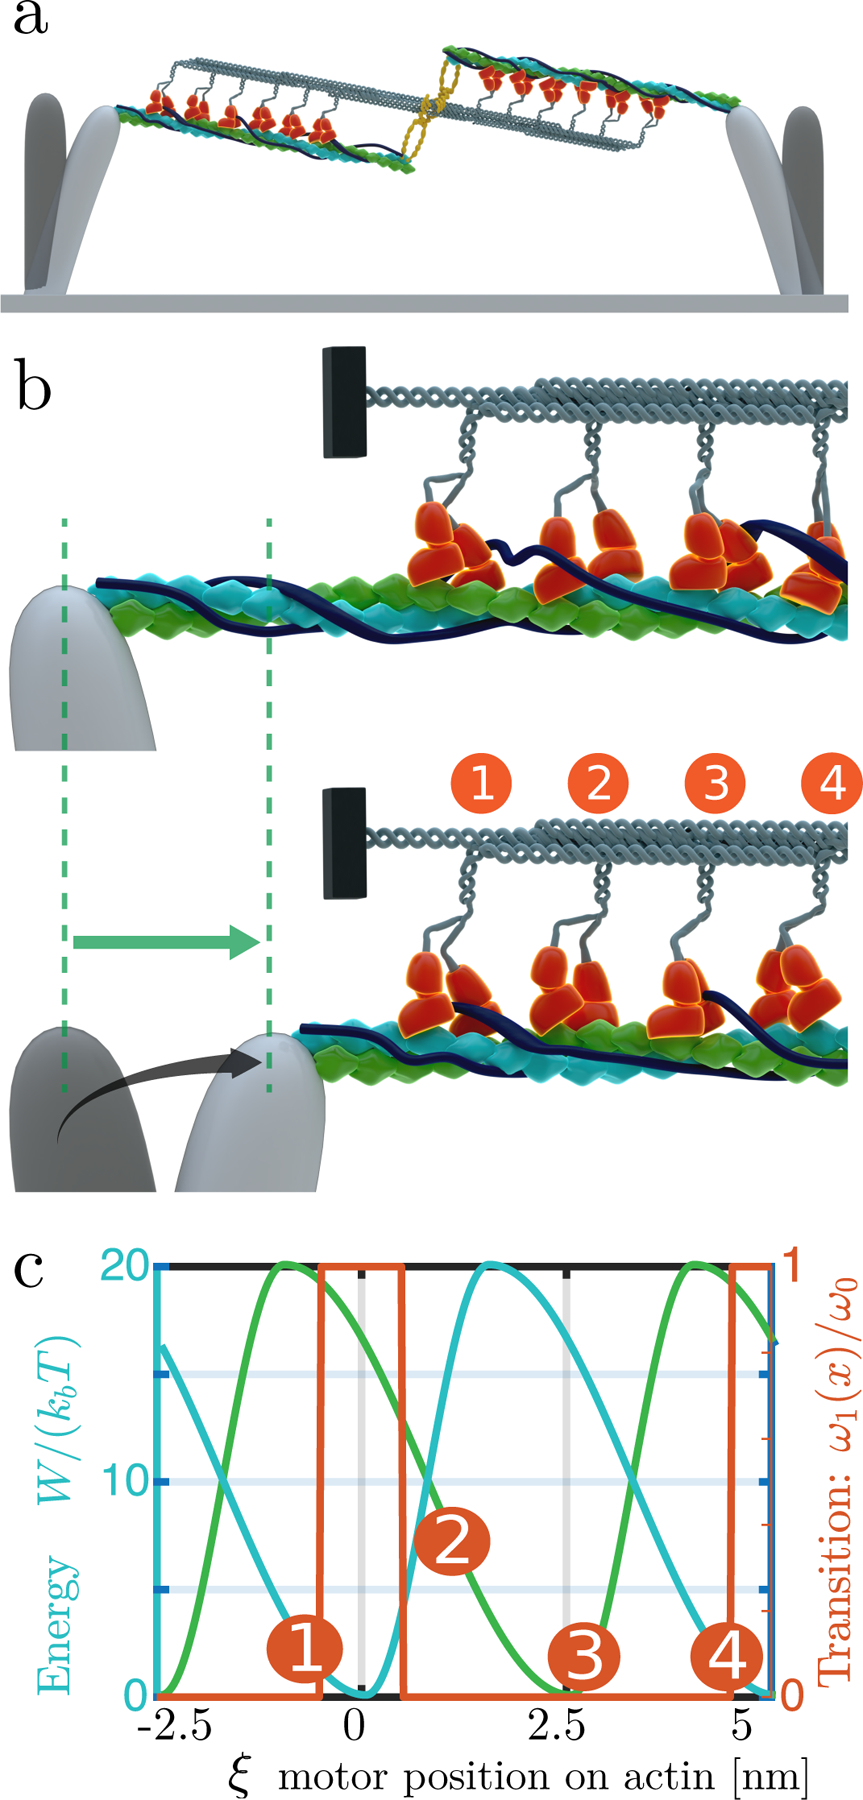
Sketch of the model (a) Working model of contractile units, composed of doubled stranded actin filaments (green and blue helices) contracting by myosin heads (orange). An AXL tyrosine kinase (yellow) crosslinks the myosin thick filament to the actin strands since it binds to both myosin and to tropomyosin 2.1 on the actin filaments. (b) Blow-up of the left-hand side pillar; the four represented myosin motors are not synchronized to be within the same configuration (c) Proposed hand-over-hand model: at any time, one head is bound while the other is moving towards the next binding site. The situation is described by two shifted potentials W1 (blue line) and W2 (green line) describing the global interaction of the two heads with actin, which are considered to be functions of the coordinate x that represents the position of the actin filament with respect to the myosin tail (point of connection to the backbone); (ω1, orange curve) in simulations, we consider a transition rate that is maximal in the region of minimum configuration energy; this models the observation that myosin molecules in the low energy binding sites favor ATP hydrolysis. During a step, a myosin head initially at the rear takes the lead, e.g. the motor with configuration 1 eventually reaches configuration 3.
To model the effect of ATP-binding, which provides the energy to displace the myosin head from one binding site to the next, we assume that a head 1 can transition to the next free actin on the filament independent of other heads. Transitions occur with a probability per unit time denoted ω1. The rate function ωi is maximal where Wi is minimal (binding sites); the detailed balance condition is broken, as required for a non-equilibrium process.
Collective assembly
Given the high elastic rigidity of thick filaments in muscle sarcomeres [9], we postulate that head displacements are fixed. We further postulate that myosin heads are distributed at regular intervals: motor tail coordinates are xj(t) = X(t) + L0 + q(j − 1), with 1 ≤ j ≤ N (N : total number of motors) and X(t) the total pillar deflection (see Fig. 3). Electron microscopy studies of skeletal muscle further indicate that q = 14.3 nm [29]. Since q is not a clear multiple of l ≈ 5 nm, the myosin and actin filaments do not seem to be commensurate with each other and the sequence {ξj} of cyclic coordinates ξj = xj mod (l) tends to cover the interval [0, l] uniformly.
Dynamics
The dynamics of the pillar deflection X(t) results from force balance
| (1) |
between: (i) the friction force , which is resisting the motion of the actin filament; (ii) the externally applied force fext(X), which includes pillar elasticity, and (iii) the sum of the forces exerted by each motor on the myosin backbone where sj = {1, 2} refers to the conformation of the j-th motor.
Simulations
Similar to experiments, the velocity of pillar deflection curves is nearly constant in both the contraction and relaxation phases (see Fig. 4b). The contraction-relaxation process appears as one period of the oscillations predicted in [12, 13] and observed in skeletal muscle myofibrils [11] and in vitro actomyosin systems [14].
In the simulated trajectories, there are steps with l/2 actin period (see Fig. 4), in agreement with experimentally observed 2.5 nm steps. In the Supp. Movie 2, we show that step dynamics are reminiscent of an avalanche process. The motion of the motors alternates between fast and slow regimes: during the slow regime, motors in the low energy state (i.e. at a binding site) transition to the higher energy state (i.e. via consumption of an ATP). This progressive increase in energy of the assembly will be dissipated during the fast regime. The step length and waiting time statistics are similar to the ones observed in experiments (see Fig. 4).
In simulations where the external force is simply the force exerted by pillars, the maximum displacement depends linearly on the pillar spring constant: what determines the cross-over between contraction and relaxation is force, not displacement. This disagrees with experimental observations. However, the force acting on filaments may not be due to pillars only. In particular, previous experiments have shown the crucial role of the receptor tyrosine kinase AXL in regulating the maximal pillar deflection [20], potentially through steric hindrance. Here, we consider that AXL contributes to a non-linear elastic term fext(X) = KAXLX, where , beyond a deflection strains X > lAXL (i.e. fext(X) = 0 for X > lAXL). With this improvement, our simulations indicate a maximal summed displacement Xmax ≈ 120 nm independent of pillar elasticity K, in good agreement with experiments.
Analytical framework
The question is now whether steps depend on the number of motors and are evident with a large number of motors. In that case , the motor population N1 in state 1 can be expressed as , where the density P1 follows a Fokker-Planck equation
| (2) |
and the myosin filament is determined through the force balance equation Eq. (1) (see Methods). We derived an analytical solution of Eqs. (1) and (4) in Fourier space; simplifying the problem by truncating energy and transition rate profiles to their first Fourier mode (see Methods).
Solving Eq. (4) numerically, we found that trajectories X(t) calculated with parameters corresponding to experimental conditions displayed steps with l/2 period (see Movie 3). Thus, the stepping behavior is still observed in a large number of motor limit.
Mapping the dynamics onto that of a massive particle in a potential energy, we found that the step size converged to l/2 in the low velocity/large force limit relevant to experimental conditions (see Methods). The same theory predicts that for ”fast” motors no such steps should be observed.
Steps correspond to a transient behavior: as represented in Fig. 5a, the time evolution X(t) exhibits steps, but only at short times ωt < 3 after initialization at X(t) = 0. During the contraction phase, the steps dis-appear as the velocity becomes nearly constant. Yet the transient stepping behavior can involve a large number of events in the ”slow” motor limit, which corresponds to the case of low transition rates, hence to our experimental regime. Indeed, the presence of tropomyosin decreases the transition rates ω by several orders of magnitude compared to motility assays, setting the system in a highly non-linear regime (see SI, as well as [30]). Interestingly, in motility assays, steps are not observed with even several motors [31] in agreement with our prediction concerning ”fast” motors.
Figure 5.
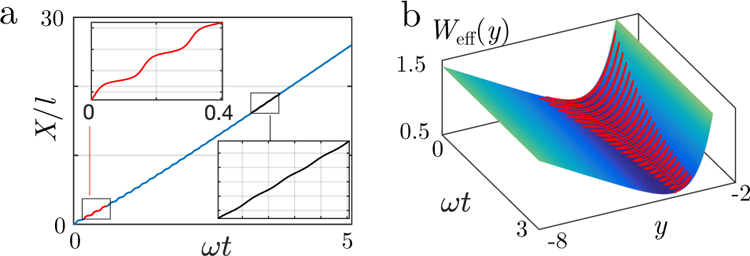
Analytical description for the 2.5nm step behavior (a) Displacement as a function of time, in units of l, in the absence of an external force (K = 0; µ = 103). The stepping behavior with half-actin periodicity is visible at short times (ωt > 1, red frame) but vanishes at longer times (ωt > 3, black frame). (b) The step behavior can be mapped into the swing motion of particles in an effective potential Weff : (solid red line) trajectory of Fig. (a) in the space (ωt, y, Weff (y)). Since the amplitude of the oscillations in y weakly dampens with time, the step behavior is visible during a long-lived transient.
One important conclusion of this model is that the relaxation phase also starts as a transient state because of the initial sharp sign change of the averaged velocity. Hence, steps are expected in the relaxation phase.
Model prediction
We analyzed the experimental relaxation curve X(t) with the same step finding algorithm as we used for the contraction. As predicted, the relaxation steps were nearly identical to those during contraction (see Fig. 4). They had the same average half period length and similar statistical distributions, thus confirming the predictability of this model.
V. RIGIDITY SENSING AS AN EMERGENT PHENOMENON
Our analysis of the two-state model of molecular motor collections allows us to understand the observed displacements as a collective behavior of the contractile unit motors. The model takes into account the role of the tyrosine kinase AXL in regulating displacement and the decreased rate of motion due to tropomyosin. Although derived from the early prediction of oscillatory behavior of motor collections [13], the model contains new and unexpected features, such as the appearance of steps as a transient behavior and the switch between contraction and relaxation determined by a length rather than a force.
Our model makes one further prediction that the myosin assemblies still consume ATP during the relaxation phase. ATP-production is a priori possible in a two state model (see [32]), but that is not what we observe here: as visible in our movie simulations (see Supp. Movie 2), motors still undergo rapid configuration changes at binding sites (which correspond to ATP consumption events).
The only sizeable difference between experiments and theory is the fact that, experimentally, contraction and relaxation occur only once whereas theory predicts a periodic set of successive events. Our explanation is that contractile unit spontaneously disassembles under low load conditions, by analogy with the behavior of stress fibers [33, 34]; this is further confirmed by a full probabilistic description (SI).
With regard to myosin and actin dynamics, we do not rule out that some turnover does occur. Depolymerization of the actin filament at the pillar edges could also locally generate force on the substrate [28]. However, recent experimental evidence points in the opposite direction in that the dynamics of actin and myosin would tend to decrease the force on adhesions. Indeed, the de-polymerization rate of actin significantly decreased under high tensile force, while the polymerization rate increased [35, 36]. In addition, the dynamics of the myosin filaments would result in a much greater variability in the number of molecules per filament.
Contraction-relaxation events of the contractile units are most likely involved in rigidity mechanosensing. Since the maximum contraction is prescribed, the reaction force from the matrix is not, and the maximum tension felt by the contractile unit depends on substrate stiffness. Force dependent signaling could easily then enable cells to adapt their physiology to the surrounding [1]. Similar contractions of cell-cell adhesion have been reported to have a mechanosensory role [37]. In addition, the contractions could correspond to attempts at constructing larger objects such as stress fibers. There are many applications for sarcomeric like contractions in cellular systems and the detailed analyses of contractile units could provide important insights into many other cellular processes powered by these structures [38].
METHODS
Cell Culture
MEFs were cultured in DMEM (Gibco) supplemented with 10% (vol/vol) FBS (Atlanta Biologicals), 2mM L-glutamine (Gibco), and 100 IU/mg penicillin-streptomycin (Sigma) at 37 C and 5% CO2. PDMS pillar substrates were coated with human plasma fibronectin (10 µg/mL, Roche) and incubated at 37◦ C for 1 hour, then rinsed 4X with PBS to remove excess free fibronectin. PBS was replaced with Ringer buffer before plating the cells. Cells were trypsanized and suspended in Ringer buffer at 37◦ C for 30 minutes prior to plating on fibronectin coated pillars.
Deep UV Treatment Allows for Tunable Increases in Pillar Bending Stiffness up to Twenty Fold
Exposure of PDMS to UV/Ozone crosslinked -Si02-groups into - Si0X-creating a 80 nm thick silica-like layer below the surface of the PDMS [39–44] This change was irreversible, and the effective bending stiffness of UV/Ozone treated pillars increased with longer exposure times as measured by Atomic Force Microscope (AFM) through repeated bending measurements (see SI Figs. S1–S2). Pillar arrays were patterned with sub-cellular regions of soft pillars and stiff pillars by placing nickel Transmission Electron Microscopy (TEM) grids on top of the pillar surface prior to UV/Ozone treatment. The pattern produced by the grids on the pillars (pitch: 62 µm; bar width: 25 µm; hole width: 37 µm) was coated with fibronectin. A fluorescent dye that was broken down by UV light (coumarin 343) was added to the PDMS to mark regions shielded from exposure (SI Fig. S1a, note blue regions were not exposed). Although pillar bending stiffness was often calculated by the simple Euler-Bernouli beams [45, 46], the stiffness of UV treated pillars had to be measured. Using the AFM in contact mode, the tip was scanned back and forth horizontally, repeatedly bending and unbending the pillar (SI Figs. S1b–S2) while the torsional motion of a calibrated cantilever was recorded. The bending and un-bending readouts were linear and reproducible, demonstrating that pillars were Hookean springs over the displacement ranges tested (up to 100 nm). Bending stiffness increased with exposure times, reaching 20-fold after a two-hour exposure with no sign of saturation (see SI Fig. S1c). For these experiments, a two hour irradiation was used. Analysis of pillars in a line across a rigid-soft boundary showed that the rigidity transition occurred over 3 pillars (2 microns). Thus, pillars chosen for analysis were always above 2 microns from the transition boundaries where the stiffness was reproducibly measured.
Pillar velocity measurements
A computer program identified contractile pillar pairs using the criteria that pillar displacements of >20 nm were anti-parallel, >20s in duration and peaked at roughly the same time. The pillar deflection velocities presented in Fig. 1d are averaged over a time window [tstart + 3 s, tend − 3 s] where tstart and tend refer to the start time and the end time of the contraction (resp. relaxation) phase.
Step detection
Based on a previously characterized step analysis program [8], individual myosin stepping events were characterized in traces of pillar displacement (see SI Fig. S3e,f). As a control for over-fitting noisy data, faux displacement traces (a polynomial fit of the actual displacement trace with added pillar displacement noise from pillars outside the cells) were similarly analyzed (SI Fig. S3g,h). The analysis of faux traces gave step sizes that were fit by a gamma distribution. However, when the actual pillar displacement traces were fit, the distribution of step sizes had a prominent peak centered around 1.2 nm on top of the background noise peak (SI Fig. S3i). Previous analyses showed that the peak step length was not due to artifacts of the analysis method and was observed by other methods [8].
Simulations
The coordinate X refers to the pillar deflection; fext(X) ≈ −KX for small pillar deflection, where K is the pillar spring constant. We calculate the dynamics of Eq. (1) by a first order discretization scheme: Xt+∆t = Xt + (fext(Xt) + fmot)∆t/Λ, where the time increment ∆t satisfies , to account for the stochastic dynamics of transition between actin site 1 and 2 [47]. We consider asymmetric energy profiles which favor motion of the motors towards the (+) end of the filament (see Fig. 3 and SI for implementation).
For a wide class of potential and transition rate functions, the maximum force per motor fmax is expected to be of the order of the maximal energy difference (i.e. ) divided by the length of variation (i.e. half the period l/2); the total force exerted by N motors is then:
| (3) |
Considering an energy difference of the order of δµ ≈ 20 kT leads to fmax ≈ 30 pN which is in the range of the forces observed here; yet the energy difference ∆W could well exceed δµ, leading to even larger forces (see also SI).
We choose a realistic set of parameters describing the experiments (see SI Table III).
Analytics
We reconsider the analytical treatment presented in [13]. In the limit of a large number of motors , the motor population N1 in state 1 can be expressed as , where ξ = x mod l is the cyclic coordinate and P1 follows the Fokkers
| (4) |
Similarly, we define P2 as the motor density in state 2. The equidistribution of the sequence of cyclic coordinates {ξj} leads to the relation: P1(ξ) + P2(ξ) = 1/l. We developed an analytical solution of Eq. (4) by expressing the l-periodic function P1 as
| (5) |
In the general case where ω(x) = ω1(x) + ω2(x) is not uniform, the term ω(x)P1 in Eq. (4) results in a product of different Fourier components, which leads to an infinite system of equations on the coefficients (an, bn). To make progress, we simplify the problem by truncating the energy and transition rate profiles to their first Fourier mode: W1(x) = W (1 − cos(2πx/l))/2, ω1(x) = ω/2 (1 + cos(2πx/l), W2(x) = W (1 + cos(2πx/l))/2 and ω2(x) = ω/2 (1 − cos(2πx/l) such that the total transition rate ω(x) is constant [30, 48].
We can show that dynamics takes a simple form in terms of y = ln(a1l), where a1 is the first Fourier mode of P1:
| (6) |
where µ = 2π2W/(l2ωη) is a dimensionless quantity referred to here as the activity parameter. Mapping Eq. (6) to the dynamics of a massive particle in an effective potential , one expects trajectories y(t) to exhibit damped oscillations (see Fig. 5b). For large µ, we find that the typical number of observable oscillations before damping is of order µ, so it can be quite large since with experimental numbers we estimate µ ≈ 103; this defines the ”slow” motor limit. During this oscillatory transient, one can neglect the damping term , in which case the quantity is a constant corresponding to the conservation of energy in this massive particle problem; from this, we deduce the period of the oscillations, as well as the distance covered δX during this period. In the limit , we find that (SI). Furthermore, the presence of an effective friction term in Eq. (6) explains why steps are progressively damped with time (see Fig. 5b) and why in the small µ case which we call “fast” motor limit no such step is expected.
Supplementary Material
Acknowledgements
J.-F. R., J. P. and M. S. are supported by the National Research Foundation, Prime Ministers Office, Singapore and the Ministry of Education under the Research Centres of Excellence program. In addition, J.L. and M.S. were supported by NIH grant R01GM113022.
Footnotes
Online content Supplementary Material is available online.
Data Availability Statement The data that support the plots within this paper and other findings of this study are available from the corresponding authors upon request.
The authors declare no competing financial interests.
References
- [1].Moore SW, Roca-Cusachs P, and Sheetz MP, Dev. Cell 19, 194 (2010). [DOI] [PMC free article] [PubMed] [Google Scholar]
- [2].Wolfenson H, Iskratsch T, and Sheetz MP, Biophys. J 107, 2508 (2014). [DOI] [PMC free article] [PubMed] [Google Scholar]
- [3].Plotnikov SV, Pasapera AM, Sabass B, and Waterman CM, Cell 151, 1513 (2012). [DOI] [PMC free article] [PubMed] [Google Scholar]
- [4].Schiller HB et al. Nat. Cell Biol 15, 625 (2013). [DOI] [PubMed] [Google Scholar]
- [5].Paszek MJ, et al. Cancer Cell 8, 241 (2005). [DOI] [PubMed] [Google Scholar]
- [6].Levental KR et al. Cell 139, 891 (2009). [DOI] [PMC free article] [PubMed] [Google Scholar]
- [7].Engler AJ, Sen S, Sweeney HL, and Discher DE, Cell 126, 677 (2006). [DOI] [PubMed] [Google Scholar]
- [8].Wolfenson H, et al.Nat. Cell Biol 18, 33 (2016). [DOI] [PMC free article] [PubMed] [Google Scholar]
- [9].Howard J, Mechanics of Motor Proteins and the Cytoskeleton (Sinauer Associates, Sunderland, 2001). [Google Scholar]
- [10].Kaya M, Tani Y, Washio T, Hisada T, and Higuchi H, Nature Communications 8, 16036 (2017). [DOI] [PMC free article] [PubMed] [Google Scholar]
- [11].Yasuda K, Shindo Y, and Ishiwata S, Biophys. J 70, 1823 (1996). [DOI] [PMC free article] [PubMed] [Google Scholar]
- [12].Jülicher F, Ajdari A, Prost J, and Julicher F, Rev. Mod. Phys 69, 1269 (1997). [Google Scholar]
- [13].Jülicher F and Prost J, Phys. Rev. Lett 78, 4510 (1997). [Google Scholar]
- [14].Plaçais PY, Balland M, Guérin T, Joanny JF, and Martin P, Phys. Rev. Lett 103, 158102 (2009). [DOI] [PubMed] [Google Scholar]
- [15].Camalet S, Duke T, Jülicher F, and Prost J, PNAS 97, 3183 (2000). [DOI] [PMC free article] [PubMed] [Google Scholar]
- [16].Guérin T, Prost J, and Joanny JF, Phys. Rev. Lett 106, 068101 (2011). [DOI] [PubMed] [Google Scholar]
- [17].Giannone G et al. Cell 116, 431 (2004). [DOI] [PubMed] [Google Scholar]
- [18].Giannone G, et al. Cell 128, 561 (2007). [DOI] [PMC free article] [PubMed] [Google Scholar]
- [19].Ghassemi S, et al. PNAS 109, 5328 (2012). [DOI] [PMC free article] [PubMed] [Google Scholar]
- [20].Yang B et al. Nano Lett, 59515961 (2016). [Google Scholar]
- [21].Liu X and Pollack GH, Biophys. J 86, 353 (2004). [DOI] [PMC free article] [PubMed] [Google Scholar]
- [22].Stam S, Alberts J, Gardel ML, and Munro E, Biophys. J 108, 1997 (2015). [DOI] [PMC free article] [PubMed] [Google Scholar]
- [23].Thoresen T, Lenz M, and Gardel ML, Biophys. J 104, 655 (2013). [DOI] [PMC free article] [PubMed] [Google Scholar]
- [24].Erdmann T and Schwarz US, Phys. Rev. Lett 108, 188101 (2012). [DOI] [PubMed] [Google Scholar]
- [25].Saitoh T, et al. FEBS Letters 509, 365 (2001). [DOI] [PubMed] [Google Scholar]
- [26].Niederman R and Pollard TD, J. Cell Biol 67, 72 (1975). [DOI] [PMC free article] [PubMed] [Google Scholar]
- [27].Verkhovsky AB, Svitkina TM, and Borisy GG, J. Cell Biol (1995). [DOI] [PMC free article] [PubMed] [Google Scholar]
- [28].Dong C, Chen X, Chen B, Biophys. J 114, 1216 (2018). [DOI] [PMC free article] [PubMed] [Google Scholar]
- [29].Dobbie I, et al. Nature 396, 383 (1998). [DOI] [PubMed] [Google Scholar]
- [30].Oriola D, Gadêlha H, Blanch-Mercader C, Casademunt J, EPL 107, 18002 (2014). [Google Scholar]
- [31].Leduc C, Ruhnow F, Howard J, and Diez S, PNAS 104, 10847 (2007). [DOI] [PMC free article] [PubMed] [Google Scholar]
- [32].Parmeggiani A, Jülicher F, Ajdari A, and Prost J, Phys. Rev. E 60, 2127 (1999). [DOI] [PubMed] [Google Scholar]
- [33].Rossier OM, et al. The EMBO Journal 29, 1055 (2010). [DOI] [PMC free article] [PubMed] [Google Scholar]
- [34].Luo W, et al. J. Cell Biol 202, 1057 (2013). [DOI] [PMC free article] [PubMed] [Google Scholar]
- [35].Yu M et al. Nano Lett 18, 5239 (2018). [DOI] [PubMed] [Google Scholar]
- [36].Jégou A, Carlier MF, Romet-Lemonne G, Nat. Comm (2013). [DOI] [PubMed] [Google Scholar]
- [37].Yang Y, Nguyen E, Mege R-M, Ladoux B, and Sheetz MP, bioRxiv 10.1101/318642 (2018). [Google Scholar]
- [38].Hu S et al. , Nat. Cell Biol 19, 133 (2017). [DOI] [PubMed] [Google Scholar]
- [39].Ouyang M, Yuan C, Muisener RJ, Boulares A, and Koberstein JT, Chemistry of Materials 12, 1591 (2000). [Google Scholar]
- [40].Efimenko K, Wallace WE, and Genzer J, J. Colloid Interface Sci 254, 306 (2002). [DOI] [PubMed] [Google Scholar]
- [41].Schnyder B et al. in Surface Science, Vol. 532–535 pp. 1067–1071 (2003). [Google Scholar]
- [42].Berdichevsky Y, Khandurina J, Guttman A, and Lo YH, Sensors and Actuators, B: Chemical 97, 402 (2004). [Google Scholar]
- [43].Song J, Tranchida D, and Vancso GJ, Macromolecules 41, 6757 (2008). [Google Scholar]
- [44].Zheng F et al. Applied Surface Science 283, 327 (2013). [Google Scholar]
- [45].Schoen I, Hu W, Klotzsch E, and Vogel V, Nano Lett 10, 1823 (2010). [DOI] [PMC free article] [PubMed] [Google Scholar]
- [46].Li B, et al. Cell Motil. Cytoskel 64, 509 (2007). [DOI] [PubMed] [Google Scholar]
- [47].Badoual M, Julicher F, Prost J, PNAS 99, 6696 (2002). [DOI] [PMC free article] [PubMed] [Google Scholar]
- [48].Guérin T, Prost J, Joanny JF, EPJE 34, 60 (2011). [DOI] [PubMed] [Google Scholar]
Associated Data
This section collects any data citations, data availability statements, or supplementary materials included in this article.