INTRODUCTION
We are all Africans. Local availability of food likely caused the first Homo sapiens to migrate out of Africa some 50 000–70 000 years ago and populate the rest of the world. Throughout human history, our behaviour has been governed by our planet’s rotation and revolution around the sun, particularly from the time of the agricultural revolution about 12 000 years ago when the first calendars start to appear, guiding agricultural activities. In the modern age of globalisation, however, food supply is relatively stable over the course of the year in many countries, but the need for primary food production, local weather conditions and availability of daylight continue to impact the activity of populations around the globe to varying degrees.
GLOBAL MONITORING OF PHYSICAL ACTIVITY
Physical activity has consistently been shown to be associated with several health benefits, but global surveillance data suggest that on average one in four adults are insufficiently active, with populations living in low- and middle-income countries being far more active than those living in high-income countries.1 The WHO Global Action Plan for Physical Activity aims to reduce the prevalence of insufficient activity by 10% in 2025 and by 15% in 2030.2 The key to monitoring progress towards these targets is a robust surveillance system. Currently, systematic global monitoring of physical activity is based on self-report methods, and while it is important for continuity of information that this element of surveillance is continued, there are clear advantages to supplementing self-report data with device-measured physical activity. Accelerometers and heart rate monitors provide objective and much more fine-grained information about habitual physical activity patterns, in particular with respect to intensity of activity, and avoid many of the issues with self-report, such as recall bias and social desirability bias. However, it is still relatively uncommon for devices to be used in epidemiological studies in Africa.
OBJECTIVELY MEASURED PHYSICAL ACTIVITY IN MALAWI
Pratt and colleagues describe the levels of objectively measured physical activity in 414 working-age adults, sampled from agricultural (rural) households in Malawi, a low–middle-income country as assessed by the World Bank.3 Physical activity was measured during the farming season using a hip-mounted accelerometer, and participants were asked to wear the device for 2 weeks, except when sleeping and bathing. The researchers quantified both total activity volume and time spent in different intensities; two of the uniaxial accelerometry cutpoints, denoted high-light and moderate intensity activity, represent the movement intensity equivalent to that of slow walking and normal walking speeds, respectively.4 5 While it can be debated whether we consider both such activities as moderate activity, there is certainly appreciable movement, and potential health benefits, at these intensity levels.6–9 Malawian men spent about 2.5 times as much time above the slow walk speed equivalent intensity threshold, compared to the normal walk speed threshold, and for women, the ratio was about 3.5 times as much. The highest cutpoint analysed was vigorous intensity and is equivalent to running, but almost no time was spent at this level of movement intensity, making this cutpoint less sensitive to describe behavioural variation in the population. There is however plenty of natural variation below this level, which can be used to richly describe the entire intensity distribution.10–14
COMPARISON TO ACTIVITY LEVELS IN HIGH-INCOME COUNTRIES
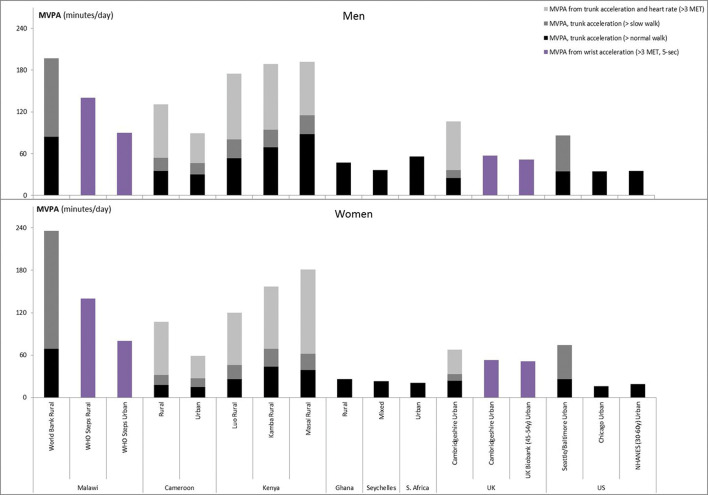
The advantage of providing epidemiological estimates of multiple intensities when describing populations becomes even clearer in international comparisons,10 but we will focus on the variation in the walking range intensities here (figure 1). Pratt and colleagues compared Malawian activity levels directly to 3258 age- and sex-matched participants residing in urban areas of the USA assessed with a very similar accelerometry method; American men spent less than half the time and American women about a third of the time in both high-light and moderate-to-vigorous intensity activity compared to their Malawian counterparts. The US estimates of activity were similar to those observed in other US studies,15 including the nationally representative National Health and Nutrition Examination Survey16 as well as accelerometer-based estimates from large studies of adult UK populations, all of which could reasonably be considered urban residents surveyed over the course of the year, so these are robust reference groups. There is therefore little doubt that activity levels of rural Malawian agricultural household members during the farming season are higher than those generally observed in high-income urban dwellers.
Figure 1.
Overview of objectively-measured moderate-to-vigorous intensity physical activity (MVPA) estimates of adult men (top panel) and women (bottom panel) residing in rural and urban areas of Africa, compared with a few measurement method-matched estimates from the USA and the UK.3 12–16 18–20
MEASUREMENT CHALLENGES
The actual difference may be higher still than observed here as the hip accelerometer would not quantify all physical activity, for example, that involving predominantly upper-body work or load-bearing activities which could be more prevalent in the farmers. Figure 1 shows time spent in physical activity across populations and includes other activity estimates using different objective methods, for example, combined heart rate and trunk accelerometry. In other African studies, this validated method17 has quantified twice as much moderate-to-vigorous intensity time as trunk accelerometry alone. For example, rural dwellers of Cameroon accumulated 50% (in men) to 100% (in women) more moderate-to-vigorous activity than urban dwellers, but the difference was only 20% higher for the two accelerometer-based measures.13 Rural populations of Kenyan Lou, Kamba and Masaai accumulated even higher levels of activity, with time spent above the highest accelerometry cutpoint being slightly higher than the equivalent in the Malawian men but slightly lower in the women.18 Estimates from Ghana and Seychelles using hip accelerometry were however much lower, suggesting substantial variation between African populations.15
A previous study from Malawi undertaken in 2017 as a feasibility study for incorporating objective measures of activity into the WHO STEPwise approach to Surveillance (STEPS) programme assessed activity in both rural and urban dwellers using a triaxial wrist accelerometer.14 Again this found higher activity in rural dwellers, about 60% for men and 80% for women, compared to Malawian urban dwellers, and both these populations were more active than UK populations assessed with the same method.19 20
SAMPLING THE DIURNAL PATTERN OF PHYSICAL BEHAVIOUR
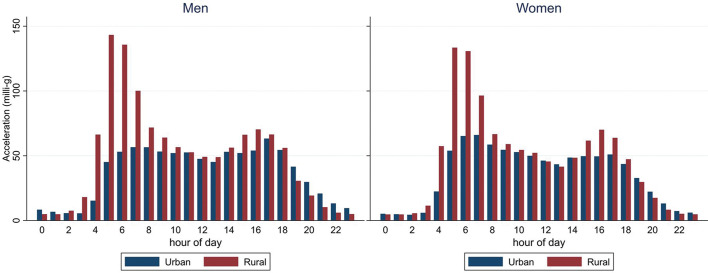
The daily 24-hour cycle of physical behaviour is one of the most recognisable patterns in objective monitoring records. Most of the African data used 24-hour monitoring protocols with waterproof sensors, which makes it simpler to instruct participants (wear-and-forget) but it also makes the analysis simpler as there is generally less missing data due to non-wear and there is greater opportunity to impute any missing data by within-person diurnal pattern matching. The potential downside of this approach is challenges in discriminating sleep and awake sedentary behaviour, but assessment of any of the other intensities or total volume of activity is comprehensive. One alternative is to use awake-time only monitoring protocols accompanied by activity monitor diaries to encourage compliance of wear; often, however, monitor diaries have their own missing data problems and researchers choose to ignore these data and apply a more universal approach at the analysis stage. Indeed, this was the approach taken in the study by Pratt and colleagues, where data between 22:00 and 04:30 were excluded for everybody. At first glance, this may seem crude, too short and too early, but considering the diurnal pattern of rural dwellers assessed in 24-hour monitoring protocols as for example used in the WHO STEPS study in Malawi (figure 2), it is not far off the common pattern—if anything, the censoring window should have been even shorter as several rural dwellers get up at 4:00, and the morning activity peak is the highest in most participants. The analytical alternative to the censoring approach is to reclassify all non-wear data as wear data in the identified potential sleep time window which would simulate the 24-hour protocol; both approaches would yield similar non-sedentary estimates.
Figure 2.
Diurnal physical activity (wrist acceleration) profile of Malawian men (left) and women (right), stratified by urban-rural residency (bars represent mean values by hour from midnight). WHO STEPS survey 2017.14
SAMPLING THE POPULATION BY PLACE AND SEASON
The biggest challenge, however, for monitoring population levels of activity is that of selection bias. This stems from two main sources; the first is that of recruiting a representative population sample that starts with defining an unbiased sampling frame and documenting any deviation from that at the execution stage (response rate), and the second is to sample time in an unbiased manner for each individual or group of individuals who agrees to participate. We can question if the sample of farmers recruited from the Ntcheu and Zomba districts of Malawi in the study by Pratt and colleagues are representative of all farmers in Malawi, or indeed of all rural dwellers in Malawi, the latter being the tougher criterion but nonetheless the relevant one if the objective is to assess the possible consequences of urbanisation on activity levels. The approach to population sampling in WHO STEPS surveys and the Cameroon study was complete sampling of all households in selected areas; this puts the emphasis of sampling representativeness on the geographical area selection.
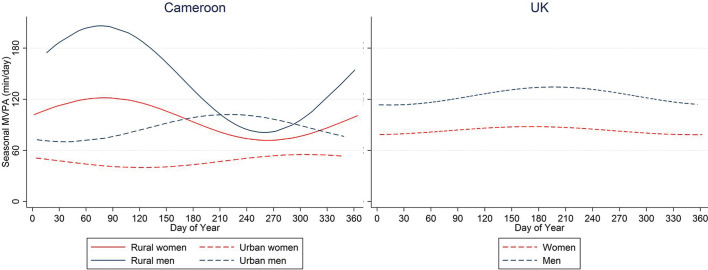
On the issue of time sampling, the safest design is to let the survey span across a whole calendar year, ideally at a stable recruitment rate in all geographical areas, as this would capture the natural yearly cycle of activities and limit any selection bias from this source. However, this is usually not the way that these surveys are done; it is far more practical to conduct these in particular seasons that make fieldwork more feasible, for example, outside of the rainy season. In the study by Pratt and colleagues, farmers were measured during the farming season, which is the most active time of the year in agriculture. If our intention is to assess the general activity levels of the rural population, however, this time sampling strategy would lead to overestimation bias. A similar time sampling bias could be operating in the WHO STEPS survey as that was also conducted in a relatively short period of time; however, the internal comparison between urban and rural dwellers is not biased here as these were time-matched—but it is still possible that the observed urban–rural difference may not generalise to other seasons. The Cameroon study was a more classical slow-burning cross-sectional survey with participant enrolment and data collection conducted over the course of the year, allowing estimation of seasonal differences in activity levels in both rural and urban dwellers; these are displayed together with UK data in figure 3. As expected, fluctuations were greater in rural dwellers from Cameroon, making time sampling of this subpopulation more critical; rural dwellers were twice as active as urban dwellers during the long dry season (December–May), that is, the main farming season, whereas urban and rural dwellers were similarly active during the heavy rain season (October–November).
Figure 3.
Seasonal differences of physical activity in rural and urban dwellers living in Cameroon13 and mainly urban residents in the UK.12 Day of year from 1 January.
IMPLICATIONS FOR FUTURE GLOBAL SURVEILLANCE
The issues highlighted here have implications for how we best design future surveillance of physical activity across the world. It is not unlikely that the current model of blitz fieldwork will be the dominant data collection method as it is simply the most practical. If this was accompanied by smaller parallel studies that quantify seasonal differences in relevant subpopulations within a country or region, the survey data can be reported not just as observed central tendency and dispersion estimates but also a set of adjusted prevalence results which have been subjected to modelling, survey weights and seasonal scaling in order to minimise the impact of population and time selection biases. Ideally, we would also want to assess the validity of methods in different populations and across time era. Attempting to estimate nationally representative estimates of physical activity with minimum time biases can be more appropriately compared between countries and over longer periods of time (years, decades), so we can monitor progress towards the internationally agreed goals of population activity levels.2
Acknowledgments
We thank Dirk Lund Christensen (University of Copenhagen, Denmark) for permission to reprocess and report Kenyan trunk accelerometry data for this commentary and Kate Westgate (University of Cambridge, UK) for assistance with Malawian wrist accelerometry data. This work was supported by the UK Medical Research Council (MC_UU_12015/3) and Wellcome Trust (074786/Z/04/Z).
Twitter: Soren Brage @sorenbrage.
Contributors: All authors contributed to this work.
Funding: The authors have not declared a specific grant for this research from any funding agency in the public, commercial or not-for-profit sectors.
Competing interests: None declared.
Provenance and peer review: Commissioned; internally peer reviewed.
REFERENCES
- 1. Guthold R, Stevens GA, Riley LM, et al. Worldwide trends in insufficient physical activity from 2001 to 2016: a pooled analysis of 358 population-based surveys with 1·9 million participants. Lancet Glob Heal 2018;6:e1077–e1086. 10.1016/S2214-109X(18)30357-7 [DOI] [PubMed] [Google Scholar]
- 2. World Health Organization . Global action plan on physical activity 2018–2030: More active people for a healthier world. Geneva, 2018. [Google Scholar]
- 3. Pratt M, Sallis JF, Cain K, et al. Physical activity and sedentary time in a rural adult population in Malawi compared with an age-matched US urban population. BMJ Open SEM 2020. 10.1136/bmjsem-2020-000812 [DOI] [PMC free article] [PubMed] [Google Scholar]
- 4. Freedson PS, Melanson E, Sirard J. Calibration of the computer science and applications, Inc. accelerometer. Med Sci Sports Exerc 1998;30:777–81. 10.1097/00005768-199805000-00021 [DOI] [PubMed] [Google Scholar]
- 5. Brage S, Wedderkopp N, Franks PW, et al. Reexamination of validity and reliability of the CSA monitor in walking and running. Med Sci Sports Exerc 2003;35:1447–54. 10.1249/01.MSS.0000079078.62035.EC [DOI] [PubMed] [Google Scholar]
- 6. Ekelund U, Tarp J, Steene-Johannessen J, et al. Dose-response associations between accelerometry measured physical activity and sedentary time and all cause mortality: systematic review and harmonised meta-analysis. BMJ 2019;l4570. 10.1136/bmj.l4570 [DOI] [PMC free article] [PubMed] [Google Scholar]
- 7. Bielemann RM, LaCroix AZ, Bertoldi AD, et al. Objectively measured physical activity reduces the risk of mortality among Brazilian older adults. J Am Geriatr Soc 2020;68:137–46. 10.1111/jgs.16180 [DOI] [PubMed] [Google Scholar]
- 8. Dempsey PC, Strain T, Khaw KT, et al. Prospective associations of accelerometer-measured physical activity and sedentary time with incident cardiovascular disease, cancer, and all-cause mortality. Circulation 2020;141:1113–15. 10.1161/CIRCULATIONAHA.119.043030 [DOI] [PubMed] [Google Scholar]
- 9. Strain T, Wijndaele K, Dempsey PC, et al. Wearable-device-measured physical activity and future health risk. Nat Med 2020. Aug 17;26:1385–91. 10.1038/s41591-020-1012-3 [DOI] [PMC free article] [PubMed] [Google Scholar]
- 10. Berkemeyer K, Wijndaele K, White T, et al. The descriptive epidemiology of accelerometer-measured physical activity in older adults. Int J Behav Nutr Phys Act 2016;13. 10.1186/s12966-015-0316-z [DOI] [PMC free article] [PubMed] [Google Scholar]
- 11. Da Silva ICM, Van Hees VT, Ramires VV, et al. Physical activity levels in three Brazilian birth cohorts as assessed with raw triaxial wrist accelerometry. Int J Epidemiol 2014;43:1959–68. 10.1093/ije/dyu203 [DOI] [PMC free article] [PubMed] [Google Scholar]
- 12. Lindsay T, Westgate K, Wijndaele K, et al. Descriptive epidemiology of physical activity energy expenditure in UK adults (The Fenland study). Int J Behav Nutr Phys Act 2019;16:126. 10.1186/s12966-019-0882-6 [DOI] [PMC free article] [PubMed] [Google Scholar]
- 13. Assah F, Mbanya JC, Ekelund U, et al. Patterns and correlates of objectively measured free-living physical activity in adults in rural and urban Cameroon. J Epidemiol Community Health 2015;69:7. 10.1136/jech-2014-205154 [DOI] [PMC free article] [PubMed] [Google Scholar]
- 14. Westgate K, Ridgway C, Rennie K, et al. Feasibility of incorporating objective measures of physical activity in the STEPS program. A Pilot Study in Malawi 2019. 10.17863/CAM.56039 [DOI] [Google Scholar]
- 15. Dugas LR, Bovet P, Forrester TE, et al. Comparisons of intensity-duration patterns of physical activity in the US, Jamaica and 3 African countries. BMC Public Health 2014;14:1. 10.1186/1471-2458-14-882 [DOI] [PMC free article] [PubMed] [Google Scholar]
- 16. Troiano RP, Berrigan D, Dodd KW, et al. Physical activity in the United States measured by accelerometer. Med Sci Sports Exerc 2008;40:181–8. 10.1249/mss.0b013e31815a51b3 [DOI] [PubMed] [Google Scholar]
- 17. Assah FK, Ekelund U, Brage S, et al. Accuracy and validity of a combined heart rate and motion sensor for the measurement of free-living physical activity energy expenditure in adults in Cameroon. Int J Epidemiol 2011;40:112–20. 10.1093/ije/dyq098 [DOI] [PubMed] [Google Scholar]
- 18. Christensen DL, Faurholt-Jepsen D, Boit MK, et al. Cardiorespiratory fitness and physical activity in Luo, Kamba, and Maasai of rural Kenya. Am J Hum Biol 2012; 24: 723–9. 10.1002/ajhb.22303 [DOI] [PMC free article] [PubMed] [Google Scholar]
- 19. White T, Westgate K, Wareham NJ, et al. Estimation of physical activity energy expenditure during free-living from wrist accelerometry in UK adults. PLoS One 2016. December 9:11:e0167472. 10.1371/journal.pone.0167472 [DOI] [PMC free article] [PubMed] [Google Scholar]
- 20. Doherty A, Jackson D, Hammerla N, et al. Large scale population assessment of physical activity using wrist worn accelerometers: the UK Biobank Study. PLoS One 2017;1 12:e0169649. 10.1371/journal.pone.0169649 [DOI] [PMC free article] [PubMed] [Google Scholar]


