

Abstract
The highly transmissible B.1.1.7 variant of SARS-CoV-2, first identified in the United Kingdom, has gained a foothold across the world. Using S gene target failure (SGTF) and SARS-CoV-2 genomic sequencing, we investigated the prevalence and dynamics of this variant in the United States (US), tracking it back to its early emergence. We found that, while the fraction of B.1.1.7 varied by state, the variant increased at a logistic rate with a roughly weekly doubling rate and an increased transmission of 40%–50%. We revealed several independent introductions of B.1.1.7 into the US as early as late November 2020, with community transmission spreading it to most states within months. We show that the US is on a similar trajectory as other countries where B.1.1.7 became dominant, requiring immediate and decisive action to minimize COVID-19 morbidity and mortality.
Keywords: COVID-19, SARS-CoV-2, B.1.1.7, genomic epidemiology, variant of concern, 501Y.V1, VOC-202012/01
Graphical abstract
Genomic epidemiology analyses explain the introduction and transmission of the B.1.1.7 variant of SARS-CoV-2 into the US, with projections for it to soon be the dominant strain in the country.
Introduction
Since the onset of the COVID-19 pandemic, there has been concern about the possibility of novel SARS-CoV-2 variants emerging that are more transmissible than the ancestral lineage first identified in Wuhan, China. During the third quarter of 2020, the SARS-CoV-2 variant of concern (VOC) 202012/01 (a.k.a. 501Y.V1; B.1.1.7) lineage carrying the N501Y mutation emerged and took hold in the United Kingdom (UK), followed by several European countries. The N501Y mutation is also shared with other VOCs first identified in South Africa (501Y.V2; B.1.351) (Tegally et al., 2020) and Brazil (501Y.V3; P.1) (Faria et al., 2021), but B.1.1.7 has several additional “signature” mutations in the SARS-CoV-2 Spike protein, including deletions at 69-70 and 144, as well as mutations A570D, P681H, T716I, S982A, and D1118H (Rambaut et al., 2020a). The earliest sequence of B.1.1.7 was collected on September 20, 2020 in England (GISAID:EPI_ISL_601443), but it has since spread rapidly across the UK, becoming the dominant lineage within just a few months (Chand et al., 2020; Cyranoski, 2021; ECDC, 2021; Rambaut et al., 2020a).
The B.1.1.7 lineage has been shown to be inherently more transmissible, with a growth rate that has been estimated to be 40%–70% higher than other SARS-CoV-2 lineages in multiple countries, which is hypothesized to be partly due to the N501Y mutation increasing receptor binding affinity of the SARS-CoV-2 spike protein with angiotensin-converting enzyme 2 (ACE2) (Volz et al., 2021). While initially thought to have comparable clinical outcomes to other SARS-CoV-2 variants, recent reports indicate that infection with B.1.1.7 may lead to ∼30%–50% higher mortality rates (Iacobucci, 2021). Though the exact origin of the B.1.1.7 variant is unclear, the proactive and large-scale SARS-CoV-2 genomic surveillance program in the UK facilitated the initial detection after investigators in South Africa had observed an association between N501Y and increased transmission (Chand et al., 2020).
Routinely administered real-time reverse transcription polymerase chain reaction (RT-PCR) SARS-CoV-2 diagnostic tests can provide hints to the presence of viral lineages with sequence-based differences when mutations occur at the test’s target probe location(s) that lead to unexpected results. Importantly, the 69-70 deletion in the SARS-CoV-2 spike (S) gene, present in B.1.1.7 and other variants, can be characterized by the failure to detect the S gene using certain tests, such as the Thermo Fisher TaqPath COVID-19 assay, known as S gene target failure (SGTF) (Bal et al., 2020). Retrospective analyses from the UK show that the proportion of B.1.1.7 in SGTF samples rose from 3% during the week of October 12, 2020 to more than 90% during the week of November 30, 2020. It has since reached near-fixation across most of the UK (Chand et al., 2021).
The earliest samples of the B.1.1.7 variant were sequenced in Southern England in late September 2020 and has since been detected in over 75 countries (O’Toole et al., 2021a). In this study, we sought to understand the prevalence and growth dynamics of this variant in the US, from early emergence to rapid onward transmission. Surveillance programs typically select a subset of samples tested by SARS-CoV-2 RT-PCR for sequencing, and therefore prioritizing SGTF samples for sequencing serves to enrich for detection of B.1.1.7. Here, we describe the introduction and early spread of B.1.1.7 in the US, based on historical SGTF rates in RT-PCR SARS-CoV-2 tests and a nationwide SGTF viral sequencing program. We find that B.1.1.7 arrived in the US toward the end of November 2020 and, as of February 2021, has since spread to over 40 US states (CDC, 2021). Importantly, similarl to what has been observed in other countries, we find that the B.1.1.7 variant is 40%–50% more transmissible across the US, doubling in relative frequency every week to week and a half. These findings show that B.1.1.7 will probably become the dominant variant in many US states by March 2021, likely leading to further surges of COVID-19 in the country, unless urgent mitigation efforts are immediately implemented.
Results
The proportion of SGTF samples is rapidly increasing in the US
We examined the prevalence of SGTF in all SARS-CoV-2 positive samples from across the US tested at Helix since July 2020 (∼0.5 million samples; Figure 1 A). The Helix COVID-19 test calls positive samples when at least two of three targets (N, Orf1ab, and S) are detected using the Thermo Fisher TaqPath assay. We only considered samples to be SGTF if they were positive for both N and Orf1ab, and negative for S. We restricted our analyses to positive samples with cycle quantification (Cq) < 27 for the N gene based on previous reports that single target failures were more frequent at higher Cq (Bal et al., 2020; Kara Steel And, 2021).
Figure 1.

Estimated proportion of B.1.1.7 in SARS-CoV-2 tests at Helix since December 15, 2020
(A) Map of contiguous states in the US with each bubble representing the number of positive Helix COVID-19 tests from each state.
(B) Estimated proportion of B.1.1.7 in total number of positive tests with Cq(N gene) <27, in the US overall, California, Florida, and Georgia from December 15th, 2020 to February 11th, 2021. The proportion of B.1.1.7 samples was estimated using: . There is an ∼2 week lag between sequence data and testing data. We had sequence data until February 2nd, but we had testing data until February 19th. To fully utilize the testing data, we used the average proportion of B.1.1.7 sequences in sequenced samples with SGTF from the last 5 days of available sequence data in each location to infer the proportion of B.1.1.7 cases in total positive tests for an additional 2 week period (February 3 to February 19). The black line shows the 5-day rolling average of the estimated proportion of B.1.1.7 in total positives. The inverted bar chart shows the temporal distribution of the B.1.1.7 genomes sequenced and the number of sequenced samples with SGTF.
(C) Logistic growth curves fit to the rolling average of the estimated proportion of B.1.1.7 in total positives for the US, Florida, California, and Georgia. The shaded area represents the 95% CI for each fit. The inset shows the zoomed in view of the curve fit. The predicted time when the estimated proportion of B.1.1.7 cases crosses 0.5 is indicated in red. See also Data S1.
We began to observe consistent, low-frequency SGTF in early October 2020, with 1.4% of daily SARS-CoV-2-positive tests exhibiting this pattern during October 18 to October 24, 2020, followed by a steady increase in the weeks that followed (Data S1). We found that the nationwide proportion of SGTF increased from an average of 0.8% in the first week of January (January 1 to January 7) to 10.6% in the third week of February (February 14 to February 19) (Data S1).
To investigate regional differences across the US, we examined the nationwide distribution of SGTF. By grouping our samples based on patient state of residence, we observed SGTF in 25 out of 53 US states and territories during January and February, 2021, several of which had SGTF frequencies consistently above 1% (Data S1). When restricting our analysis to assess US states with more than 500 positive tests in January and February, 2021, we observed that the fraction of SGTF varies significantly across the nation (Data S1). A caveat to this analysis is that our testing footprint does not evenly cover the US (Figure 1A), hence SGTF may currently be underdetected in several states.
Identification of B.1.1.7 using SARS-CoV-2 sequencing
Since SGTF only detects the presence of the 69-70 deletion in the SARS-CoV-2 Spike gene, it is not specific to B.1.1.7 (Washington et al., 2020). To investigate the proportion of B.1.1.7 in our SGTF samples, we sequenced all Helix SGTF samples from December 2020 through February 2021, with the support of the CDC for public health genomic surveillance. We found a total of 2,919 samples with SGTF, of which we successfully sequenced 986 (34% sampling) samples with 511 (52%) from Florida, 183 (19%) from California, 52 (5%) from Georgia, and 24% sequences from other US states (Data S1). We found that 662 (67% of all SGTF sequences) samples were from the B.1.1.7 lineage (insert; Figure 2 A; Data S1), distributed across 15 US states (insert; Figure 2A) with 359 (70% of SGTF sequences) from Florida, 162 (89% of SGTF sequences) from California, and 41 (79% of SGTF sequences) from Georgia (Data S1). In addition to the SGTF samples from Helix, we also sequenced three B.1.1.7 genomes that were detected as part of random SARS-CoV-2 genomic surveillance in California and three B.1.1.7 genomes detected by screening for SGTF (Data S2).
Figure 2.

Phylogenetic analysis of B.1.1.7 lineage in the US
(A) Maximum clade credibility (MCC) tree of the time resolved phylogenetic analysis of B.1.1.7 sequences in the US in the context of sequences sampled globally. The gradient represents uncertainty in the tree topology and is used to mask internal nodes with very low support (posterior probability ≪0.1). Clades that consist primarily of sequences sampled in the US supported by a basal node with posterior probability ≥0.98 are highlighted in the tree with the posterior probability annotated at the basal node. The closest ancestral node to each clade with a posterior probability ≥0.98 is highlighted in black. In this phylogeny, we only show clades with ≥20 sequences and independent introductions into Pennsylvania (PA) and Georgia (GA). Please see Figure S1 for a phylogeny with all the annotations of the MCC tree.
(B) The color scheme of terminal nodes sampled in the MCC tree. Sequences sampled outside the US are colored in light gray. US states with no B.1.1.7 sequence sampling in the dataset are shown in light gray in the map.
(C) The TMRCA of each clade highlighted in the MCC tree.
(D) The proportion of the geographic sampling of sequences within each clade (singletons have been excluded, including those in Texas, Pennsylvania, and Massachusetts). The colors follow the same scheme as shown in (B).
See also Figure S1.
We found that all of the SARS-CoV-2 B.1.1.7 variant genomes from the US analyzed here contained all “signature” mutations described previously, including del69-70, del144, N501Y, A570D, P681H, T716I, S982A, and D1118H (Rambaut et al., 2020a). None of our B.1.1.7 sequences contained any of the key mutations identified in the B.1.351 and P.1 variants, such as L18F, K417N/T, or E484K (Faria et al., 2021; Tegally et al., 2020), with the latter recently identified in B.1.1.7 lineages in the UK (Public Health England, 2020). We observed an additional nonsynonymous mutation, K1191N, in the majority of B.1.1.7 genomes from Florida, and one instance of Q493K, which has been implicated in immune escape (Starr et al., 2021).
In addition to the 15 states with evidence of B.1.1.7 transmission identified in this study, we note that additional B.1.1.7 sequences have been reported from other testing labs, with 42 of 53 US states and territories reporting to the CDC at least one case to date (CDC, 2021).
B.1.1.7 has an increased growth rate in the US compared to non-B.1.1.7 lineages
To investigate the dynamics of B.1.1.7 in the US, we estimated the proportion of the variant out of total positive tests by multiplying the proportion of B.1.1.7 in all sequenced SGTF cases by the proportion of SGTF in all positive tests and taking the 5-day rolling average until February 3, 2021. We found that the proportion of B.1.1.7 in our sequenced SGTF samples grew to a nationwide average of 88.5% in the last 7 days that we had testing data (January 29 to February 4), with substantial variation across the country ranging from 100% in California (January 28 to February 3), and 100% in Florida (January 29 to February 4) to 23.8% in Massachusetts (January 27 to February 2) (Data S1).
Due to an ∼2 week lag in the availability of sequence data, we had sequence data until February 2 and testing data until February 19. with a 1–2 day variation in the availability of sequence data by state. To fully utilize the testing data, we used the average proportion of B.1.1.7 in sequenced SGTF samples from the last 5 days with available sequence data, at the state and national level (Table 1 ), to infer the proportion of the B.1.1.7 in total positive tests from February 3 to February 19. We estimated that between February 4 and February 10, B.1.1.7 made up an average of 4.3% of COVID-19 cases in our nationwide dataset, with 4.2% of all cases in California, 11.5% of all cases in Florida, and 4.4% of all cases in Georgia (Figure 1B).
Table 1.
Mean proportion of B.1.1.7 sequences in sequence SGTF samples from the last 5 days with sequence data in each location used to infer the proportion of B.1.1.7 cases in total positive tests from February 3 to February 19, 2021
| Location | Mean from last 5 days with available sequence data |
|---|---|
| California | 1 |
| Florida | 0.897 |
| Georgia | 0.916 |
| USA | 0.81 |
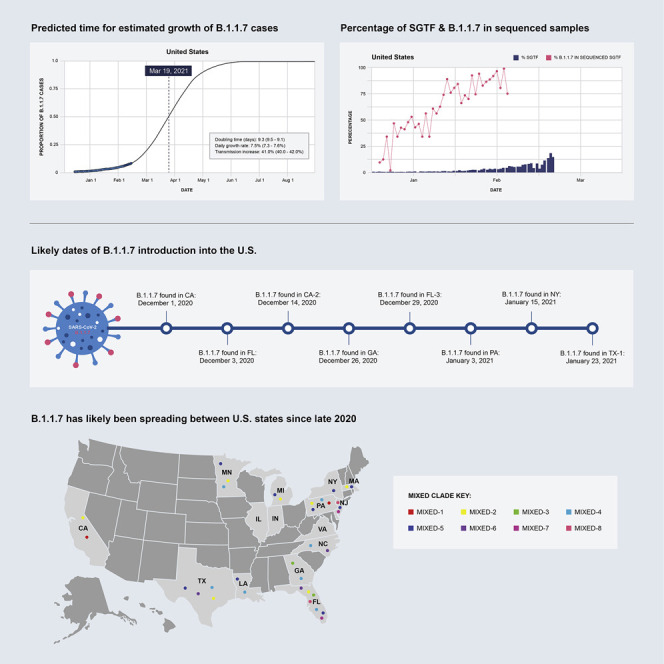
To investigate the growth rate of B.1.1.7 in the US compared to non-B.1.1.7 lineages, we fitted a logistic growth model to our rolling 5-day average of estimated B.1.1.7 proportion in total positive tests. We found that B.1.1.7 has a logistic growth rate of 7.5% (95% confidence interval [7.3%, 7.6%]) per day across most of the US (Figure 1C). Using a serial interval of 5.5 days (Volz et al., 2021), this translates to an increased transmissibility of 41% (40%–42%) in the US.
However, we observed variation at the state-level, with a logistic growth rate of 10% (9.0%, 11.1%) per day in California, 8% (7.7%, 8.2%) per day in Florida, and 7.6% (7.1%, 8.1%) per day in Georgia (Figure 1C). This translates to an increase in transmission of 55.2% (49.5%, 60.9%) in California, 43.7% (42.5%, 44.9%) in Florida, and 41.7% (38.9%, 44.5%) in Georgia (Figure 1C). We estimated the doubling time of B.1.1.7 to be 9.3 days (9.1, 9.5) in the US, 6.9 days (6.3, 7.7) in California, 8.7 days (8.5, 9.0) in Florida, and 9.2 days (8.6, 9.8) in Georgia (Figure 1C).
If the B.1.1.7 lineage continues to spread at the current rate, we estimate that it will become dominant across much of the US, causing over 50% of new COVID-19 cases by March 19 (March 15, March 22), varying by state with the lineage becoming dominant in California by March 11th (February 27, March 30), Florida by March 3 (February 28, March 7), and Georgia by March 22nd (March 15, March 31) (Figure 1C).
B.1.1.7 was introduced into the US multiple times between November 2020 and January 2021
To investigate the timing and minimum number of introductions that led to the emergence of B.1.1.7 in the US, we combined our 662 B.1.1.7 genomes with a representative sampling of 292 additional sequences from outside the US. We used this dataset to reconstruct a Bayesian time-resolved phylogeny using BEAST (Suchard et al., 2018). We found that the majority of B.1.1.7 sequences from the US cluster into two main clades (Figure 2A) with independent introductions into California (CA; Figure 2A) and Florida (FL; Figure 2A). We also see independent introductions into Georgia (GA; Figure 2A), Pennsylvania (PA; Figure 2A), New York (NY; Figure S1 A), and Texas (TX-1; Figure S1A).
Figure S1.

Phylogenetic analysis of B.1.1.7 lineage in the US, related to Figure 2
(A) Maximum clade credibility (MCC) tree of the time resolved phylogenetic analysis of B.1.1.7 sequences in the U.S. in the context of sequences sampled globally. The gradient represents uncertainty in the tree topology and is used to mask internal nodes with very low support (posterior probability ≪ 0.1). Clades that consist primarily of sequences sampled in the U.S. supported by a basal node with posterior probability ≥ 0.98 are highlighted in the tree with the posterior probability annotated at the basal node. The closest ancestral node to each clade with a posterior probability ≥ 0.98 is highlighted in black.
(B) The color scheme of terminal nodes sampled in the MCC tree. Sequences sampled outside the U.S. are colored in light gray. U.S. States with no B.1.1.7 sequence sampling in the dataset are shown in light-gray in the map.
(C) The TMRCA of each clade highlighted in the MCC tree.
(D) The proportion of the geographic sampling of sequences within each clade (singletons have been excluded, including those in Texas, Pennsylvania, and Massachusetts).
In addition to these major clades, we also identified a number of smaller clades representing at least 22 independent introductions (Figure 2A), as well as 16 singletons showing additional introductions (Figure 2A) across the US (Figure 2B). Among the 22 independent introductions we note nine independent introductions into Florida (FL-1 to FL-9; Figure S1A), and three independent introductions into California (CA-1 to CA-3; Figure S1A). The “CA-2” clade was made up of 11 sequences from California and constituted a separate introduction. The two sequences closest to the base of this clade came from individuals with recent travel history to the UK, showing evidence for local transmission within the state (CA-2; Figure S1A). Clade “Southeast” (Figure S1A) contains five sequences from Georgia, two from Florida, and two from North Carolina and represents an independent introduction into the Southeastern US.
We found that the earliest timing of introductions into the US was represented by the “CA” clade, which had a median time to the most recent common ancestor (TMRCA; which depicts the likely start of sustained local transmission in California [Grubaugh et al., 2019a]) of December 1, 2020 (95% highest posterior probability: [November 18 to December 10]), followed by “FL” with a median TMRCA of December 3, 2020 (November 22 to December 11) (Figure 2C). Clade “GA” had a median TMRCA of December 26, 2020 (December 18 to January 2) (Figure 2C). Clade “PA” had a median TMRCA of January 3, 2020 (December 24 to January 10) (Figure 2C). Clade “NY” had a median TMRCA of January 15, 2020 (January 8 to January 16) (Figure S1C). Clade “TX-1” had a median TMRCA of January 23, 2020 (January 17 to January 26) (Figure S1C). We found that the other US clades had median TMRCAs in December 2020 and January 2021 (Figure S1C), suggesting repeated introductions of B.1.1.7 into the US from international locations from November 2020 through the present.
B.1.1.7 has likely been spreading between US states since late 2020
In addition to the main B.1.1.7 clades that contained sequences primarily from individual states, including “CA,” “CA-1” to “CA-3,” “FL,” “FL-1” to “FL-9,” “TX-1,” “PA,” “NY,” and “GA,” we found that eight clades (“mixed-1” to “mixed-8”) were diverse with respect to geographic sampling, containing SARS-CoV-2 genomes from across multiple US states (Figure 2A; Figure S1A). These findings indicate that B.1.1.7 has been spreading locally between different US states (Figure 2D; Figure S1D), likely since at least December 2020 based on our TMRCA estimates (Figure 2C; Figure S1D). In addition, we found that clade “TX-2” with 18 sequences from Texas and three sequences from Louisiana (TX-2; Figure 2A; Figure S1A), are supported by a basal node with a posterior probability of 1. This clade clusters within clade “mixed-5,” which contains sequences from the Northeastern, Midwestern, and Southeastern US, indicating widespread transmission of the B.1.1.7 lineage across the US.
Undersampling and inherent bias of B.1.1.7 sequencing across the US make it unfeasible to estimate directionality and connectedness across the country. However, our finding of clustering of B.1.1.7 sequences into several mixed clades suggest movement of the virus between multiple US states, including between many of the states on the Eastern seaboard, and between Northeastern, Midwestern, and Southeastern states in the US (Figure 2D; Figure S1D).
Discussion
The B.1.1.7 variant established itself as the dominant SARS-CoV-2 lineage in the UK within a few months after its detection (Bal et al., 2020; Chand et al., 2020). Since then, the variant has been increasingly observed across many European countries, including Portugal and Ireland, which, like the UK, observed devastating waves of COVID-19 after B.1.1.7 became dominant (ECDC, 2021). In this study, we show that B.1.1.7 is currently at a relatively low frequency in the US, but our estimates show that its growth rate is ∼7.5% per day and doubling in frequency about every week and a half. These findings are consistent with those from other countries (Volz et al., 2021), and, given the current trajectory in the US, we expect B.1.1.7 to become the dominant SARS-CoV-2 lineage by March 2021 across many US states, which is consistent with modeling analyses from the US Centers for Disease Control and Prevention (Galloway et al., 2021).
Our phylogenetic analyses indicate that there have been multiple introductions of B.1.1.7 into the US, with the earliest dating back as early as the end of November 2020. These analyses revealed large clades of closely related SARS-CoV-2 lineages clustering within individual states, as well as national spread indicated by several smaller clades defined by mixtures of samples from patients who reside in different US states. These findings are consistent with community transmission following several of these introductions, including spread across the US. However, unresolved polytomies of sequences belonging to different regions nationally and internationally at several basal nodes in our phylogenies mean that we are unable to fully resolve directionality and likely origins for the US sequences (Grubaugh et al., 2019a). However, our TMRCA estimates coincide with increased periods of travel, where the US Transportation Security Administration reported over one million travelers crossing checkpoints for several days during the peak Thanksgiving season (November 20–29, 2020) and for 12 of 18 days surrounding the Christmas and New Year’s holidays (December 18, 2020 to January 4, 2021) (TSA, 2021). This increase in travel provides a likely explanation for how B.1.1.7 may have been introduced via international travel and spread across the US via domestic travel. As more genomes from the B.1.1.7 lineage in the US are sequenced, we expect to be able to identify more independent introductions and an increase in the number of sequences within each cluster. In addition, we also expect the growing number of sequences from B.1.1.7 to add further evidence for local transmission within the US presented in this study and potentially also elucidate the directionality of the spread of this lineage.
In addition to well-supported local clades in California, Florida, and Georgia from our phylogenetic analyses, many of the initial B.1.1.7 cases in the US did not report recent international travel prior to infection (Davis, 2020; Romo, 2020). These findings suggest that significant community transmission of B.1.1.7 is already ongoing across the US, which is likely fueled by the increased growth rate and transmissibility of B.1.1.7. We found the growth rate in Florida (∼8%/day) to be slightly lower than in California (∼10%/day). This difference may be due to differences in statewide or regional social distancing protocols or mobility patterns, population density, biases in sampling, and/or demographics, or potential competition from other SARS-CoV-2 variants. In addition, other countries have observed that earlier estimates of increased B.1.1.7 transmission have been lower than later, more robust, estimates. We expect the same may be true in the US and our growth estimates might therefore increase as we obtain more data.
The nationwide growth rate of the proportion of B.1.1.7 cases of ∼7.5%/day is slightly lower than those observed in Portugal (10%/day [Borges et al, 2021]), Denmark (10.3%/day [Statens Serums Institute, 2021]) and the UK (10.4%/day (Davies et al., 2020)). This potential difference requires further investigation, but, as described above, in addition to social, demographic, and policy factors, may likely be down to the relative sparsity of currently available US-wide data and we expect it may increase as more data are collected.
Our study shows that although SGTF is not yet a universal proxy for the B.1.1.7 variant in the US, the increased growth rate of B.1.1.7 compared to other SGTF variants (Volz et al., 2021) will likely lead to B.1.1.7 overtaking other SGTF variants in a matter of weeks. This will allow the simple SGTF testing anomaly to be used to monitor the spread of B.1.1.7 in the US in the absence of nationwide genomic surveillance.
While B.1.1.7 is of current interest, given concerns about its increased transmission dynamics, the results here reinforce the need for ongoing SARS-CoV-2 genomic surveillance to monitor the dynamics of B.1.1.7 and other emerging SARS-CoV-2 variants, including those yet to be discovered. Because laboratories in the US are currently only sequencing a small subset of SARS-CoV-2 samples, the true sequence diversity of SARS-CoV-2 in this country is still unknown. The more established surveillance programs in other countries have provided important early warnings about variants of concern that can impact the US, with B.1.1.7 representing only one variant that demonstrates the capacity for increased growth. As viral surveillance efforts increase in the US, we will no doubt find additional SARS-CoV-2 variants, some at high prevalence and others with increased fitness. Only with consistent, unbiased sequencing at scale that includes all geographic and demographic populations including those often underrepresented, together with continued international scientific collaborations and open data sharing, will we be able to accurately assess and follow new variants that emerge during the COVID-19 pandemic. Given that the SARS-CoV-2 VOCs B.1.1.7, B.1.351, and P.1 are still at relatively low frequency in the US, there is still time to scale currently insufficient national surveillance and implement critical control efforts in the weeks to come. Unless decisive and immediate public health action is taken, the increased transmission rate of the B.1.1.7 lineage and resultant higher effective reproduction number of SARS-CoV-2 will likely have severe consequences to COVID-19 mortality and morbidity in the US in the coming months.
Limitations of the study
In this study, we obtain robust estimates for the growth of B.1.1.7 from California, Florida, and Georgia. Our sampling within each state, however, is biased by the location of Helix’s commercial partners. Though geographic spread of the zip codes of patients obtaining Helix’s COVID-19 tests cover 89%, 99%, and 94% of California, Florida, and Georgia populations, respectively, the distribution within each state is uneven. In particular, the samples from California are largely biased toward San Diego County, while those in Florida are more evenly dispersed throughout the state. In addition, even though more than half of our tested samples are from the remaining 47 US states, obtaining accurate estimates of the country-wide prevalence of B.1.1.7 is complicated by the historically uneven sampling of SARS-CoV-2 genomes across the US.
STAR★Methods
Key resources table
| REAGENT or RESOURCE | SOURCE | IDENTIFIER |
|---|---|---|
| Critical commercial assays | ||
| Helix ® COVID-19 Test | Helix | EUA201636 |
| TaqPath COVID-19 Combo Kit | Thermo Fisher | Cat#A47814 |
| Illumina CovidSeq Test | Illumina | 1000000128490 v01 |
| MagMAX Viral/Pathogen II Nucleic Acid Isolation Kit | Thermo Fisher | Cat#A48383 |
| Omega BioTek MagBind Viral DNA/RNA Kit | Omega Biotek | Cat#M6246-03 |
| Nextera XT | Illumina | Cat#FC-131-1096 |
| Illumina NextSeq with 500/550 Mid Output Kit v2.5 | Illumina | Cat#20024908 |
| Illumina NovaSeq 6000 with SP Reagent Kit v1.5 | Illumina | Cat#20028400 |
| Nanopore MinION KAPA HyperPrep kit | Roche | Cat#07962363001 |
| End-repair and Ligation Sequencing Kit | Oxford Nanopore | Cat#SQK-LSK109 |
| Quick-DNA/RNA Viral MagBead kit | Zymo Research | Cat#R2141 |
| Illumina NovaSeq 6000 S4 flow cell & Reagent Kit v1.5 | Illumina | Cat#20044417 |
| Illumina NovaSeq Xp 4-lane Kit v1.5 | Illumina | Cat#20042337 |
| Omega BioTex MagBind Viral DNA/RNA Kit | Omega Biotek | Cat#M6246-03 |
| KindFisher Flex Purification System | Thermo Fisher | Cat#5400630 |
| Protoscript First Strand cDNA Synthesis Kit | NEB | Cat#E6560L |
| Q5 Hot Start High-Fidelity DNA Polymerase Kit | NEB | Cat #0493L |
| NEBNext Ultra II DNA Library Kit for Illumina | NEB | Cat#E7645L |
| MiSeq Reagent Kit V2 | Illumina | Cat#MS-102-2002 |
| Deposited data | ||
| SARS-CoV-2 reference genome | NCBI | NCBI: NC_045512.2 |
| B.1.1.7 first identified sequence | GISAID | GISAID: EPI_ISL_601443 |
| B.1.1.7 outgroup | NCBI | NCBI: NC_045512 |
| BEAST XML and log files | This paper | https://github.com/andersen-lab/paper_2021_early-b117-usa |
| Non-US B.1.1.7 and additional B.1.1 lineage sequences | GISAID | Data S2 |
| US B.1.1.7 sequences | This paper; GISAID | Data S2 |
| SGTF and B117 ongoing Summary Level Data | This paper | Data S2; https://github.com/myhelix/helix-covid19db |
| Oligonucleotides | ||
| SARS-CoV-2 primers | Quick et al., 2017 | N/A |
| NEBNext Multiplex Oligos for Illumina | NEB | Cat#E6440L |
| ARTIC Network n-CoV-19 V3 primers | ARTIC Network | https://github.com/artic-network/artic-ncov2019/tree/master/primer_schemes/nCoV-2019/V3 |
| Software and algorithms | ||
| DRAGEN COVIDSeq Test Pipeline v.1.3.0.28 | Illumina | N/A |
| Pangolin v2.0 | O’Toole et al., 2021b | https://github.com/cov-lineages/pangolin |
| NextClade v0.12.0 | Hadfield et al., 2018 | https://github.com/nextstrain/nextclade |
| Iqtree2 | Minh et al., 2020 | https://github.com/iqtree/iqtree2 |
| BEASTv1.10.5pre | Suchard et al., 2018 | https://github.com/beast-dev/beast-mcmc/tree/v1.10.5pre_thorney_v0.1.0 |
| BEAGLE | Ayres et al., 2019 | https://faculty.washington.edu/browning/beagle/beagle.html#download |
| baltic | https://github.com/evogytis/baltic | |
| Chiu lab genome assembly & variant calling | Deng et al., 2020 | N/A |
| Andersen Lab consensus calling for nanopore data | https://github.com/artic-network/artic-ncov2019 | |
| Snakemake | Köster and Rahmann, 2012 | https://snakemake.readthedocs.io/en/stable/ |
| bwa-mem | Li, 2013 | https://github.com/lh3/bwa |
| iVar v1.2.2 | Grubaugh et al., 2019b | https://github.com/andersen-lab/ivar/releases/tag/v1.2.2 |
| Transmissibility estimation | Volz et al., 2021 | N/A |
| Conditional reference prior for overall clock rate | Ferreira and Suchard, 2008 | N/A |
Resource availability
Lead contact
Helix data analyzed and presented here were obtainFurther information and requests for data, resources, and reagents should be directed to and will be fulfilled by the Lead Contact, Kristian G. Andersen (andersen@scripps.edu).
Materials availability
This study did not generate new unique reagents, but raw data and code generated as part of this research can be found in the Supplemental Files, as well as on public resources as specified in the Data and Code Availability section below.
Data and code availability
The raw data and code for our analyses can be found at https://github.com/andersen-lab/paper_2021_early-b117-usa and https://www.helix.com/covid19db. Genomes used in this analysis can be downloaded from GISAID. Original data for Figure S1 have been deposited to Mendeley Data: http://dx.doi.org/10.17632/3cvrz42tyg.4.
Experimental model and subject details
Ethical statement
Helix data analyzed and presented here were obtained through IRB protocol WIRB#20203438, which grants a waiver of consent for a limited dataset for the purposes of public health under section 164.512(b) of the Privacy Rule (45 CFR § 164.512(b)). This work was also evaluated and approved by the Institutional Review Board at The Scripps Research Institute under IRB protocol IRB-15-6664. The work was conducted under a waiver of consent and received a non-human subjects research designation (category 4 exemption) because this research was performed with remnant clinical diagnostic specimens. All samples were de-identified before receipt by the study investigators.
Method details
Helix COVID-19 test data
The Helix COVID-19 Test (EUA 201636) was run on specimens collected across the US, and results were obtained as part of our standard test processing workflow using specimens from anterior nares swabs. The Helix COVID-19 Test is based on the Thermo Fisher TaqPath COVID-19 Combo Kit, which targets three SARS-CoV-2 viral regions (N gene, S gene, and ORF1ab). Since samples are deidentified prior to analysis, and some individuals may test more than once, there may be some duplicate individuals in the analyses that follow that could cause deviation from the true population fraction. We attempted to de-duplicate the samples by removing those with identical age+sex+ethnicity+zipcode+clade, which only revealed three sets of two B.1.1.7 samples. Test results from positive cases, together with a limited amount of metadata (including sample collection date, state, and RT-qPCR Cq values for all gene targets), were used to build the research database used here. Ongoing summary level data are viewable at https://www.helix.com/covid19db.
SGTF and B.1.1.7 quantitative analysis
Following conservative approaches from prior studies ((Bal et al., 2020; Kara Steel And, 2021), we filtered our dataset for positive samples with strong amplification of the N gene (Cq < 27). SGTF was annotated to samples with no S gene detected (Cq = Null). While this approach removed true positive results, and likely some SGTF samples, the variable behavior of the assay at longer cycle times warrants strict filtering for analysis. We applied the Cq(N gene) < 27 filter to all positive samples prior to analysis. Date of sample collection from each patient’s Test Requisition Form was used as the sample date for all analyses. Sequenced samples reflect those collected from December 17, 2020 through February 19, 2021.
Since we enriched for B.1.1.7 by selecting SGTF samples for sequencing, proportion of B.1.1.7 in total positive tests were inferred using,
The winter storm in Texas led to a delay in shipments in every state but California from Feb 12th to Feb 18th. Hence, we only include testing data until Feb 11th for every state apart from California. In addition, there is a ∼2 week lag between sequence data and testing data. We had sequence data until Feb 2nd but we had testing data until Feb 19th with a 1-2 day variation between different states. In order to fully utilize the testing data, we used the mean proportion of observed B.1.1.7 sequences in the number of sequences SGTF samples from the last 5 days with available sequence data at each location, to estimate the proportion of B.1.1.7 in total positive tests from Feb 3rd to Feb 19th. The mean observed proportion of B.1.1.7 sequences in sequenced SGTF samples are shown below. We also performed a sensitivity analysis by setting the proportions of B.1.1.7 cases in sequenced SGTF samples at 0.5, 0.6, 0.7, 0.8, 0.9 and 1 and inferred the proportion of B.1.1.7 in positive tests from February 3rd to February 19th. We then computed the logistic growth rate across the entire testing period for each value (Data S1). We see that the growth rates at each location: California, Florida, Georgia, and USA, are robust to a variation of ± 0.1 in the proportion of B.1.1.7 in sequenced SGTF samples used to infer proportion of B.1.1.7 positive test over the period without sequence data (Feb 3rd to Feb 19th).
A logistic growth model was fit to the proportion of B.1.1.7 in positive tests over time using the nls() function in R. We used the confint2() function from the nlstools (nlstools: Tools for Nonlinear Regress…) package to compute confidence intervals for the fit. Following Voltz et al. (Volz et al., 2021), increased transmissibility was estimated using a serial interval of 5.5 days using,
Since logistic growth rates are roughly exponential in the early phase, we estimate a rough constant doubling time using,
Data and code used for the analysis are available at https://github.com/andersen-lab/paper_2021_early-b117-usa .
Helix/Illumina SARS-CoV-2 sequencing and consensus sequence generation
Residual samples remaining after reporting of the SARS-CoV-2 tests were selected for sequencing based on SGTF status and Cq(N gene) < 27 (note some early samples were selected up to Cq = 35, though most were unable to produce usable sequence). Beginning in late December 2020, SGTF residual samples were saved for sequencing within 3 days of SARS-CoV-2 testing at Helix.
All samples were prepped and sequenced following the Illumina CovidSeq Test Instructions for Use (1000000128490 v01). RNA was extracted from 400 μl of patient sample using the Quick-DNA/RNA Viral MagBead kit (Zymo Research, # R2141) but was not treated with Proteinase K. During the Amplify cDNA step, the annealing temperature was reduced from 65°C to 63°C. Samples were sequenced using the NovaSeq 6000 Sequencing system S4 flow cell, which included the NovaSeq 6000 Sequencing System S4 Reagent Kit v1.5 (35 cycles) (Illumina, # 20044417) and the NovaSeq Xp 4-Lane Kit v1.5 (Illumina, # 20042337).
The NovaSeq flow cell output was further processed through the Illumina DRAGEN COVIDSeq Test Pipeline v1.3.0.28 to perform variant and consensus sequence generation for each sample. First flowcell output was demultiplexed into per-sample FASTQ sequences. Each sequence was then run through a DRAGEN kmer-based alignment algorithm. This algorithm utilized a kmer reference database to match kmers from the sequencing read to kmers from the SARS-CoV-2 reference genome (NCBI Accession NC_045512.2). To create the kmer reference list, the SARS-CoV-2 reference genome was split into 32 nucleotide (nt) kmers, and any kmers containing cross-reactivity were removed. To measure cross-reactivity, the kmer reference list incorporated the NCBI database of 100,000 genomes for human and animal pathogens in addition to the SARS-CoV-2 reference. Bat and pangolin viruses were excluded because of their similarity to the SARS-CoV-2 genome. Each of the reference kmers was labeled with a corresponding amplicon from either SARS-CoV-2 or external controls. If an amplicon contained at least 150 matches to SARS-CoV-2 reference kmers, the amplicon was considered detected. Variant calling and consensus sequence generation was performed for every sample with at least 90 SARS-CoV-2 virus amplicon targets.
Variant calling was performed by first aligning reads to the SARS-CoV-2 reference genome with the DRAGEN alignment module, then processing the aligned reads with the DRAGEN sort and duplicate removal modules and finally calling variants using the DRAGEN somatic “tumor-only” variant caller configured for haploid genomes. To generate a consensus sequence in FASTA format, detected sequence variants from the VCF output meeting the following criteria were applied to the SARS-CoV-2 reference sequence: a “PASS” entry in the FILTER column, the variant allele frequency ≥ 0.5, and the total filtered depth > 10. Regions of sequence with coverage < 10 were hard masked with N’s in the consensus sequence.
Andersen lab at Scripps Research SARS-CoV-2 sequencing and consensus sequence generation
SARS-CoV-2 RNA was extracted from patient samples using either the MagMAX Viral/Pathogen II Nucleic Acid Isolation kit (Thermofisher, #A48383) or the Omega BioTek MagBind Viral DNA/RNA Kit (Omega Biotek, #M6246-03) according to manufacturers’ instructions. The extracted SARS-CoV-2 RNA was reverse transcribed using SuperScript IV VILO (ThermoFisher, #11756500). The virus cDNA was amplified in two multiplexed PCR reactions using ARTIC Network n-CoV-19 V3 primers and Q5 DNA High-Fidelity Master Mix (New England BioLabs, #M0492L) to generate tiled PCR amplicons. Libraries were then prepared for sequencing on Illumina platforms using Nextera XT (Illumina, #FC-131-1096). These libraries were sequenced on either Illumina NextSeq with a 500/550 Mid Output Kit v2.5 (Illumina, #20024908) or Illumina NovaSeq 6000 with an SP Reagent Kit v1.5 (Ilumina, #20028400) as 2x150 paired end reads (300 cycles). A subset of amplicon libraries were prepared for sequencing on the Nanopore MinION using KAPA HyperPrep kit (Roche, 07962363001) for end-repair and Ligation Sequencing Kit for adaptor ligation (Oxford Nanopore, #SQK-LSK109). These libraries were individually sequenced on MinION R9 flow cells.
Consensus sequences from nanopore data were assembled using the arctic-ncov2019 pipeline (https://github.com/artic-network/artic-ncov2019). Consensus sequences from Illumina data were assembled using an inhouse Snakemake (Köster and Rahmann, 2012) pipeline with bwa-mem (Li, 2013) and iVar v1.2.2 (Grubaugh et al., 2019b).
Chiu lab at UCSF SARS-CoV-2 sequencing and consensus sequence generation
Nasopharyngeal (NP) swab samples were prepared using 100 μl of primary sample mixed with 100 μl DNA/RNA shield (Zymo Research, #R1100-250). The 1:1 sample mixture was then extracted using the Omega BioTek MagBind Viral DNA/RNA Kit (Omega Biotek, # M6246-03) on KingFisherTM Flex Purification System with a 96 deep well head (ThermoFisher, 5400630). Extracted RNA was reverse transcribed to complementary DNA and tiling multiplexed amplicon PCR was performed using SARS-CoV-2 primers according to a published protocol (Quick et al., 2017) and reagents from the Protoscript First Strand cDNA Synthesis Kit (New England Biolabs, #E6560L) and the Q5 Hot Start High-Fidelity DNA Polymerase Kit (New England Biolabs, #M0493L). Amplicons were ligated with adapters and incorporated with barcodes using NEBNext Ultra II DNA Library Prep Kit for Illumina (New England Biolabs, # E7645L). Libraries were barcoded using NEBNext Multiplex Oligos for Illumina (96 unique dual-index primer pairs) (New England Biolabs, # E6440L). Amplicon libraries were then sequenced on either Illumina MiSeq or Novaseq 6000 as 2x150 paired-end reads (300 cycles) with the MiSeq Reagent Kit V2 (Illumina, # MS-102-2002) or the NovaSeq 6000 Sequencing System S4 Reagent Kit v1.5 (Illumina, # 20028312), respectively.
Genome assembly of viral reads and variant calling were performed using an in-house automated bioinformatics pipeline as previously described (Deng et al., 2020).
Phylogenetic analyses
Consensus FASTA for each sample was used as input to NextClade v0.12.0 (Hadfield et al., 2018) and Pangolin v2.0 (O’Toole et al., 2021b) to label phylogenetic clades and lineages based on (Rambaut et al., 2020b), respectively. Samples identified as B.1.1.7 were selected for further phylogenetic analysis.
We downloaded all 26,064 sequences from the B.1.1.7 lineage and 21,032 sequences from the B.1.1 lineage, which forms the immediate outgroup of the B.1.1.7 lineage, from GISAID as of January 24, 2021. We downsampled this dataset to retain 50 sequences from the B.1.1 lineage, 20% of the sequences from each country and collection date before 2020-12-31 and 5% of the sequences from each country and collection date after 2020-12-31 from the B.1.1.7 lineage. We combined this with our dataset of 662 B.1.1.7 sequences sampled in the U.S. to obtain a dataset of 4,158 sequences. (See Data S2 for GISAID acknowledgments). We masked positions 28,280 - 28,282 with Ns since most of the B.1.1.7 sequences in the US have Ns in these positions. We constructed a maximum-likelihood tree using this dataset under a HKY nucleotide substitution model implemented in iqtree2 (Minh et al., 2020). Using this phylogeny, we selected 954 sequences, including all the sequences in our dataset (n = 662) and we subsampled sequences outside the US such that we retained one sequence at every polytomy in the maximum-likelihood tree to represent global diversity of the B.1.1.7 lineage (n = 291 and NC_045512 as an outgroup root). We estimated the time-resolved phylogeny using a HKY nucleotide substitution model with discrete-gamma distributed rate variation under an uncorrelated relaxed clock model implemented in BEASTv1.10.5pre (Suchard et al., 2018). We used a relatively uninformative conditional reference prior on the overall clock rate (Ferreira and Suchard, 2008), an exponentially growing population prior over the unknown tree and the BEAGLE library to improve computational performance (Ayres et al., 2019). We ran four independent chains for 100 million steps each and summarized the estimates across the four runs. However, we also find that each of the 4 chains converges to similar estimates as shown in Data S2. The effective sample size of all scientifically relevant parameters in the combined log file was > 200 as shown in Data S2. The phylogenetic tree was visualized using baltic (https://github.com/evogytis/baltic). The BEAST XML, the log files for the 4 independent runs, and the combined log file are available at https://github.com/andersen-lab/paper_2021_early-b117-usa.
Quantification and statistical analysis
Statistical analyses were performed using BEAST and R and are described in the Figure legends and in the Method Details.
Additional resources
Continually updated Helix COVID-19 SGTF, B117, and viral sequences available at https://github.com/myhelix/helix-covid19db
US distribution Dashboard of COVID-19 lineages for samples originating from Helix Viral Surveillance: https://www.helix.com/pages/helix-covid-19-surveillance-dashboard.
Acknowledgments
We thank the employees of Helix, employees of Illumina, members of the CDC SPHERES consortium and California CovidNET, and members of the Andersen Lab for discussion and help with logistics. We thank the healthcare workers, frontline workers, and patients who made the collection of this SARS-CoV-2 dataset possible and all those who made genomic data available for analysis via GISAID (Data S2). This work has been funded by CDC BAA contracts 75D30121P10258 (Illumina, Helix) and 75D30120C09795 (G.W.Y., R.K., L.C.L., and K.G.A.), NIH NIAID 3U19AI135995-03S2 (M.A.S. and K.G.A.), U19AI135995 (M.A.S. and K.G.A.), U01AI151812 (K.G.A.), NIH NCATS UL1TR002550 (K.G.A.), the Innovative Genomics Institute (C.Y.C.), and the New Frontiers in Research Fund provided by the Canadian Institutes of Health Research (C.Y.C.). The findings and conclusions in this report are those of the authors and do not necessarily represent the official position of the Centers for Disease Control and Prevention. Use of trade names is for identification only and does not imply endorsement by the Centers for Disease Control and Prevention.
Author contributions
Conceptualization, N.L.W., W.L., J.T.L., K. Gangavarapu, M.Z., K.G.A., P.G.F., and E.d.F.; methodology, N.L.W., K. Gangavarapu, M.Z., M.A.S., and K.G.A.; software, N.L.W., S.W., M.I., W.L., K. Gangavarapu, K. Gietzen, J.L., and B.S.; validation, K. Gangavarapu, M.Z., C.A., and J.A.; formal analysis, N.L.W., A.B., E.T.C., K.M.S.B., K. Gangavarapu, M.Z., K. Gietzen, J.L., B.S., and M.A.S.; investigation, N.L.W., A.B., E.T.C., K.M.S.B., T.C., J.N., J.M.R., X.W., M.Z., C.A., R.R.-S., E.K., J.A., K. Gietzen, J.L., B.S., H.V., P.D.H., and P.S.; resources, S.W., T.C., G.L., J.N., J.M.R., C.R.-G., X.W., M.I., D.W., P.G.F., E.d.F., H.V., P.D.H., P.S., G.W.Y., R.K., and L.C.L.; data curation, N.L.W., S.W., G.L., K. Gangavarapu, M.Z., K. Gietzen, J.L., B.S., and S.S.; writing – original draft, N.L.W., A.B., E.T.C., K.M.S.B., W.L., K. Gangavarapu, M.Z., K.G.A., E.d.F., and C.Y.C.; writing - review & editing, N.L.W., W.L., K.a.G., K.G.A., M.Z., P.F., E.d.F., and M.A.S.; visualization, K. Gangavarapu and M.Z.; supervision, D.B., M.L., W.L., E. Sandoval, J.T.L., M.I., K.G.A., E.d.F., G.W.Y., R.K., L.C.L., E.d.F., M.W., C.Y.C., and M.A.S.; project administration, N.L.W., W.L., S.J., C.R.-G., E. Spencer, M.Z., K.G.A., E.d.F., and D.M.; funding acquisition, J.T.L., K.G.A., P.G.F., K.H., and C.Y.C. All authors read and approved the manuscript.
Declaration of interests
N.L.W., A.B., E.T.C., K.M.S.B., S.W., C.R.-G., E. Sandoval, T.C., X.W., J.N., J.M.R., G.L., D.W., D.B., M.L., M.I., S.J., J.T.L., and W.L. are employees of Helix. K. Gietzen, B.S., J.A., K.H., J.L., E.d.F., and P.G.F. are employees of Illumina. J.N., C.R.-G., and M.L. own stock in ILMN. K.G.A. has received consulting fees for advising on SARS-CoV-2, variants, and the COVID-19 pandemic.
Published: March 30, 2021
Footnotes
Supplemental information can be found online at https://doi.org/10.1016/j.cell.2021.03.052.
Supplemental information
References
- Ayres D.L., Cummings M.P., Baele G., Darling A.E., Lewis P.O., Swofford D.L., Huelsenbeck J.P., Lemey P., Rambaut A., Suchard M.A. BEAGLE 3: Improved Performance, Scaling, and Usability for a High-Performance Computing Library for Statistical Phylogenetics. Syst. Biol. 2019;68:1052–1061. doi: 10.1093/sysbio/syz020. [DOI] [PMC free article] [PubMed] [Google Scholar]
- Bal A., Destras G., Gaymard A., Regue H., Semanas Q., d’Aubarede C., Billaud G., Laurent F., Gonzalez C., Valette M., et al. Two-step strategy for the identification of SARS-CoV-2 variants co-occurring with spike deletion H69-V70, Lyon, France, August to December 2020. medRxiv. 2020 doi: 10.1101/2020.11.10.20228528. [DOI] [PMC free article] [PubMed] [Google Scholar]
- Borges B., Sousa C., Menezes L., Gonçalves A.M., Picão M., Almeida J.P., Vieita M., Santos R., Silva A.R., Costa M., et al. 2021. Tracking SARS-CoV-2 VOC 202012/01 (lineage B.1.1.7) dissemination in Portugal: insights from nationwide RT-PCR Spike gene drop out data.https://virological.org/t/tracking-sars-cov-2-voc-202012-01-lineage-b-1-1-7-dissemination-in-portugal-insights-from-nationwide-rt-pcr-spike-gene-drop-out-data/600 [DOI] [PMC free article] [PubMed] [Google Scholar]
- CDC . 2021. US COVID-19 Cases Caused by Variants.https://www.cdc.gov/coronavirus/2019-ncov/transmission/variant-cases.html [Google Scholar]
- Chand M., Hopkins S., Dabrera G., Achison C., Barclay W., Ferguson N., Volz E., Loman N., Rambaut A., Barrett J. Public Health England; 2020. Investigation of novel SARS-CoV-2 variant Variant of Concern 202012/01. [Google Scholar]
- Chand M., Hopkins S., Achison C., Anderson C., Allen H., Blomquist P., Chen C., Chalker V., Dabrera G., Edeghere O., et al. Public Health England; 2021. Investigation of novel SARS-CoV-2 variant Variant of Concern 202012/01. [Google Scholar]
- Cyranoski D. Alarming COVID variants show vital role of genomic surveillance. Nature. 2021;589:337–338. doi: 10.1038/d41586-021-00065-4. [DOI] [PubMed] [Google Scholar]
- Davies N.G., Barnard R.C., Jarvis C.I., Kucharski A.J., Munday J., Pearson C.A.B., Russell T.W., Tully D.C., Abbott S., Gimma A., et al. London School of Hygiene and Tropical Medicine; 2020. Estimated transmissibility and severity of novel SARS-CoV-2 Variant of Concern 202012/01 in England. [Google Scholar]
- Davis C. 2020. San Diego man tests positive for new, more contagious UK variant of COVID-19.https://www.businessinsider.com/san-diego-man-tests-positive-for-uk-variant-covid-19-2020-12 Business Insider. [Google Scholar]
- Deng X., Gu W., Federman S., du Plessis L., Pybus O.G., Faria N.R., Wang C., Yu G., Bushnell B., Pan C.-Y., et al. Genomic surveillance reveals multiple introductions of SARS-CoV-2 into Northern California. Science. 2020;369:582–587. doi: 10.1126/science.abb9263. [DOI] [PMC free article] [PubMed] [Google Scholar]
- ECDC . European Centre for Disease Prevention and Control; 2021. Risk related to the spread of new SARS-CoV-2 variants of concern in the EU/EEA – first update. [Google Scholar]
- Faria N.R., Morales Claro I., Candido D., Moyses Franco L.A., Andrade P.S., Coletti T.M., Silva C.A.M., Sales F.C., Manuli E.R., Aguiar R.S., et al. 2021. Genomic characterisation of an emergent SARS-CoV-2 lineage in Manaus: preliminary findings.https://virological.org/t/genomic-characterisation-of-an-emergent-sars-cov-2-lineage-in-manaus-preliminary-findings/586 [Google Scholar]
- Ferreira M.A.R., Suchard M.A. Bayesian analysis of elapsed times in continuous-time Markov chains. Can. J. Stat. 2008;36:355–368. [Google Scholar]
- Galloway S.E., Paul P., MacCannell D.R., Johansson M.A., Brooks J.T., MacNeil A., Slayton R.B., Tong S., Silk B.J., Armstrong G.L., et al. Emergence of SARS-CoV-2 B.1.1.7 Lineage - United States, December 29, 2020-January 12, 2021. MMWR Morb. Mortal. Wkly. Rep. 2021;70:95–99. doi: 10.15585/mmwr.mm7003e2. [DOI] [PMC free article] [PubMed] [Google Scholar]
- Grubaugh N.D., Ladner J.T., Lemey P., Pybus O.G., Rambaut A., Holmes E.C., Andersen K.G. Tracking virus outbreaks in the twenty-first century. Nat. Microbiol. 2019;4:10–19. doi: 10.1038/s41564-018-0296-2. [DOI] [PMC free article] [PubMed] [Google Scholar]
- Grubaugh N.D., Gangavarapu K., Quick J., Matteson N.L., De Jesus J.G., Main B.J., Tan A.L., Paul L.M., Brackney D.E., Grewal S., et al. An amplicon-based sequencing framework for accurately measuring intrahost virus diversity using PrimalSeq and iVar. Genome Biol. 2019;20:8. doi: 10.1186/s13059-018-1618-7. [DOI] [PMC free article] [PubMed] [Google Scholar]
- Hadfield J., Megill C., Bell S.M., Huddleston J., Potter B., Callender C., Sagulenko P., Bedford T., Neher R.A. Nextstrain: real-time tracking of pathogen evolution. Bioinformatics. 2018;34:4121–4123. doi: 10.1093/bioinformatics/bty407. [DOI] [PMC free article] [PubMed] [Google Scholar]
- Iacobucci G. Covid-19: New UK variant may be linked to increased death rate, early data indicate. BMJ. 2021;372:n230. doi: 10.1136/bmj.n230. [DOI] [PubMed] [Google Scholar]
- Kara Steel And . Office for National Statistics; 2021. Coronavirus (COVID-19) Infection Survey, UK - Office for National Statistics. [Google Scholar]
- Köster J., Rahmann S. Snakemake—a scalable bioinformatics workflow engine. Bioinformatics. 2012 doi: 10.1093/bioinformatics/bts480. [DOI] [PubMed] [Google Scholar]
- Li H. Broad Institute; 2013. Aligning Sequence Reads, Clone Sequences and Assembly Contigs with BWA-MEM. [Google Scholar]
- Minh B.Q., Schmidt H.A., Chernomor O., Schrempf D., Woodhams M.D., von Haeseler A., Lanfear R. IQ-TREE 2: New Models and Efficient Methods for Phylogenetic Inference in the Genomic Era. Mol. Biol. Evol. 2020;37:1530–1534. doi: 10.1093/molbev/msaa015. [DOI] [PMC free article] [PubMed] [Google Scholar]
- O’Toole Á., Hill V., Pybus2 O.G., Watts A., Bogoch I.I., Khan K., Messina, Jane P., et al. The COVID-19 Genomics UK (COG-UK) consortium, Network for Genomic Surveillance in South Africa (NGS-SA), Brazil-UK CADDE Genomic Network, Tegally, H. 2021. Tracking the international spread of SARS-CoV-2 lineages B.1.1.7 and B.1.351/501Y-V2. [DOI] [PMC free article] [PubMed] [Google Scholar]
- O’Toole Á., McCrone J.T., Scher E. Pangolin; 2021. Phylogenetic Assignment of Named Global Outbreak LINeages. [Google Scholar]
- Public Health England . GOV; 2020. Investigation of Novel Sars-CoV-2 Variant: Variant of Concern 202012/01. [Google Scholar]
- Quick J., Grubaugh N.D., Pullan S.T., Claro I.M., Smith A.D., Gangavarapu K., Oliveira G., Robles-Sikisaka R., Rogers T.F., Beutler N.A., et al. Multiplex PCR method for MinION and Illumina sequencing of Zika and other virus genomes directly from clinical samples. Nat. Protoc. 2017;12:1261–1276. doi: 10.1038/nprot.2017.066. [DOI] [PMC free article] [PubMed] [Google Scholar]
- Rambaut A., Loman N., Pybus O., Barclay W., Barrett J., Carabelli A., Connor T., Peacock T., Robertson D.L., Volz E. CoG-UK; 2020. Preliminary Genomic Characterisation of an Emergent SARS-CoV-2 Lineage in the UK Defined by a Novel Set of spike mutations (COVID-19 Genomics Consortium UK. [Google Scholar]
- Rambaut A., Holmes E.C., O’Toole Á., Hill V., McCrone J.T., Ruis C., du Plessis L., Pybus O.G. A dynamic nomenclature proposal for SARS-CoV-2 lineages to assist genomic epidemiology. Nat. Microbiol. 2020;5:1403–1407. doi: 10.1038/s41564-020-0770-5. [DOI] [PMC free article] [PubMed] [Google Scholar]
- Romo V. NPR; 2020. Florida Becomes 3rd U.S. State To Identify New Coronavirus Variant.https://www.npr.org/sections/coronavirus-live-updates/2020/12/31/952577326/florida-becomes-3rd-u-s-state-to-identify-new-coronavirus-variant [Google Scholar]
- Starr T.N., Greaney A.J., Addetia A., Hannon W.W., Choudhary M.C., Dingens A.S., Li J.Z., Bloom J.D. Prospective mapping of viral mutations that escape antibodies used to treat COVID-19. Science. 2021;371:850–854. doi: 10.1126/science.abf9302. [DOI] [PMC free article] [PubMed] [Google Scholar]
- Statens Serums Institute . 2021. Estimerede scenarier for udviklingen i cluster B.1.1.7 27.01.https://covid19.ssi.dk/-/media/cdn/files/estimerede-scenarier-for-udviklingen-i-cluster-b117-270120212.pdf?la=da Published January 4, 2021. [Google Scholar]
- Suchard M.A., Lemey P., Baele G., Ayres D.L., Drummond A.J., Rambaut A. Bayesian phylogenetic and phylodynamic data integration using BEAST 1.10. Virus Evol. 2018;4:vey016. doi: 10.1093/ve/vey016. [DOI] [PMC free article] [PubMed] [Google Scholar]
- Tegally H., Wilkinson E., Giovanetti M., Iranzadeh A., Fonseca V., Giandhari J., Doolabh D., Pillay S., San E.J., Msomi N., et al. Emergence and rapid spread of a new severe acute respiratory syndrome-related coronavirus 2 (SARS-CoV-2) lineage with multiple spike mutations in South Africa. medRxiv. 2020 doi: 10.1101/2020.12.21.20248640. [DOI] [Google Scholar]
- TSA . 2021. TSA checkpoint travel numbers.https://www.tsa.gov/coronavirus/passenger-throughput [Google Scholar]
- Volz E., Mishra S., Chand M., Barrett J.C., Johnson R., Geidelberg L., Hinsley W.R., Laydon D.J., Dabrera G., O’Toole Á., et al. Transmission of SARS-CoV-2 Lineage B.1.1.7 in England: Insights from linking epidemiological and genetic data. medRxiv. 2021 https://www.imperial.ac.uk/media/imperial-college/medicine/mrc-gida/2020-12-31-COVID19-Report-42-Preprint-VOC.pdf [Google Scholar]
- Washington N.L., White S., Barrett K.M.S., Cirulli E.T., Bolze A., Lu J.T. S gene dropout patterns in SARS-CoV-2 tests suggest spread of the H69del/V70del mutation in the US. medRxiv. 2020 doi: 10.1101/2020.12.24.20248814. [DOI] [Google Scholar]
Associated Data
This section collects any data citations, data availability statements, or supplementary materials included in this article.
Supplementary Materials
Data Availability Statement
The raw data and code for our analyses can be found at https://github.com/andersen-lab/paper_2021_early-b117-usa and https://www.helix.com/covid19db. Genomes used in this analysis can be downloaded from GISAID. Original data for Figure S1 have been deposited to Mendeley Data: http://dx.doi.org/10.17632/3cvrz42tyg.4.