Abstract
Liquid chromatography mass spectrometry (LC-MS) delivers sensitive peptide analysis for proteomics, but the methodology requires extensive analysis time, hampering throughput. Here, we demonstrate that using gas-phase peptide separation instead of LC enables fast proteome analysis. Using Direct Infusion – Shotgun Proteome Analysis (DI-SPA) by data-independent acquisition mass spectrometry (DIA-MS), we demonstrate the targeted quantification of over 500 proteins within minutes of MS data collection (~3.5 proteins/second). We show the utility of this technology to perform a complex multifactorial proteome study of interactions between nutrients, genotype, and mitochondrial toxins in a collection of cultured human cells. More than 45,000 quantitative protein measurements from 132 samples were achieved in only 4.4 hours of MS data collection. Enabling fast, unbiased proteome quantification without LC, DI-SPA offers an approach to boosting throughput critical to drug and biomarker discovery studies that require analysis of thousands of proteomes.
INTRODUCTION
Shotgun proteomics methods using liquid chromatography coupled to mass spectrometry (LC-MS) achieve the greatest depth and breadth of proteome coverage1,2. The time required for such comprehensive proteome analysis, once a major burden, has been driven down by technological adaptation. Just over a decade ago, weeks of MS data collection were required to quantify nearly all expressed yeast proteins3; in 2016, our group accomplished the same task in just over one hour4. More recent advancements in data-independent acquisition (DIA) and fast LC have further reduced analysis times and enabled routine protein quantification at rates of up to 15,000 non-unique proteins per hour5,6. Still, as the fields of proteomics and metabolomics push for higher throughput, the requirement for liquid-phase separations inevitably requires time that in turn limits throughput. This is amplified by time needed to load and re-equilibrate the LC column.
In theory, omitting LC prefractionation could decrease analysis time7. Several papers describe qualitative analysis of peptides from simple mixtures by direct infusion, an approach that is already common in metabolomics8,9. Twenty-five years ago, direct infusion of peptides from trypsin-digested gel bands or standard proteins was common, though offered limited depth, typically less than 60 peptides10–15. As LC and MS co-evolved, LC-MS became the premiere technology for the analysis of the tremendously complex mixture of peptides that results from whole proteome digestion. Although direct infusion was recently used to profile histone modifications in one minute16, it has not been able to interrogate peptide mixtures from the human proteome, which contain well over a million distinct peptide sequences17. Several factors may hinder detection of peptides from such complex mixtures by electrospray ionization, including: peptide polarity18, mobile phase composition19,20, ion suppression21, and ion competition22. However, recent advancements in MS around accurate mass measurement, sensitivity, and speed have inspired us to revisit the concept of peptide identification without LC.
Among recent MS advances, ion mobility has enabled an additional dimension of gas-phase peptide cation separation 23–30 that complements fractionation by quadrupole selection31,32. Unlike liquid separations that work on the principle of hydrophobicity, the ion mobility separations sort gas-phase peptide ions based on their charge and shape. High-field asymmetric waveform ion mobility spectrometry (FAIMS) can permit very rapid gas-phase separation through a device placed between the electrospray emitter and atmospheric pressure inlet of a mass spectrometer. FAIMS filters ions through inner and outer electrodes based on their differential mobility in high or low field asymmetric fields. Analyte separation by FAIMS and other ion mobility methods may improve the analysis of complex peptide mixtures without LC.
Here, we show that gas-phase separation can substitute for LC to deliver expeditious analysis of complex peptide mixtures from the human proteome. We name this strategy Direct Infusion – Shotgun Proteome Analysis (DI-SPA). Peptide samples are directly infused, ionized by electrospray, and the resulting peptide cations are separated in the gas phase before detection by DIA with high resolution MS/MS. We explored DI-SPA data collection parameters and found that as the extent of gas-phase separations is positively correlated with the depth of observable proteome coverage. Strategies for peptide identification and quantification with DI-SPA were validated with standard mixtures of known heavy and light protein ratios and compared with traditional LC-MS peptide quantification. The utility of DI-SPA for high throughput biological screening was demonstrated by quantifying proteomic responses of human cells to a complex multi-factorial experiment grid of mitochondrial toxins, genotypes, and nutrients. Application of DI-SPA to quantify proteins from mitochondria subcellular fractions is also demonstrated. Altogether, the results show that DI-SPA enables fast proteome analysis without LC separation, permitting rapid quantification of biologically relevant proteome changes in cells and purified mitochondria.
RESULTS
We first sought to determine how effectively gas-phase fractionation by FAIMS and a quadrupole mass filter purify peptide cations using computational calculations. Precursor m/z values and maximum FAIMS compensation voltage (CV) transmission for human peptide identifications from LC-FAIMS-MS/MS27 were compiled and used for this theoretical gas-phase fractionation. The data was composed of 112,742 unique peptide precursors with maximum CV values from −20 to −120, and precursor m/z values ranging from 300 to 1,350. The number of peptides in each theoretical quadrupole isolation range (m/z 4 or 2), and FAIMS CV (10 V steps from −20 V to −120 V), was plotted as a stacked histogram (Extended Data Fig. 1). X-axis bin widths are analogous to the isolation width used for the quadrupole mass filter during MS analysis. Using a theoretical isolation width of 4 m/z without FAIMS, over 1,000 precursors are observed in a single 4 m/z window. By reducing the isolation width to 2 m/z, we observe only 564 peptide precursors; coupling this reduced isolation width to FAIMS, complexity can be even further reduced to 164 peptide precursors. This theoretical analysis indicated that, indeed, increased gas-phase fractionation significantly decreases the complexity of peptide precursors in any given channel. Smaller quadrupole selection ranges linearly reduce the number of peptides selected, and FAIMS selection enables a complementary but nonlinear reduction in the number of peptide ions. Even with small quadrupole selection windows and FAIMS selection, multiple peptide ions are predicted to be present in every window. Fragmentation, a means to identify those co-selected peptide ions, produces chimeric fragment ion spectra with signals that distinguish the original peptides. Altogether this computational analysis reveals that gas-phase fractionation can theoretically reduce the complexity of peptide ions for analysis without LC.
Based on these theoretical results, we experimentally tested whether proteins and peptides could be identified and quantified with gas-phase fractionation instead of LC. Peptides were delivered to the nanospray emitter by direct infusion (DI) (Extended Data Fig 2), and electro-sprayed ions were fractionated by FAIMS, quadrupole selection, and dissociated using beam-type collisional activation (HCD), followed by product ion detection in the orbitrap (Figure 1A). To perform peptide identification from these multiplexed spectra, we used MSPLIT-DIA33, a technique that applies the concept of spectral projection34 to extract library-spectra fragment ions within the instrument mass accuracy range from candidate spectra. Examples of raw spectra along with their projected spectra and library spectra for identified peptides (<1% FDR) reveal that extraction of projected spectra with 10 ppm fragment mass tolerance (Supplementary Figure 1) effectively produces matches with good spectral correlation (Figure 1B, 1C).
Figure 1: Overview of Direct Infusion Shotgun Proteome Analysis (DI-SPA) by Data-Independent Acquisition Mass Spectrometry (DIA-MS) strategy for peptide identification.
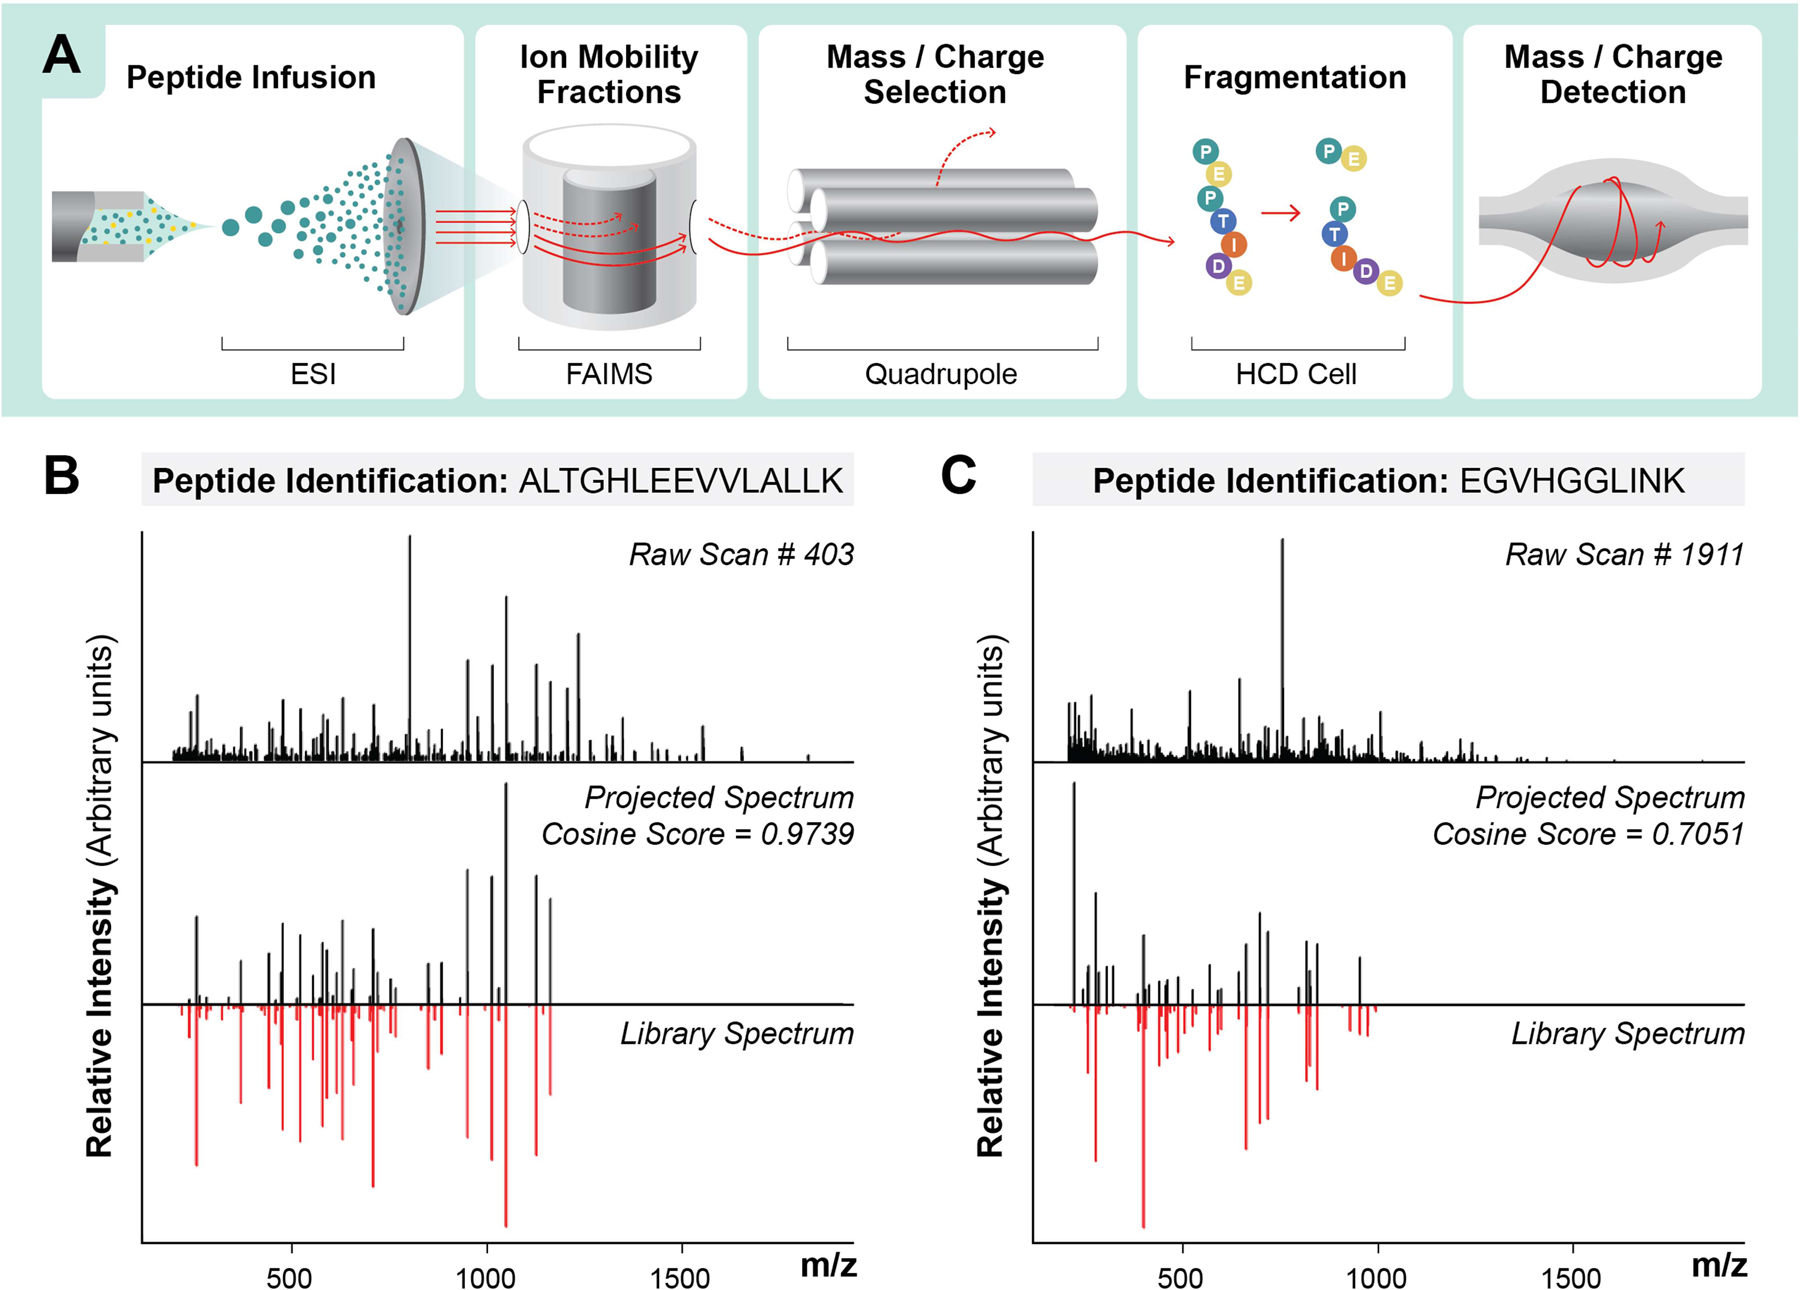
(A) Scheme showing strategy for peptide analysis by DI-SPA. Examples of peptide identifications using the projected spectrum concept from MSPLIT-DIA, including (B) a high-scoring peptide from a search result and (C) a low-scoring peptide from a search result.
To optimize identifications, we tested a grid of mass spectrometer settings in parameter scouting experiments using peptide samples from whole human proteome proteolysis (MCF7 cells) (Extended Data Fig 3A). Parameters included: use of FAIMS, width of the Q1 quadrupole isolation window (Figure 2A), maximum ion accumulation time (Figure 2B), and orbitrap resolution (Figure 2C). In each experiment, peptide solution was delivered to the source by DI, and each FAIMS CV of interest was held constant while stepping through Q1 isolation windows that spanned the precursor mass range of interest (Extended Data Fig 3B). The number of peptide identifications increases as Q1 isolation window width decreases, ion injection time increases, and orbitrap resolution increases. For almost all tested parameters, the addition of FAIMS increased the identified peptides. At the optimal setting, use of FAIMS increased peptide identifications by up to ~3-fold (Figure 2B). An increased number of peptide identifications due to use of FAIMS and smaller mass filter selection windows indicates that the extent of gas-phase fractionation is a key determinant in the success of DI-SPA. These data culminated in discovery of the optimal settings for peptide analysis without chromatography.
Figure 2: Peptide and Protein Identification by DI-SPA.
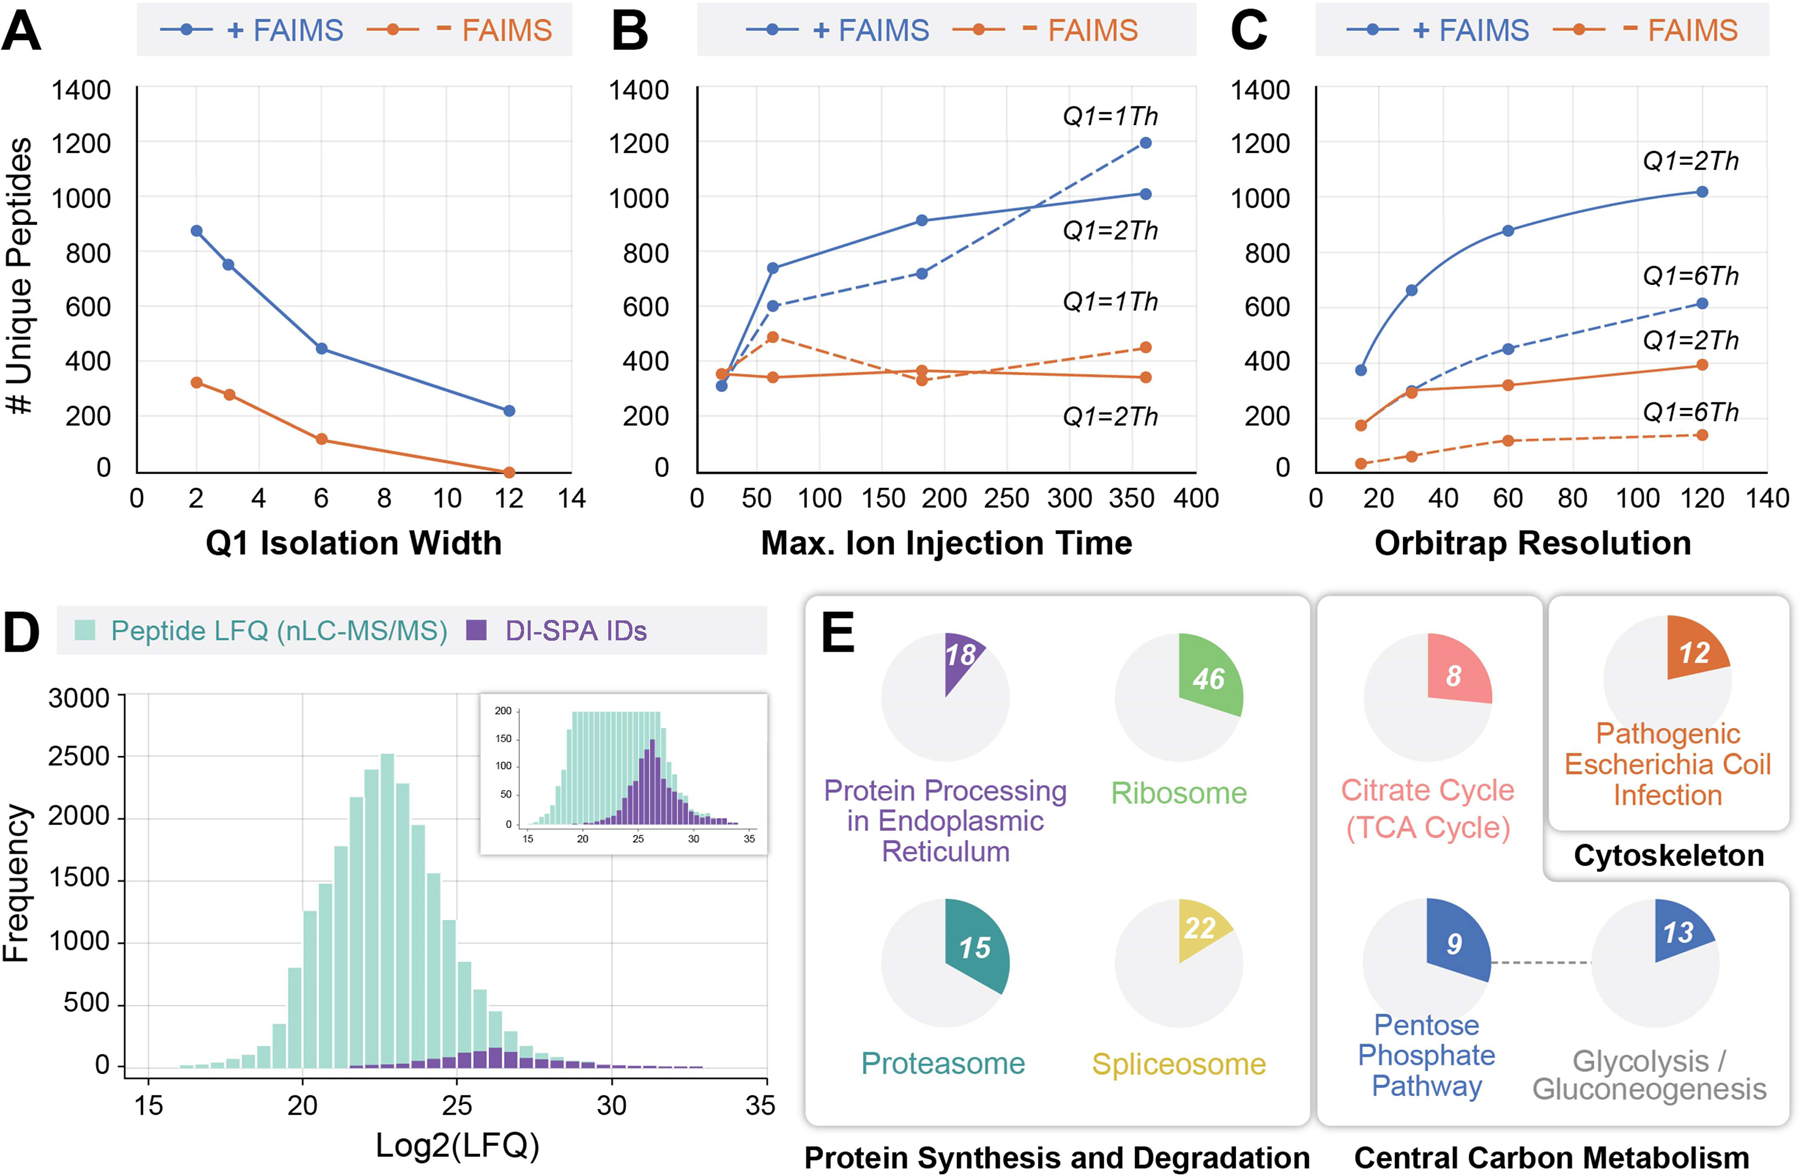
(A) Unique peptide identifications as a function of mass filter isolation window width with resolution fixed at 60,000 and maximum ion accumulation time fixed at 118 ms, (B) maximum ion accumulation time with orbitrap resolution fixed at 60,000 and isolation width fixed at 1 or 2 m/z, or (C) orbitrap resolution with maximum ion injection time fixed at 118 ms and isolation width fixed at either 2 or 6 m/z. (D) Distribution of peptide log2(LFQ) values from traditional nLC-MS/MS showing the subset of 1,173 peptides that were identified by the optimal DI-SPA conditions from the scouting experiment (360 ms ion injection time, 60k resolution, 1 m/z isolation width). (E) KEGG pathway enrichment analysis of 395 proteins identified (FDR<1.25%) by DI-SPA of MCF7 cells. The number in the circle indicates how many proteins in the pathway were identified, and the proportion of each circle reflects the coverage of the proteins in each pathway. The connection between the pentose phosphate and glycolysis pathways indicates a kappa connectivity score of >0.4. Unique identifications of peptides in panels A–C are the average of two independent experiments.
We next examined the relationship between detectable peptide precursor ion features (MS1) and peptide identifications by DI-SPA. The same solution of peptides from the MCF7 proteome was infused, and precursor ion scans were collected with the same FAIMS gas-phase fractions. Thrash feature identification35, as implemented in decontools36, was used to identify a total of 1,477 MS1 features (excluding +1 ions). Peptide precursor masses identified by DI-SPA were compared with the observed precursor feature masses (Supplementary Figure 2). DI-SPA enabled identification of 1,435 unique peptides with 55% overlap in identified precursor masses with the precursor masses observed in the MS1-only experiment. Comparison of the matched features as a function of deconvoluted mass and relative abundance from the MS1 revealed that many of the features found by DI-SPA were low abundance (Supplementary Figure 2). Thus, compared to DDA which requires observation of a mass in the MS1 spectra, the DI-SPA strategy picked up more low-abundance ions, probably due to the scan sequence that waits for a signal at each possible mass window.
To better understand the potential utility of DI-SPA, we examined the character of peptide identifications. The same MCF7 peptide sample was analyzed by traditional nLC-MS/MS to perform label-free quantification (LFQ), and peptide identifications from both methods were compared (Figure 2D). Peptide identifications from DI-SPA were a sample of the most abundant peptides present in the proteome sample. KEGG pathway enrichment analysis of the 395 protein identifications (protein-level FDR < 1.25%) from the same DI-SPA analysis revealed significant coverage of several pathways central to biology, including central carbon metabolism (glycolysis, pentose phosphate pathway, TCA cycle) and protein synthesis and degradation (splicosome, ribosome, proteasome, and proteome processing in the endoplasmic reticulum) (Figure 2E, Extended Data Fig 4, Table S1).
The robustness and reproducibility of DI-SPA was assessed by consecutively analyzing the same MCF7 peptide sample 100 times (Extended Data Fig 5). Because DI-SPA is so fast, this data was collected overnight. An average of 1,542 peptides are identified per injection, with a standard deviation of 63.1 peptides (4.1% or the mean). Of all peptides identified, exactly 869 were identified from all 100 injections (56% of average peptide identifications), and 1,264 were identified in at least 80/100 injections (82% of average peptide identifications). The reproducibility of DI-SPA analysis over 100 replicates therefore exceeds that of pairs of technical replicates from some DDA strategies37.
DI-SPA was then challenged with one of the most difficult sample matrices, human plasma. Two different sources of human plasma were either not depleted, or the top 12 most abundant proteins were depleted, and the samples were analyzed by DI-SPA (Extended Data Fig 6). DI-SPA performed similar on both frozen or lyophilized human plasma samples and found more peptides and proteins from depleted samples. Compared with the standard few hundred protein identifications from traditional nLC-MS/MS studies38, DI-SPA identified 745 peptides that map to 109 human proteins (Table S2). Although this proof of principle plasma analysis by DI-SPA was done with the scouting method in >15 minutes (as shown in Extended Data Fig 3), subsequent methods could target only one peptide per plasma protein and achieve the same analysis in only about 31 seconds (~0.28 seconds per scan).
Next, a quantitative DI-SPA strategy was evaluated using defined mixtures of A549 cells labeled with heavy or light arginine and lysine (Extended Data Fig 7). Labeled and combined proteolytically digested samples were analyzed by standard nLC-MS/MS and MaxQuant to verify the labeling ratios and provide a baseline of quantitative values for comparison (Figure 3A). One sample of A549 peptides was first analyzed with the optimal peptide identification settings determined by the scouting experiments, resulting in the identification of 2,248 unique peptides (Table S3). To enable quantification from heavy and light y-type ion pairs using DI-SPA, a new data collection method was built that co-isolated light and heavy SILAC precursor pairs from doubly charged peptides using the ion multiplexing feature (MSX) of the Orbitrap Fusion Lumos (Supplementary Figure 3). Peptides were quantified from MSX DI-SPA data by taking the median heavy/light ratio of the y-type ions in the fragment ion spectra. Only the three most abundant y-type ion fragments matched to the spectral library were used for quantification. From these data, we conclude that DI-SPA can effectively quantify peptides (Figure 3B). Finally, a targeted protein quantification DI-SPA method was developed to quantify selected proteins more quickly. This method targeted heavy and light peptide precursor masses for one peptide from each of the 552 identified proteins (Extended Data Fig 8, Table S4). Up to 525 proteins were quantified in only 2.5 minutes of MS data collection, resulting in a rate of 3.5 proteins quantified per second. The quantitative quality of this fast, targeted DI-SPA method was like the untargeted DI-SPA method (Figure 3C). Since this method is based on multiple fragment ion ratios from a single MS/MS measurement, we tested if three repeated measurement of the same peptide would produce better quantitation. There was good agreement between the single measurement and triple measurement ratios (Supplementary Figure 4), suggesting that a single measurement is sufficient.
Figure 3: Peptide and Protein Quantification with DI-SPA.
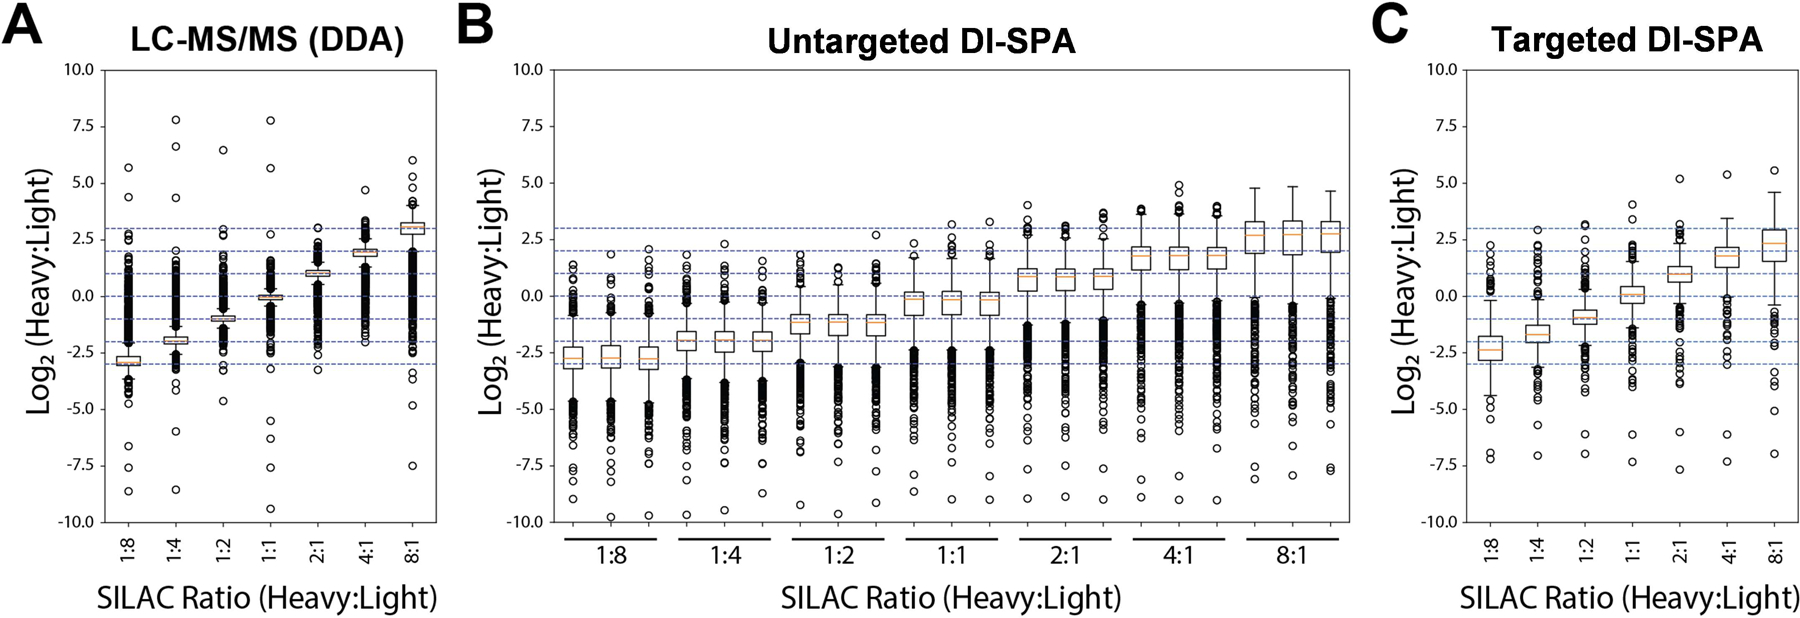
Heavy- and light-isotope-labeled samples were combined at defined ratios to assess quantification capability. (A) Peptides were first analyzed by standard LC-MS and quantified by MaxQuant. (B) Untargeted quantification of peptides was performed using y-type ion signals from co-fragmentation of doubly charged heavy and light SILAC pairs by DI-SPA (each ratio was measured in triplicate). (C) Targeted quantification of up to 525 proteins was performed using y-type ion signals from co-fragmentation of heavy and light SILAC pairs by DI-SPA. The boxplots show the median (percentile 50%) with an orange line, and the box represents the inner quartile range (IQR) Q1 and Q3 (percentiles 25 and 75). Whiskers show Q1 – 1.5*IQR and Q3 + 1.5*IQR.
To demonstrate the utility of DI-SPA for discovering biologically relevant proteome remodeling, we applied it to quantify proteome changes from a multifactorial experiment in cultured human 293T cells (Figure 4A). Wild type or PPTC7 knockout (KO) cells were grown in either standard or modified media (DMEM or HPLM39, respectively) and treated in triplicate with one of nine mitochondrial toxins or two controls for a total 132 samples. These conditions were chosen because of their known effects on metabolism and mitochondria, which we hypothesized would induce changes in proteins and thus provide a suitable testbed for DI-SPA. Again, a peptide discovery experiment (like Extended Data Figure 3) was first performed to identify peptides for subsequent targeted quantification experiments, in which 1,384 peptides were identified (peptide-level FDR = 0.93%) from 451 proteins (protein-level FDR = 2.8%). Next, a quantitative targeted DI-SPA assay was generated to expeditiously monitor the most intense peptide from each of the 451 proteins. This method was used to analyze all 132 samples, generating 132 proteotypes and requiring only 120 seconds of MS data collection per sample. A total of 341 out of 451 protein targets were quantified across all 132 samples in only 4.4 hours of total MS data acquisition, which corresponds to over 45,000 proteins quantified at a rate of nearly three proteins per second (Figure 4B).
Figure 4: Application of DI-SPA for rapid screening of human cellular responses to toxins.
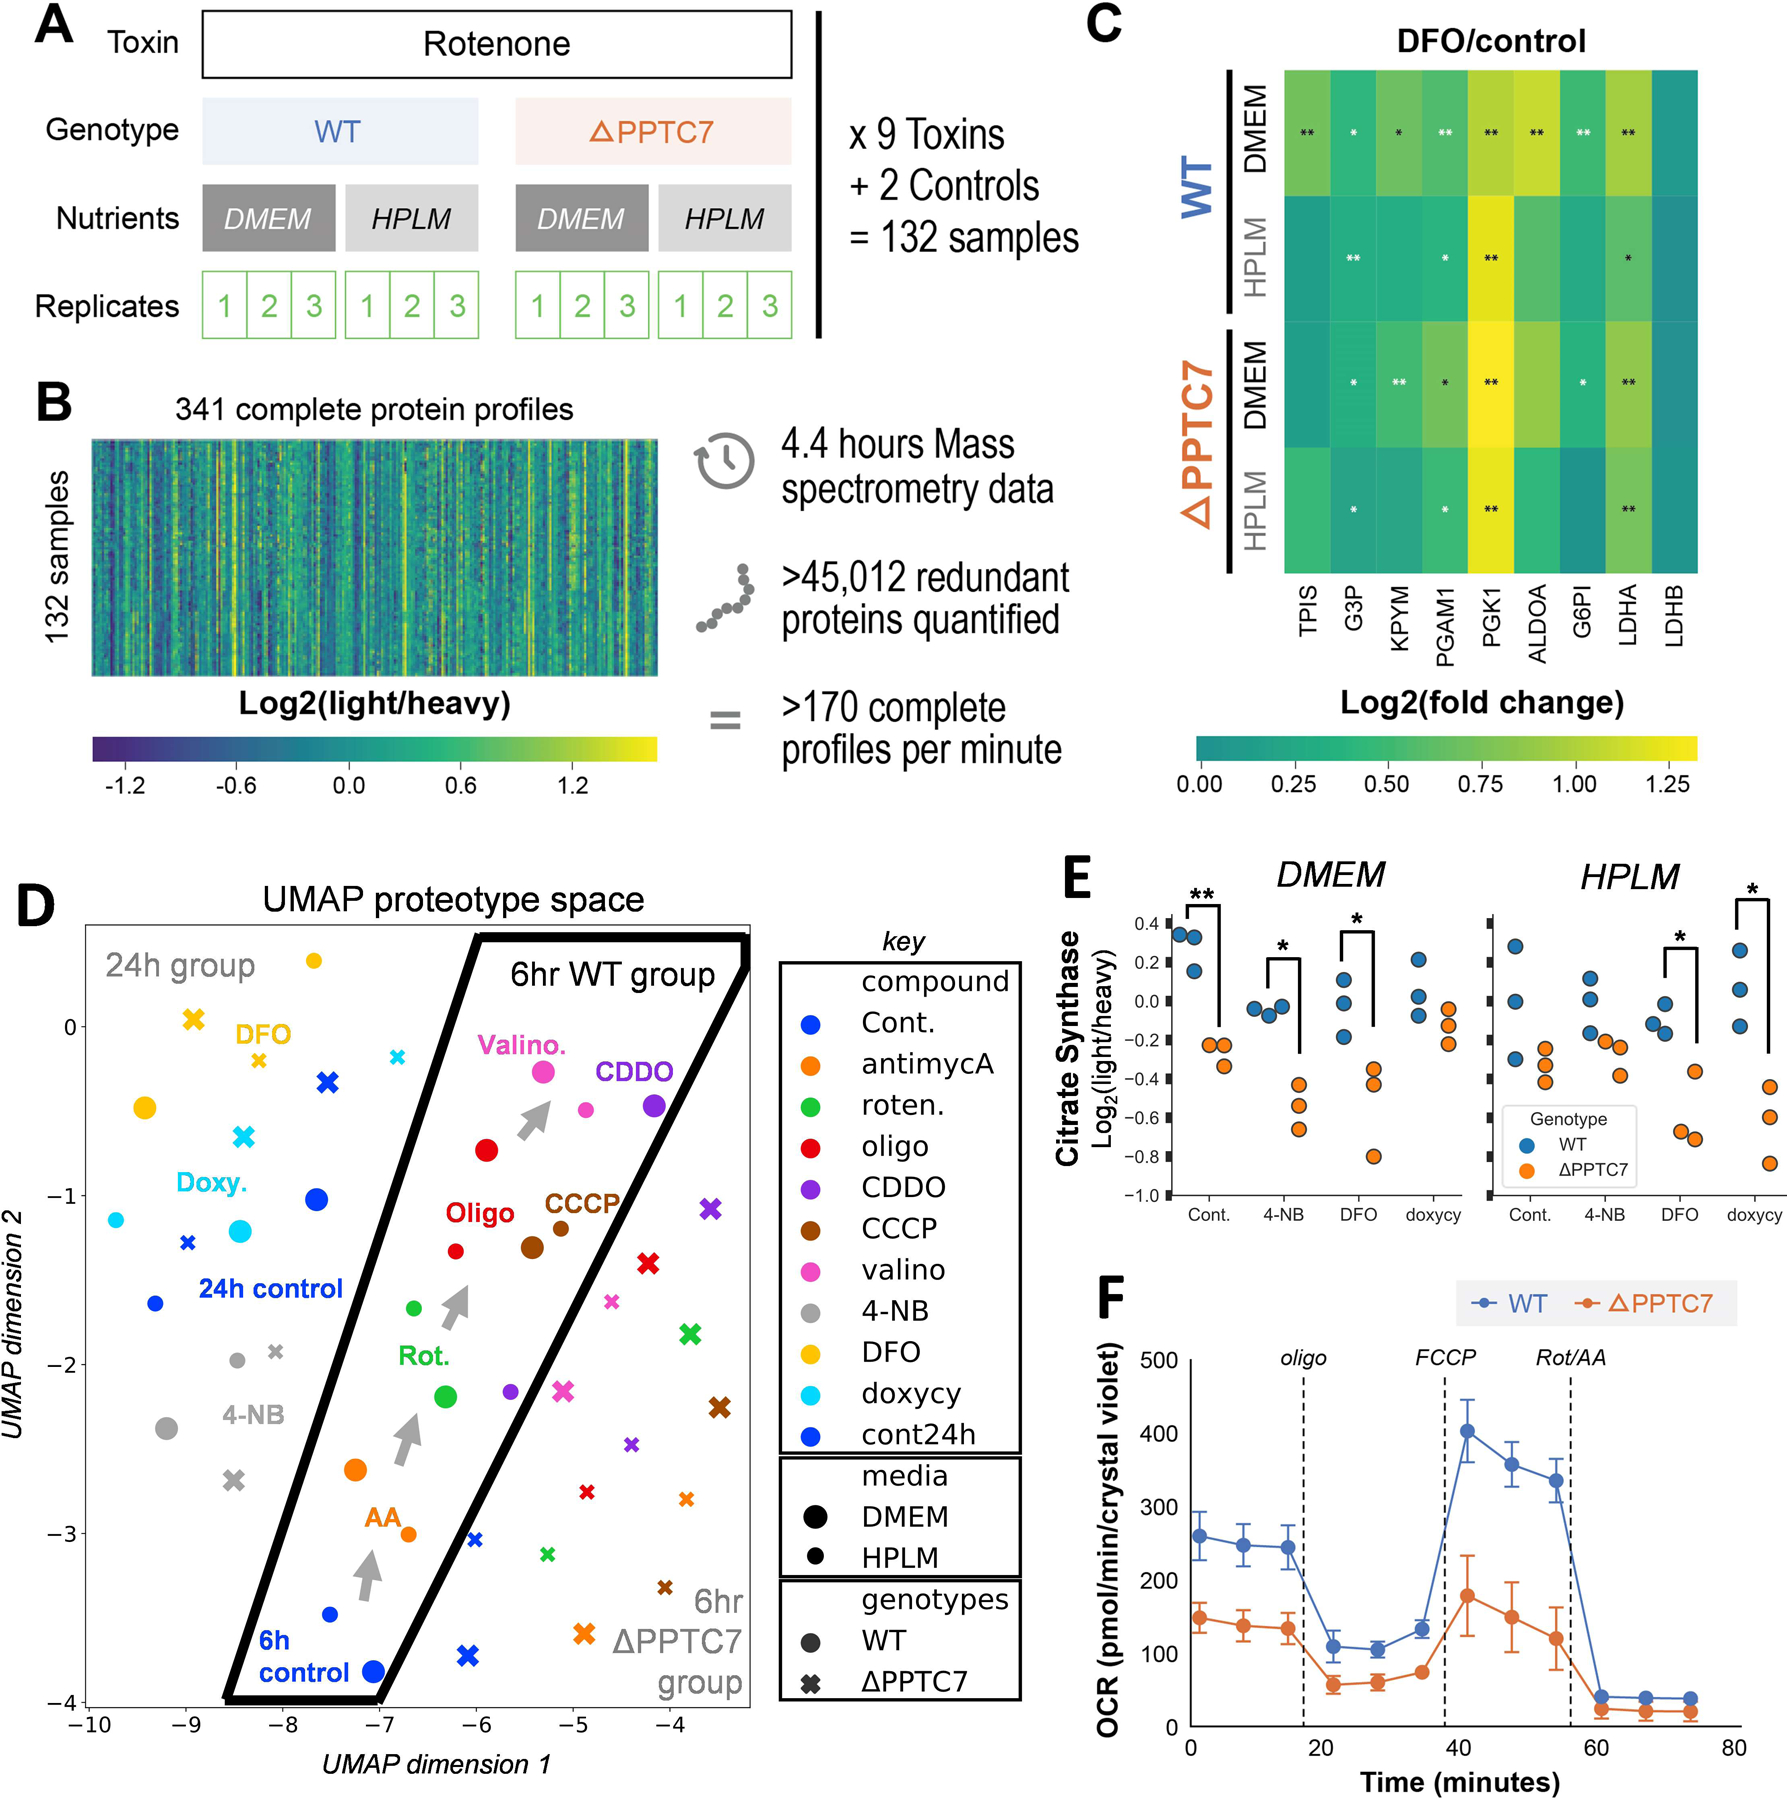
(A) Scheme of multi-factorial experiment design quantifying changes resulting from toxins, genotypes, nutrient composition. (B) Overview of complete dataset containing over 45,000 quantified proteins (including redundant). (C) Glycolytic proteins quantified by DI-SPA were almost uniformly upregulated due to DFO stress versus controls across all genetic backgrounds and nutrient conditions. p-values are from independent two-sided t-tests assuming equal variance corrected for multiple hypothesis with the Benjamini-Hochberg FDR correction, * corrected p-value<0.05, ** corrected p-value <0.01. See source data file for exact p-values. (D) UMAP dimension reduction of the proteomic profiles from all 44 conditions showing relationships between mitochondrial toxin treatments. (E) Quantitative ratios of citrate synthase, a mitochondrial marker, across all 24-hour treatments and controls. p-values are from Welch’s independent two sample, two-sided t-test, and not corrected for multiple hypotheses * p-value<0.05, ** p-value <0.01. Exact p-values from left to right, DMEM: 0.0035, 0.014, 0.048, 0.15, HPLM: 0.19, 0.064, 0.034, 0.013. (F) Oxygen consumption rates (OCR) from Seahorse mitochondria stress test of WT and PPTC7 KO 293T cells shows global decrease in mitochondrial activity of KO cells in agreement with the results from DI-SPA. n=11 biologically independent wells of cells over one independent experiment. Error bars are standard deviation.
This dataset of 44 unique cellular states revealed many interesting changes due to mitochondrial toxin treatments (Supplementary data, Table S5). For example, nearly all glycolytic proteins were upregulated upon treatment with the toxin deferoxamine (DFO) compared with the appropriate controls (Figure 4C). Supporting our observation, DFO was previously reported to increase glycolysis40. To understand relationships between treatments, we summarized these data with uniform manifold approximation and projection (UMAP)41 (Figure 4D). UMAP shows clear segregation of the treatments into 24h and 6h groups, and within the 6h group, the proteotypes easily segregate from the WT and PPTC7 KO cells. Within the 6h WT group, the different media had a minimal influence on the proteotype. In relation to the 6h controls, complex I inhibitors rotenone and antimycin A were most similar. Toxins that influence mitochondrial membrane potential through proton pumping, CCCP and oligomycin, produced more (and comparable) proteome rearrangement. Valinomycin, which diffuses potassium ion gradients across membranes, induced the most profound proteome perturbation relative to controls. Finally, UMAP analysis revealed that CDDO treatment is media dependent.
Data from this DI-SPA experiment also revealed proteome differences due to the PPTC7 KO genotype, including lower citrate synthase quantity across 24-hour controls and treatments compared to WT 293T cells (Figure 4E). Based on this observation and previous results42, we hypothesized that these cells may have a mitochondrial defect or lower mitochondrial quantity. Mitochondria were enriched from WT and KO cells, and crude mitochondria fractions were analyzed by DI-SPA. Quantitative DI-SPA ratios for these samples were compared with those computed with MaxQuant analysis of LC-MS data, revealing excellent agreement and data quality (Extended Data Fig 9). In this organelle-specific analysis, 351 proteins were quantified across all samples, and there was a clear trend toward lower quantities of most mitochondrial proteins (Extended Data Fig 10, 149 annotated mitochondrial according to Gene Ontology Cellular Component). In DI-SPA data from the mitochondrial fractions, four proteins were significantly downregulated in PPTC7 KO cells compared to WT controls (Benjamani-Hochberg corrected p-value <0.05): Acetyl-CoA acetyltransferase THIL, 10kDa heat shock protein CH10, Prohibitin PHB, and again, Citrate synthase CISY (Table S6). To validate our hypothesis from DI-SPA data, we measured mitochondrial function with Seahorse respirometry, and found that PPTC7 KO cells indeed have lower oxygen consumption relative to WT 293T cells (Figure 4F).
DISCUSSION
Here we describe and validate DI-SPA, a qualitative and quantitative MS-based proteomics method that does not use LC. DI-SPA instead separates peptides in the gas phase with three primary technologies: (1) ion mobility (FAIMS), (2) m/z-based quadrupole mass filter isolation, and (3) ion dissociation. The complex and chimeric MS/MS spectra from DI-SPA are analyzed using the projected spectrum concept33,34 (Figure 1). Ion mobility is a key determinant of success; addition of FAIMS tripled peptide identifications. DI-SPA identified peptides that reflect a subset of the most abundant peptides found by traditional nLC-MS. While DI-SPA identifies fewer proteins than traditional nLC-MS/MS, it provides a very simple and robust interface for a superficial view of the proteome – including important cellular pathways – within minutes (Figure 2).
Our data demonstrates quantitative analysis by DI-SPA with samples containing stable isotope labeled protein standards (such as SILAC), which is achieved by comparing ratios of peptide fragment ions43. This enables protein quantification at speeds of up to 3.5 proteins per second. The quantitative values obtained by DI-SPA are similar to those from standard LC-MS (Figure 3 and Extended Data Fig 9). The proteome changes reflect known biology such as an upregulation of glycolysis due to DFO treatment, and depletion of mitochondrial function due to PPTC7 KO (Figure 4). Our results further suggest that DI-SPA is an ideal choice for analysis of simplified mixtures, such as subcellular fractions of mitochondria and proteins from co-immunoprecipitation, for example. Currently, DI-SPA makes rapid proteome quantification a viable option for a range of high-throughput studies including drug and biomarker discovery.
Many recent reports aim to improve the speed and throughput of proteome analysis by pushing for shorter LC separations5,6,44–46. DI-SPA takes the concept of shorter LC separation to the logical extreme by completely omitting LC. Several non-obvious solutions were required to come together to enable DI-SPA: (1) additional separation dimension of ion mobility, (2) data collection by DIA, (3) peptide identification with the projected spectrum concept, and (4) the co-isolation of heavy-labeled standard peptides to enable quantification from fragments. Compared those recent studies that focus on faster analysis through shorter LC separation, DI-SPA quantifies proteins at a similar pace (up to 3.5 proteins per second). Some shortcomings of this first iteration of DI-SPA are that it is not yet adapted to perform label-free quantification, and it has not yet been applied to high-throughput quantification of proteins from biofluids.
The method proposed here may seem at odds with prior calls for better chromatography to drive the field of proteomics to more thorough analysis and better depth47. In our view, there are many applications where the proteomic depth is not required, but rather speed and reproducibility are the driving Figures of Merit. Here, we demonstrate how this LC-free paradigm can fill this technological need in certain example cases: (1) to obtain quick quantitative proteotype profiles revealing mechanisms of toxins, and (2) to quantify the isolated mitochondria proteotypes. We expect continued advancements in the speed and sensitivity of MS to be beneficial for subsequent iterations of the DI-SPA strategy, improving the depth and breadth of LC-free proteome coverage.
ONLINE METHODS
Theoretical Analysis of Gas-Phase Fractionation
Data from FAIMS compensation voltage stepping experiments using peptides from trypsin-catalyzed proteolysis of the yeast proteome described by Hebert et al.27 was re-analyzed with MS-Fragger48 to identify peptides using the default settings except that a fragment ion tolerance of 0.35 Daltons was used. The distributions of m/z values for identified peptides were plotted as histograms across m/z space with differing bin widths to visualize complexity reduction possible with quadrupole isolation widths. Subsets of identifications from single compensation voltage analysis were plotted to visualize the complexity reduction afforded by FAIMS fractionation.
Samples for Parameter Scouting and SILAC Validation Experiments
MCF7 cells were grown to 80% confluent adherently on a T-175 flask, rinsed once with 1x D-PBS, and then detached from the cell culture plate using 1x trypsin solution. The trypsin was quenched by the addition of media, and then the cells were pelleted by centrifugation at 150 x gravity. The cells were washed twice with ice-cold 1x D-PBS and the supernatant was aspirated to remove any media components. The cell pellet was then frozen at −80°C until lysis.
A549 cells for SILAC quantification experiments49 were grown in media supplemented with 10% dialyzed bovine serum and heavy or light lysine and arginine for more than 10 population doublings to completely label cells (Thermo Scientific SILAC Protein Quantitation Kit, Catalog # A33972). Completely labeled cells were then harvested by addition of trypsin, washed with cold PBS, counted to determine accurate cell numbers. Various ratios of heavy and light labeled cells were combined to reach a final number of 100,000 total cells. Combined cells were pelleted by centrifugation, PBS was aspirated, and pellets were frozen and stored at −80°C until lysis.
Lysis, Digestion and Desalting
Frozen cell pellets were lysed by addition of 8 M Urea with 50 mM TEAB buffer at pH 8.5 containing 10 mM TCEP and 10 mM chloroacetamide. The pellets were vortexed until homogenous with lysis buffer, and then kept on ice. The larger lysis of MCF7 cells for infusion scouting experiments was sonicated on ice using a probe tip for three cycles of 10 seconds. The small volume lysis of SILAC-labeled A549 cell samples was sonicated in a Qsonica water bath maintained at 4°C. After sonication, lysis buffer was diluted to 2M Urea using 50 mM TEAB, and catalytic hydrolysis of proteins was initiated by addition of trypsin (Promega) and LysC (Wako) at a ratio of 1:100 protease:substrate by weight. Proteome proteolysis was incubated overnight (approximately 18 hours) at room temperature. Peptides were desalted using Strata reversed phase cartridges, and then dried completely in a vacuum centrifuge. Dried peptides were resuspended at between 0.5–1 mg/mL in 50%/49.8%/0.2% ACN/Water/FA (v/v/v) for direct infusion experiments, or at the same concentration in water with 2% ACN and 0.2% FA for nLC-MS/MS experiments.
Data Collection
An orbitrap Fusion Lumos mass spectrometer was operated in targeted MS2 (tMS2) mode with quadrupole isolation windows spanning the range from 400–1,000 Thompsons. Peptides were infused into a 75-micron inner diameter capillary tip from new objective (part # PF-360–75-10-N-5) that was packed with 1 cm of C8 particles (Jupyter, 5-micron particle size) to prevent clogging of the tip by small particles. To ensure that this did not result in peptide retention or chromatography, we examined extracted ion chromatograms from several random multiply charged masses and found identical patterns of signal over time (Extended Data Fig 2). An autosampler and nanoflow liquid chromatography pump were used to automate the infusions. Injections of 1–4 uL (depending on the length of the entire experiment cycle) were infused at a rate of 100–300 nL/min using 50% ACN, 49.8% H2O, and 0.2% FA as a carrier fluid. Several data collection parameters were varied, including the maximum ion accumulation time, the orbitrap resolution, and the quadrupole isolation window width. Final optimal data collection parameters were 120k orbitrap resolution with 246 ms maximum ion accumulation time and 2 m/z precursor isolation windows. Mass spectrometry data was collected using ThermoFisher Foundation software version 3.1 SP4, FreeStyle version 1.3 SP2, and Xcalibur 4.0.
Peptide and Protein Identification
The spectral library is available with the MS data on massive50, and was created from .blib format spectral library made with Skyline51 from database search with MS-Fragger48 of data from FAIMS-fractionated human peptide samples27. BlibToMs2 from Proteowizard52 was used to convert blib to ms2 format, which was then converted to mgf with msconvert. Custom Python code (fixMGFlib.ipynb available on github or from supplementary software) was then used to fix the mgf library by adding back the peptide sequence lines. Decoys were added to the spectral library by the spectral library processor included with MSPLIT-DIA33.
RAW files were converted to mzXML using msconvert52 with the default settings except that 64-bit precision was used. Converted files were searched against the human spectral library that included decoy spectra using MSPLIT-DIA with precursor tolerance equal to the isolation window width and fragment tolerance of 10 ppm. Peptides were scored by cosine similarity of experimental projected spectra with spectral library spectra using MSPLIT-DIA. Peptide identifications were sorted by their cosine match score, filtered to keep only the best score per peptide, and the peptide-level false discovery rate was computed using the target-decoy strategy.
Although peptide identification and quantification were the focus of this study, for some experiments, protein-level FDR was computed using the target-decoy strategy with the best peptide cosine score as the protein score as described in the original MSPLIT-DIA paper53,54.
Untargeted Protein Quantification Method
To first determine whether quantification from SILAC experiments would be possible, a general method to co-isolate all heavy and light peptide pairs for doubly charged peptide precursor ions was developed. The optimal peptide identification settings determined from the optimization grid were used in a scouting experiment to identify peptides from the 1:16 (Heavy:Light) A549-derived peptide sample. These identifications were used to determine peptide quantification targets in subsequent experiments.
Theoretical heavy masses were predicted from all the peptides identified from analysis of the 1:16 (heavy:light) SILAC sample (Supplementary Figure 3). This analysis revealed that, as expected from tryptic peptides, most mass shifts result from incorporation of a single heavy lysine, followed by a single heavy arginine. Therefore, a simple multiplexed tandem MS (MSX) method was designed that co-isolated every precursor mass M simultaneously with mass M + 4.5, which is between the mass of a single doubly charged heavy lysine (8.014199 / 2 ~ 4) or single heavy arginine (10.00827 / 2 ~ 5). This method fills the ion routing multipole for half the time with both specified ions before fragment mass analysis, ensuring that spectra contain fragments from any presence of both the light and heavy peptide. All light masses between 400–1000 m/z were fragmented with their heavy partner using steps of 1.5 m/z and an isolation width of 2 m/z.
Targeted Protein Quantification Method
Data collection methods were designed that targeted a single peptide from each protein identification using custom scripts written in R and Python, which are available from https://github.com/jgmeyerucsd/DI2A. First, peptide identifications were matched to proteins in a FASTA database. To be conservative, only peptides that matched a single protein entry were kept for FDR calculation using the target-decoy method. Specifically, the peptide from each protein with the best cosine score was kept, and that cosine score was used as the protein score, which is again conservative (e.g. some algorithms combine multiple peptide scores into one protein score to strengthen it). A protein target list was then generated consisting of the peptide from each protein that was identified with the highest MS/MS spectra intensity from the scouting experiment. Predicted precursor light and heavy m/z for each peptide was then determined based on the charge state and the counts of arginine and lysine residues, and the FAIMS CV that produced the identification was gathered from the mzXML scan header. Lists of target peptides at each FAIMS CV were then generated using the predicted light and heavy m/z, and custom data collection methods were built that co-isolate the light and heavy m/z signal from each peptide using ion multiplexing (MSX) option of the Orbitrap Fusion Lumos. Fragment ions were measured in the orbitrap with 120k resolution with 246 ms maximum ion injection time unless otherwise noted.
Plasma Experiment
Frozen liquid plasma treated with sodium heparin was purchased from BioIVT. Lyophilized plasma treated with citrate buffer was purchased from Sigma Aldrich (P9523–1ML) and resuspended in 1 mL of sterile deionized water immediately before use. Both plasma types were depleted in parallel with Top12 spin columns (Pierce # 85165) according to the manufacturer instructions. Eluted plasma protein samples from the spin columns were concentrated and buffer exchanged into denaturation buffer (8M Urea with 50 mM TEAB, pH 8.5) to approximately 40 microliters with a 10 kDa (0.5 mL size) Amicon ultrafiltration device. Undepleted plasma was diluted 17.5-fold into the same denaturation buffer. Protein concentrations from depleted and not depleted plasma samples in denaturation buffer were determined using the BCA assay. The protein concentration of all samples was adjusted to 1 mg/mL in 40 total microliters, and TCEP and chloroacetamide were added to a final concentration of 10 mM. After protein reduction and alkylation for 30 minutes, the urea was diluted to 2M Urea with 50 mM TEAB buffer, and enzymatic hydrolysis of proteins was initiated by the addition of 0.8 micrograms of LysC and trypsin, which was allowed to proceed overnight at room temperature. The reaction was stopped in the morning by adding 16 microliters of 10% FA, and peptides were desalted with Phenomenex Strata-X 33 μm polymeric reversed phase cartridges (10 mg sorbent, 1 mL tube, part # 8B-S100-AAK). DI-SPA analysis was performed using the best parameter scouting method.
MitoTox Experiment - Cell Culture
293T cells were purchased from ATCC (#CRL-3216) and maintained in DMEM (4.5 g/L glucose, 4 mM glutamine, no pyruvate – Thermo #11965092) supplemented with 10% fetal bovine serum (FBS) and 1x penicillin/streptomycin (100 U/mL final [c]). Human Plasma-Like Medium (HPLM39) was kindly provided by the Cantor laboratory, and was supplemented with 10% dialyzed FBS (Thermo #26400036) and 1x penicillin/streptomycin (100 U/mL final [c]). For heavy labeling, 293T cells were labeled using the DMEM-based SILAC protein quantitation kit (Thermo #A33972). Briefly, cells were grown for at least 5 passages SILAC-compatible DMEM supplemented with 10% dialyzed FBS, 13C6 15N2 L-lysine-2HCl and 13C6 15N4 L-arginine HCl, and 1x penicillin/streptomycin. SILAC labeling was confirmed through mass spectrometry analysis and ratios of light/heavy cells were titrated based on analysis of median ratios observed in the controls. All cells were grown in a tissue culture grade incubator held at 37°C supplemented with 5% CO2. Cells were verified as mycoplasma negative via the e-Myco Mycoplasma PCR Detection Kit (Bulldog Bio #25233).
Generation of PPTC7 knockout 293T cells
PPTC7 knockout in 293T cells was performed using the AltR system (Integrated DNA Technologies/IDT) for delivery of CRISPR-Cas9 reagents. A single guide RNA was selected toward exon 1 of PPTC7 (5’-TCTCGGTCCTCTCGTACGGG-3’) using the crispr.mit.edu tool, and was ordered as an Alt-R CRISPR-Cas9 crRNA (IDT). This crRNA, along with ATTO550-TracrRNA (IDT # 1075927) were used to generate a TracrRNA-crRNA complex, which was incubated in equimolar amounts (1 μm each) with AltR Cas9 V3 Nuclease (IDT #1081058). This complex was transfected at a final concentration of 30 nM with Lipofectamine RNAiMAX (Thermo #13778075) into 4.8 × 10⁵ 293T cells seeded in a 12 well dish. Cells were transfected for 48 hours before selection into single-cell colonies and growth as monoclonal cell lines. Monoclonal cell lines were expanded, frozen down, and validated for PPTC7 knockout via Western blotting for endogenous Pptc7 (Novus, cat # NBP1–90654). The specificity of this antibody was validated using wild type and Pptc7−/− mouse embryonic fibroblasts derived from a previously generated Pptc7−/− mouse model28.
MitoTox screen conditions
293T or PPTC7 knockout 293T cells were split and plated in 24 well plates at 7.5 × 10⁴ cells per well. Cells were allowed to adhere overnight, and media was replaced with fresh DMEM or HPLM for a total of 24 hours prior to collection of cells. Compound treatments were grouped into 6-hour or 24-hour incubations, with 6-hour compound treatments occurring in the last 6 hours of the 24-hour media change, and 24-hour compound treatments occurring for the entire 24 hours of media treatment. Compounds used for 6 hours include antimycin A (5 μM final [c], Sigma #A8674), rotenone (5 μM final [c], Sigma #R8875), oligomycin (2.5 μM final [c], Sigma #O4876), CCCP (10 μM final [c], Sigma #C2759), valinomycin (1 μM final [c], Sigma #V0627) and CDDO (2.5 μM final [c], Cayman Chemical #11883)). Compounds used for 24 hours include doxycycline (10 μg/ml final [c], VWR #75844–668) and Deferoxamine (DFO, 100 μM final [c], Sigma #D9533). One compound, 4-nitrobenzoate (4-NB, 1 mM final [c], Sigma #461091), requires 6+ days for efficacy55, and thus cells were treated with this compound for 5 days before being split to 7.5× 10⁴ cells per well and grouped with the 24 hour incubations. Control, untreated 293T cells were split and harvested with both the 6-hour and 24-hour compound treatment sets. All conditions were plated and collected in 3 replicate wells.
To generate an internal control for each sample, SILAC-heavy labeled 293T cells (see “Cell Culture” for details) were spiked into lysis buffer in at ~1:1 ratios of signal to light samples, as determined by mass spectrometry (corresponding to 8 × 10⁵ heavy labeled cells per well of light cells) . Heavy cells were counted and resuspended at a final concentration of 8 × 10⁵ heavy cells in 80 μl lysis buffer (8M urea, 50 mM TEAB, pH 8.5, 5 mM TCEP, and 10 mM chloroacetamide). 80 μl of lysis buffer containing heavy labelled cells was added to each well of compound-treated light cells, scraped, collected, and flash frozen until preparation for mass spectrometry.
Mitochondrial enrichment from 293T cells
Sets of 6× 10cm2 plates of 293T, PPTC7 KO 293T, and SILAC labeled 293T control plates were used to isolate crude mitochondrial fractions. Cells were washed, collected in dPBS, and spun at 1000 x g at 4°C. Cell pellets were resuspended in hypotonic buffer (20 mM Tris, pH 7.4, 1 mM EDTA) for 10 min. on ice. After 10 min, protease inhibitors were added (500 µg/ml final [c] of each of the following inhibitors: Pepstatin A, Chymostatin, Antipain, Leupeptin, Aprotinin), and cells were homogenized in a pre-chilled dounce homogenizer using 40 strokes. 2x sucrose/mannitol solution was added to cells (for final [c] of 220 mM mannitol, 70 mM sucrose, 10 mM Tris pH 7.4, 1 mM EDTA). Unbroken cells and nuclei were spun at 700 x g for 10 min. at 4°C. Supernatant was transferred to a fresh, pre-chilled microcentrifuge tube and spun at 12,000 x g for 10 min. at 4°C. The resulting pellet, enriched in crude mitochondria, was washed 1x in dPBS, respun at 12,000 x g for 10 min. at 4°C, and flash frozen until preparation for mass spectrometry.
Seahorse assay
293T or PPTC7 KO 293T cells were split, plated to poly-D-lysine coated Seahorse eXF96 plates at 15,000 cells/well, and allowed to adhere to the plate overnight in DMEM supplemented with 10% FBS and 1x P/S. The next day, media was aspirated, cells were washed 1x with dPBS, and media was replaced with DMEM, and cells were incubated in this media for 24 hours. After 24 hours, and immediately before the Seahorse run, treatment media was aspirated, cells were washed 1x with dPBS, and media was replaced with Seahorse XF DMEM Medium, pH 7.4 (Agilent #103575–100) supplemented with 10 mM glucose, 1 mM pyruvate, and 2 mM glutamine. Oxygen consumption rates (OCR) and extracellular acidification (ECAR) was monitored on a Seahorse eXF96 basally, and in the presence of a Seahorse XF Cell Mito Stress Test (Agilent #103015–100). For the Stress Test, cells were treated with 1 μM final [c] oligomycin, 1 μM final [c] FCCP, and 0.5 μM final [c] or rotenone and antimycin A. After the assay, cells were fixed with 1% glutaraldehyde, stained with 1.5% crystal violet, and, after release of the stain with 10% acetic acid, each well was read at an absorbance of 590 nm56. These absorbance values were used to normalize each assayed well within the Wave software (version 2.6.0). Data were exported from the Wave software and analyzed using Prism (version 8).
Peptide Quantification from DI-SPA
Peptides were quantified using custom code written in python and R available from: https://github.com/jgmeyerucsd/DI2A. Pyteomics57 was used to access mzxml files for quantification in Python. To perform quantification, at least one of the three most abundant y-ions (either heavy or light) was required to be observed within 10 ppm unless otherwise noted. The median ratios of heavy/light were determined from those y-ions (up to 3 of the most abundant). If the heavy or light partner was not detected, the average value of the 10 least abundant peaks in the MS/MS spectra was used as noise for the missing partner ion to compute a ratio. For the whole cell mitotox samples, at least one heavy or light y-ion was required to be observed within 12ppm of the expected mass to compute quantification. For the enriched mitochondria samples, data was collected with a maximum ion injection time of 502 ms and a resolution of 240,000 in the orbitrap. This higher quality data was analyzed with more stringent requirements; all three pairs of the three most abundant heavy and light ions were required to be detected within 10ppm to report quantification.
Statistics
Unless otherwise noted, statistical tests used for data presented in main and extended data figures were independent 2-sample, two tailed t-tests assuming equal variance. Exactly 3 replicate biological samples from independent cell cultures were compared in all statistical tests (for example, separate wells in a multi-well plate). Replicates were from one independent experiment. Exact p-values are available in the legend or source data table, and experiments were not replicated. The supplementary data zip file contains tables of ANOVA with f-statistics, p-values and degrees of freedom for all proteins quantified compared across factors and interactions in the multi-factorial experiment.
Data Availability
All raw data (along with excel sheet giving details of each file), filtered and unfiltered search results, and quantification files are available on massive under the dataset identifier MSV000085156 (https://doi.org/doi:10.25345/C5M686). The massive repository also includes the relevant human FASTA database “2019–03-14-td-UP000005640.fasta”. Detailed descriptions of the RAW data files are on massive under the folder “other” in the excel file “Raw data files descriptions v3.xlsx”. The massive repository includes the human spectral libraries for use with MSPLIT-DIA, and the files used to create libraries.
Code availability:
All data analysis code is written in python and R and is available on github from https://github.com/jgmeyerucsd/DI2A or from Zenodo (doi:10.5281/ZENODO.4115930)58.
Extended Data
Extended Data Fig. 1. Theoretical Analysis of Peptide Complexity Reduction by Gas-phase Fractionation quadrupole isolation width and FAIMS compensation voltage (CV).
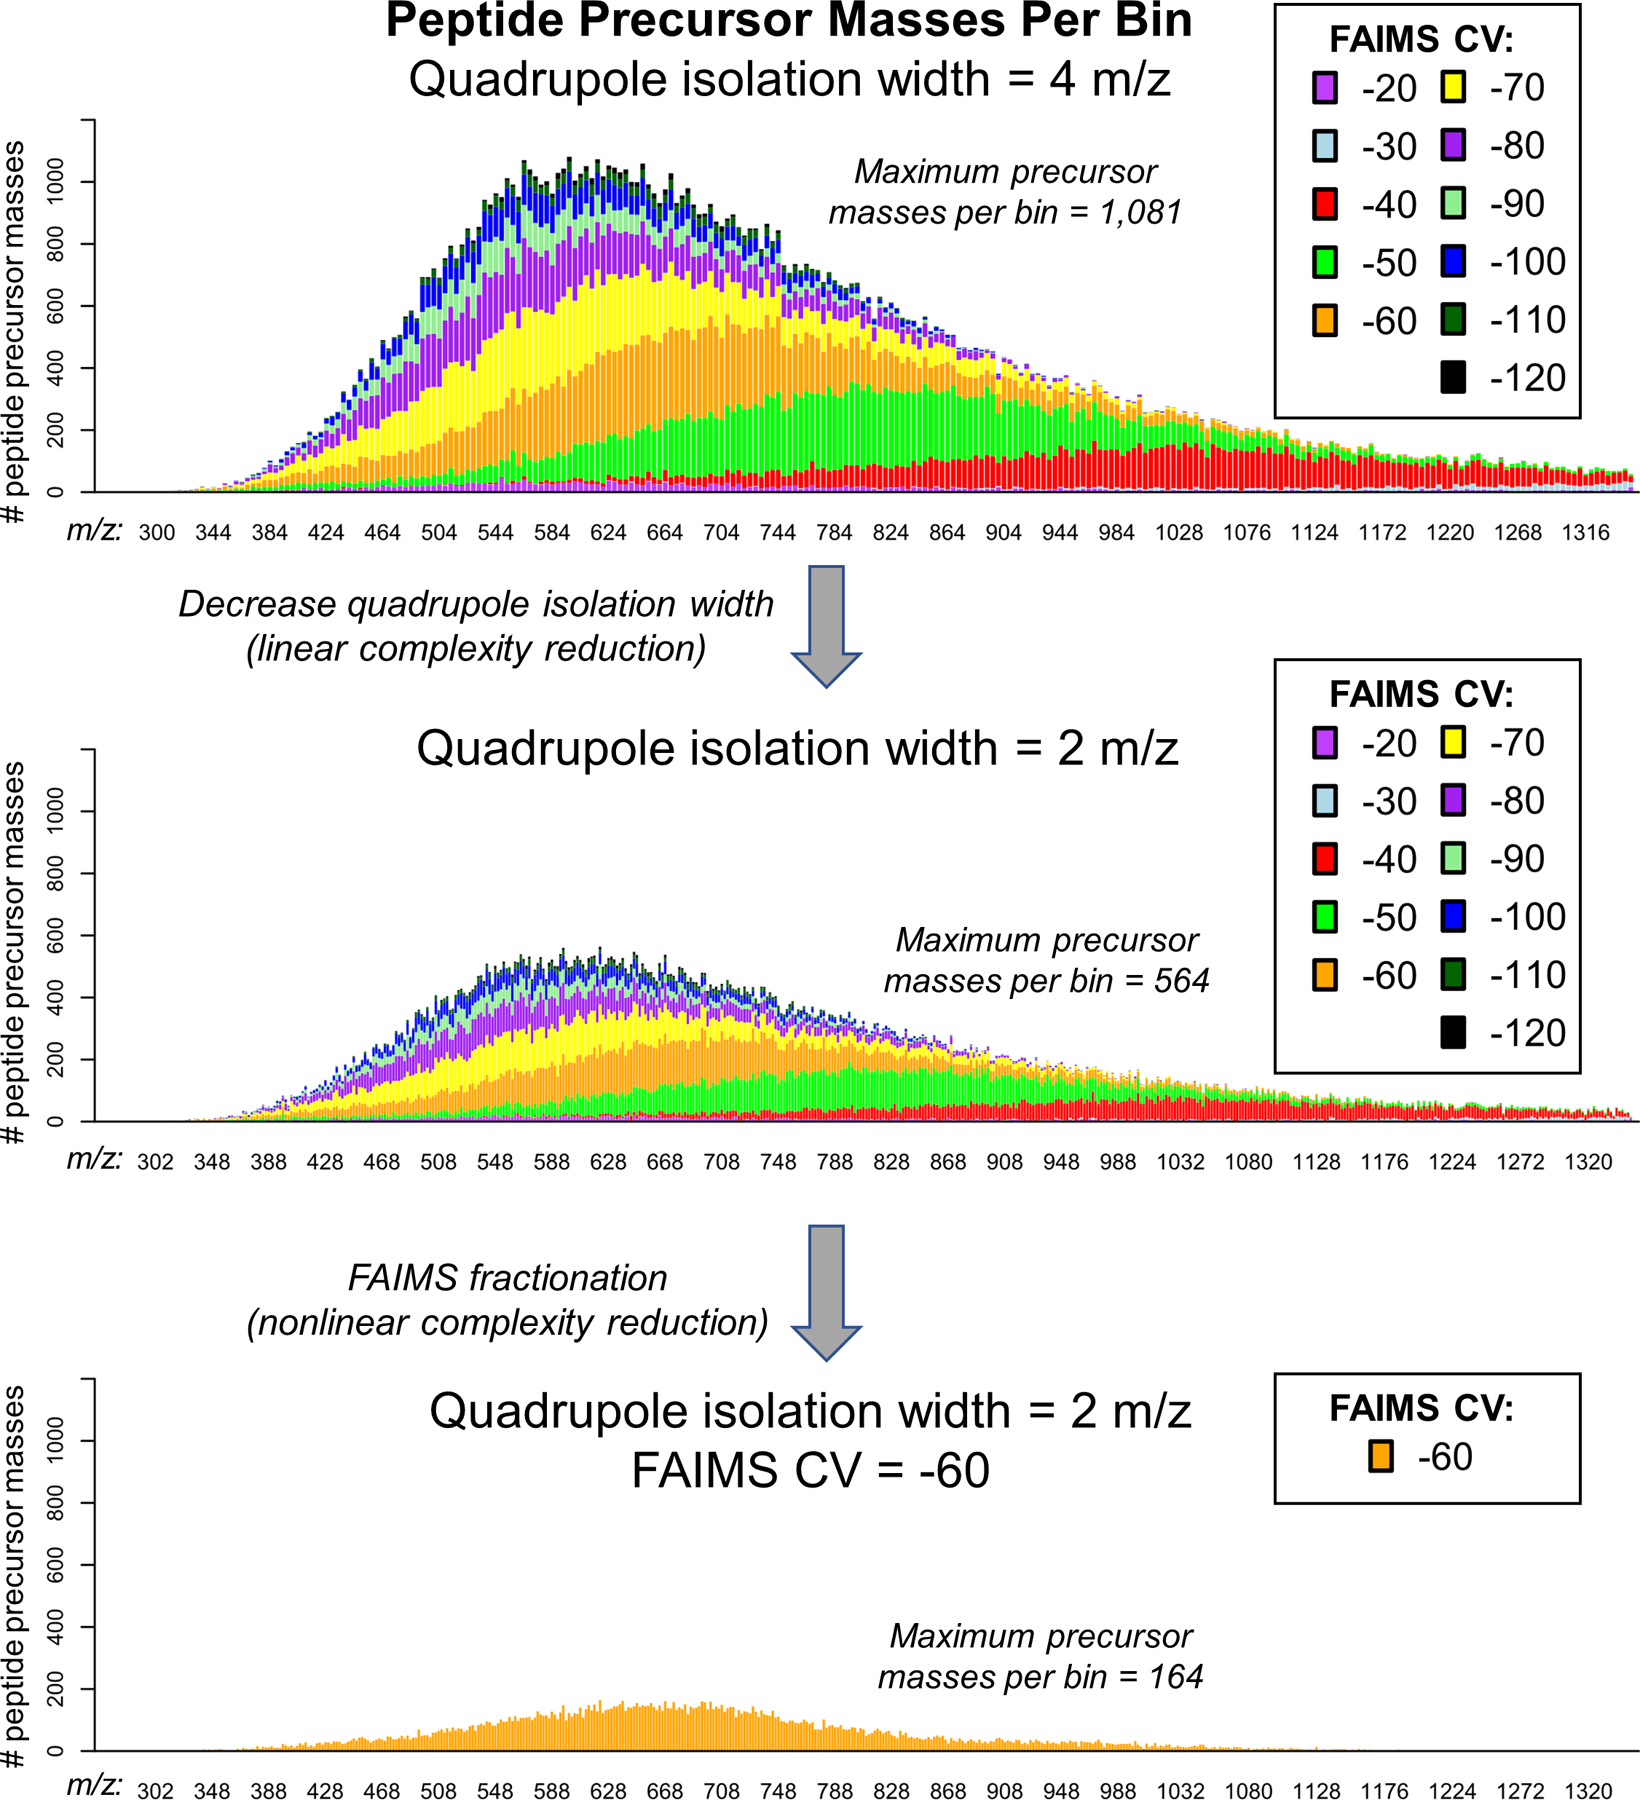
This analysis uses the maximum CV signal for all peptide precursor masses identified from stepped CV analysis of the human proteome. Stacked barplots show the number of peptide precursor masses per bin split by the contribution from each FAIMS CV fraction. The top panel shows precursor masses per 4 m/z isolation bin. The middle panel shows a roughly linear decrease in the maximum number of peptide precursor masses when the isolation width is decreased to 2 m/z. The bottom panel shows a nonlinear decrease in the number of peptide precursor masses due to selection by FAIMS gas phase fractionation at constant quadruople isolation width.
Extended Data Fig. 2. Examples of infusion data traces.
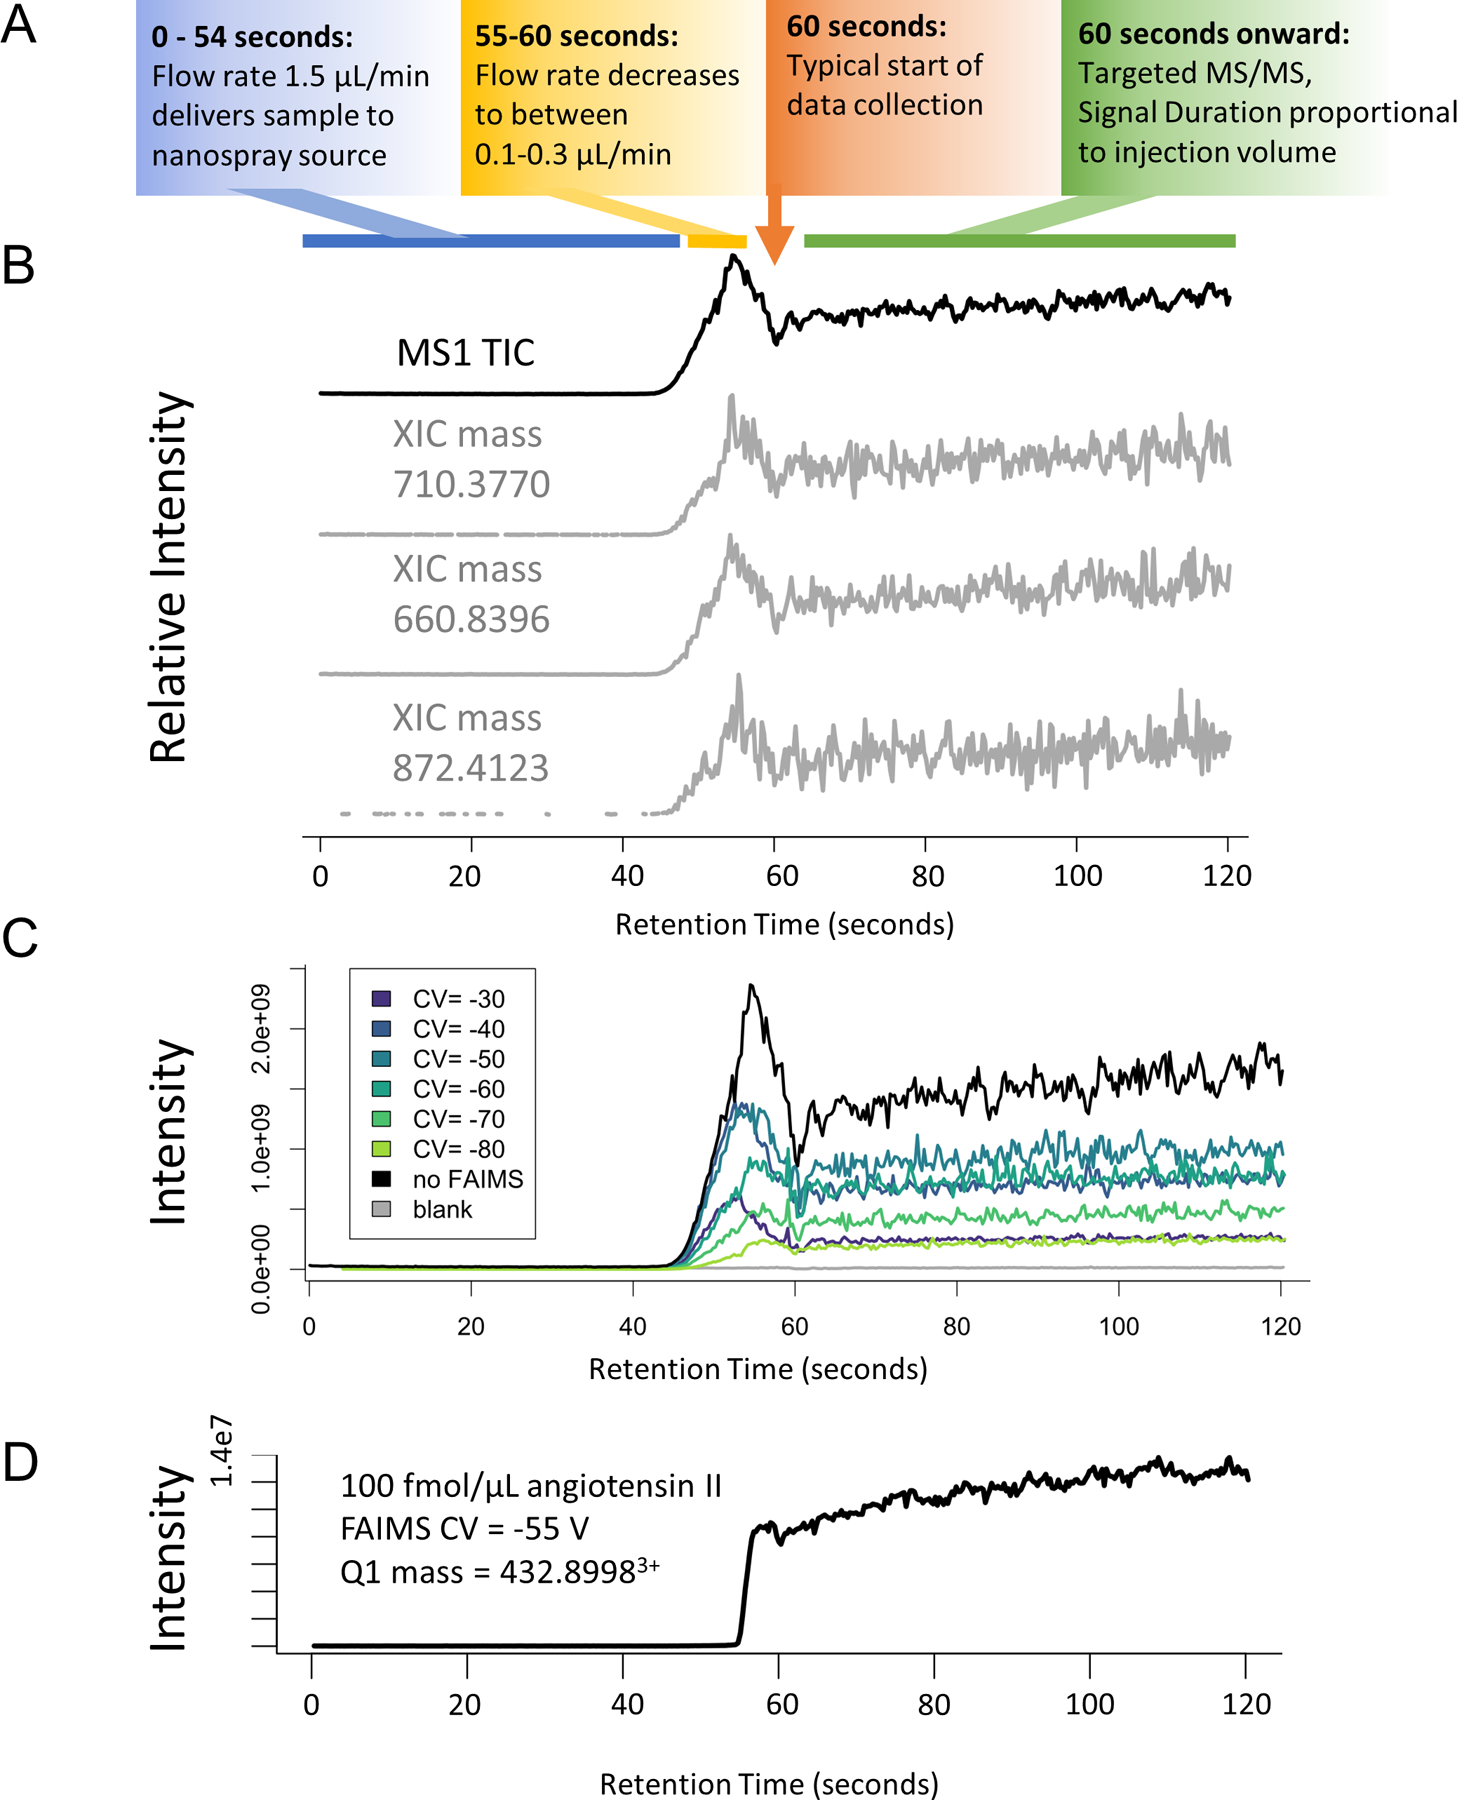
Tryptic peptides from the MCF7 proteome (1 mg/mL) were infused as described for DI-SPA analysis, but precursor ions (MS1) were measured. (A) Description of general flowgram parameters over time. (B) MS1 trace of the no FAIMS experiment (top) and extracted ion chromatograms of various randomly chosen multiply charged m/z values (±10ppm) show a consistent pattern of elution for all masses. This suggests that peptides are not retained or separated in our setup. (C) Comparison of the signal from without FAIMS versus FAIMS using each CV setting from −30 V to −80 V. (D).Example flow-gram from DI-SPA-PRM-MS of 100 fmol/μL angiotensin II showing the typical smooth trace of mass- and FAIMS-selected peptide precursor.
Extended Data Fig. 3. DI-SPA scouting experiments for untargeted peptide identification.
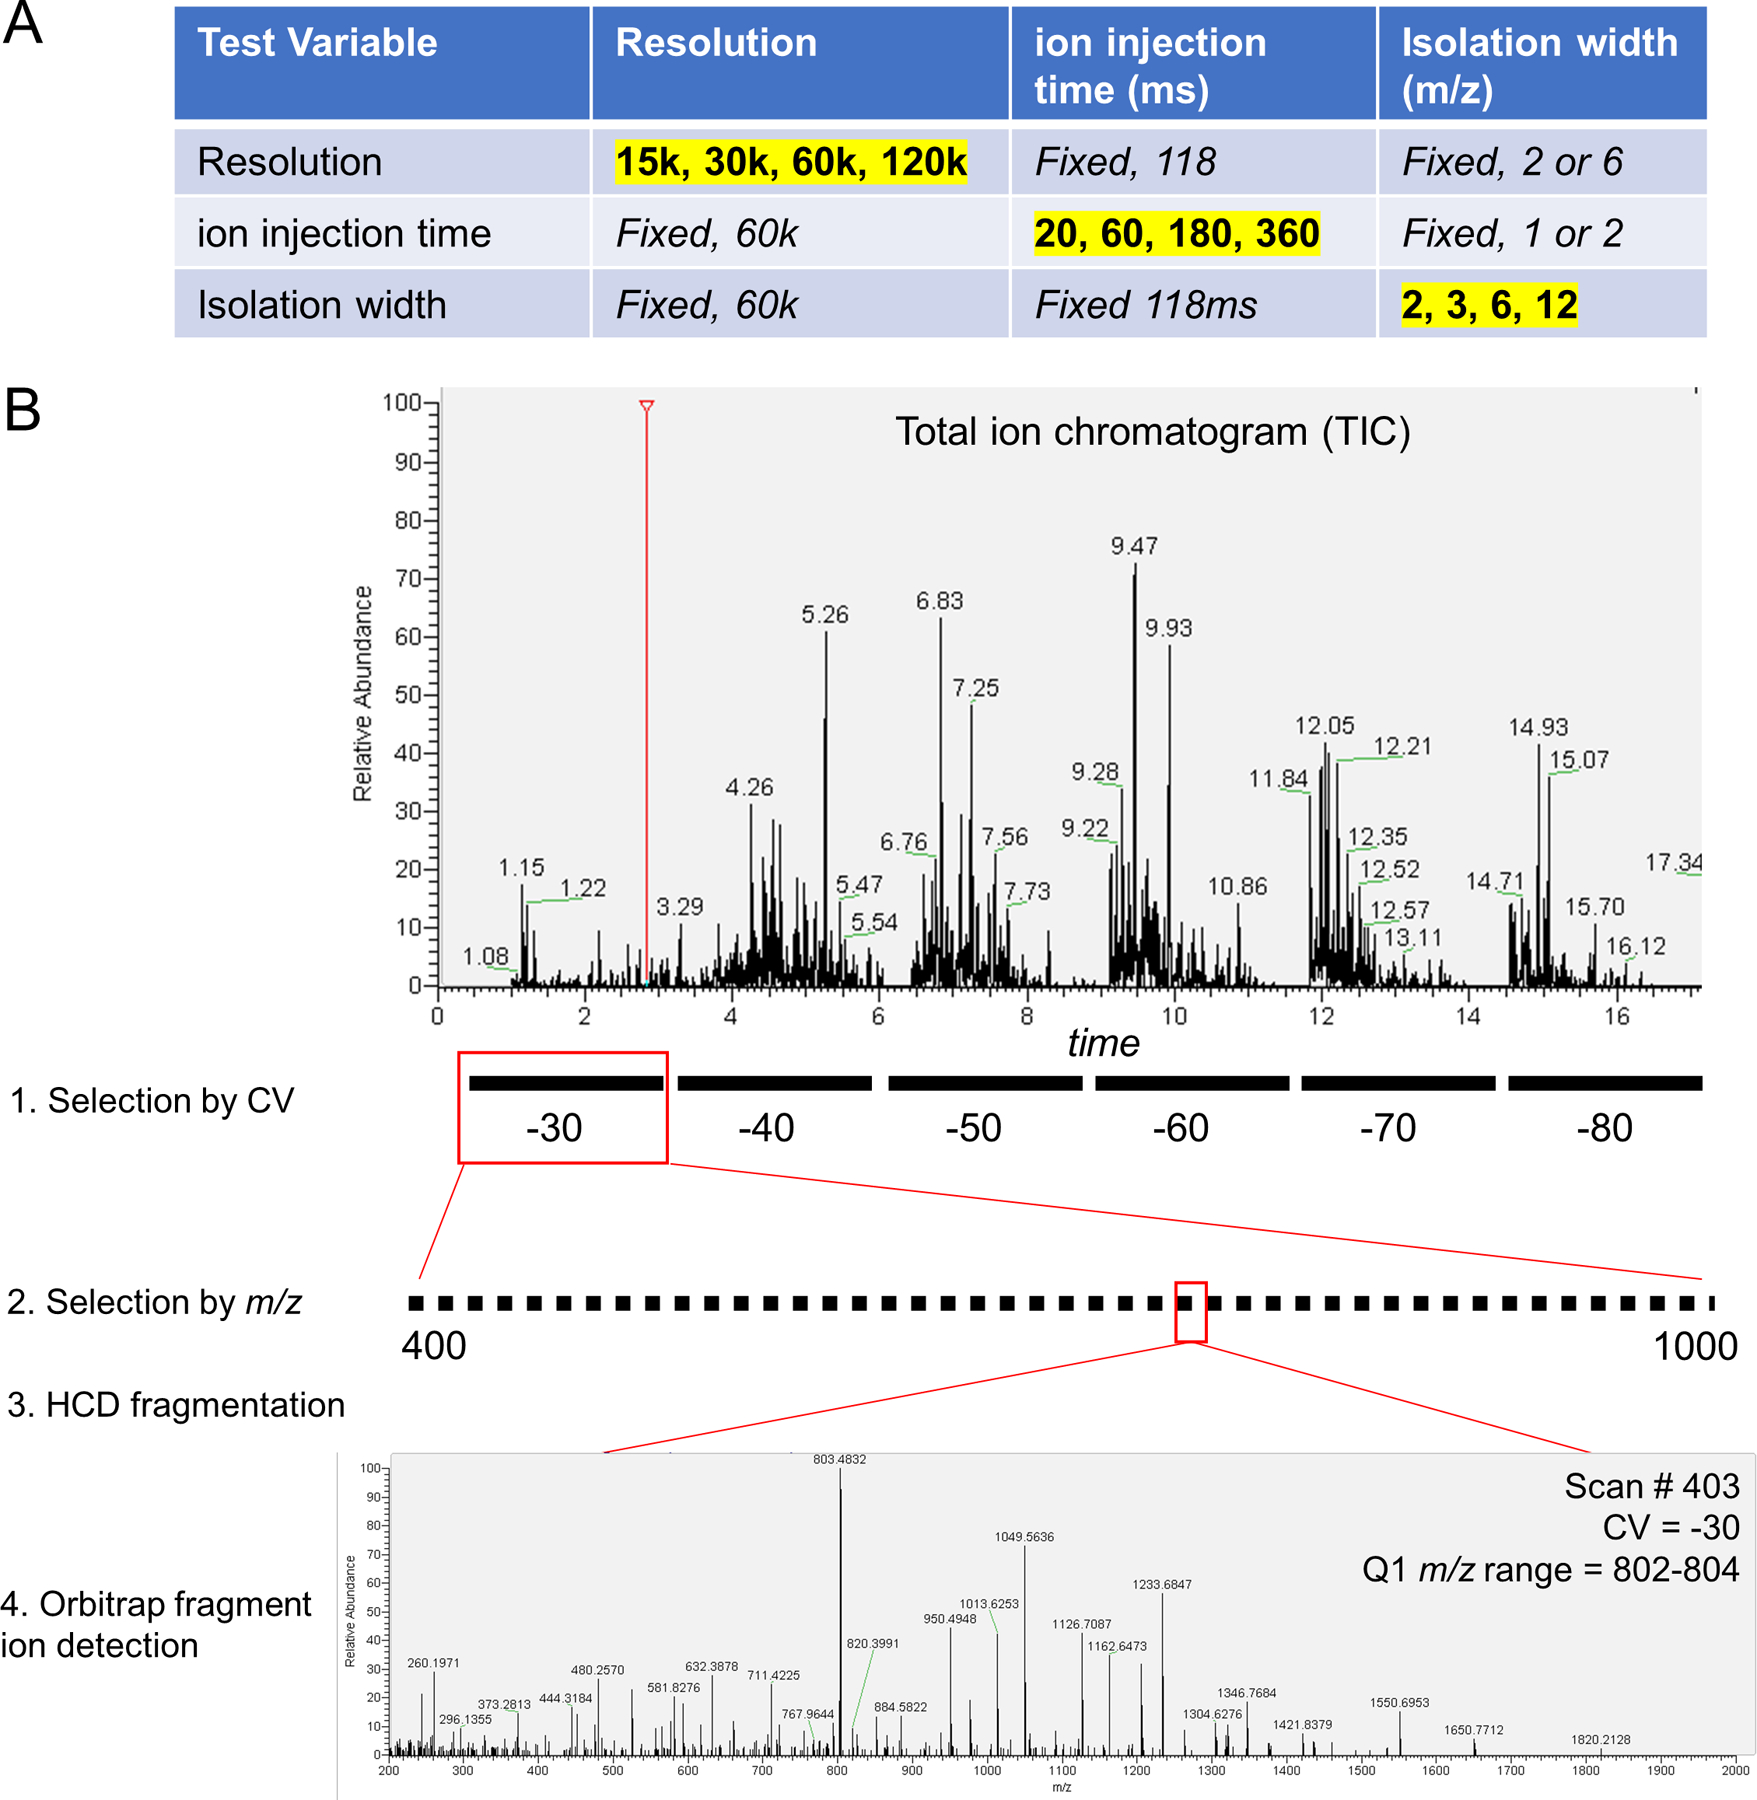
(A) Fixed and varied parameters for each of the parameter scouting experiments in Figure 2A-2C. Values highlighted in yellow were varied with the other values in that row fixed. (B) Schematic of scouting experiment with actual data. Peptides were directly infused into the mass spectrometer over the duration of a scouting experiment. The first selection is performed by FAIMS according to compensation voltage (CV). FAIMS CV is fixed at a value between −30 volts and −80 volts while cycling through the second selection by m/z with the first quadrupole isolation window. is stepped across the m/z range of interest (400–1,000 here) to isolate specific subfractions of the peptide population. The FAIMS and quadrupole-selected peptides are fragmented by HCD, and finally the fragment ions are detected in the orbitrap to produce a tandem mass spectra. No precursor ion scans (MS1) are collected. MS/MS spectra from DI-SPA are identified by spectral library search.
Extended Data Fig. 4. Enriched KEGG pathways including all protein members of those pathways identified by DI-SPA (matching figure 2E).
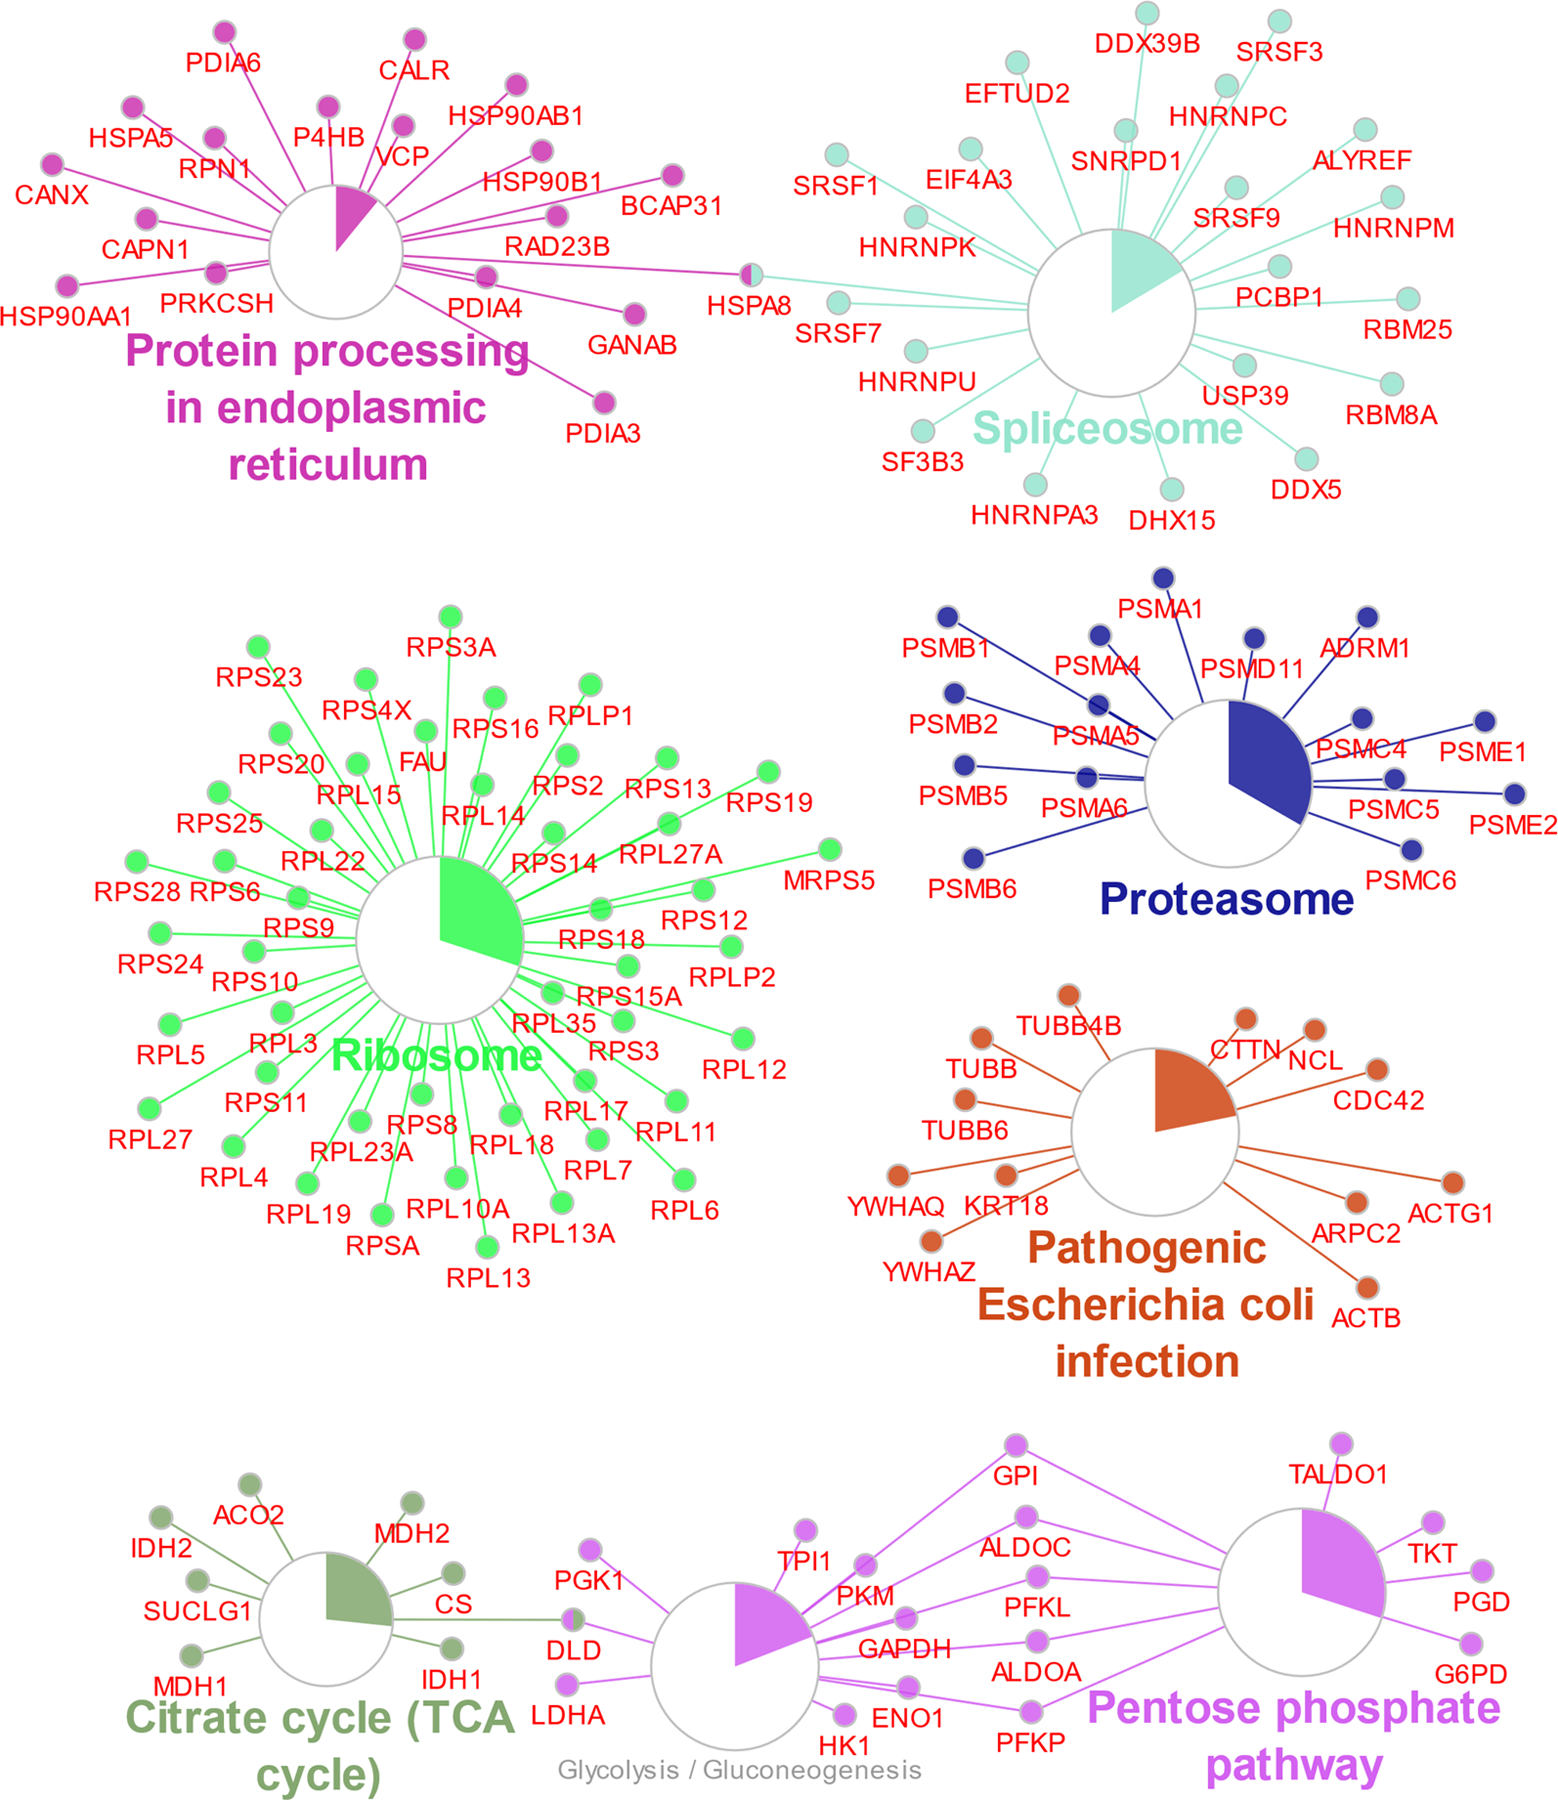
Pathway enrichment analysis was done in Cytoscape with the plugin clueGO. Larger circles correspond to lower corrected p-value of term enrichment, and the colored portion of the circle gives the proportion of proteins in that pathway that were identified.
Extended Data Fig. 5. Robustness and reproducibility of DI-SPA.
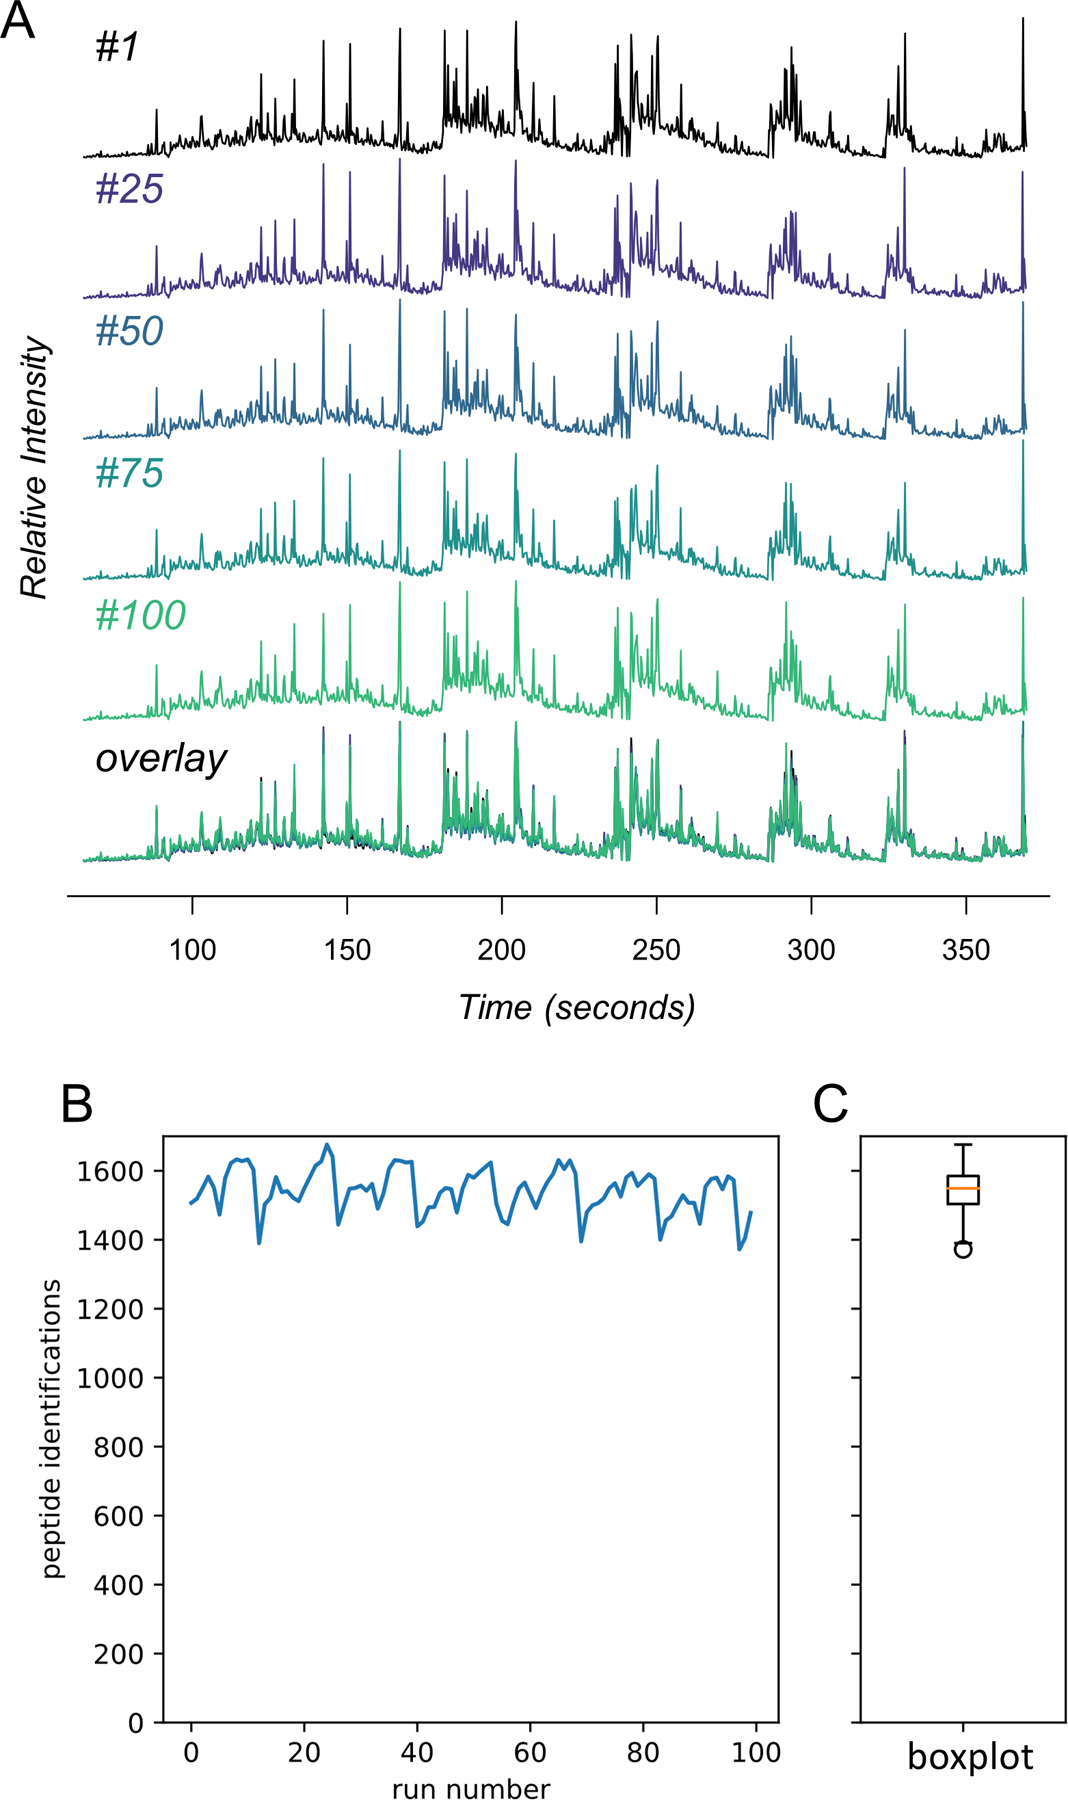
Tryptic peptides from the MCF7 proteome (1 mg/mL) were analyzed 100 times with a shortened version of the parameter scouting method (Extended Data Fig 3). (A) TIC traces of the infusion data from injection #1, #25, #50, #75, #100, and those five overlaid. (B) The number of peptide identifications from MSPLIT-DIA per analysis (FDR<0.01) and (C) the distribution of peptide identifications summarized as a boxplot. The boxplot shows the median (percentile 50%) with an orange line, and the box represents the inner quartile range (IQR) Q1 and Q3 (percentiles 25 and 75). Whiskers show Q1 – 1.5*IQR and Q3 + 1.5*IQR.
Extended Data Fig. 6. Application of DI-SPA to human plasma.
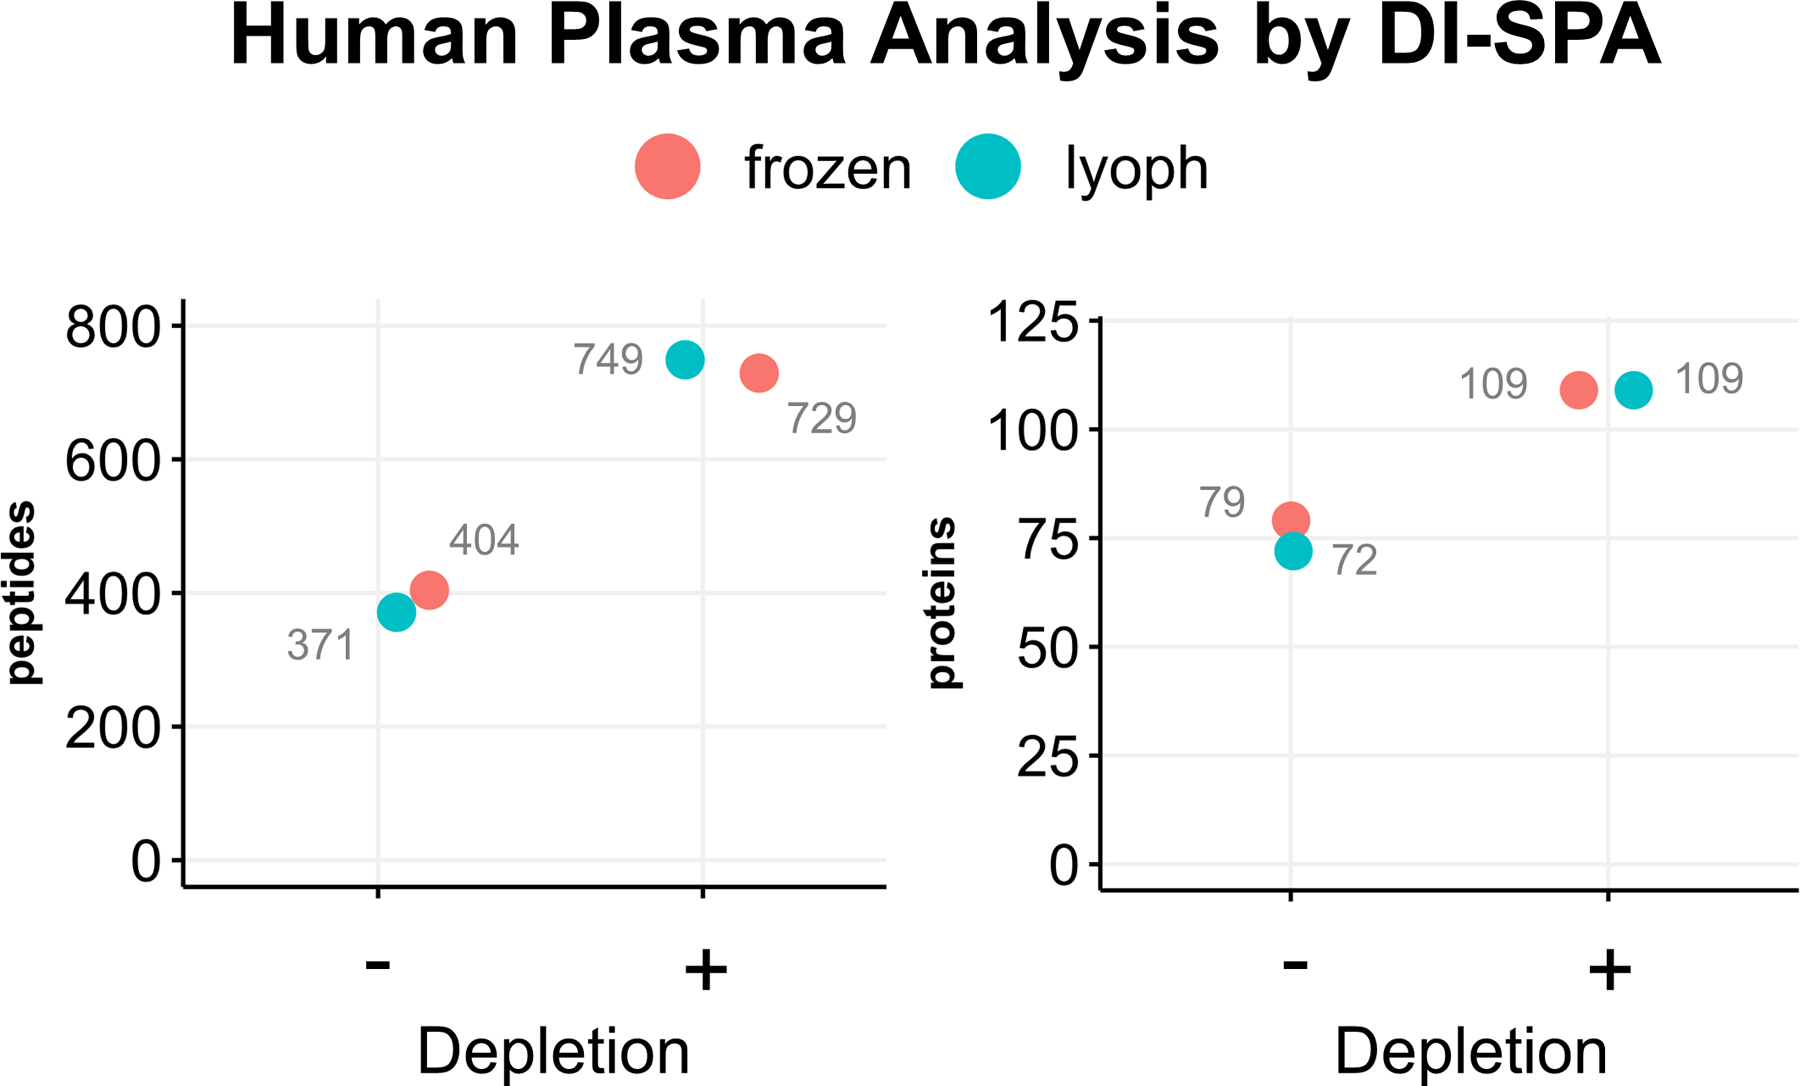
Two different purchased human plasma samples were analyzed by by DI-SPA-MS using the parameter scouting method strategy shown in Extended Data Fig 3. The number of identifications for the two sources of human plasma were compared with and without depletion.
Extended Data Fig. 7. Workflow for preparation of standard samples to assess quantitative DI-SPA.
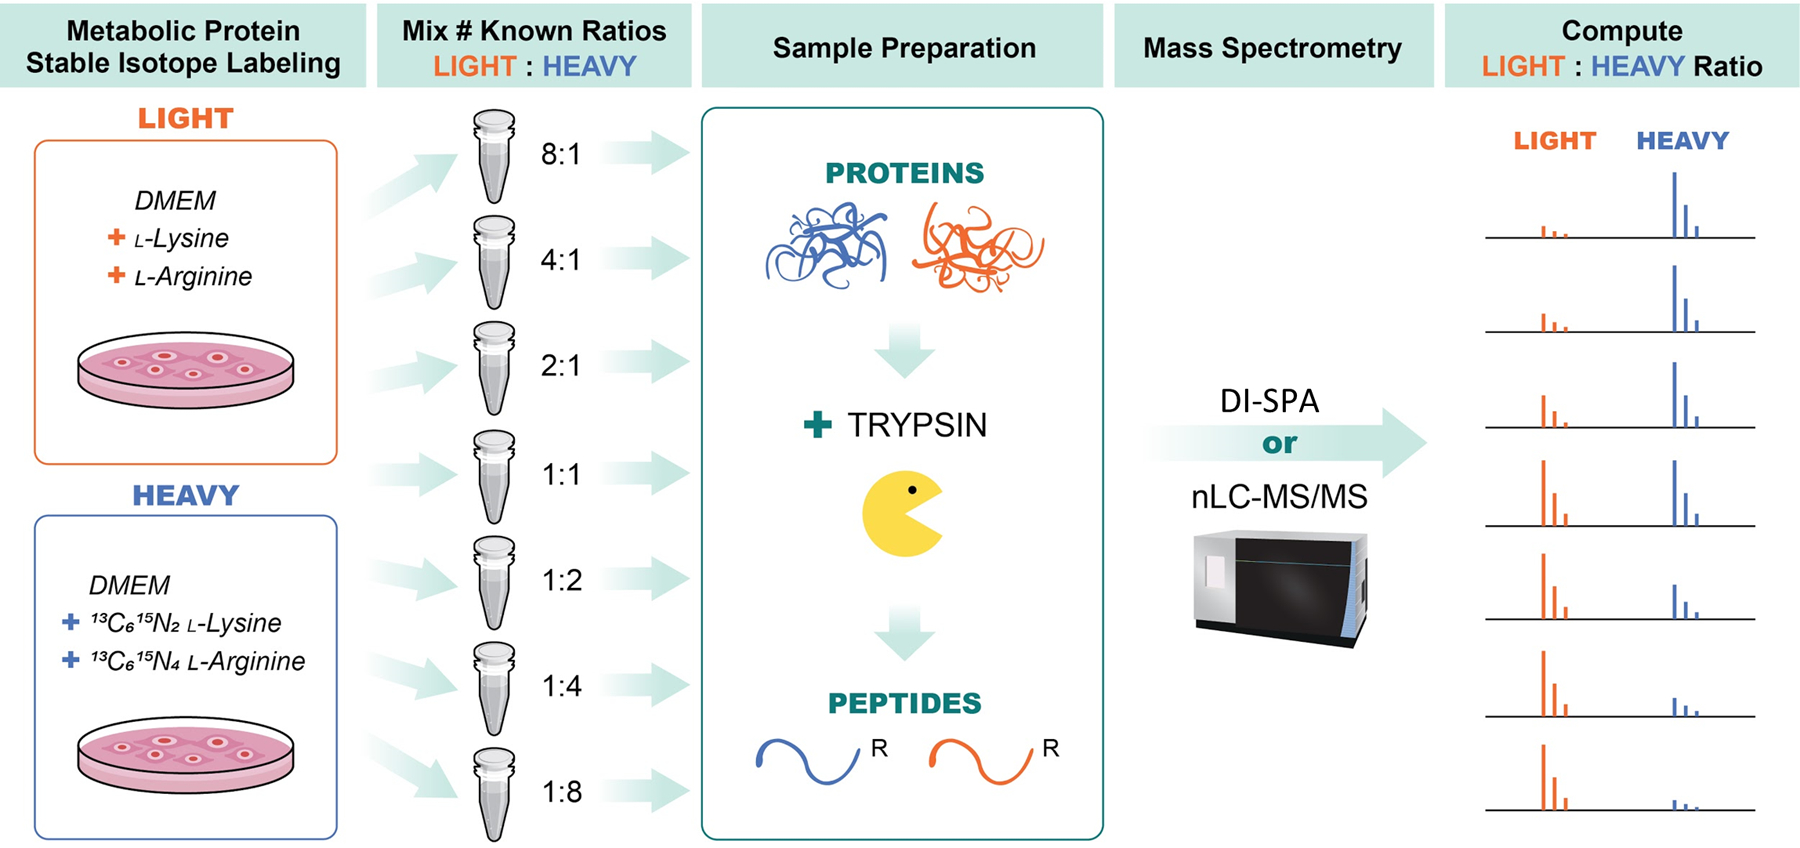
A549 cells were grown in DMEM media containing either light lysine and arginine (LIGHT) or 13C6, 15N2 -lysine and 13C6,15N4 L-arginine (HEAVY) and then combined at various ratios including: 1:8, 1:4, 1:2, 1:1, 2:1, 4:1, and 8:1 (HEAVY:LIGHT). Samples were then lysed proteins were reduced and alkylated, and proteolysis was initiated with trypsin. Peptides from trypsin digestion were desalted and then data was collected in parallel with either traditional nanoLC-MS/MS to verify SILAC ratios and provide a benchmark, or with DI-SPA to determine quantitative quality. Data from nanoLC-MS/MS was analyzed using MaxQuant to identify and quantify peptides, and data from DI-SPA was analyzed with MSPLIT-DIA and custom code in python and R.
Extended Data Fig. 8. Examples of relationships between DI-SPA data collection settings for different peptides and their corresponding proteins.
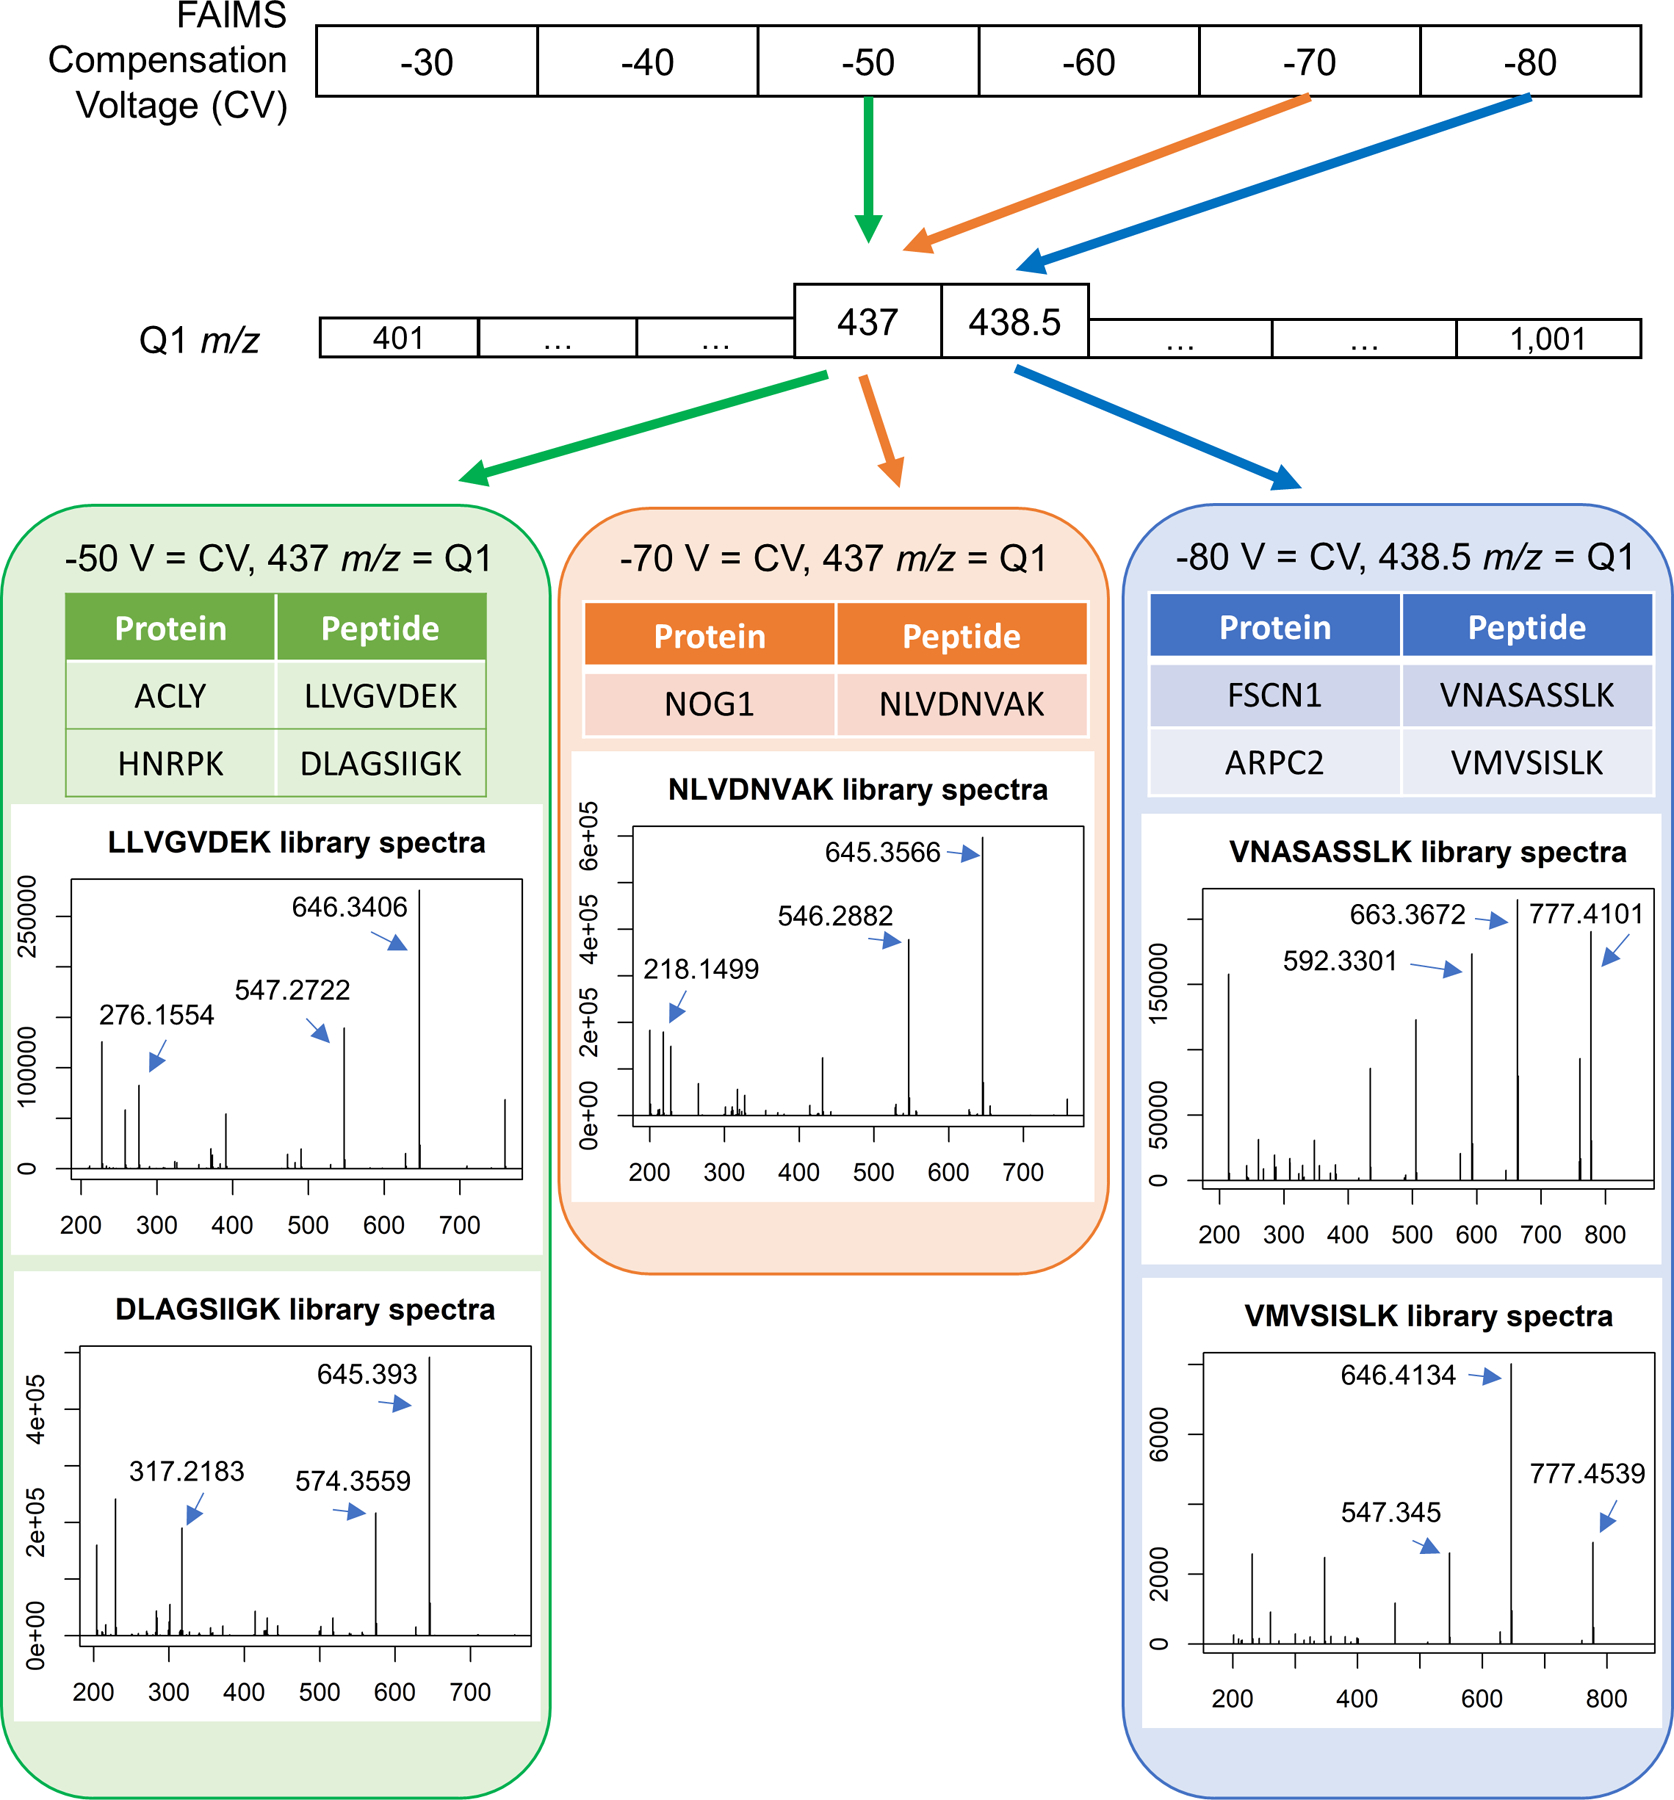
Peptides that uniquely identify proteins are found with a combination of gas-phase fractionation by FAIMS and precursor mass isolation with the first quadrupole (Q1). In this example, two unique peptides from different proteins are co-isolated with FAIMS compensation voltage (CV) of −50 V and Q1 set to 437 m/z. A single peptide is isolated with CV of −70 V and the same Q1 setting of 437 m/z, and two more peptides are isolated with a CV of −80 V at Q1 set to 438.5 m/z. Library spectra are shown for each peptide. The three most abundant singly charged y-ions in the library spectra are used for peptide quantification unless otherwise noted.
Extended Data Fig. 9. Comparison of Quantification from peptides shared between LC-MS (MaxQuant) and DI-SPA analysis.

Data are from peptides quantified with both methods from enriched mitochondria. Bands around the regression line show the 95% confidence interval.
Extended Data Fig. 10. DI-SPA quantification of proteins from mitochondria subcellular fractions.
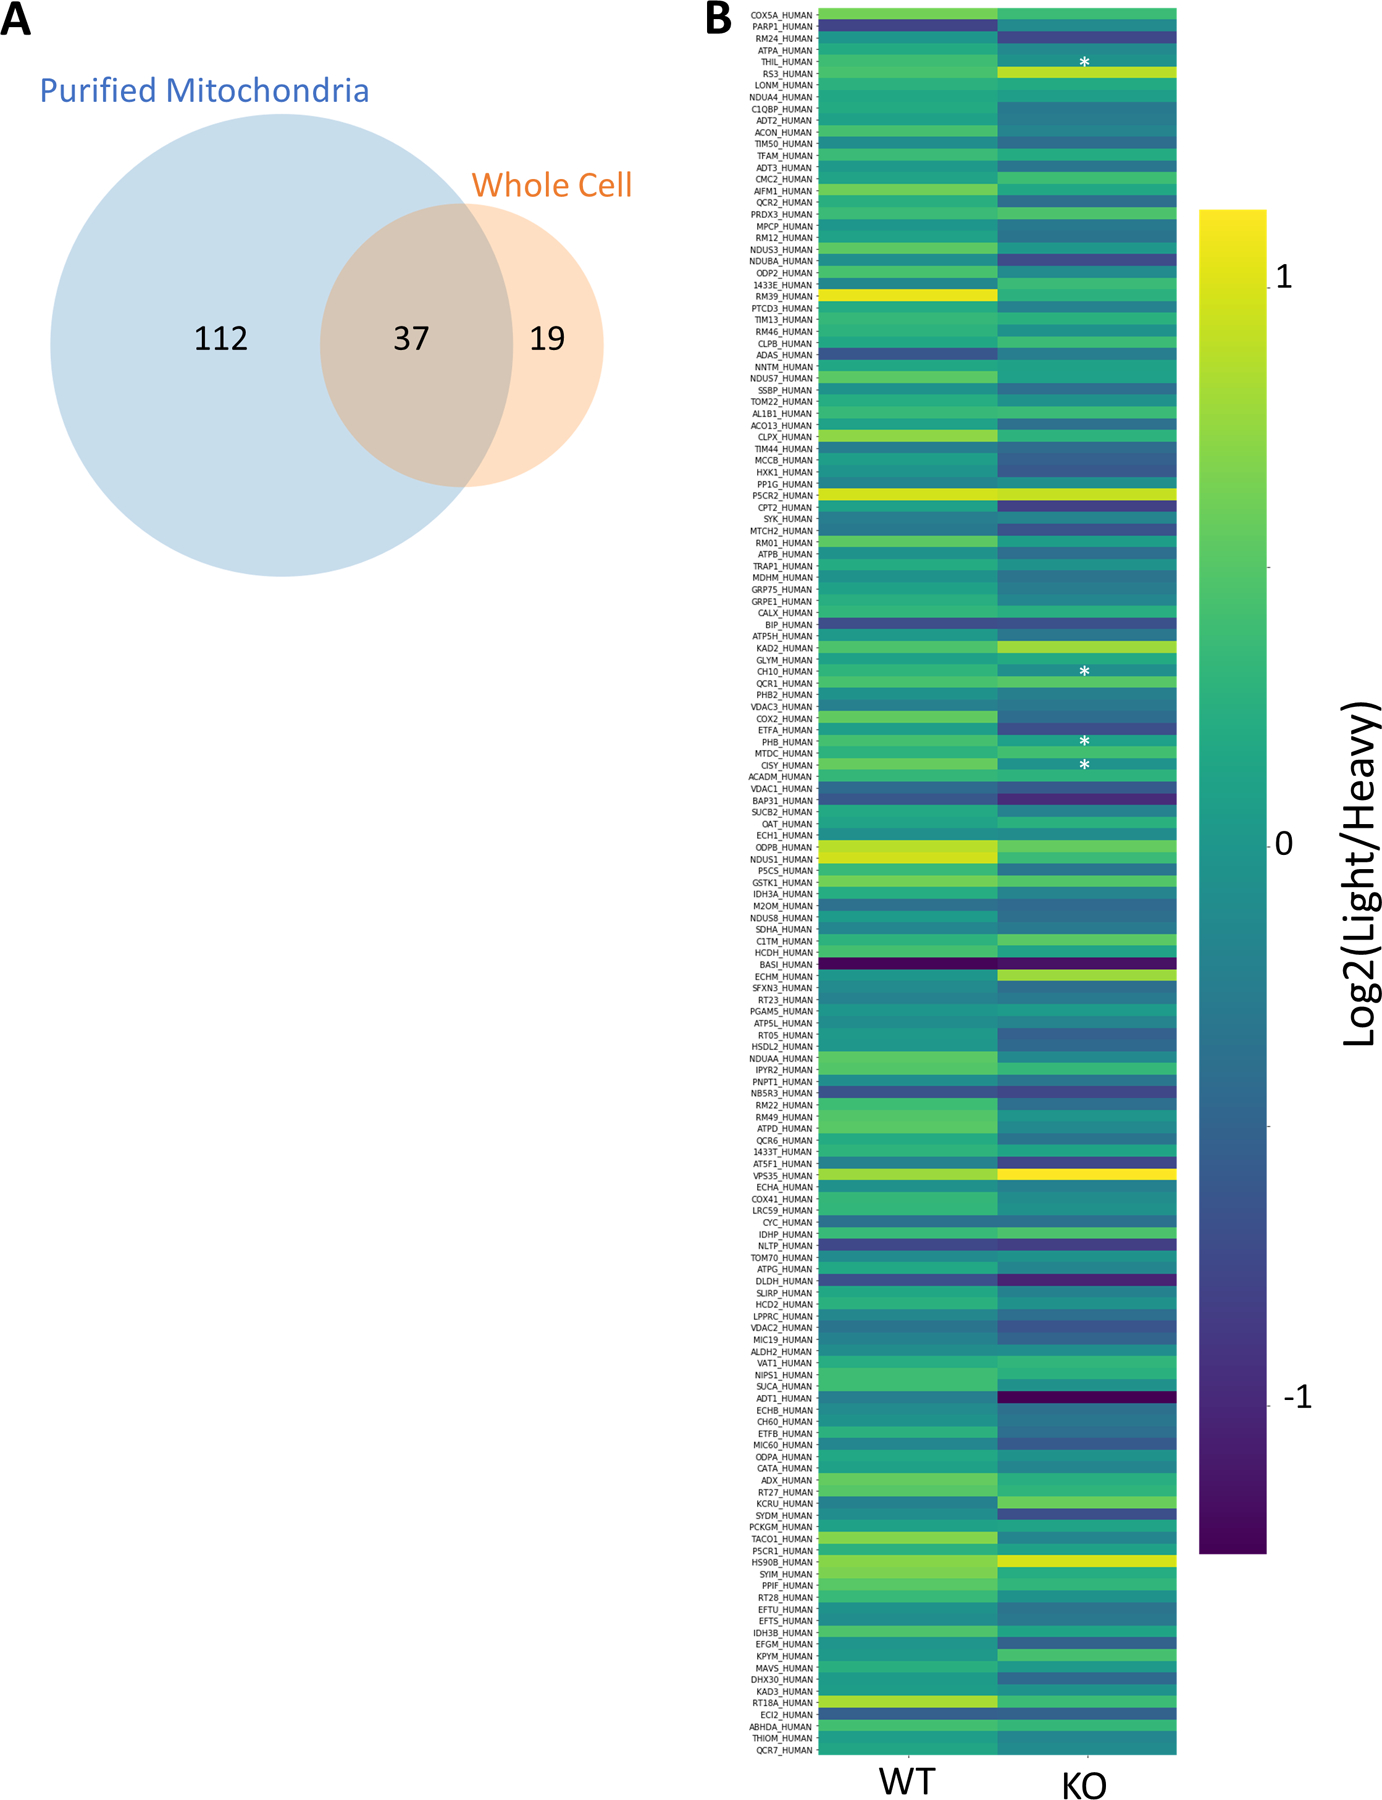
(A) Overlap of 37 mitochondrial proteins quantified: 149 from the purified mitochondria experiment and 56 from the whole cell experiment. (B) Heatmap showing trend of general decrease in the 149 proteins annotated mitochondrial from DI-SPA analysis of the purified mitochondria. Light is the signal from the experimental condition and heavy is the signal from the SILAC standard protein. *Benjamini-Hochberg adjusted p-value <0.05, exact corrected p-values: PHB=0.023, CISY=0.023, THIL=0.036, CH10=0.036. n=3 independent biological replicates of mitochondria preparations from 293T cells from one independent experiment. p-values are from a two-tailed T-test assuming equal variance, and corrected p-value is from Benjamini-Hochberg multiple hypothesis testing correction. Source Data is available as Supplementary Table 6.
Supplementary Material
Acknowledgements:
The authors thank D. Hwang for help preparing figures, A. Williams for help writing, J. Mabry for assistance in the generation of the PPTC7 knockout cell line, A. Hebert for helpful discussions, and the Cantor Lab for their generous gift of HPLM. This work was supported by the following NIH grants: T15 LM007359 (J.G.M.), P41 GM108538 (J.J.C.), R01 DK098672 (D.J.P.).
Footnotes
Editorial summary: Direct Infusion – Shotgun Proteome Analysis (DI-SPA) using data-independent acquisition mass spectrometry (DIA-MS), achieves fast and reproducible results by omitting the liquid chromatography fractionation step and directly performing gas-phase fractionation by ion mobility.
Editor recognition statement: Arunima, Singh was the primary editor on this article and managed its editorial process and peer review in collaboration with the rest of the editorial team.
Ethics Statement: JJC is a consultant for Thermo Fisher Scientific. JGM, NMM, DJP have no competing interests.
REFERENCES:
- 1.Aebersold R & Mann M Mass-spectrometric exploration of proteome structure and function. Nature 537, 347–355 (2016). [DOI] [PubMed] [Google Scholar]
- 2.Meyer JG & Schilling B Clinical applications of quantitative proteomics using targeted and untargeted data-independent acquisition techniques. Expert Review of Proteomics 14, 419–429 (2017). [DOI] [PMC free article] [PubMed] [Google Scholar]
- 3.de Godoy LMF et al. Comprehensive mass-spectrometry-based proteome quantification of haploid versus diploid yeast. Nature 455, 1251–1254 (2008). [DOI] [PubMed] [Google Scholar]
- 4.Hebert AS et al. The One Hour Yeast Proteome. Molecular & Cellular Proteomics 13, 339–347 (2014). [DOI] [PMC free article] [PubMed] [Google Scholar]
- 5.Bache N et al. A Novel LC System Embeds Analytes in Pre-formed Gradients for Rapid, Ultra-robust Proteomics. Molecular & Cellular Proteomics 17, 2284–2296 (2018). [DOI] [PMC free article] [PubMed] [Google Scholar]
- 6.Kelstrup CD et al. Performance Evaluation of the Q Exactive HF-X for Shotgun Proteomics. J. Proteome Res 17, 727–738 (2018). [DOI] [PubMed] [Google Scholar]
- 7.Gachumi G, Purves RW, Hopf C & El-Aneed A Fast Quantification Without Conventional Chromatography, The Growing Power of Mass Spectrometry. Anal. Chem 92, 8628–8637 (2020). [DOI] [PubMed] [Google Scholar]
- 8.Chekmeneva E et al. Optimization and Application of Direct Infusion Nanoelectrospray HRMS Method for Large-Scale Urinary Metabolic Phenotyping in Molecular Epidemiology. J. Proteome Res 16, 1646–1658 (2017). [DOI] [PMC free article] [PubMed] [Google Scholar]
- 9.Koulman A et al. High-throughput direct-infusion ion trap mass spectrometry: a new method for metabolomics. Rapid Communications in Mass Spectrometry 21, 421–428 (2007). [DOI] [PubMed] [Google Scholar]
- 10.Wilm M et al. Femtomole sequencing of proteins from polyacrylamide gels by nano-electrospray mass spectrometry. Nature 379, 466–469 (1996). [DOI] [PubMed] [Google Scholar]
- 11.Chen S Rapid protein identification using direct infusion nanoelectrospray ionization mass spectrometry. PROTEOMICS 6, 16–25 (2006). [DOI] [PubMed] [Google Scholar]
- 12.Pereira-Medrano AG, Sterling A, Snijders APL, Reardon KF & Wright PC A systematic evaluation of chip-based nanoelectrospray parameters for rapid identification of proteins from a complex mixture. Journal of the American Society for Mass Spectrometry 18, 1714–1725 (2007). [DOI] [PubMed] [Google Scholar]
- 13.Chen J, Canales L & Neal RE Multi-Segment Direct Inject nano-ESI-LTQ-FT-ICR-MS/MS For Protein Identification. Proteome Science 9, 38 (2011). [DOI] [PMC free article] [PubMed] [Google Scholar]
- 14.Xiang Y & Koomen JM Evaluation of Direct Infusion-Multiple Reaction Monitoring Mass Spectrometry for Quantification of Heat Shock Proteins. Anal. Chem 84, 1981–1986 (2012). [DOI] [PMC free article] [PubMed] [Google Scholar]
- 15.Kretschy D et al. High-throughput flow injection analysis of labeled peptides in cellular samples—ICP-MS analysis versus fluorescence based detection. International Journal of Mass Spectrometry 307, 105–111 (2011). [DOI] [PMC free article] [PubMed] [Google Scholar]
- 16.Sidoli S et al. One minute analysis of 200 histone posttranslational modifications by direct injection mass spectrometry. Genome Res 29, 978–987 (2019). [DOI] [PMC free article] [PubMed] [Google Scholar]
- 17.Michalski A, Cox J & Mann M More than 100,000 Detectable Peptide Species Elute in Single Shotgun Proteomics Runs but the Majority is Inaccessible to Data-Dependent LC−MS/MS. Journal of Proteome Research 10, 1785–1793 (2011). [DOI] [PubMed] [Google Scholar]
- 18.Cech NB & Enke CG Relating Electrospray Ionization Response to Nonpolar Character of Small Peptides. Analytical Chemistry 72, 2717–2723 (2000). [DOI] [PubMed] [Google Scholar]
- 19.Meyer JG & Komives A, E. Charge State Coalescence During Electrospray Ionization Improves Peptide Identification by Tandem Mass Spectrometry. Journal of the American Society for Mass Spectrometry 1–10 (2012). [DOI] [PMC free article] [PubMed] [Google Scholar]
- 20.Ogorzalek Loo RR, Lakshmanan R & Loo JA What protein charging (and supercharging) reveal about the mechanism of electrospray ionization. J. Am. Soc. Mass Spectrom 25, 1675–1693 (2014). [DOI] [PMC free article] [PubMed] [Google Scholar]
- 21.Annesley TM Ion Suppression in Mass Spectrometry. Clin. Chem 49, 1041 (2003). [DOI] [PubMed] [Google Scholar]
- 22.Sarvin B et al. Fast and sensitive flow-injection mass spectrometry metabolomics by analyzing sample-specific ion distributions. Nat Commun 11, 3186 (2020). [DOI] [PMC free article] [PubMed] [Google Scholar]
- 23.Webb IK et al. Experimental Evaluation and Optimization of Structures for Lossless Ion Manipulations for Ion Mobility Spectrometry with Time-of-Flight Mass Spectrometry. Analytical Chemistry 86, 9169–9176 (2014). [DOI] [PMC free article] [PubMed] [Google Scholar]
- 24.Giles K et al. A Cyclic Ion Mobility-Mass Spectrometry System. Analytical Chemistry 91, 8564–8573 (2019). [DOI] [PubMed] [Google Scholar]
- 25.Meier F et al. Parallel Accumulation–Serial Fragmentation (PASEF): Multiplying Sequencing Speed and Sensitivity by Synchronized Scans in a Trapped Ion Mobility Device. Journal of Proteome Research 14, 5378–5387 (2015). [DOI] [PubMed] [Google Scholar]
- 26.Swearingen KE et al. Nanospray FAIMS Fractionation Provides Significant Increases in Proteome Coverage of Unfractionated Complex Protein Digests. Molecular & Cellular Proteomics 11, M111.014985 (2012). [DOI] [PMC free article] [PubMed] [Google Scholar]
- 27.Hebert AS et al. Comprehensive Single-Shot Proteomics with FAIMS on a Hybrid Orbitrap Mass Spectrometer. Analytical Chemistry 90, 9529–9537 (2018). [DOI] [PMC free article] [PubMed] [Google Scholar]
- 28.Nagy G et al. Separation of β-Amyloid Tryptic Peptide Species with Isomerized and Racemized l -Aspartic Residues with Ion Mobility in Structures for Lossless Ion Manipulations. Analytical Chemistry 91, 4374–4380 (2019). [DOI] [PMC free article] [PubMed] [Google Scholar]
- 29.Melani RD et al. Direct Measurement of Light and Heavy Antibody Chains Using Differential Ion Mobility Spectrometry and Middle-Down Mass Spectrometry. bioRxiv (2019) doi: 10.1101/693473. [DOI] [PMC free article] [PubMed] [Google Scholar]
- 30.Purves RW, Prasad S, Belford M, Vandenberg A & Dunyach J-J Optimization of a New Aerodynamic Cylindrical FAIMS Device for Small Molecule Analysis. Journal of The American Society for Mass Spectrometry 28, 525–538 (2017). [DOI] [PubMed] [Google Scholar]
- 31.Hengel SM et al. Data-independent proteomic screen identifies novel tamoxifen agonist that mediates drug resistance. J. Proteome Res 10, 4567–4578 (2011). [DOI] [PMC free article] [PubMed] [Google Scholar]
- 32.Yi EC et al. Approaching complete peroxisome characterization by gas-phase fractionation. Electrophoresis 23, 3205–3216 (2002). [DOI] [PubMed] [Google Scholar]
- 33.Wang J et al. MSPLIT-DIA: sensitive peptide identification for data-independent acquisition. Nature Methods 12, 1106 (2015). [DOI] [PMC free article] [PubMed] [Google Scholar]
- 34.Wang J, Pérez-Santiago J, Katz JE, Mallick P & Bandeira N Peptide Identification from Mixture Tandem Mass Spectra. Molecular & Cellular Proteomics 9, 1476–1485 (2010). [DOI] [PMC free article] [PubMed] [Google Scholar]
- 35.Horn DM, Zubarev RA & McLafferty FW Automated reduction and interpretation of high resolution electrospray mass spectra of large molecules. Journal of the American Society for Mass Spectrometry 11, 320–332 (2000). [DOI] [PubMed] [Google Scholar]
- 36.Jaitly N et al. Decon2LS: An open-source software package for automated processing and visualization of high resolution mass spectrometry data. BMC Bioinformatics 10, 87 (2009). [DOI] [PMC free article] [PubMed] [Google Scholar]
- 37.Tabb DL et al. Repeatability and reproducibility in proteomic identifications by liquid chromatography-tandem mass spectrometry. J. Proteome Res 9, 761–776 (2010). [DOI] [PMC free article] [PubMed] [Google Scholar]
- 38.Geyer PE, Holdt LM, Teupser D & Mann M Revisiting biomarker discovery by plasma proteomics. Mol Syst Biol 13, 942 (2017). [DOI] [PMC free article] [PubMed] [Google Scholar]
- 39.Cantor JR et al. Physiologic Medium Rewires Cellular Metabolism and Reveals Uric Acid as an Endogenous Inhibitor of UMP Synthase. Cell 169, 258–272.e17 (2017). [DOI] [PMC free article] [PubMed] [Google Scholar]
- 40.Oexle H, Gnaiger E & Weiss G Iron-dependent changes in cellular energy metabolism: influence on citric acid cycle and oxidative phosphorylation. Biochimica et Biophysica Acta (BBA) - Bioenergetics 1413, 99–107 (1999). [DOI] [PubMed] [Google Scholar]
- 41.McInnes L, Healy J & Melville J UMAP: Uniform Manifold Approximation and Projection for Dimension Reduction. arXiv:1802.03426 [cs, stat] (2018). [Google Scholar]
- 42.Niemi NM et al. Pptc7 is an essential phosphatase for promoting mammalian mitochondrial metabolism and biogenesis. Nature Communications 10, (2019). [DOI] [PMC free article] [PubMed] [Google Scholar]
- 43.Meyer JG et al. Quantification of Lysine Acetylation and Succinylation Stoichiometry in Proteins Using Mass Spectrometric Data-Independent Acquisitions (SWATH). Journal of The American Society for Mass Spectrometry 27, 1758–1771 (2016). [DOI] [PMC free article] [PubMed] [Google Scholar]
- 44.Ivanov MV et al. DirectMS1: MS/MS-Free Identification of 1000 Proteins of Cellular Proteomes in 5 Minutes. Anal. Chem 92, 4326–4333 (2020). [DOI] [PubMed] [Google Scholar]
- 45.Bekker-Jensen DB et al. A Compact Quadrupole-Orbitrap Mass Spectrometer with FAIMS Interface Improves Proteome Coverage in Short LC Gradients. Mol Cell Proteomics 19, 716–729 (2020). [DOI] [PMC free article] [PubMed] [Google Scholar]
- 46.Bian Y et al. Robust, reproducible and quantitative analysis of thousands of proteomes by micro-flow LC–MS/MS. Nat Commun 11, 157 (2020). [DOI] [PMC free article] [PubMed] [Google Scholar]
- 47.Shishkova E, Hebert AS & Coon JJ Now, More Than Ever, Proteomics Needs Better Chromatography. Cell Systems 3, 321–324 (2016). [DOI] [PMC free article] [PubMed] [Google Scholar]
METHODS-ONLY REFERENCES
- 48.Kong AT, Leprevost FV, Avtonomov DM, Mellacheruvu D & Nesvizhskii AI MSFragger: ultrafast and comprehensive peptide identification in mass spectrometry–based proteomics. Nature Methods 14, 513–520 (2017). [DOI] [PMC free article] [PubMed] [Google Scholar]
- 49.Ong S-E et al. Stable Isotope Labeling by Amino Acids in Cell Culture, SILAC, as a Simple and Accurate Approach to Expression Proteomics. Molecular & Cellular Proteomics 1, 376–386 (2002). [DOI] [PubMed] [Google Scholar]
- 50.Wang M et al. Assembling the Community-Scale Discoverable Human Proteome. Cell Systems 7, 412–421.e5 (2018). [DOI] [PMC free article] [PubMed] [Google Scholar]
- 51.MacLean B et al. Skyline: an open source document editor for creating and analyzing targeted proteomics experiments. Bioinformatics 26, 966–968 (2010). [DOI] [PMC free article] [PubMed] [Google Scholar]
- 52.Chambers MC et al. A cross-platform toolkit for mass spectrometry and proteomics. Nature Biotechnology 30, 918–920 (2012). [DOI] [PMC free article] [PubMed] [Google Scholar]
- 53.Gupta N & Pevzner PA False Discovery Rates of Protein Identifications: A Strike against the Two-Peptide Rule. Journal of Proteome Research 8, 4173–4181 (2009). [DOI] [PMC free article] [PubMed] [Google Scholar]
- 54.Shanmugam AK, Yocum AK & Nesvizhskii AI Utility of RNA-seq and GPMDB Protein Observation Frequency for Improving the Sensitivity of Protein Identification by Tandem MS. Journal of Proteome Research 13, 4113–4119 (2014). [DOI] [PMC free article] [PubMed] [Google Scholar]
- 55.Forsman U, Sjöberg M, Turunen M & Sindelar PJ 4-Nitrobenzoate inhibits coenzyme Q biosynthesis in mammalian cell cultures. Nature Chemical Biology 6, 515–517 (2010). [DOI] [PubMed] [Google Scholar]
- 56.Kueng W, Silber E & Eppenberger U Quantification of cells cultured on 96-well plates. Analytical Biochemistry 182, 16–19 (1989). [DOI] [PubMed] [Google Scholar]
- 57.Levitsky LI, Klein JA, Ivanov MV & Gorshkov MV Pyteomics 4.0: Five Years of Development of a Python Proteomics Framework. Journal of Proteome Research 18, 709–714 (2019). [DOI] [PubMed] [Google Scholar]
- 58.Meyer J Code for analysis of data from Direct Infusion Shotgun Proteome Analysis (DI-SPA) (Zenodo, 2020). doi: 10.5281/ZENODO.4115930. [DOI] [Google Scholar]
Associated Data
This section collects any data citations, data availability statements, or supplementary materials included in this article.
Supplementary Materials
Data Availability Statement
All raw data (along with excel sheet giving details of each file), filtered and unfiltered search results, and quantification files are available on massive under the dataset identifier MSV000085156 (https://doi.org/doi:10.25345/C5M686). The massive repository also includes the relevant human FASTA database “2019–03-14-td-UP000005640.fasta”. Detailed descriptions of the RAW data files are on massive under the folder “other” in the excel file “Raw data files descriptions v3.xlsx”. The massive repository includes the human spectral libraries for use with MSPLIT-DIA, and the files used to create libraries.


