

Abstract
Due to their ability to confer key functions of the native extracellular matrix (ECM) poly(ethylene glycol) (PEG)-based and PEG-modified materials have been extensively used as biocompatible and biofunctionalized substrate systems to study the influence of environmental parameters on cell adhesion in vitro. Given wide-ranging recent evidence that ECM compliance influences a variety of cell functions, the detailed determination and characterization of the specific PEG surface characteristics including topography, stiffness and chemistry is required. Here, we studied two frequently used bio-active interfaces - PEG-based and PEG-modified surfaces - to elucidate the differences between the physical surface properties, which cells can sense and respond to. For this purpose, two sets of surfaces were synthesized: the first set consisted of nanopatterned glass surfaces containing cRGD-functionalized gold nanoparticles surrounded by a passivated PEG-silane layer and the second set consisted of PEG-diacrylate (PEG-DA) hydrogels decorated with cRGD-functionalized gold nanoparticlesAlthough the two sets of nanostructured materials compared here were highly similar in terms of density and geometrical distribution of the presented bio-ligands as well as in terms of mechanical bulk properties, the topography and mechanical properties of the surfaces were found to be substantially different and are described in detail. In comparison to very stiff and ultrasmooth surface properties of the PEG-passivated glasses, the mechanical properties of PEG-DA surfaces in the biologically relevant stiffness range, together with the increased surface roughness at micro- and nanoscale levels have the potential to affect cell behavior. This potential was verified by studying the adhesive behavior of hematopoietic KG-1a and rat embryonic fibroblast (REF52) cells on both surfaces.
Keywords: Biofunctionalization, Block copolymer nanolithography, Cell adhesion, echanical properties, PEG hydrogel, Surface roughness
Graphical Abstract
Nanostructured, bio-active interfaces were studied to elucidate the impacts of surface stiffness and topography on cell-surface interactions.
Introduction
Integrin-mediated cell adhesion to the extra cellular matrix (ECM) is crucial for many cellular functions and has been extensively studied in vivo and in vitro.1–3 It depends on chemical based parameters such as ligand choice, on the spatial organization of the ligands4 and on physical properties of the ECM such as substrate stiffness and topography.5, 6 These parameters can be adjusted well on two dimensional matrices.
Spatial organization of topography and chemical cues on such two dimensional matrices has been addressed by different surface patterning techniques in order to mimic the respective conditions of the ECM in vivo. However, only few techniques, such as Dip-pen7 and e-beam lithography8 have been able to achieve patterns with sub-100 nm spatial resolution, which addresses the dimensions of integrin clusters in cell adhesion process called focal adhesions.1 For even better patterning resolution down to single integrin, i.e. less than 10 nm, block copolymer self-assembly at interfaces and its domain specific functionalization with proteins had been developed. One method, consisted of self-assembled, maleimide-functionaized polystyrene-block-poly(ethylene glycol) copolymers (PS-PEG-Ma), which allowed for patterns with sub-100 nm spatial resolution of the cellular adhesion molecules by changing the ratio of PS-PEG-Ma in mixtures of block copolymer and polystyrene homopoloymer.9, 10 We have approached the patterning of single proteins with the block copolymer micelle nanolithography (BCML) technique in the last years. It results in the decoration of inorganic surfaces, such as glass or SiO2-wafers with quasi-hexagonal patterns of gold nanoparticles.11, 12 By their diameter, these nanoparticles offer a binding size which is in the range of the protein or peptide of interest. Thereby, the nanoparticle pattern determines the spatial distribution of peptides and proteins at interfaces with molecular resolution, which may mark the spatial distributions of cell-substrate binding sites.13, 14
Gold nanostructure surfaces generated by BCML have been studied for their stability in cell culture conditions and therefore widely applied to study cell adhesion.1, 15–18 In order to avoid unspecific deposition of proteins from the cell media to a glass or SiO2-wafer, the surface between the gold nanoparticles is passivated with a PEG-silane monolayer. Such thin PEG layers reduce the amount of unwanted proteins at interfaces to a minimum which does not influence cell adhesion.19–22 Following the passivation, the gold nanoparticles are functionalized with the molecule of interest. This approach is very powerful, since it enables the testing of cellular responses to individual, specific signalling molecules and their spatial ordering.
Despite the versatility of the nanopattern glass or SiO2-wafers for distributing single signalling molecules at interfaces it fails for considering different substrate stiffness and topography, which may play an important role in vivo.23–25 Moreover, decomposition of the surface PEG coating due to the silane hydrolysis reactions in basic conditions,26 as well as oxidation of the PEG layer in cell culture27 limit thus far the applicability of this system to short-term studies, in the range of a few days.21, 28, 29
Photo cross-linkable PEG-based hydrogels are capable of supporting long-term cell viability because of much slower degradation of the cross-linked PEG.30 Moreover, tuneable elasticity over four orders of magnitude from 1 KPa to 9 MPa, controlled by varying the molecular weight of the PEG units from 35000 g mol−1 to 700 g mol−1, respectively,31–33 increases the potential to confer the physical key functionalities of native ECM.30, 34 Despite these advancements, it has proved challenging to independently control the mechanical properties of the substrate without changing biochemical characteristics of the surface. Recently, we have developed a new method allowing individual control of substrate stiffness and ligand spacing. This was achieved by a combination of BCML with transfer lithography based on poly(ethylene glycol)-diacrylate (PEG-DA) polymerization.16, 31, 35 In a previous study we presented a cell biology approach to this substrate system where crucial parameters such as substrate compliance, the spacing and density of numerous biomolecules can be varied fully independently from each other.31 However, in order to understand how these nanopatterned hydrogels may affect cell adhesion, it is important to determine and characterize the specific surface properties including topography, stiffness and chemistry.
In the present study, we provide a detailed characterization over two frequently used nanostructured materials (e.g., PEG-DA hydrogels and PEG passivated glass surfaces) to elucidate the differences between the physical surface properties, which cells can sense and respond to. Towards this goal, we prepared two sets of highly similar surfaces. The first set consisted of gold nanostructured glass surfaces generated by BCML and passivated with PEG2000-silane (molecular weight 2000 g mol−1) layer and the second set consisted of gold nanostructured PEG700-DA hydrogels (molecular weight 700 g mol−1) generated by a combination of BCML and transfer lithography. In both cases the gold nanoparticles with a diameter of ca.8 nm and with spacings adjustable between 20 and 160 nm were functionalized with cyclic arginine-glycine-aspartic acid peptide (cRGD), which serves as an adhesive recognition sequence for many integrins and is present in fibronectin and other ECM proteins.2, 35 Additionally, the adhesion behavior of hematopoietic KG-1a cells and of rat embryonic fibroblast (REF52) cells was tested on both surfaces. The different cell adhesive responds was characterized and correlated to different surface properties.
Experimental Section
Production of Nanostructured Glass Surfaces
Quasi-hexagonally ordered gold nanoparticles arrays on cleaned glass surfaces (18 × 18 × 0.15 mm) were fabricated using toluene solution of poly(styrene)–block-poly(2-vinyl pyridine) (PS-b-P2VP, Polymer Source Inc., Montreal, Canada).36 Shortly, the PS-b-P2VP toluene solution was treated with HAuCl4 (Sigma Aldrich, Taufkirchen, Germany) at a stoichiometric loading of (P2VP/HAuCl4) = 0.5 and stirred at least for 24 h in order to obtain gold nanoparticles with a diameter between 6–8 nm. The lateral distance between the individual gold nanoparticles was adjusted between 20 and 200 nm by varying the molecular weight of polystyrene units or the micellar coating process, such as the polymer concentration and the dipping or spinning speed. Details concerning the applied block polymers and the dip or spin casting processes are included in Table 1.
Table 1.
Summary of PS-b-P2VP characteristics, parameters of the dipping and spin casting processes and the obtained nanoparticle spacings.
| Polymer PS(units)-b-P2VP(units) | PDI | Polymer concentration [mg/ml] | Dipping/Spinning speed | Distance on glass [nm] |
|---|---|---|---|---|
| PS154-b-P2VP33 | 1.08 | 5 | 24 [V] | 22 ± 5 |
| PS240-b-P2VP143 | 1.07 | 5 | 10 [V] | 36 ± 7 |
| 4 | 10 [V] | 45 ± 8 | ||
| PS1056-b-P2VP495 | 1.15 | 5 | 18 [V] | 66 ± 11 |
| PS1056-b-P2VP671 | 1.09 | 5 | 2000 rpm | 62±10 |
| 2.5 | 6000 rpm | 110±13 | ||
| PS1824-b-P2VP523 | 1.10 | 2.5 | 6000 rpm | 162±21 |
For a quality control, at least 10% of the samples from each solution were observed by scanning electron microscopy (SEM) before being transferred to the hydrogel surfaces. To improve the stability of the gold nanoparticles on the glass surfaces designed for cell experiments, the substrates were thermally tempered for 48 h at 300 °C. The cross-section observation of the tempered and non-tempered nanostructured glass surfaces was done by transmission electron microscopy (TEM) (see Figure S1 in supplementary information). Better mechanical stability of the tempered glass surfaces was obtained due to the partially embedded nature (~25%) of the gold nanoparticles in the glass layer.
Passivation of Nanopatterned Glass Surfaces
Passivation of glass surfaces was obtained by first activating the surfaces with oxygen plasma (0.4 mbar O2; 150 W, 10 min). The area between the gold nanoparticles of the nanopatterned glass substrates (18 × 18 × 0.15 mm) was passivated with PEG-ethoxysilane (molecular mass Mw = 2000 gr mol−1) by immersing the substrate in dry toluene (Merck, Darmstadt, Germany) containing PEG-ethoxysilane of 5 mg ml−1, 0.01% (v/v) water and ~1% (v/v) triethylamine (Sigma Aldrich, Taufkirchen, Germany) over night at 80°C under a nitrogen atmosphere.19, 37 Thereafter, the substrates were rinsed with ethyl acetate 99.9% (Carl Roth GmbH, Germany) and methanol (BASF, Germany) and dried under nitrogen.
Fabrication of Nanostructured PEG Hydrogels
The nanoparticles on the nanostructured glass substrates were transferred to PEG700-DA hydrogels (molecular weight 700 g/mol) according to Aydin et al.31 Since the swelling ratio of PEG700-DA hydrogels was ~1, the spacing between the gold nanoparticles remained unmodified.31 As a quality control 50% of the nanopatterned hydrogels were investigated and characterized by Cryo SEM and indentation measurements (see the following sections).
Transmission Electron Microscopy (TEM)
After the nanostructured glass slide was broken into two pieces, the two pieces were glued together face-to-face using epoxy-phenolic adhesive (M Bond 610™; Vishay Electronic GmbH, Germany). This “sandwich” was fixed with two silicon wafers in order to stabilize mechanically the sandwich structure. Subsequently, the specimen was thinned first by mechanical polishing and then further utilizing an ion-mill (Gatan PIPS, Munich, Germany) until a hole has formed in the centre, which is transparent for electrons at the edges (thickness: 10–100 nm). Finally the TEM image was obtained by a JEOL 400FX (JEOL GmbH, Eching, Germany) using a LaB6-cathode at 400 kV.
The chemical properties of the epoxy-phenolic adhesive and the specimen thinning procedure induce a partial mixing of material between PEG700-DA and the epoxy. Therefore, it was impossible to obtain cross-sectional PEG hydrogel samples. For this purpose, the cross section images of PEG700-DA hydrogels were obtained by cryo-SEM (see following Section).
Scanning Electron Microscopy (SEM) and Cryo-SEM
A Zeiss Ultra 55 field emission electron microscope (FE-SEM) equipped with in-lens, secondary electron (SE) and angle selective backscattered electron (ASB) detectors was used for image acquisition (Zeiss SMT, Oberkochen, Germany). Acceleration voltages of about 5 keV and working distances between 3 and 10 mm were used. Signals were detected by the in-lens detector.
Cross-section tilted view (3° tilt relative to the hydrogel surface) and top-view cryo-SEM imaging were performed under low temperature conditions (Top = −130 ± 5 °C). Low acceleration voltages of 1–1.5 kV were applied because of the low conductivity of the investigated samples. After vitrification, the PEG700-DA specimen, mounted on a liquid nitrogen-cooled stage was transferred to a BAL-TECH MED 020 (BAL-TEC AG, Balzers, Liechtenstein) preparation device via an evacuated liquid nitrogen-cooled shuttle BAL-TECH VLC 100 (BAL-TEC AG, Balzers, Liechtenstein). For cross-section cryo observations the hydrogels were fractured in the 10−5-10−6 mbar vacuum chamber at −160 °C with a cooled knife. After fracturing, the samples were heated to −90 °C and kept in the vacuum for 30 min in order to allow water on the interface to sublimate. For cryo-SEM, the samples were transferred immediately to the SEM chamber via an evacuated liquid nitrogen cooled shuttle.
Critical point drying samples were prepared in a CPD 030 critical point dryer, (BAL-TEC AG, Balzers, Liechtenstein). After drying the samples were coated with a 4 nm carbon layer in a BAL-TEC MED020 Coating System, (BAL-TEC AG, Balzers, Liechtenstein) in preparation for SEM imaging.
Atomic Force Microscopy (AFM) Measurements
Mechanical characterization of the PEG700-DA hydrogels as well as of the PEG2000-silane passivated glass surfaces was performed by indentation measurements with a “Nano Wizard II” scanning probe microscope (SPM) (JPK Instruments AG, Berlin, Germany). Tipples, silicon cantilevers (CSC 12 tipples no Al; μmasch, Estonia) were simultaneously cleaned and activated for 5 min with reactive oxygen plasma (0.4 mbar O2; 150 W). Spring constants of the cantilevers were determined by the thermal noise calibration method and ranged between 1.0 N/m and 2.5 N/m. Subsequently, a borosilicate glass microsphere with a diameter of 8 μm (SPI supplies, Westchester, PA, USA) was glued to the cantilever with a two-part epoxy (UHU GmbH & Co. KG, Bühl, Germany). Since the spherical diameter of the tip is a crucial parameter to measure Young’s modulus by the Hertz model38 it was determined for each cantilever used by SEM (see Figure S2 in supplementary information). Hydrogels and passivated glasses were glued to the bottom of the 60 mm Petri dish using a ethyl-2-cyanoacrylate tissue adhesive (EPIGLU, Meyer Haake, Ober-Mörlen, Germany) and filled with 2 ml phosphate-buffered saline (PBS) (PAA Laboratories GmbH, Pashing, Austria). Prior to testing, cantilever deflection sensitivity was calibrated on bare glass surfaces glued to the bottom of the Petri dish and immersed in PBS. It should be noted that to simulate cell culture conditions, hydrogels were immersed in PBS solution for at least 48 h prior to performing the indentation measurements.
To quantify the mechanical properties of the PEG700-DA hydrogels (i.e., the Young’s modulus EY), we performed AFM indentation measurements based on the Hertz model39 and adjusted for spherically shaped tips with known diameter. The most suitable modification of the Hertz theory for a SPM tip-sample system was introduced by Sneddon40 describing an infinitely hard indenter with a special geometry and flat, homogeneous and semi-infinite elastic deformable substrate.41, 42 In this case, the total force F is a function of the indentation δ and is described by:
where R is a radius of the spherical indenter and υ is the Poisson ratio, which was assumed to be 0.45 because of the high water content of the hydrogels. The Hertz model assumes linearly elastic behavior as well as homogeneity of the sample.43 However, most of the artificial hydrogels are neither absolutely homogeneous nor linearly elastic. Therefore, in order to accurately derive the Young modulus of the PEG700-DA hydrogel samples, force distance curves were recorded from 50 different locations on the hydrogels surfaces with about 20 force curves per location (4 curves for each one of the 5 tested rates of tip approach 0.01, 0.1, 0.2, 1 and 2 μm/sec) and fitted to the modified Hertz model.41, 42, 44
On the glass surfaces the scanning probe micrographs were recorded with a “Nano Wizard II” SPM commercially provided by JPK Instruments AG (Berlin, Germany) applying intermittent contact mode.45, 46 Glass substrates were measured in a dry state using hard, backside-coated silicon cantilevers (Applied NanoStructures Inc., Santa Clara, USA; ACTA; k = 40 N m−1). On the PEG700-DA hydrogels the scanning probe micrographs were recorded with “Bruker Nanoscope V” (Bruker, Karlsruhe, Germany), applying peak force quantitative nanomechanical property mapping (QNM) mode. PEG-700-DA hydrogels were analyzed under physiological conditions in liquid (PBS) by using soft, backside-coated, silicon nitride ScanAsyst-Fluid cantilevers (Bruker, Karlsruhe, Germany; k = 0.7 N m−1). Height information was acquired and the surface roughness was characterized as described previously.47
Functionalization of Gold Nanoparticles
To provide cell adhesion on the nanostructured PEG700-DA and PEG2000-silane passivated substrates, c(RGDfK)-PEG6-cysteine or c(RGDfK)-Ahx-thiol were immobilized on gold nanopatterns. (The chemical structures of cRGD peptide with the PEG- or aminohexanoic-spacer and different linkers can be observed in Figure S3 in the supplementary information). For this purpose, the substrates were immersed in a 25 μM aqueous solution of c(RGDfK) for 60 min. To remove the non-covalently bound c(RGDfK), the substrates were rinsed 2 times with deionized water (R = 18, Millipore filtered) for 20 min and then with at least 3 times for a period of 60 min with sterile PBS. Before seeding cells onto the substrates, PEG700-DA hydrogels and glass surfaces were transferred into appropriate warm cell media for at least 20 min.
Cell Adhesion Experiments
The human acute myeloid leukemia cell line KG1a, was purchased from the Leibniz Institute DSMZ - German collection of microorganisms and cell cultures (Braunschweig, Germany) and maintained in RPMI 1640 supplemented with 20% FBS (Invitrogen, Darmstadt, Germany or Sigma-Aldrich, Taufkirchen, Germany) and 1% (v/v) penicillin/streptomycin (Gibco, Darmstadt, Germany) at 37 °C and 5% CO2.
Rat embryonic fibroblast cells (REF52) were a kind gift of Benjamin Geiger (Weizmann Institute of Science, Rehovot, Israel). REF52 cells were maintained in Dulbecco’s modified Eagle’s medium ((DMEM) Gibco Laboratories, Eggenstein, Germany) supplemented with 10% fetal bovine serum (FBS), 2 mM L-glutamine and 100 units/ml penicillin-streptomycin (all from Gibco Laboratories) at 37 °C and 5% CO2.
For adhesion experiments KG-1a cells (1×10⁶) were washed with PBS and seeded directly on the respective substrate surfaces in adhesion medium (RPMI 1640, 1% (v/v) penicillin/ streptomycin, 1 mM CaCl2, 1 mM MgCl2, 25 μM MnCl2) for 1 hour at 37 °C and 5% CO2. Then, the cells and substrates were carefully washed twice with PBS and the remaining cells were imaged using an AxioVert 40 CFL microscope (Zeiss, Jena, Germany). The number of cells, which adhered to the nanopatterned area of the substrates, was counted manually.
Before seeding cells on the biofunctionalized nanopatterned substrates, REF52 cells were trypsinized with trypsin-EDTA 2.5% solution (Gibco Laboratories) for 3 min. Cells were seeded at a density of 5×10⁵ per substrate in DMEM containing 1% FBS. Live cell phase contrast microscopy investigation was performed with 10×/0.25 Ph1 A-Plan objective (Zeiss, Jena, Germany) using an AxioVert 40 CFL microscope (Zeiss, Jena, Germany).
Immunofluorescence Staining
After 4 h culture on the nanopatterned surfaces, REF 52 cells were washed with PBS at 37 °C and fixed with 2.5% paraformaldehyde in PBS for 10 min. Cells were then permeabilized with 0.1% Triton X-100 in PBS, blocked with 5% goat serum (Invitrogen, Germany) in PBS for 1 h at room temperature and incubated with 1:100 dilution of mouse anti-paxillin (Abcam, USA) and with 1:100 dilution of rabbit anti-zyxin (Sigma-Aldrich, Germany) for 1 h at room temperature. Then, cells were labeled with 1:100 dilution of anti-rabbit Alexa 594-conjugated secondary antibody and with 1:100 dilution of anti-mouse Alexa 647-conjugated secondary antibody (Invitrogen, Germany) in 5% goat serum in PBS for 1 h at room temperature. Filamentous actin and nuclei were labeled with Alexa 488-conjugated phalloidin and DAPI (Invitrogen, Germany), respectively. Cells were examined with a 63×/1.25 Oil Ph3 Antiflex Plan-Neofluar objective (Zeiss, Jena, Germany) using an Axiovert 200 fluorescent microscope (Zeiss, Jena, Germany) equipped with a Hamamatsu (model C10600–10B-H) digital CCD camera (Hamamatsu Photonics, Germany). Image processing was achieved with the Axiovision Image viewer (Carl Zeiss, Germany).
Results and Discussions
Surface Texture of PEG700-DA Hydrogels and PEG Passivated Glasses
Glass cover slips were decorated with a quasi-hexagonally ordered gold nanoparticles array, featuring defined interparticle spacings between 20 and 160 nm. The area between the nanoparticles was either passivated with PEG2000-silane or the nanostructured glass slides were used as a template to produce nanopatterned PEG700-DA hydrogels as schematically illustrated in Figure 1.
Fig. 1.

Concept of block copolymer micelle nanolithography (BCML) as previously described.36 (A) Gold nanoparticles on solid support are covalently coupled to transfer linker. The linker is copolymerized into the PEG-meshwork after casting over PEG-DA-photoinitiator solution and irradiation by UV light. Swelling caused by incubation in water induces particle detachment resulting in a gold nanoparticle decorated hydrogel substrate. (B) Nanostructured glass substrates were passivated with a protein-repellent layer of PEG2000-silane in toluene over night at 80°C.
To verify the successful transfer of the gold nanoparticles from the glass surface to the respective PEG700-DA hydrogels, the nanopatterned hydrogels were investigated and characterized by cryo-SEM. Figure 2 A and B show representative cryo-SEM and SEM micrographs (top view) of the nanostructured PEG700-DA hydrogel and glass surfaces, respectively. It could be verified that the gold nanoparticles pattern was successfully transferred one-to-one and that the quality of the arrangement of the nanoparticles was unaffected by the transfer procedure. Moreover, the isotropic swelling of the PEG700-DA hydrogel with a swelling ratio of almost 1 did not severely affect the spacings, ranging from 59 ± 9 nm and 62 ± 11 nm on the glass and hydrogel surfaces, respectively.
Fig. 2.
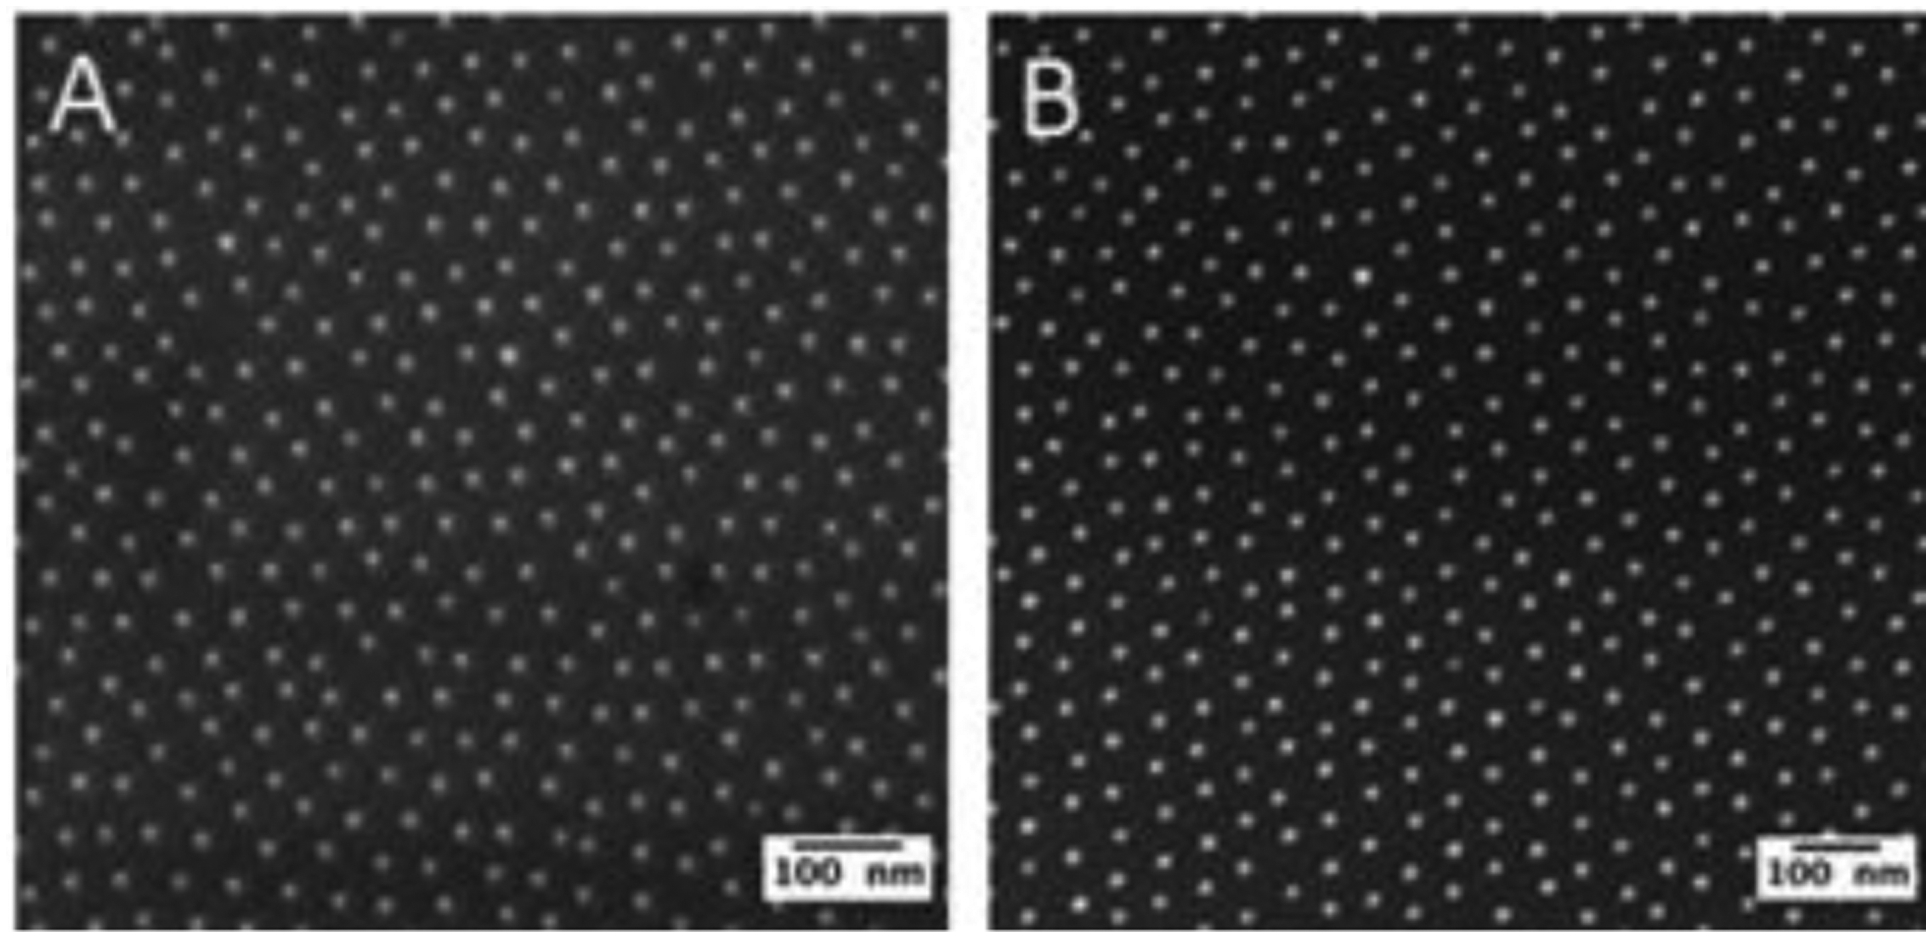
Representative (A) cryo-SEM micrograph (top view) of PEG700-DA hydrogel and (B) SEM micrograph (top view) of nanostructured glass surface. Gold nanoparticle pattern with interparticle spacings of 59 ± 9 nm fabricated via PS1056-b-P2VP495 block copolymer and 18 V dipping speed. The hydrogel interparticle spacing was determined to be 62 ± 11 nm.
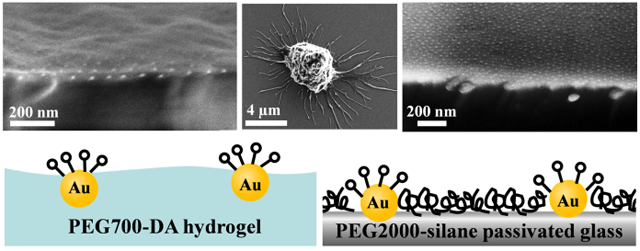
To assess the morphology of the nanopatterned hydrogel and glass surfaces, we used the information obtained from cryo-SEM and SEM micrographs. Figure 3 shows a representative cross-section, tilted view (3° tilt relative to the hydrogel surface) cryo-SEM micrograph of PEG700-DA hydrogel (Figure 3 A–C). As can be seen, the morphology of the PEG700-DA hydrogel surface exhibits roughness at both micro- and nanoscale levels. This roughness can be attributed to the mounds with different size-shape structures ranging from 20 to 400 nm in diameter that are separated from each other by shallow grooves (~15 nm depth). The rough morphology of the hydrogel surface was also confirmed with AFM measurements, providing a root-mean-squere roughness (Rrms) of 17 nm for 5 μm × 5 μm scale (see Figure S4A in the supplementary information). In contrast to the hydrogel surface, the PEG-passivated glass surface exhibited a very smooth morphology as can be observed from cross-section tilted-view (3° tilt relative to the glass surface) SEM micrographs, Figure 3 (D–F). The Rrms of 1.6 nm was calculated based on the AFM measurements (see Figure S4B in supplementary information). It should be noted that the Rrms value of 1.6 nm was calculated including the gold nanoparticle height of 5–6 nm, in average (see Figure S1 in supplementary information). If the height of the gold nanoparticles is excluded, the real roughness of the PEG-passivated glass surfaces would be at the sub-nanometer scale.
Fig. 3.

Cryo-SEM micrographs (A-C) showing cross-section tilted view (3° tilt relative to the hydrogel surface) of PEG700-DA hydrogel and SEM micrographs (D-F) showing cross-section tilted view (3° tilt relative to the glass surface) of PEG2000-silane passivated glass surfaces. In both cases the gold nanoparticles with interparticle spacings of ~60 nm and of 8 nm diameter are clearly observable. The hydrogel surface exhibits a rough morphology in comparison to the very smooth glass surface.
Slightly different expositions of the gold nanoparticles on passivated glass and PEG hydrogels were identified. On glass surfaces AFM and cross-section TEM measurements revealed that the gold nanoparticles were exposed on the surface with an average height of 5–6 nm. This can also be confirmed qualitatively by cross-section SEM micrographs (Figure 3 D–F). In contrast to the glass substrates, quantification of the exposure of the gold nanoparticles on the PEG hydrogel surfaces by means of AFM at low forces in order not to destroy the PEG layer was not possible. Graeter et al.48 showed that high-force contact mode is required in order to visualize gold nanoparticles on the PEG700-DA hydrogel. TEM cross-section measurements were not successful, mainly because of the difficult sample preparation method (see experimental section). However, qualitative data regarding the gold nanoparticle exposure on hydrogel surfaces could be provided by cross section, high-resolution cryo-SEM micrographs (Figure 3 C). It revealed that the particles are partially (~ 60 to 70 %) immersed in the hydrogel. This finding was not unexpected as the nanostructured hydrogels were prepared by casting the liquid hydrogel precursor over the nanostructured glass surface leading to a partial enclosure of the gold nanoparticles.
The gold nanoparticles on both surfaces serve as anchor points for protein or peptide immobilization. Therefore, it was important to determine if the nanoparticles on both surfaces are equally accessible to bio-active molecules. Previous studies showed that the PEG2000-silane monolayer on the glass surfaces has a height of ~2 nm in a dried state and up to 5 nm in a hydrated state.15 Therefore, in a hydrated state the gold nanoparticles (of 8 nm in diameter) on the thermally tempered passivated glass surfaces are protruding slightly above (~1 to 2 nm) the surrounding PEG layer. In such conditions, the spherical cap surface area of the nanoparticle, which can be occupied by molecules, ranges between 25 and 50 nm2.49, 50 On the hydrogel surfaces, a similar or even slightly larger occupied surface area is obtained. Figure 4 shows the schematic illustration of gold nanoparticle exposition, surface texture and theoretical cRGD occupation of the PEG hydrogel in comparison to the PEG-passivated glass surface.
Fig. 4.

Schematic illustration of gold nanoparticle exposition, surface texture and cRGD occupation of the PEG hydrogel (left) in comparison to the PEG-passivated glass surface (right). In each scheme the chemical formula of the PEG is depicted.
Mechanical Properties
To derive accurately the Young’s modulus of the PEG700-DA hydrogels, force distance curves were recorded from different points on the hydrogels surfaces and fitted to the modified Hertz model.41, 42, 51 Figure 5 shows representative force distance curves derived during indentation measurements on bare and passivated glass as well as on PEG700-DA hydrogel substrates. When the tip strikes the hard, bare glass substrate surface (blue, right curve) the recorded signal originates from the linear (Hook) cantilever deformation and no indentation is measurable. However, on the PEG-passivated glass surfaces some deformation of the surface by the tip was detected at distances of less than 15 nm (purple and green, middle curves), which results in the deviation from the linear relationship between the force and the distance. This deviation can be attributed to the PEG passivation layer but cannot be fitted to the Hertz model since the total thickness of this layer is too small, in the range of a few nanometres. Representative load-displacement responses obtained upon indenting nanostructured PEG700-DA hydrogels with different rates of tip approach are presented by the two left, black and red curves. The substrate indentation (deformation) by the tip of up to 60 nm was obtained during measurements and can be calculated by the difference between the deflections of the cantilever detected on the bare glass substrate and on the hydrogel.
Fig. 5.

Force distance curves derived during indentation measurements on bare (blue, right) and passivated glass (purple and green, midle) as well as on PEG700-DA hydrogel substrates (red and black left). All substrates were immersed in PBS solution at ambient conditions and measured with different rates of tip approach. The insert shows Young’s modulus dependence on indentation depth measured with different rates of tip approach on PEG700-DA hydrogels. Error bars in substrate elasticity refer to mean + s.e.m., n=50.
To assess the mechanical response of the hydrogel surface to over two orders of magnitude different rates of tip approach (ranged between 0.01 and 2 μm/sec), the force distance curves were recorder from the same point on the hydrogel surface (see Figure S5 in supplementary information). Based on the measurements, the different rates of tip approach do not affect the mechanical response of the hydrogel surface. This behavior can be attributed mainly to the elastic nature of the PEG700-DA hydrogel.34 It should be noted that the low values of tip approach rates as tested in this study are match the rates at which the cells typically generate and release traction forces on the elastic substrates.52, 53
As mentioned in the experimental section, the force distance curves were fitted to the modified Hertz model which is based on several assumptions, namely: (i) the material under investigation is linearly elastic in nature, and (ii) the material is isotropic and homogeneous.43 However, artificial hydrogels are neither absolutely homogeneous nor linearly elastic. The deviation from the linearly elastic behavior and homogeneous properties of the hydrogel surface is presented in Figure 5 (the inset Figure). Here, the variation of the Young’s modulus values with the indentation depth is shown. The increase of the Young’s modulus with the indentation depth before reaching stable Young’s modulus values of ~1.24 MPa can be attributed mainly to the inhomogeneity of the hydrogel surface layer.
To explain the variation of the Young’s modulus with the indentation depth, as observed in this research, AFM data was correlated to the theoretical calculation of the elastic modulus as expressed through rubber elasticity theory.54–56 In the rubber elasticity theory the elastic modulus (E) of a swollen cross-linked network is expressed via:
where R is the gas constant, T is the temperature, φ is the volume fraction of the polymer and Ne is the number of moles of elastically effective network chains (i.e., cross-link chains) in volume V. The theory is based on the assumption that every network chain ends in a cross-link, and no loops or trapped entanglements exist. However, formation of network chains by free radical polymerization takes place in short periods of time compared to the long relaxation time of network chains. For this reason free radical polymerization reactions may result in inhomogeneous cross-link density as well as other non-ideal effects.54 It has been reported that due to the high concentration of dangling chain ends on the hydrogel surface layer, the effective cross-link density was lower in comparison to the bulk.56, 57 Moreover, the micro- and nanoscale roughness of the hydrogel surface can lead to the variation of the polymer volume fraction that the indenter is actually pressing, and therefore may contribute also to the increase of the Young’s modulus values with indentation depth.
Gold nanoparticles as solid inclusions may potentially affect the hydrogel Young’s modulus. Therefore, to assess their contribution to the hydrogel mechanical properties, bare (i.e., with no gold nanoparticles) and nanostructured PEG700-Da hydrogels were investigated (see Figure S6 in supplementary information). Based on the measurements, the Young’s modulus values obtained on the bare hydrogel surfaces are not significantly different from the values obtained on gold nanostructured surfaces. This observation aligns well with the previously reported results which showed that the nanoparticles as solid inclusions (10 %wt) have no profound effects on the mechanical properties of hydrogel with high densely crosslinked network (PEG3400-DA).58
It was previously described for various cell types that material stiffness influences cell adhesion, stem cell proliferation, differentiation or self-renewal.6, 32, 59–61 Therefore, the questions to be considered are, what is the “real” stiffness of the PEG700-DA hydrogel and to what degree, if any, the variation of the Young modulus from 70 KPa to 1.25 MPa can govern cell-fate properties? Previous works showed that anchorage-dependent cells can indent elastic surfaces up to 500 nm during their spreading,62–64 which is above the indentation depth required to get stable Young modulus values. In other research Buxboim et al.62 showed that cells can sense and respond to underlying (up to 20 μm), “hidden” rigid objects that are not in direct cellular contact. Based on these observations, one can claim that the “real” stiffness of PEG700-DA hydrogels should be considered as 1.25 MPa and compared to 64 GPa65 of the passivated glass surface. However, mechanosensing is a dynamic process, in which cells within the ECM constantly probe the mechanical properties of their surroundings through a push-pull mechanism. Cells apply forces in all dimensions as they probe and respond to the 3D structure of their environment. Traction-force microscopy showed that the vertical push forces applied by the cells in the region underneath the cell nucleus are of the same order of magnitude as horizontal pull forces towards the cell center at the cell-substrate edges.64 This force sensing pattern can be affected by the variation of the Young modulus in a biologically relevant stiffness range, especially during the first stages of cell-surface interaction when the cells sense only the surface layer of the substrate. The biologically relevant stiffness range was described up to 100 KPa.66 Since the mechanical properties of PEG700-DA hydrogels at the surface are in this range, they might be able to affect cell behavior such as cell shape adhesion, migration, proliferation and differentiation. These properties could be even more pronounced in the experiments with non-anchorage-dependent cells, such as hematopoietic cells, which apply fewer forces to a substrate.
Effect on KG-1a and REF52 Cells Adhesion
In the following, we studied the adhesion of KG-1a cells on the different substrates. KG-1a cells are known to be sensitive towards ligand type and spacing as well as the mechanical properties of their environment.37, 60, 61, 67 Nanostructured PEG700-DA hydrogels and passivated glass substrates were functionalized with c(RGDfK)-PEG6-cysteine. We could show previously that KG-1a cells bind to the cRGD-motif of the extracellular matrix protein fibronectin via integrins.37 Upon adhesion to nanostructured cRGD-functionalized surfaces, KG-1a cells were observed by SEM to have a roundish morphology that is typical for non-anchorage dependent cells (Figure 6 A, D). The cells were in contact with the substrate surfaces via filopodia. The cell morphology was comparable on nanostructured glass and hydrogels substrates. No major differences could be observed (Figure 6 B, E). Furthermore, at higher magnifications the SEM images of both substrate sets taken after the cell adhesion experiments revealed well-preserved gold nanoparticle arrays (Figure 6 C, F). This indicates that the particles were not released or moved by the cells during the experiment.
Fig.6.

(A-C) Critical point dried SEM micrographs with different magnifications of a KG-1a cell after a cell adhesion experiment on cRGD functionalized hydrogel with 36 ± 7 nm interparticle spacing and (D-F) SEM micrographs with different magnifications of a KG-1a cell after adhesion to a cRGD functionalized passivated glass surface with 30 ± 6 nm interparticle spacing.
In Figure 7 KG–1a cell adhesion to the different substrate sets at varying ligand spacings is compared. The number of adherent cells is plotted for hydrogel and passivated glass surfaces at four different categories of ligand lateral spacings. At small distances of 22 nm robust cell adhesion could be observed for both types of substrates. At intermediate interparticle distances of 36 nm cells behaved significantly different on glass substrates and hydrogels. While on hydrogels 82 % of the cells adhered (compared to cell numbers found on 22 nm substrates), only 5 % adherent cells were found on the passivated glass surfaces. At large spacings (mean above 40 nm; in particular 45 and 66 nm) no or only minor cell adhesion could be detected on both substrat sets. However, it is still evident that the cells prefer hydrogel surfaces espessialy on 45 nm spaced nanopatterned surfaces.The phase contrast images of the cells on both substrate sets can be observed in the Figure S7 in the supplementary information.
Fig. 7.

Quantification (adherent cells per microscopic field) of KG-1a cell adhesion on nanostructured and cRGD functionalized hydrogel and glass surfaces. Numbers of adherent cells per microscopic view field are plotted for 4 different nanopatterned surface categories. For quantification only completely nanostructured microscopic view fields were used. Data is presented as mean ± s.e.m., n=5, *P<0.05, **P<0.01. Statistical significance was determined by Wilcoxon rank sum test.
It is known that the ligand spacing has a substantial impact on the adhesiveness of cultured cells.13, 15, 18, 37 There is a maximum distance on the nanometer range that cells can tolerate in order to successfully adhere. This critical maximum distance depends on the cell type since it differs for anchorage-dependent and non-anchorage-dependent cells.37 The distance-dependency on the nanometer range is assumed to result from the composition and geometric arrangement of protein complexes that form the adhesive sites of the cell.1
Fibroblast (REF52) cells were investigated in this study to assess the impact of the different surface properties of the two substrate sets on the anchorage-dependent cell adhesion behavior. For these experiments, the nanostructured hydrogels and passivated glasses were functionalized with c(RGDfK)-Ahx-thiol. The change in the spacer and in the linker was due to the adjustment of the current experimental conditions to those used in the previous publications that described the adhesion behavior of the same cell line.18, 68
Figure 8 presents the comparison of the REF52 cell adhesion behavior after 4 h of incubation on the different substrate sets and varying ligand spacings, namely 62, 110 and 162 nm. It is evident that REF52 cells spread very well on both hydrogel and glass surfaces with the 62 nm patterns, showing their typical morphology and focal adhesion distribution which are mainly restricted to the periphery of the cells (Figure 9). On the other hand, cells cultured on the passivated glasses and hydrogels substrates with 110 nm spaced ligands displayed different spreading behavior. Limited cell spreading was observed on the glass surfaces. This observation aligns well with the previously reported results which showed that cells cultured on passivated glass surfaces with 108 nm spaced ligands undergo repeated extension-retraction cycles, leading to up to 80% reduction in the projected cell area.18 In comparisson to the glass surfaces, cells cultured on the hydrogels with the same 110 nm patternes spread very well, showing similar morphology and focal adhesion distribution as on 62 nm pattern (Figure 9). At 162 nm patterns limited cell spreading was observed on both substrate sets.
Fig. 8.

Quantification of REF52 cell spreading (projected cell area) after 4 h culture on nanostructured and cRGD functionalized hydrogel and glass surfaces. Data is presented as mean ± s.e.m., n>100.
Fig. 9.

Phase-contrast images of fibroblasts (REF52) observed at 4 h after plating on nanostructured and cRGD functionalized PEG-passivated glass (left column) and PEG700-DA hydrogel (right column) surfaces. Scale bars: 100 μm. The inserts show immunofluorescence micrographs of REF52 cells stained for actin (green), paxillin (red) and nuclei (blue) after 4 h culture on both substrate sets. Scale bars: 30 μm.
Immunofluorescence microscopy was used to examine if the recruitment of integrin-associated molecules is dependent on the lateral spacings between the integrin ligands. Therefore, localization of two proteins, namely paxillin and zyxin which involved in the formation of focal adhesions was identified (see Figure S8 in supplementary information). Colocalization of paxillin and zyxin was observed in the REF52 cells on hydrogels and glass supports pattnered with 62 nm and 110 nm spaced ligands hydrogels. However, the prominence of zyxin in focal adhesions formed on the 62 nm pattern glass surfaces was lower (~50%) than that measured on hydrogels.
Although the two sets of nanostructured materials compared here (hydrogels and glass substrates) were identical in terms of ligand type, nanoparticle spacing and geometry, their abilities to promote KG-1a and REF52 cell adhesion differed. On the hydrogel substrates, cells could tolerate higher ligand spacings (that means lower ligand density) than on the passivated glass surfaces. Assuming homogeneously distributed cRGD ligands on the gold nanoparticles for both kinds of substrates,69 this finding indicates that the cells interpret the impact of the above described physical substrate properties as changes in adhesion-ligand presentation. Therefore, we could verify our initial hypothesis that at constant ligand type and spacing the observed cell behavior is influenced by the physical surface properties of PEG hydrogels and PEG-passivated glasses. The stiffness of the hydrogel as measured by the AFM already reveals that stiffness varies as function of indentation depth between 70 KPa and 1.25 MPa. The AFM measurements are not sensitive to stiffness which appears in the very top layer of the substrate, i.e. cones, “mounds” of the hydrogel, but averaging over a large surface area. Therefore, the actual stiffness the cell senses by attaching to a rough nanopattern hydrogel surfaces might even be less. This, in turn can lead towards deformation of the pattern by the cell towards smaller spacings as was similarly observed by Huebsch et al.70 Therefore, the combination of a hydrogel with roughness presents a less rigid ligand template to the cell surface as it is the case on nanopattern PEG-passivated glass.
Summary and Conclusion
This article describes the physical differences between two sets of surfaces (PEG-DA hydrogels and PEG-passivated glass surfaces) with highly similar density and exposition of presented cell ligands. The surface texture of both surfaces was examined in detail using information obtained by AFM, SEM and cryo-SEM measurements. These measurements showed that PEG700-DA hydrogel surfaces exhibit roughness at the micro- as well as nanoscale level in comparison to ultrasmooth PEG-passivated glass surfaces. This roughness could be attributed mainly to the mounds with different size-shape structures ranging from 20 to 400 nm in diameter and separated from each other by shallow grooves (~ 15 nm depth). AFM indentation measurements were performed to quantify the mechanical properties of PEG700-DA hydrogels (i.e., the Young’s modulus EY). These measurements revealed an increase of the Young’s modulus between 70 KPa and 1.25 MPa with the indentation depth. In comparison to completely rigid PEG-passivated glass surfaces (64 GPa), the mechanical surface properties of PEG700-DA hydrogels are in a biologically relevant stiffness range and, therefore, they might be able to affect cell behavior such as cell shape, adhesion, migration, proliferation and differentiation. The hypothesis that the different surface properties of the two substrate sets impact cell behavior was verified by demonstrating the different adhesive behavior of non-anchorage-dependent KG-1a and anchorage-dependent REF52 cells on nanostructured hydrogel and passivated glass surfaces.
In conclusion, the data presented here show that the physical surface properties of biomaterials can be correlated to cell behavior, underlining the significance of these parameters for applications in the fields of biomedicine and biomaterials. Future studies will try to elucidate the puzzle of different physical cell-material interactions.
Supplementary Material
Acknowledgements
This study was supported by contract research ‘Biomaterialien / Biokompatibilität’ of the Baden-Württemberg Stiftung (P-LS-Biomat/22). I. P. gratefully acknowledges the support of the Alexander von Humboldt Foundation and C. L.-T. by the Brigitte Schlieben-Lange Programme. Part of the research leading to these results has received funding from the European Union Seventh Framework Programme (FP7/2007-2013) under grant agreement n° NMP4-LA-2009-229289 NanoII and n° NMP3-SL-2009-229294 NanoCARD. This work was funded by the National Institutes of Health (USA) through the Roadmap for Medical Research (PN2 EY016586). The authors are indebted to Elisabeth Pfeilmeier for detailed revision of the manuscript and to Dr. Ferdinand Belz for critical review of the manuscript. We also thank Peter Kopold for obtaining the TEM images.
Footnotes
Electronic Supplementary Information (ESI) available: TEM cross-section micrographs of Au/glass conformation, SEM micrographs of the cantilever used for indentation measurements, molecular structures of the c(RGDfK), AFM 2D micrographs of PEG700-DA hydrogel and PEG-passivated glass surfaces, force distance curves derived during indentation measurements on nanostructured PEG700-DA hydrogel substrate, force distance curves derived during indentation measurements on bare nanostructured PEG700-DA hydrogel substrates. Phase-contrast images of KG1a cell on nanostructured PEG-passivated glass and PEG700-DA hydrogel surfaces, Immunofluorescence micrographs of REF52 on nanostructured PEG-passivated glass and PEG700-DA hydrogel) surfaces. See DOI: 10.1039/b000000x/
Notes and References
- 1.Geiger B, Spatz JP and Bershadsky AD, Nature Reviews Molecular Cell Biology, 2009, 10, 21–33. [DOI] [PubMed] [Google Scholar]
- 2.Hynes RO, Cell, 2002, 110, 673–687. [DOI] [PubMed] [Google Scholar]
- 3.Potocnik AJ, Brakebusch C and Fassler R, Immunity, 2000, 12, 653–663. [DOI] [PubMed] [Google Scholar]
- 4.Hersel U, Dahmen C and Kessler H, Biomaterials, 2003, 24, 4385–4415. [DOI] [PubMed] [Google Scholar]
- 5.Schulte VA, Diez M, Hu Y, Moller M and Lensen MC, Biomacromolecules, 2010, 11, 3375–3383. [DOI] [PubMed] [Google Scholar]
- 6.Wells RG, Hepatology, 2008, 47, 1394–1400. [DOI] [PubMed] [Google Scholar]
- 7.Lenhert S, Sun P, Wang YH, Fuchs H and Mirkin CA, Small, 2007, 3, 71–75. [DOI] [PubMed] [Google Scholar]
- 8.Shen KY, Tsai J, Shi P and Kam LC, J. Am. Chem. Soc, 2009, 131, 13204–13205. [DOI] [PMC free article] [PubMed] [Google Scholar]
- 9.Frith JE, Mills RJ and Cooper-White JJ, J Cell Sci, 2012. [DOI] [PubMed] [Google Scholar]
- 10.George PA, Doran MR, Croll TI, Munro TP and Cooper-White JJ, Biomaterials, 2009, 30, 4732–4737. [DOI] [PubMed] [Google Scholar]
- 11.Glass R, Arnold M, Blummel J, Kuller A, Moller M and Spatz JP, Advanced Functional Materials, 2003, 13, 569–575. [Google Scholar]
- 12.Spatz JP, Angew. Chem.-Int. Edit, 2002, 41, 3359–3362. [DOI] [PubMed] [Google Scholar]
- 13.Arnold M, Cavalcanti-Adam EA, Glass R, Blummel J, Eck W, Kantlehner M, Kessler H and Spatz JP, Chemphyschem, 2004, 5, 383–388. [DOI] [PubMed] [Google Scholar]
- 14.Selhuber C, Blummel J, Czerwinski F and Spatz JP, Nano Letters, 2006, 6, 267–270. [DOI] [PubMed] [Google Scholar]
- 15.Cavalcanti-Adam EA, Aydin D, Hirschfeld-Warneken VC and Spatz JP, HFSP Journal, 2008, 2, 276–285. [DOI] [PMC free article] [PubMed] [Google Scholar]
- 16.Aydin D, Hirschfeld-Warneken VC, Louban I and Spatz JP, Int. J. Mater. Res, 2011, 102, 796–808. [Google Scholar]
- 17.Arnold M, Schwieder M, Blummel J, Cavalcanti-Adam EA, Lopez-Garcia M, Kessler H, Geiger B and Spatz JP, Soft Matter, 2009, 5, 72–77. [DOI] [PMC free article] [PubMed] [Google Scholar]
- 18.Cavalcanti-Adam EA, Volberg T, Micoulet A, Kessler H, Geiger B and Spatz JP, Biophys J, 2007, 92, 2964–2974. [DOI] [PMC free article] [PubMed] [Google Scholar]
- 19.Blummel J, Perschmann N, Aydin D, Drinjakovic J, Surrey T, Lopez-Garcia M, Kessler H and Spatz JP, Biomaterials, 2007, 28, 4739–4747. [DOI] [PubMed] [Google Scholar]
- 20.Cauda V, Argyo C and Bein T, J. Mater. Chem, 2010, 20, 8693–8699. [Google Scholar]
- 21.Dyer MA, Ainslie KM and Pishko MV, Langmuir, 2007, 23, 7018–7023. [DOI] [PubMed] [Google Scholar]
- 22.Harder P, Grunze M, Dahint R and Laibinis PE, J. Phys. Chem. B, 1998, 102, 426–436. [Google Scholar]
- 23.Smith KE, Hyzy SL, Sunwoo M, Gall KA, Schwartz Z and Boyan BD, Biomaterials, 2010, 31, 6131–6141. [DOI] [PMC free article] [PubMed] [Google Scholar]
- 24.Vogel V, in Annual Review of Biophysics and Biomolecular Structure, Annual Reviews, Palo Alto, 2006, vol. 35, pp. 459–488. [DOI] [PubMed] [Google Scholar]
- 25.Vogel V and Sheetz M, Nat. Rev. Mol. Cell Biol, 2006, 7, 265–275. [DOI] [PubMed] [Google Scholar]
- 26.Deiters JA and Holmes RR, J. Am. Chem. Soc, 1987, 109, 1686–1692. [Google Scholar]
- 27.Kryuk TV, Mikhalchuk VM, Petrenko LV, Nelepova OA and Nikolaevskii AN, Pharmaceutical Chemistry Journal, 2002, 36, 32–35. [Google Scholar]
- 28.Branch DW, Wheeler BC, Brewer GJ and Leckband DE, Biomaterials, 2001, 22, 1035–1047. [DOI] [PubMed] [Google Scholar]
- 29.Lan S, Veiseh M and Zhang MQ, Biosens. Bioelectron, 2005, 20, 1697–1708. [DOI] [PubMed] [Google Scholar]
- 30.Tessmar JK and Gopferich AM, Macromol. Biosci, 2007, 7, 23–39. [DOI] [PubMed] [Google Scholar]
- 31.Aydin D, Louban I, Perschmann N, Blummel J, Lohmuller T, Cavalcanti-Adam EA, Haas TL, Walczak H, Kessler H, Fiammengo R and Spatz JP, Langmuir, 2010, 26, 15472–15480. [DOI] [PubMed] [Google Scholar]
- 32.Engler AJ, Sen S, Sweeney HL and Discher DE, Cell, 2006, 126, 677–689. [DOI] [PubMed] [Google Scholar]
- 33.Nemir S, Hayenga HN and West JL, Biotechnol. Bioeng, 2010, 105, 636–644. [DOI] [PubMed] [Google Scholar]
- 34.Peyton SR, Raub CB, Keschrumrus VPand Putnam AJ, Biomaterials, 2006, 27, 4881–4893. [DOI] [PubMed] [Google Scholar]
- 35.Pankov R and Yamada KM, J. Cell Sci, 2002, 115, 3861–3863. [DOI] [PubMed] [Google Scholar]
- 36.Lohmuller T, Aydin D, Schwieder M, Morhard C, Louban I, Pacholski C and Spatz JP, Biointerphases, 2011, 6, MR1–12. [DOI] [PubMed] [Google Scholar]
- 37.Altrock E, Muth CA, Klein G, Spatz JP and Lee-Thedieck C, Biomaterials, 2012, 33, 3107–3118 [DOI] [PubMed] [Google Scholar]
- 38.Hertz H, Journal fuer die reine und angewandte Mathematik, 1881, 92, 156–171. [Google Scholar]
- 39.Hertz H, J. Reine Angewandte Math (English translation in Miscellaneous Papers by Hertz H (ed.) Jones and Schott, London, Macmillan, 1896) 1882, 94, 156–171. [Google Scholar]
- 40.Sneddon IN, Int. J. Eng. Sci, 1965, 3, 47–57. [Google Scholar]
- 41.Vinckier A and Semenza G, FEBS Lett, 1998, 430, 12–16. [DOI] [PubMed] [Google Scholar]
- 42.Weisenhorn AL, Khorsandi M, Kasas S, Gotzos V and Butt HJ, Nanotechnology, 1993, 4, 106–113. [Google Scholar]
- 43.Dintwa E, Tijskens E and Ramon H, Granular Matter, 2008, 10, 209–221. [Google Scholar]
- 44.Field JS and Swain MV, J. Mater. Res, 1993, 8, 297–306. [Google Scholar]
- 45.Behrend OP, Oulevey F, Gourdon D, Dupas E, Kulik AJ, Gremaud G and Burnham NA, Appl. Phys, 1998, A66, S219–S221. [Google Scholar]
- 46.Hansma PK, Cleveland JP, Radmacher M, Walters DA, Hillner PE, Bezanilla M, Fritz M, Vie D, Hansma HG, Prater CB, Massie J, Fukunaga L, Gurley J and Elings V, Appl. Phys. Lett, 1994, 64, 1738–1740. [Google Scholar]
- 47.Platzman I, Saguy C, Brener R, Tannenbaum R and Haick H, Langmuir, 2010, 26, 191–201. [DOI] [PubMed] [Google Scholar]
- 48.Graeter SV, Huang J, Perschmann N, Lopez-Garcia M, Kessler H, Ding J and Spatz JP, Nano Letters, 2007, 7, 1413–1418. [DOI] [PubMed] [Google Scholar]
- 49.Connolly ML, J. Am. Chem. Soc, 1985, 107, 1118–1124. [Google Scholar]
- 50.Li S, Asian Journal of Mathematics & Statistics, 2011, 4, 66–70. [Google Scholar]
- 51.Kranenburg JM, Tweedie CA, van Vliet KJ and Schubert US, Adv. Mater, 2009, 21, 3551–3561. [Google Scholar]
- 52.Cameron AR, Frith JE and Cooper-White JJ, Biomaterials, 2011, 32, 5979–5993. [DOI] [PubMed] [Google Scholar]
- 53.du Roure O, Saez A, Buguin A, Austin RH, Chavrier P, Siberzan P and Ladoux B, Proceedings of the National Academy of Sciences of the United States of America, 2005, 102, 14122–14122. [DOI] [PMC free article] [PubMed] [Google Scholar]
- 54.Flores-Merino MV, Chirasatitsin S, LoPresti C, Reilly GC, Battaglia G and Engler AJ, Soft Matter, 2010, 6, 4466–4470. [DOI] [PMC free article] [PubMed] [Google Scholar]
- 55.Flory PJ, Principles of Polymer Chemistry, Press: Ithaca, NY, 1953. [Google Scholar]
- 56.Harmon ME, Kucking D and Frank CW, Langmuir, 2003, 19, 10660–10665. [Google Scholar]
- 57.Varga I, Gilanyi T, Meszaros R, Filipcsei G and Zrinyi M, J. Phys. Chem. B, 2001, 105, 9071–9076. [Google Scholar]
- 58.Chang C-W, Spreeuwel A, Zhang C and Varghese S, Soft Matter, 2010, 6, 5157–5164. [Google Scholar]
- 59.Gilbert PM, Havenstrite KL, Magnusson KE, Sacco A, Leonardi NA, Kraft P, Nguyen NK, Thrun S, Lutolf MP and Blau HM, Science, 2010, 329, 1078–1081. [DOI] [PMC free article] [PubMed] [Google Scholar]
- 60.Holst J, Watson S, Lord MS, Eamegdool SS, Bax DV, Nivison-Smith LB, Kondyurin A, Ma L, Oberhauser AF, Weiss AS and Rasko JE, Nat Biotechnol, 2010, 28, 1123–1128. [DOI] [PubMed] [Google Scholar]
- 61.Lee-Thedieck C, Rauch N, Fiammengo R, Klein G and Spatz JP, Journal of Cell Science, 2012, doi: 10.1242/jcs.095596. [DOI] [PubMed] [Google Scholar]
- 62.Buxboim A, Rajagopal K, Brown AEX and Discher DE, J. Phys.-Condes. Matter, 2010, 22. [DOI] [PMC free article] [PubMed] [Google Scholar]
- 63.Delanoe-Ayari H, Rieu JP and Sano M, Phys. Rev. Lett, 2010, 105. [DOI] [PubMed] [Google Scholar]
- 64.Hersen P and Ladoux B, Nature 2011, 470, 340–341. [DOI] [PubMed] [Google Scholar]
- 65. www.duran-group.com/de/ueber-duran-eigenschaften.html.
- 66.Discher DE, Janmey P and Wang Y, Science, 2005, 310, 1139–1143. [DOI] [PubMed] [Google Scholar]
- 67.Turner ML, Masek LC, Hardy CL, Parker AC and Sweetenham JW, Br. J. Haematol, 1998, 100, 112–122. [DOI] [PubMed] [Google Scholar]
- 68.Cavalcanti-Adam EA, Micoulet A, Blummel J, Auernheimer J, Kessler H and Spatz JP, Eur J Cell Biol, 2006, 85, 219–224. [DOI] [PubMed] [Google Scholar]
- 69.Chai J, Wong LS, Giam L and Mirkin CA, Proceedings of the National Academy of Sciences of the United States of America, 2011, 108, 19521–19525. [DOI] [PMC free article] [PubMed] [Google Scholar]
- 70.Huebsch N, Arany PR, Mao AS, Shvartsman D, Ali OA, Bencherif SA, Rivera-Feliciano J and Mooney DJ, Nat. Mater, 2010, 9, 518–526. [DOI] [PMC free article] [PubMed] [Google Scholar]
Associated Data
This section collects any data citations, data availability statements, or supplementary materials included in this article.