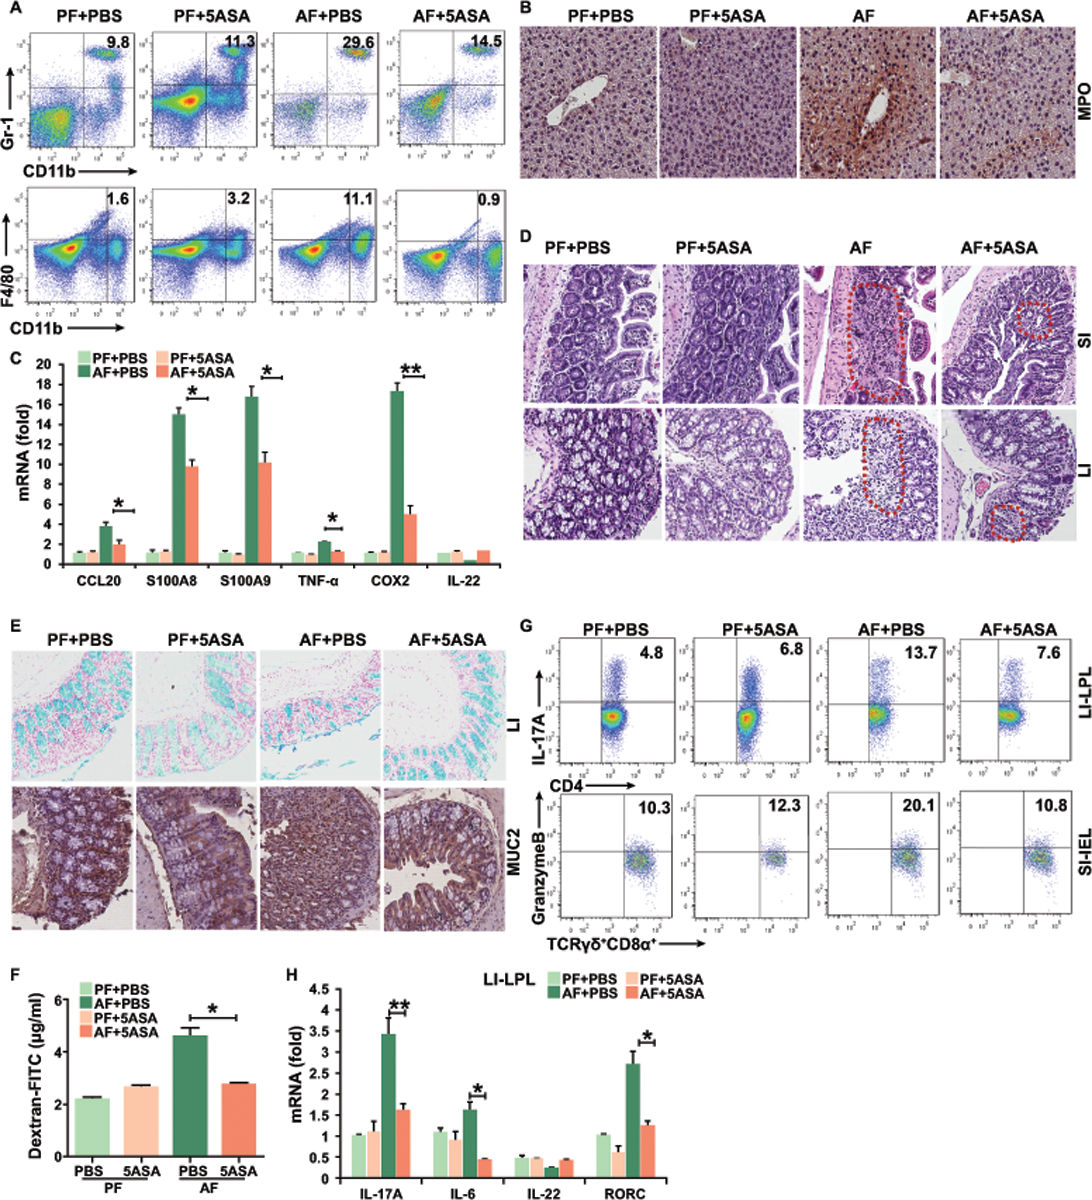
Figure 3. 5-ASA improves liver and gut inflammation in mice during alcohol feeding.

(A) Frequencies of immature myeloid cells (CD11b+Gr-1+) and macrophages (CD11b+F4/80+) in the liver.
(B) Immunohistochemistry staining of myeloperoxidase (MPO) in the liver.
(C) Real-time PCR analysis of the expression of indicated genes in the liver.
(D) H&E staining of small and large intestine.
(E) Alcian Blue staining and immunohistochemistry staining of mucin 2 of colonic tissue.
(F) Plasma levels of Dextran-FITC for gut permeability.
(G) Intracellular staining of IL-17A+ CD4+ T cells in LPL of colon or granzyme B+ γδ+ T cells in IEL of small intestine.
(H) Real-time PCR analysis of the expression of indicated genes in the colonic LPL.
Data in all panels are presented as Mean ± SEM. n>15 * P<0.05; ** P<0.01
