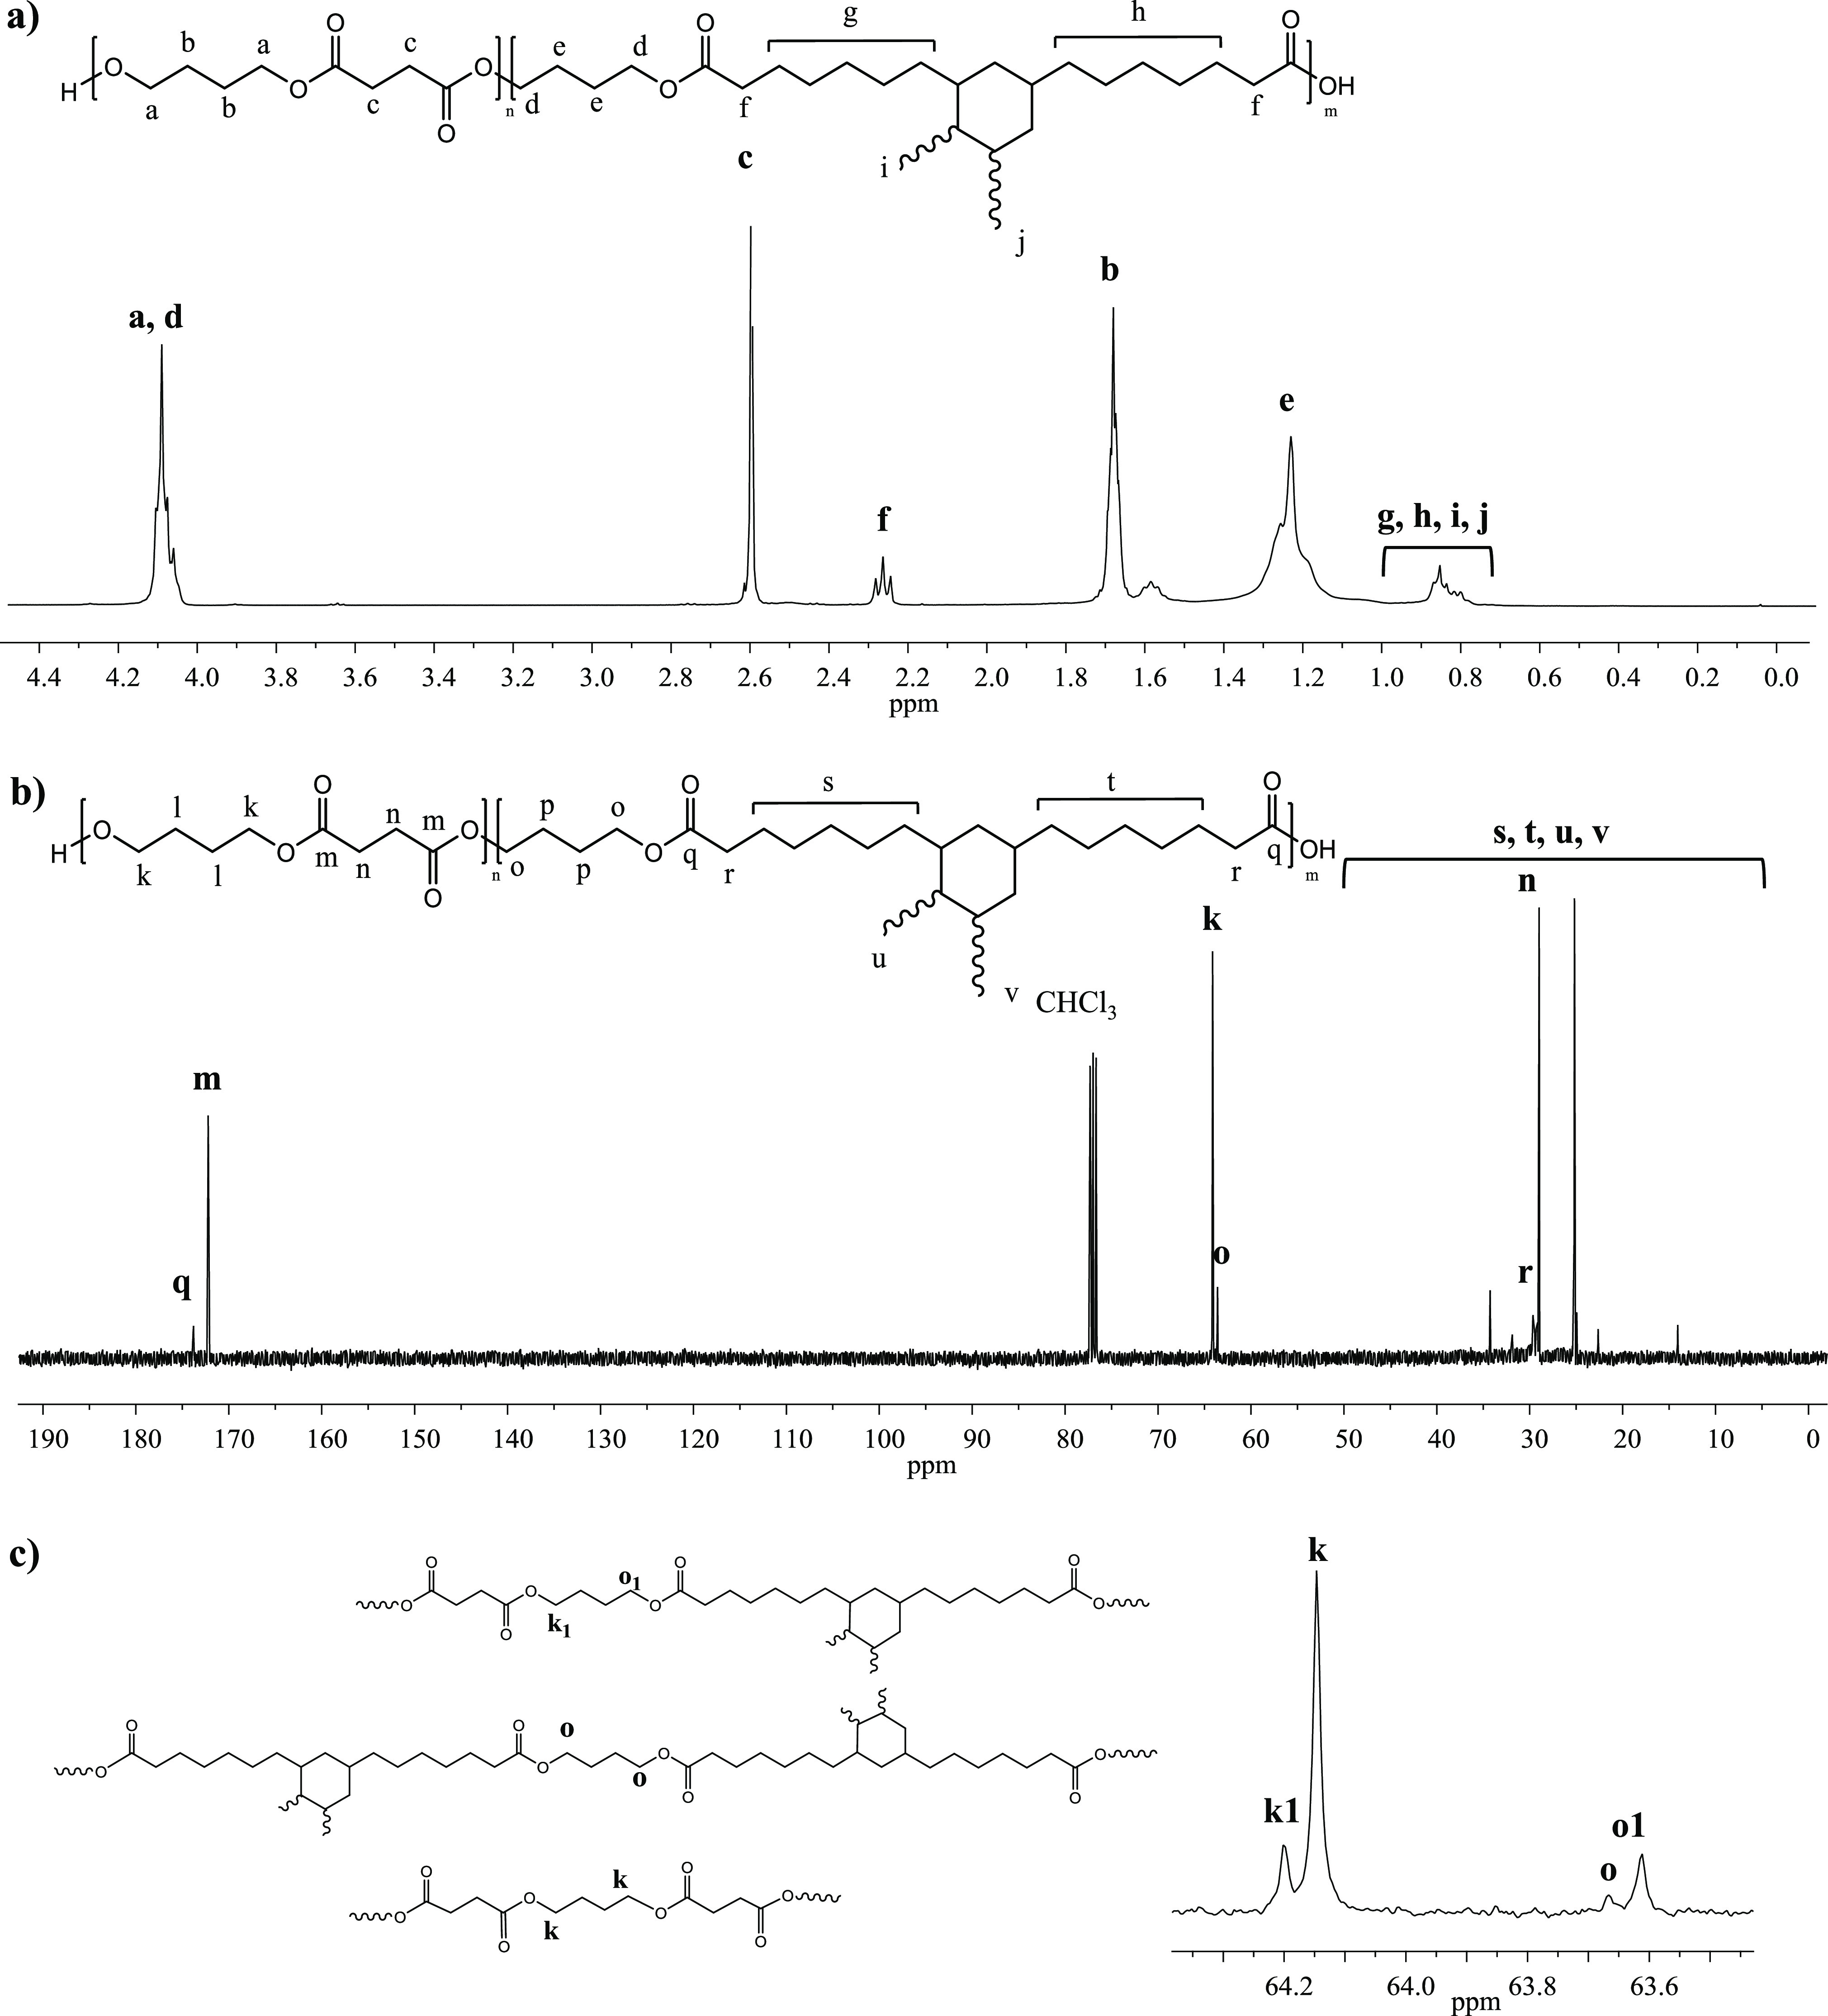
Figure 3.

1H-NMR (a) and 13C-NMR (b) spectra of P(BS85BPripol15) with the peak assignment. Magnification of the 13C-NMR spectrum in the 64.4–63.5 ppm region (c) and schematic representation of S–B–Pripol, Pripol–B–Pripol, and S–B–S triads.

1H-NMR (a) and 13C-NMR (b) spectra of P(BS85BPripol15) with the peak assignment. Magnification of the 13C-NMR spectrum in the 64.4–63.5 ppm region (c) and schematic representation of S–B–Pripol, Pripol–B–Pripol, and S–B–S triads.