Abstract
Several attempts have been made to measure the segmental range of motion in the lumbar spine during flexion-extension with the purpose of gathering additional data for the diagnosis of instability. The previous studies were performed in vitro or in vivo during active motion. The aim of this study was to obtain normal values of passively performed segmental motions. Forty-one healthy adults were examined by means of functional radiographs during flexion-extension and lateral bending. A graphic construction method and a computer-assisted method were used to measure rotations. Comparing with recent in vivo studies, the values obtained for normal angles of rotation were predominately larger. This might be due to the passive examination used in the study. The graphic construction method and computer-assisted method techniques are equally reliable, but the computer-assisted method method yields other important kinematic data, such as translations. It is proposed that passive motion be applied during functional examination of patients with suspected instabilities. However, the large variation of rotational values between individuals in the normal population may limit the clinical usefulness of functional lumbar analysis using this parameter. Future studies should explore the clinical relevance of determining altered segmental mobility in low-back pain patients.
Keywords: lumbar spine, kinematics, functional evaluation, roentgenographs, instability
Since the first rigorous in vitro studies of motion of the lumbar spine by Rolander24 and Yamamoto et al,29 there have been several attempts to quantify the in vivo motion of the lumbar spine radiographically. To measure the degree of rotation, a kind of graphic construction was used by Allbrook,1 Begg and Falconer,2 Penning,22 Penning et al,23 and Hanley et al.10 Froning and Frohman8 used the graphic technique to measure patients and normals in passive motion. Dimnet et al5,6 used a computer formulation to compare complex statistical biomechanical motion parameters among normals and patients. Pearcy et al19–21 used another computer routine to measure sagittal plane and three-dimensional motions in a small group of normals. Hayes et al11 used a graphic method described by DuPuis et al7 to measure the motion of a group of normals in active flexion-extension. In general, the computer techniques are more time consuming than the graphic methods. However, besides the usual rotatory motions, they offer an exact way to calculate other more sophisticated kinematic parameters, such as translations and centers of rotation. The center of rotation is a concise method of quantifying the kinematics of a plane joint motion but is prone to significant errors.14,17 Both these parameters have been suggested as possible indicators of spinal instability.9,12,13,28
The study by Dvorak et al4 of functional radiographic diagnosis of the cervical spine has shown that there is a significant difference between actively and passively performed flexion-extension in normals and patients.
For the purposes of diagnosis and therapeutic management of segmental instability of the lumbar spine, knowledge of the passively performed, normal motions, including the translation with its individual variation, is necessary.
AIMS OF THE STUDY
To obtain normal values as a basis for future clinical studies of passively performed segmental rotational motions of flexion–extension and lateral bending in the lumbar spine.
To analyze segmental translations.
To compare the graphic and computer techniques of measurement.
METHODS
Population Examined.
Forty-one healthy adults were included in the study: 18 women (range, 22–45 years; mean, 36 years) and 23 men (range, 29–50 years; mean, 39 years). All adults included in the study were asymptomatic at the time of examination and had no history of low-back pain.
Technique of Roentgenographic Examination.
All subjects underwent passive flexion–extension and lateral bending motions; radiographs were taken from a lateral view in the former and in the anteroposterior view in the latter.
Flexion-Extension.
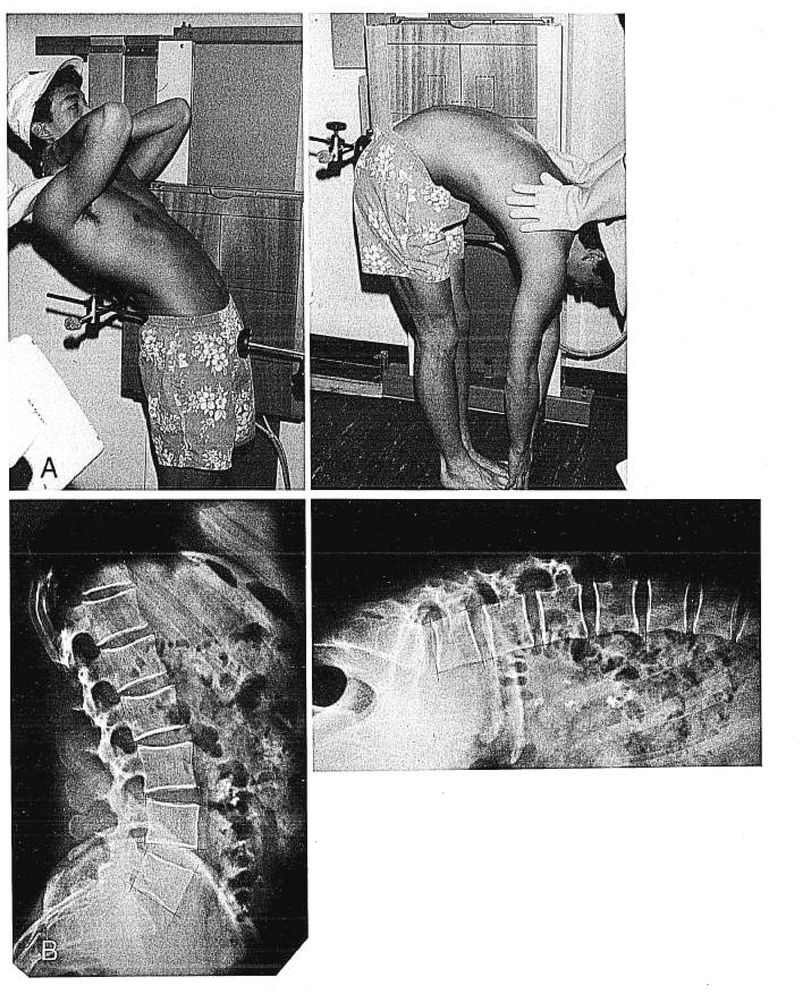
The subjects stood in an upright position with the left side of the body closer to the film. The standing position was chosen because, in normal subjects during sitting and forward bending, the upper body reaches the legs without flexing the lumbar spine to the end of range of motion. The distance between the film and the radiographic tube was 150 cm. The symphysis and sacrum were stabilized with two fixing pellets to prevent flexion–extension of the hip joints. The subjects were asked to bend the upper body forward as much as possible, and then the examiner applied a flexing force until the subject reported discomfort (Figure 1A). The extending load was applied in a similar manner, but the force was applied over the shoulders until the subject felt discomfort (Figure 1B). In each end position, a lateral radiograph was taken.
Fig 1.
A, Example of a passive flexion-extension examination. B, Typical flexion-extension radiographs of the lumbar region.
A study of the midposition was avoided to minimize radiation exposure and because the smaller ranges of motion would have contained proportionally larger errors.14,23
Side Bending.
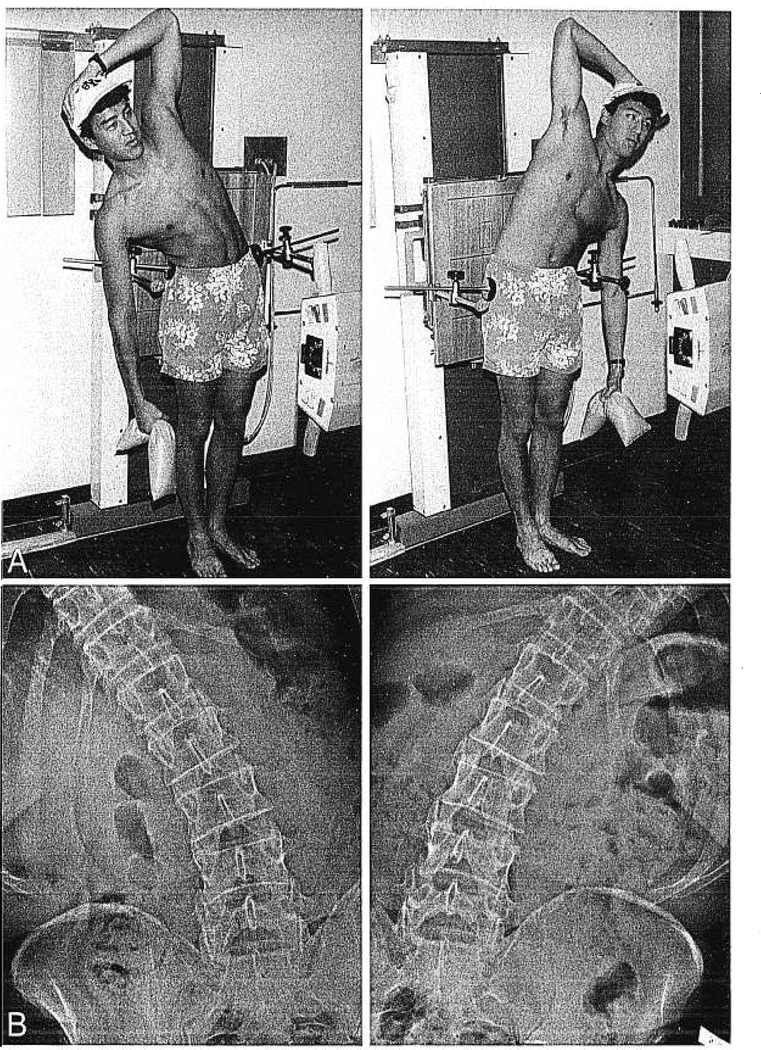
The subjects stood in the upright position with the back closer to the film. The iliac crests were stabilized with two fixing pellets to prevent side bending in the hip joints. A radiograph in the anteroposterior view in neutral position was taken. The subjects were asked to perform side bending without turning away from the film, and upon reaching their bending limit, they were given a 3-kg weight to hold (Figure 2A,B). Thirty seconds were allowed to pass before the radiograph was taken so that the soft tissues could adapt to the load. The procedure was repeated for right side bending. The weights were chosen for lateral bending because discomfort was not reported by the subjects by manual bending maneuver; for flexion–extension movement, the application of weights was less practicable because the majority of subjects were able to touch the floor with their fingers.
Fig 2.
A, Example of a passive lateral examination. B, Typical bending radiographs.
Basic Principles of Measurement.
To determine relative motion of Vertebra A with respect to Vertebra B below it by the use of radiographs taken with the spine in two positions, eg, flexion and extension, the images of Vertebra B in the two positions were superimposed. The remaining displacement between the two images of Vertebra A represented the needed relative motion. This approach was executed with graphic construction and a computer to solve the mathematical formulation. For the sake of discussion in this article, the first approach is called the graphic construction method (GCM) and the second the computer-assisted method (CAM).
Graphic Construction Method.
The sacrum on the extension radiographic film was superimposed by the sacrum of the flexion film. A line has been drawn on the extension film along the edge of the flexion film. The L5 vertebral images were then superimposed and a new line drawn along the edge of the flexion film. The angle between the two lines represents the segmental range of motion of L5 to sacrum, or the rotation about the x-axis (±Rx) of a three-dimensional coordinate system.14 The range of motion for the higher levels was measured in a similar manner. For the lateral bending radiographs, the procedure was similar, ie, the films of left and right bending were superimposed. A fine pencil and a precision goniometer (Rotring, Hamburg, Germany) with a resolution of .5° were used. Dark films had to be lightened to perform satisfactory and accurate superposition. Images were measured by two independent observers.
Computer-Assisted Method (CAM).
The procedure used in this study attempted to incorporate the advantages of superpositioning in the GCM method (reliability, ease, and the complete use of all the information available from the radiographic image) with the advantages of the CAM (precision and number-crunching ability for sophisticated analyses).
The radiographic films were marked with a ruler and fine pencil, as described below. The films were digitized with a Scriptel SPD-1218 graphics tablet (Scriptel Corporation, Columbus, Ohio) with a resolution of 0.1 mm, and the data was analyzed with a computer program, which calculated translations, angles of rotations, and centers of rotations in the manner described by Panjabi et al.14 Laying down the markings on a pair of films took about 20 minutes, and digitizing took another 10 minutes.
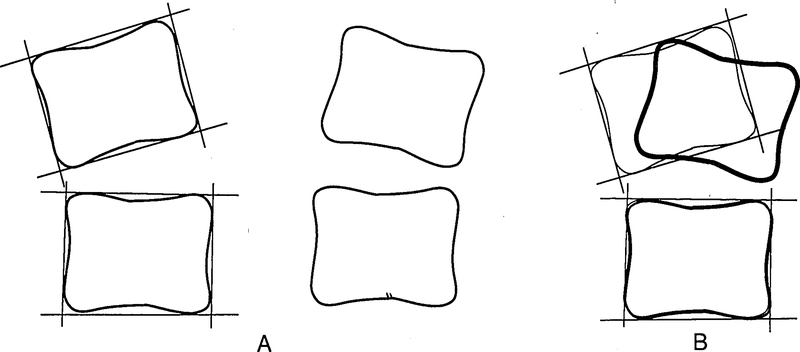
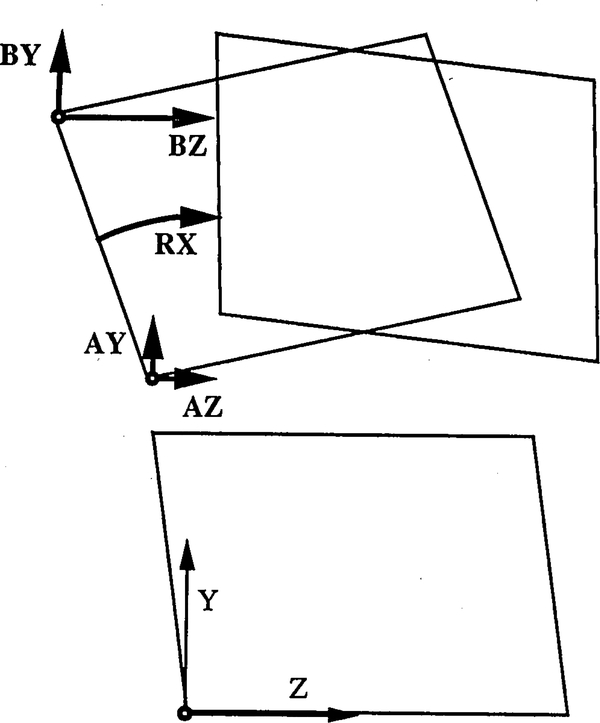
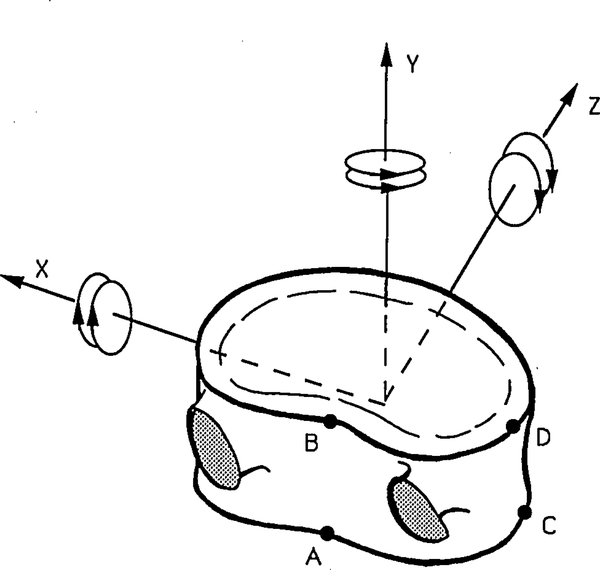
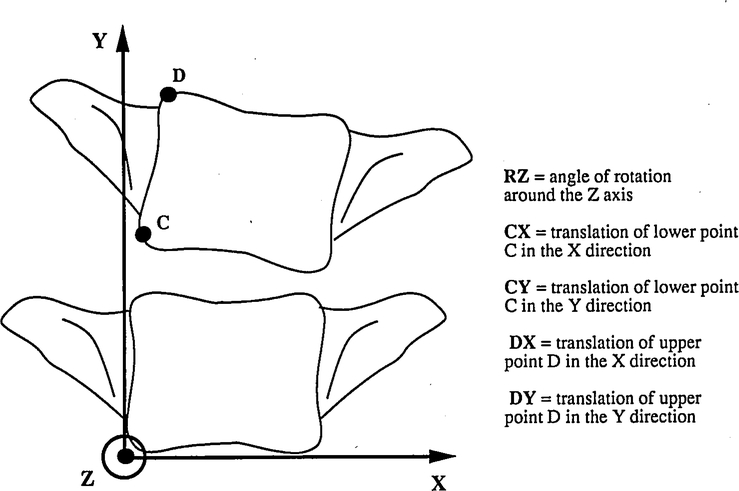
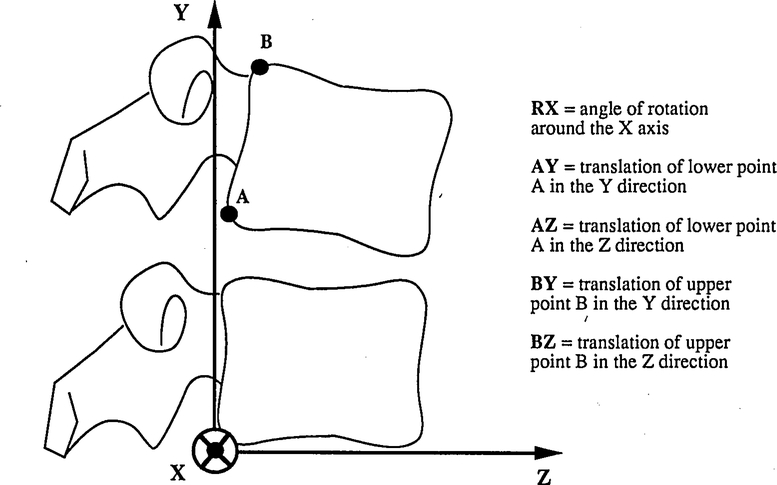
Four lines were drawn tangential to each face of a single vertebra. Their intersections provided four comer points. This procedure was repeated for each vertebra until the spinal column was completely contoured (Figure 3). Each vertebra on the unmarked view was then superimposed above its image on the marked view, and the comer points were copied from one to the other. This preserved the assumption of the vertebra as a nondeformable rigid body (Figure 4). Each comer point on both views was digitized four times, and the average was recorded by the computer program. For the purpose of determining the intervertebral translations, four points, A, B, C, and D, were identified (Figure 5). Points A and B were used for the flexion–extension motion; Points C and D served for the lateral bending. The specially designed computer program gave results for five motion parameters for flexion–extension motion (Figures 5–7): Rx, TzA, TyA, TzB, and TyB. Similar parameters, Rz, TxC, TyC, TxD, TyD, were obtained for the side bending. The nomenclature for these parameters is explained below.
Fig 3.
A, The extension view is marked first. Each vertebra is enclosed by four lines, which are each tangential to a vertebral face. B, After superpositioning the radiographs, the markings on the extension view are copied directly onto the flexion view.
Fig 4.
Five motion parameters for flexion–extension movement.
Fig 5.
Intervertebral translations were determined at four points: A, B, C, and D.
Fig 7.
Detailed explanation of five motion parameters for lateral bending movement.
R = rotation
T = translation
x, y, z = coordinate axis direction
A, B, C, D = points on the vertebral body
The above refer to a coordinate system with the positive x-axis directed toward the left, positive y-axis in the superior direction, and positive z-axis in the anterior direction (Figure 5). A translation along the positive axis is considered positive while in the opposite direction it is negative. Similarly, a clockwise rotation, seen from the origin toward the positive axis, is considered positive, whereas a counterclockwise rotation is considered negative. Thus, flexion (Rx), left rotation (Ry), and right bending (Rz) are positive rotations. Details of the CAM and its error analysis are provided elsewhere.16
RESULTS
A healthy population of 41 adults (18 women and 23 men) was examined. The segmental rotations were measured by the GCM and CAM; translations were calculated by CAM only.
Flexion–Extension
Measurements of Rotations.
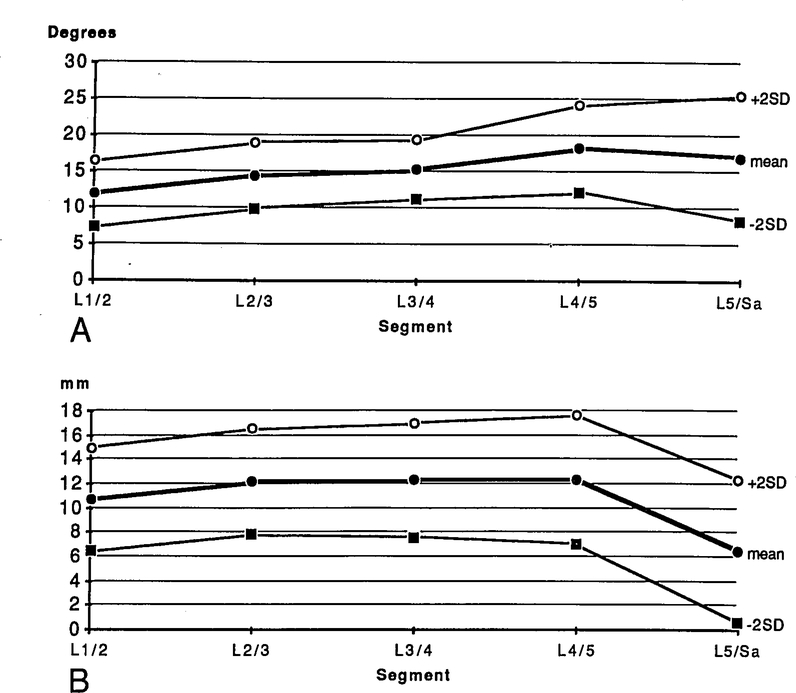
The angles of rotation given by the two methods for any one individual differed, on the average, by 1.5°. Because the mean values were not significantly different, the summarized values in Table 1 are the average of the two methods. The mean segmental rotation (Rx) was higher at the lower segments, but the variation of these values was also higher. The functional diagram of flexion–extension for the segmental motion ± 2SD is displayed in Figure 8A.
Table 1.
Flexion/Extension (From Extended to Flexed-Position Ranges of Motion)*
| Level | Avg | SD | Min | Max |
|---|---|---|---|---|
|
Rotations (°) around x-axis | ||||
| L1–2 | 11.9 | 2.27 | 8.6 | 17.9 |
| L2–3 | 14.5 | 2.29 | 9.5 | 19.1 |
| L3–4 | 15.3 | 2.04 | 11.9 | 21.0 |
| L4–5 | 18.2 | 2.99 | 11.6 | 25.6 |
| L5-Sacrum | 17.0 | 4.33 | 6.3 | 23.7 |
|
Translations (mm) of Point A in z-direction | ||||
| L1–2 | 2.6 | 1.05 | 0.3 | 4.1 |
| L2–3 | 3.0 | 1.15 | 1.2 | 7.0 |
| L3–4 | 3.1 | 1.19 | 0.3 | 6.7 |
| L4–5 | 2.6 | 1.16 | 0.3 | 5.8 |
| L5-Sacrum | −0.9 | 1.54 | −3.8 | 1.8 |
|
Translations (mm) of Point A in y-direction | ||||
| L1–2 | 3.3 | 1.52 | −0.4 | 6.8 |
| L2–3 | 4.5 | 1.33 | 2.7 | 7.5 |
| L3–4 | 4.7 | 1.67 | −0.5 | 8.6 |
| L4–5 | 5.9 | 1.78 | 2.4 | 11.6 |
| L5-Sacrum | 4.4 | 1.62 | −0.7 | 7.1 |
|
Translations (mm) of Point B in z-direction | ||||
| L1–2 | 10.7 | 2.14 | 6.3 | 15.1 |
| L2–3 | 12.2 | 2.19 | 8.4 | 19.5 |
| L3–4 | 12.3 | 2.36 | 6.6 | 18.3 |
| L4–5 | 12.3 | 2.66 | 7.4 | 21.1 |
| L5-Sacrum | 6.5 | 2.94 | −0.3 | 12.4 |
|
Translations (mm) of Point B in y-direction | ||||
| L1–2 | 2.9 | 1.93 | −2.0 | 7.0 |
| L2–3 | 5.3 | 1.80 | 2.6 | 9.6 |
| L3–4 | 6.3 | 2.09 | 1.3 | 10.8 |
| L4–5 | 9.0 | 2.21 | 4.2 | 14.9 |
| L5-Sacrum | 8.7 | 3.00 | 1.7 | 16.1 |
Normal kinematic values of flexion-extension movement. Rx is an average from both the computer assisted method (CAM) and the manual measurement by graphic construction method (GCM) techniques.
Avg = average; SD = standard deviation; Min = minimum; Max = maximum.
Fig 8.
A, Functional diagram for normal flexion–extension rotation and the two standard deviation confidence intervals. B, Functional diagram for normal flexion–extension translation of Point B in the z direction, also with two standard deviation confidence intervals.
Measurements of Translations.
The translation of a vertebra from extension to flexion was determined for Point A (posterior inferior comer of the vertebra) and Point B (posterior superior comer of the vertebra) in the z (anterior) and y (superior) directions. The average of translation of Point A in the z direction at L1–L5 ranged from 2.6 to 3.1 mm (in the anterior direction); at the L5-to-sacrum level, paradoxical translation (in the posterior direction) of −0.9 mm was observed. The superior translation of Point A was consistently larger at all levels (range, 3.3–5.9 mm). The anterior translations of Point B were two to three times larger than those of the inferior points (Table 1, Figure 8B).
Lateral Bending
Measurements of Rotations.
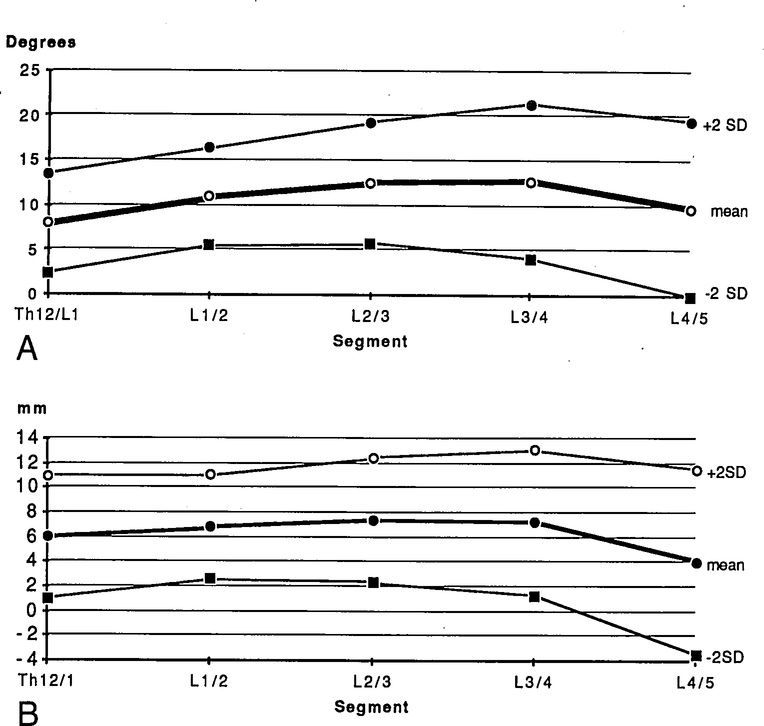
The angles of rotation for side bending (Rz) averaged by the two methods are summarized in Table 2. The range of segmental motion was larger than for flexion–extension. The CAM was not used to measure the L5 to sacrum on lateral bending because the radiographic quality at this level was usually so poor that meaningful kinematic parameters other than the angle of rotation could not be obtained. Therefore, necessarily, only the GCM was used to calculate the motion. The functional diagram is displayed in Figure 9A.
Table 2.
Lateral Bending (From Right to Left Side Ranges of Motion)*
| Level | Avg | SD | Min | Max |
|---|---|---|---|---|
|
Rotations (°) around z-axis | ||||
| T12-L1 | 7.9 | 2.78 | 2.5 | 14.2 |
| L1–2 | 10.4 | 2.71 | 4.4 | 16.9 |
| L2–3 | 12.4 | 3.38 | 3.2 | 21.2 |
| L3–4 | 12.4 | 4.33 | 0.3 | 19.8 |
| L4–5 | 9.5 | 4.91 | 0.5 | 17.6 |
| L5-Sacrum | 5.1 | |||
|
Translations (mm) of Point C in x-direction | ||||
| T12–1 | 2.0 | 1.44 | −1.6 | 4.7 |
| L1–2 | 1.4 | 1.20 | −0.4 | 5.9 |
| L2–3 | 1.4 | 1.20 | −0.9 | 4.7 |
| L3–4 | 0.8 | 1.09 | −2.1 | −6.6 |
| L4–5 | −1.2 | 2.59 | 2.5 | 4.4 |
|
Translations (mm) of Point C in y-direction | ||||
| T12–1 | 3.8 | 1.79 | −0.1 | 7.4 |
| L1–2 | 5.0 | 1.50 | 2.2 | 7.6 |
| L2–3 | 6.0 | 2.02 | 1.7 | 11.2 |
| L3–4 | 6.4 | 2.46 | 1.1 | 12.1 |
| L4–5 | 5.1 | 2.45 | 0.4 | 9.0 |
|
Translations (mm) of Point D in x-direction | ||||
| T12–1 | 6.0 | 2.49 | 0.6 | 10.9 |
| L1–2 | 6.8 | 2.12 | 3.3 | 10.5 |
| L2–3 | 7.4 | 2.55 | 1.6 | 13.3 |
| L3–4 | 7.2 | 2.95 | −0.8 | 12.9 |
| L4–5 | 4.0 | 3.75 | −3.7 | 10.9 |
|
Translations (mm) of Point D in y-direction | ||||
| T12–1 | 3.6 | 2.17 | −0.9 | 8.2 |
| L1–2 | 4.9 | 1.61 | 2.0 | 8.5 |
| L2–3 | 5.9 | 2.04 | 2.5 | 11.1 |
| L3–4 | 6.1 | 2.41 | 1.1 | 11.9 |
| L4–5 | 5.1 | 2.45 | 0.8 | 8.8 |
Normal kinematic values of lateral bending movement. Rz Is an average from both the CAM and GCM measurements.
Avg = average; SD = standard deviation; Min = minimum; Max = maximum.
Fig 9.
A, Functional diagram for normal lateral bending rotation and the two standard deviation confidence intervals. B, Functional diagram for normal lateral bending translation of Point D in the x direction, also with two standard deviation confidence intervals.
Measurements of Translations.
The translation of a vertebra during lateral bending was determined for Point C (left inferior comer) and Point D (left superior corner) in the x (right) and y (superior) directions (Table 2). Again, the translations of Point D were two to three times larger than those of the inferior points. The standard deviations associated with the translations were 1.3 mm on average for all points. At L4–L5, a paradoxical translation was observed.
Men vs. Women
Similar to the study by Tanz,26 a mixed group of men and women was examined. No statistically significant differences in angles of rotation between men and women could be found at any level with either method of measurement. Table 3 gives results by the GCM method. At the L5-to-sacrum level, the magnitude of the difference between men and women in average flexion–extension was highest—a value of 3.1°.
Table 3.
Female vs. Males by GCM*
|
Flexion-Extension Rx | |||||
| L1–2 | L2–3 | L3–4 | L4–5 | L5-Sa | |
| (Female avg)-(male avg) | 1.5 | −0.1 | 0.0 | 0.8 | 3.1 |
| t-test P values | 0.65 | 0.99 | 0.66 | 0.46 | 0.06 |
|
Lateral Bending Rz | |||||
| T12–1 | L1–2 | L2–3 | L3–4 | L4–5 | |
| (Female avg)-(male avg) | 1.8 | 0.9 | 0.3 | −1.6 | −0.7 |
| t-test P values | 0.65 | 0.99 | 0.66 | 0.46 | 0.06 |
Statistical comparison of the normal female population with the normal male population, as measured by GCM.
GCM vs. CAM
No significant differences were found between the results of normals obtained by the GCM and CAM except at the L5-to-sacrum level in flexion-extension (Table 4). Occasionally, however, there were marked differences between the values obtained by the two methods. Of the lateral bending cases, 6% differed by 5–10°. Of the flexion–extension cases, 4% differed by 5–8°. The average difference between the CAM and GCM methods was 1.7° for flexion–extension and 1.9° for lateral bending.
Table 4.
Methods of Measurement: CAM vs. GCM*
|
Flexion-Extension Rx | |||||
| L1–2 | L2–3 | L3–4 | L4–5 | L5-Sa | |
| Average difference | 1.6 | 1.3 | 1.4 | 1.5 | 1.6 |
| t-test P values | 0.41 | 0.06 | 0.15 | 0.16 | 0.04 |
|
Lateral Bending Rz | |||||
| T12–1 | L1–2 | L2–3 | L3–4 | L4–5 | |
| Average difference | 2.4 | 2.1 | 2.0 | 1.4 | 1.4 |
| t-test P values | 0.24 | 0.21 | 0.31 | 0.07 | 0.86 |
Statistical comparison of the normal population as measured by the CAM and by GCM.
Intraobserver vs. Interobserver
The measurements of the the normal population by the two observers compared as follows. The average difference was 1.6° for flexion–extension and 2.5° for lateral bending. Of the lateral bending measurements, 13% differed by 5–11°. Of the flexion–extension measurements, 6% differed by 5–8° (Table 5).
Table 5.
Intraobserver Differences*
|
Flexion-Extension Rx | |||||
| L1–2 | L2–3 | L3–4 | L4–5 | L5-Sa | |
| Average difference | 1.6 | 1.3 | 1.4 | 1.6 | 2.1 |
| t-test P values | 0.01 | 0.89 | 0.22 | 0.36 | 0.32 |
|
Lateral Bending Rz | |||||
| T12–1 | L1–2 | L2–3 | L3–4 | L4–5 | |
| Average difference | 3.0 | 2.4 | 2.2 | 1.8 | 2.9 |
| t-test P values | 0.89 | 0.81 | 0.88 | 0.08 | 0.80 |
Statistical comparison of the normal population as measured by two different observers using the GCM technique.
To quantify the interobserver GCM uncertainty of measuring a single radiograph, one normal was measured a total of six times by two observers. The standard deviation of these six measurements of four segmental levels was 1.25° on average.15
DISCUSSION
The functional examination of the lumbar spine during lateral bending and passive flexion and extension is a valuable method for analysis of segmental rotation and translation. Compared with the recent in vivo studies by Hayes et al,11 Pearcy et al,19,20 and Froning and Frohman,8 it can be seen that our values for normal angles of rotation are predominantly larger (Table 6). In an earlier study, Clayson et al,3 in addition to using a nonstandard examination procedure and an inferior technique of graphic analysis, studied only young college-age women. These three factors may explain this study’s higher values compared with those of its contemporaries. The lower values, compared with ours, which were given by the more recent studies, are probably due to the method of examination. Passive motion was performed in our study, whereas active motion was performed in the others. Our use of passive motion is supported by our previous experience with the range of motion of the cervical spine,4 where we found a similar difference between active and passive motion. We hypothesize that such a difference also exists in lumbar spine motions. For obvious ethical reasons, we purposely restricted our lumbar examination of healthy normals to passive motions, thus avoiding unnecessary exposure of subjects to large doses of radiation.
Table 6.
Angles of Rotation*
|
Flexion/Extension | ||||||||
| Study | No. of Subjects | 1/2 | 2/3 | 3/4 | 4/5 | 5/1 | ||
| Tanz, 1953 | In vivo | 14 | 5.6 | 7.6 | 8.6 | 12.2 | 8.2 | |
| Allbrook, 1957 | In vivo | 20 | 6.0 | 8.0 | 13.0 | 19.0 | 18.0 | |
| Clayson et al, 1962 | In vivo | 26 | 12.6 | 15.8 | 15.9 | 17.7 | 18.7 | |
| Froning and Frohman, 1968 | In vivo | 30 | 9.0 | 11.0 | 13.0 | 16.0 | 17.0 | |
| Pearcy et al, 1984 | In vivo | 11 | 13.0 | 14.0 | 13.0 | 16.0 | 14.0 | |
| Yamamoto et al, 1989 | In vivo | 10 | 10.1 | 10.8 | 11.2 | 14.5 | 17.8 | |
| Hayes et al, 1989 | In vivo | 59 | 7.0 | 9.0 | 10.0 | 13.0 | 14.0 | |
| Present study | In vivo | 41 | 11.9 | 14.5 | 15.3 | 18.2 | 17.0 | |
|
Total Lateral Bending | ||||||||
| Study | No. of Subjects | 12/1 | 1/2 | 2/3 | 3/4 | 4/5 | 5/1 | |
| Tanz, 1953 | In vivo | 14 | — | 5.4 | 7.8 | 8.0 | 8.2 | 2.3 |
| Pearcy and Tibrewal, 1984 | In vivo | 10 | — | 10.0 | 11.0 | 10.0 | 6.0 | 3.0 |
| Yamamoto et al, 1989 | In vivo | 10 | — | 4.9 | 7.0 | 5.7 | 5.7 | 5.5 |
| Present study | In vivo | 41 | 7.9 | 10.4 | 12.4 | 12.4 | 9.5 | 57l |
A historical tabulation and comparison of results from other lumbar spine studies. For lateral bending, Tanz (1953) measured the total amount of motion from left to right; the Yamamoto (1989) in vitro study measured only from neutral position to one side.
We believe that, in a clinical environment, a patient with pain will tend not to bend as far his spine will permit. An active examination therefore will tend not to uncover hypermobile motion and is less useful as a diagnostic tool. Therefore, we suggest that if a patient is to be examined by means of functional radiographic studies, passive motion should be performed. Future studies of patients with low-back pain and suspected instability or segmental hypermobility of the lumbar spine will explore the clinical validity and importance of this approach. As Hayes et al11 and Penning et al23 discovered, the range of normal motion may in itself be so great as to limit the usefulness of lumbar bending films. Conversely, the analysis of segmental translations may offer additional data for the determination of pathologic motions, but here also a large range has been observed. Knutsson12 was the first to suggest translatory displacement in the anteroposterior direction during flexion–extension as an indicator of spinal instability. Similar observations have been made by others.9,13,27
Pearcy et al (1984) found that the translation of an unspecified vertebral point ranged from 0 to 4 mm in flexion–extension, depending on the segmental level. In that study, the radiologic system was capable of measuring in vivo translations of a plastic model with a root mean square error of less than 2 mm. These measured translations, though, were smaller than the error of the measurement system, thus making them questionable: The translation values presented in that study are indistinguishable from the system errors. In our study, the superior body points had three to six times the translation of the inferior body points. The standard deviations of the superior points were only two times as large as the standard deviations of the inferior points (Tables 1–2). It is therefore recommended that the translation of the superior body points be used in the future.
Because of the additional kinematic data that may be obtained from the same two radiographs, the CAM is to be advocated for future clinical studies, even if it is more time-consuming. Three-dimensional analyses, while ideal, may not be required. Panjabi and White18 noted that, as long as the accompanying motions in other planes remain smaller than 5°, no significant effects were seen in the kinematic data obtained on the primary plane. This is because the radiologic image of the vertebral body, as a whole, is not changed significantly by such small rotations. The data from Pearcy et al19–21 indicate that the accompanying motions are indeed small enough not to consider. Of course, if the out-of-plane rotations are too large, the radiographic quality deteriorates and interpretation becomes more difficult. In our study, it appeared that radiographic quality was by far the biggest source of uncertainty in the experiment. Repeated measurements of a typical set of radiographs yielded angles of rotation to within 1° of the standard deviation, which correlates well with other experiments.8,19–21,26 However, radiographic quality can introduce drastic variation. The most difficult levels to interpret (ie, L5 to sacrum in flexion–extension and L4–L5 in lateral bending), also yielded the highest standard deviations. Poor radiographic quality at L5 to sacrum is held responsible for the only significant difference (P = 0.06) found between men and women. Poorer image quality is also blamed for the relatively larger uncertainties associated with the lateral bending films, compared with those from the flexion–extension films. It must be emphasized that the films we studied were taken by trained hospital personnel and were generally of good quality. Even a small drop in resolution, however, can introduce a significant error in the results.
The CAM and GCM measurement techniques used in this study employed the concept of superpositioning the radiographic films. This concept is susceptible to an occasionally marked difference among interobserver measurements. Because the standard deviation in the interobserver study was 1.25°, it can be said that, in measurements by different people, 95% of the measurements will fall within 2.5° of some average value. Thus, a difference of up to 5° (four standard deviations) between any two measurements can be expected. In practice, as illustrated by the results, two reasonably experienced observers can obtain values that are more often within 2.5° of each other.
At present, we cannot be certain what combination of flexion–extension and lateral bending radiographs is necessary for the analysis of altered pathologic movements at the lumbar spine. Future studies of a significant number of patients with low-back pain and clinically suspected segmental instability should clarify these issues. Stokes and Frymoyer25 gave little value to the actively performed flexion–extension radiographs, but it is not known to what extent passive functional radiographs of the lumbar spine can be integrated into the clinical assessment of patients with low-back pain. The results of this ongoing study will be reported in the future. If the functional radiographs of the lumbar spine are found clinically relevant, age related normal values should be obtained.
Fig 6.
Detailed explanation of five motion parameters for flexion–extension movement.
Acknowledgments
Supported by the Scholarship of the Swiss Orthopedic Association and the Research Fund of the Schulthess Hospital.
The authors thank Prof. L. Penning, MD, Department of Neuroradiology, University of Groningen, the Netherlands, for independently measuring the roentgenographs and for his critical advice for the study.
REFERENCES
- 1.Allbrook D: Movements of the lumbar spinal column. J Bone Joint Surg 39B:339–345, 1957 [DOI] [PubMed] [Google Scholar]
- 2.Begg AC, Falconer MA: Plain radiography in intraspinal protrusion of lumbar intervertebral discs: A correlation with operative findings. Br J Surg 36:225–239, 1949 [DOI] [PubMed] [Google Scholar]
- 3.Clayson SJ, Newman IM, Debevec DF, et al. : Evaluation of mobility of hip and lumbar vertebrae of normal young women. Arch Phys Med 43:1–8, 1962 [PubMed] [Google Scholar]
- 4.Dvorak J, Fröhlich D, Penning L, Baumgaertner H, Panjabi MM: Functional radiographic diagnosis of the cervical spine: fLexion/extension. Spine 13:748–755, 1988 [DOI] [PubMed] [Google Scholar]
- 5.Dimnet J, Fischer LP, Gonon G, Carret JP: Radiographic studies of lateral flexion in the lumbar spine. J Biomech 11:143–150, 1978 [DOI] [PubMed] [Google Scholar]
- 6.Dimnet J: The improvement in the results of kinematics of in vivo joints. J Biomech 13:653–661, 1980 [DOI] [PubMed] [Google Scholar]
- 7.DuPuis PR, Yong-Hing K, Cassidy JD, Kirkaldy-Willis WH: Radiologic diagnosis of degenerative lumbar spinal instability. Spine 10:262–276, 1985 [DOI] [PubMed] [Google Scholar]
- 8.Froning EC, Frohman B: Motion of the lumbosacral spine after laminectomy and spine fusion. J Bone Joint Surg 50A:897–918, 1968 [PubMed] [Google Scholar]
- 9.Gertzbein SD, Wolfson N, King G: The diagnosis of segmental instability in vivo by centrode length. Presented at ISSLS, Miami, Florida, April 13–17, 1988 [Google Scholar]
- 10.Hanley EN, Matteri RE, Frymoyer JW: Accurate roentgenographic determination of lumbar flexion-extension. Clin Orthop 115:145–148, 1976 [PubMed] [Google Scholar]
- 11.Hayes MA, Howard TC, Gruel CR, Kopta JA: Roentgenographic evaluation of lumbar spine flexion-extension in asymptomatic individuals. Spine 14:327–331, 1989 [DOI] [PubMed] [Google Scholar]
- 12.Knutsson F: The instability associated with disc degeneration in the lumbar spine. Acta Radiol 25:593–609, 1944 [Google Scholar]
- 13.Lehmann T, Brand R: Instability of the lower lumbar spine. Presented at ISSLS, Toronto, Canada, June 7–10, 1982 [Google Scholar]
- 14.Panjabi MM: Centers and angles of rotation of body joints: A study of errors and optimization. J Biomech 12:911–910, 1979 [DOI] [PubMed] [Google Scholar]
- 15.Panjabi MM, Chang D, Dvorak J: Sensitivity of kinematic parametrs to measurement errors in the analysis of functional x-rays. (Unpublished manuscript)
- 16.Panjabi MM, Dvorak J, Duranceau J, et al. : Three-dimensional movements of the upper cervical spine. Spine 13:726–730, 1988 [DOI] [PubMed] [Google Scholar]
- 17.Panjabi MM, Goel VK: Errors in kinematic parameters of a planar joint: Guidelines for optimal experimental design. J Biomech 15:537–544, 1982 [DOI] [PubMed] [Google Scholar]
- 18.Panjabi MM, White AA: A mathematical approach for three-dimensional analysis of the mechanics of the spine. J Biomech 4:3, 1971 [DOI] [PubMed] [Google Scholar]
- 19.Pearcy MJ, Portek I, Shepherd J: Three-dimensional x-ray analysis of normal movement in the lumbar spine. Spine 9:294–297, 1984 [DOI] [PubMed] [Google Scholar]
- 20.Pearcy MJ, Tibrewal SB: Axial rotation and lateral bending in the normal lumbar spine measured by three-dimensional radiography. Spine 9:582–587, 1984 [DOI] [PubMed] [Google Scholar]
- 21.Pearcy MJ, Whittle MW: Movements of the lumbar spine measured by three-dimensional x-ray analysis. J Biomed Eng 4:107–112, 1982 [DOI] [PubMed] [Google Scholar]
- 22.Penning L: Functional Pathology of the Cervical Spine. Vol 59. Amsterdam, Excerpta Medica, 1968, pp 1–25 [Google Scholar]
- 23.Penning L, Wilmink JT, van Woerden HH: Inability to prove instability: A critical appraisal of clinical-radiological flexion-extension studies in lumbar disc degeneration. Diagn Imag Clin Med 53:186–192, 1984 [PubMed] [Google Scholar]
- 24.Rolander SD: Motion of the lumbar spine with special reference to the stabilizing effect of posterior fusion. Acta Orthop Scand (Suppl) 90:1–186, 1966 [DOI] [PubMed] [Google Scholar]
- 25.Stokes IA, Frymoyer JW: Segmental motion and instability. Spine 12:688–691, 1987 [DOI] [PubMed] [Google Scholar]
- 26.Tanz S: Motion of the lumbar spine: A roentgenologic study. AJR 69:399–412, 1953 [PubMed] [Google Scholar]
- 27.Woody J, Lehmann T, Weinstein J, Hayes M, Spratt K: Excessive Translation on flexion-extension radiographs in asymptomatic populations. Presented at ISSLS, Miami, Florida, April 13–17, 1988 [Google Scholar]
- 28.White A, Panjabi MM: The basic kinematics of the human spine: A review of past and current knowledge. Spine 3:12–20, 1978 [DOI] [PubMed] [Google Scholar]
- 29.Yamamoto I, Panjabi MM, Crisco T, Oxland T: Three-dimensional movements of the whole lumbar spine. Spine (In press). [DOI] [PubMed] [Google Scholar]


