

Abstract
Structure-function analyses of the mammalian brain have historically relied on anatomically-based approaches. In these investigations, physical, chemical, or electrolytic lesions of anatomical structures are applied, and the resulting behavioral or physiological responses assayed. An alternative approach is to focus on the expression pattern of a molecule whose function has been characterized and then use genetic intersectional methods to optogenetically or chemogenetically manipulate distinct circuits. We previously identified WIDE AWAKE (WAKE) in Drosophila, a clock output molecule that mediates the temporal regulation of sleep onset and sleep maintenance. More recently, we have studied the mouse homolog, mWAKE/ANKFN1, and our data suggest that its basic role in the circadian regulation of arousal is conserved. Here, we perform a systematic analysis of the expression pattern of mWake mRNA, protein, and cells throughout the adult mouse brain. We find that mWAKE labels neurons in a restricted, but distributed manner, in multiple regions of the hypothalamus (including the suprachiasmatic nucleus, dorsomedial hypothalamus, and tuberomammillary nucleus region), the limbic system, sensory processing nuclei, and additional specific brainstem, subcortical, and cortical areas. Interestingly, mWAKE is also observed in non-neuronal ependymal cells. In addition, to describe the molecular identities and clustering of mWake+ cells, we provide detailed analyses of single cell RNA sequencing data from the hypothalamus, a region with particularly significant mWAKE expression. These findings lay the groundwork for future studies into the potential role of mWAKE+ cells in the rhythmic control of diverse behaviors and physiological processes.
Keywords: mWAKE, WAKE, circadian, hypothalamus, suprachiasmatic nucleus
Graphical Abstract
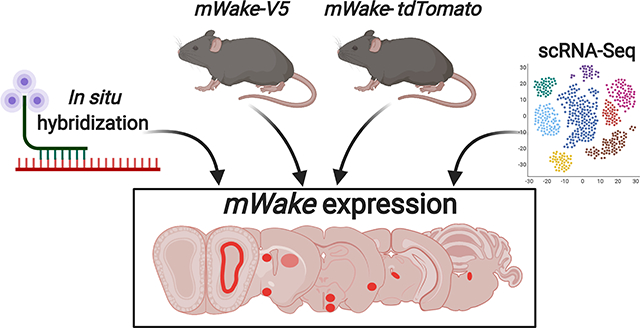
WIDE AWAKE (WAKE) was first identified in Drosophila as a clock-output molecule that regulates the timing of sleep and arousal. There is a single homolog of WAKE (mWAKE/ANKFN1/NMF9) in mice, which has previously shown to be enriched in the suprachiasmatic nucleus, the master circadian pacemaker. This present work surveys the brain expression pattern of mWAKE using multiple approaches. First, mWake mRNA expression is examined using RNAscope in situ hybridization. Second, mWAKE protein expression is investigated using two different transgenic animal models: an mWakeV5 mouse where a V5 tag is fused directly to the end of the protein and an mWaketdTomato−2A-Cre mouse where tdTomato is inserted in-frame within the gene. Third, we analyze scRNA-Seq data to characterize the molecular identity of mWake neurons in the hypothalamus. These data reveal that mWAKE labels a distributed subset of GABAergic and glutamatergic neurons across the brainstem, subcortical regions, and cortex, with significant expression in the hypothalamus. This study may provide a potential roadmap for future studies of the circadian regulation of distinct circuits and behaviors.
1. INTRODUCTION
For centuries, scientists have endeavored to attribute aspects of cognition, emotion, and behavior to anatomic regions of the brain (Grand, 1999). Initial efforts involved resecting or lesioning a brain area and observing its impact on a specific behavior. For example, ablation studies in the 19th century revealed the importance of the medulla in respiratory control and of the frontal lobes for attention (Bianchi, 1895; Pearce, 2008). Contemporary investigations have refined this classical anatomical approach by utilizing cell type-specific ablations (Nirenberg & Cepko, 1993). However, an alternative method for delineating structure-function relationships starts from characterizing the roles of specific molecules and then examining their expression pattern to identify neural circuits involved in relevant behaviors. For example, in Drosophila, fruitless and doublesex, which encode critical factors in sex determination, mark neural circuits involved in a variety of sexually dimorphic behaviors (Auer & Benton, 2016). Similarly, in mammals, neurons expressing the androgen receptor label sexually dimorphic circuits in the preoptic area (POA) and basal forebrain (BF) (Shah et al., 2004).
From a forward-genetic screen in Drosophila, we previously identified WIDE AWAKE (WAKE), a molecule that regulates the circadian timing of sleep (Liu et al., 2014). WAKE acts downstream of the circadian clock to promote sleep during the night, by inhibiting the excitability of arousal-promoting clock neurons at that time (Liu et al., 2014). This protein has a single mammalian ortholog, mWAKE/ANKFN1/NMF9, which is enriched in the suprachiasmatic nucleus (SCN), the circadian pacemaker in mammals (Liu et al., 2014; Zhang et al., 2015). Our recent work on mWAKE suggests that the function of WAKE in regulating arousal by rhythmically modulating neural activity is conserved in mice. However, because mice are nocturnal animals, the increased arousal at night observed in mWake mutants manifests as hyperarousal, rather than changes in sleep (Bell et al., 2020).
Here, in an effort to identify additional brain regions whose activity and related behaviors depend on mWAKE and potentially the circadian clock, we use three independent techniques to investigate mWAKE expression throughout the mouse brain. We use the highly sensitive RNAscope in situ hybridization (ISH) technique to label mWake mRNA and also perform immunofluorescence (IF) and imaging studies from two different transgenic mouse models to visualize mWAKE protein and mWAKE+ neuronal processes. To gain a deeper understanding of the molecular identities of mWake+ cells and how they form different sub-clusters within an anatomical region, we also performed single cell RNA sequencing (scRNA-Seq) analyses on mWake+ cells in the hypothalamus. Together, these investigations revealed that mWAKE is expressed in a restricted manner across multiple regions of the mouse brain. These areas span the brainstem, subcortical areas, and cortex, with particularly prominent expression in the hypothalamus, and include not only mWAKE+ neurons but also ependymal cells that line the cerebral ventricles. Although the precise functions of these mWAKE+ regions remain to be determined, their locations are suggestive of potential roles in circadian-related behaviors, arousal, sensory processing, and emotion. These results comprise a catalog of mWake expression in the mouse brain and mWake+ cell identity in the hypothalamus and may ultimately lead to the identification of neural circuits mediating the circadian regulation of arousal and other internal states and behaviors.
2. MATERIALS AND METHODS
2.1. Animals
All experiments and animal procedures were approved by the Johns Hopkins Institutional Animal Care and Use Committee (IACUC). Animals were raised in a common animal facility, group housed and maintained with food and water ad libitum. Male mice were used in all experiments, at 2–4 months old for all histology and 6–7 weeks of age for scRNA-Seq. All genotyping was performed via Taq-Man based rtPCR probes (Transnetyx). Wild-type (WT) mice in all experiments were C57BL/6J. WAKECre mice carry an insertion of a tdTomato-p2A-Cre cassette in exon 5 and was previously described (Bell et al., 2020).
mWakeV5 mice:
A V5 (GKPIPNPLLGLDST) epitope tag was fused to the C-terminus of mWAKE directly before the stop codon using CRISPR/Cas-9 genome editing (Hsu, Lander, & Zhang, 2014), with a gRNA (TTA AGT AGT ATG CTT TAG GG) targeting the stop codon of mWake and a 150 bp oligonucleotide (AGT TCA GAG ATG AGT CCA GAC CCC ACA TCT CCA GTT TCA GAA ATA TTA AGT AGT ATG CTT GGC AAG CCC ATC CCC AAC CCC CTG CTG GGC CTG GAC AGC ACC TAG GGT GGC CCA CAC CGG CTC TCT ATT TGT CCC CTG CTA TTC CTT GCA TTT CTT CAG CAC AGC) for homology-directed repair to insert the V5 polypeptide sequence. mWAKE-V5 was then detected using immunofluorescence staining in fixed tissue sections. mWAKEV5 was backcrossed to the C57BL/6J background five generations before being used in any experiments.
2.2. Immunohistochemistry
Mice were deeply anesthetized with a ketamine/xylazine mixture and then fixed by transcardial perfusion with 4% paraformaldehyde. For all experiments, mice were sacrificed between ZT0–4. Brains were subsequently drop-fixed in 4% paraformaldehyde for 24–48 hrs and transferred into 1xPBS (137 mM NaCl, 2.7 nM KCl, 10 mM Na2HPO4, 1.8 nM KH2PO4) before being sectioned at 40 μm thickness using a VT1200S vibratome (Leica, Nussloch, Germany). Free-floating sections were washed in 1xPBS, blocked for 1 hr in blocking buffer (PBS containing 0.25% Triton-X-100 and 5% normal goat). These sections were then incubated with rabbit α-V5 primary antibody generated against a GKPIPNPLLGLDST peptide (AB3792, Millipore Sigma; RRID: AB_91591, 1:1000), rabbit α-HDC primary antibody generated against recombinant HDC (16045, Progen; RRID: AB_2773044, 1:800), rabbit α-TPH2 primary antibody generated against aa10–75 of mouse TPH2 (NB100–74555, Novus; RRID: AB_1049988, 1:300), or chicken α-TH primary antibody generated against two synthetic peptides (AB76442, Abcam; RRID: AB_1524535; 1:1000) in blocking buffer at 4°C overnight. The following day, slices were washed three times with PBST (PBS and 0.1% Tween-20), then incubated with α-rabbit secondary antibody (Alexa-Fluor 488 Goat α-Rabbit IgG H&L, AB150077, Abcam, RRID: AB_2630356, 1:2500–1:5000) or α-chicken secondary antibody (Alexa-Fluor 488 Goat α-Chicken IgY H&L, A-11039, ThermoFisher Scientific, RRID: AB_2534096, 1:2000) for 2.5 hrs in blocking buffer. After this incubation, brain sections were washed three times in PBST, incubated in DAPI (Millipore, Burlington, MA; 1:2000) for 5 min, then washed three times in PBS for 5 mins immediately before mounting. Sections were mounted on Superfrost Plus Microscope slides (Fisher Scientific, Waltham, MA) using VectaShield Hard Set Mounting Medium (Vector Laboratories, Burlingame, CA). Fluorescent images were captured using a ZEISS LSM 800 confocal (Zeiss, Oberkochen, Germany). Note that immunostainings were not performed for tdTomato; instead, native fluorescence was used to visualize tdTomato in all images from mWakeCre mice. Co-localization of tdTomato and V5 signal was performed in ImageJ using z-stack images, using DAPI as reference to distinguish individual cells. Cells from one plane of the z-stack were used for quantification, but the entire z-stack was used to validate co-localization in 3 dimensions.
2.3. In situ hybridization
The majority of in situ hybridization was performed using the RNAscope 2.5 Chromogenic Assay and the BaseScope™ Detection Reagent Kit according to manufacturer’s instructions (Advanced Cell Diagnostics/ACD, Newark, CA) (Wang et al., 2012). Briefly, WT mouse brains were dissected and fresh frozen in Tissue-Tek O.C.T. (VWR, Logan Township, NJ). Sections were then cryosectioned at 10 μm and placed onto SuperFrost Plus slides, which were then dried at −20°C for 1 hr and transferred to −80°C for storage. Prior to use, slides were immersed in pre-chilled 4% paraformaldehyde (PFA) for 15 min. Following post-fixation, slides were dried by sequential immersion in 50% EtOH, 70% EtOH, and 100% EtOH, each at room temperature for 5 min before incubation at 37°C for 30 min. Using an Immedge™ hydrophobic barrier pen, boxes were drawn around each individual section and left to dry. Slides were then treated with RNAscope Hydrogen Peroxide for 10 min at room temperature and rinsed once in tap water before incubating with Protease IV for 30 min at room temperature. The slides were then washed in 1xPBS. Target probe (custom-produced by ACD to target exon 4 of mWake) was hybridized to tissue for 2 hr at 40°C, and seven subsequent amplification and wash steps followed, fixing peroxidase enzymes to hybridized target mRNA. Signal was detected by chromogenic reactions with the BaseScope™ Fast RED, and sections were counterstained with hematoxylin. All slides from in situ studies were imaged on a Keyence BZ-X700 microscope (Keyence, Itasca, IL) under 10x brightfield illumination, with higher magnification images acquired via LSM 800 confocal microscope.
For imaging the relationship between mWake+ SCN neurons and those expressing other SCN markers, we performed fluorescent in situ hybridization using the RNAscope™ Fluorescent Multiplex Assay V2 (Advanced Cell Diagnostics/ACD, Newark, CA) and probes targeting tdTomato mRNA (as a marker of mWake expression in mWakeCre/+ mice, Cat. #317041), as well as Grp (Cat. #317861), Vip (Cat. #415961), Rorb (Cat. #444271), and Prok2 (Cat. #447941). Preparation of tissue sections was performed as for chromogenic in situ hybridization, with multiple probes for each section. Three rounds of amplification added multiple attachment sites for horseradish peroxidase (HRP), which deposited fluorophores at each location via Opal Reactive Fluorophores (Akoya Biosciences, Marlborough, MA, NEL810001KT). Different probes were multiplexed through sequential deposition of different fluorophores on a single slide in a stepwise fashion. Slides were then counterstained with DAPI and coverslipped under Prolong Gold antifade mountant (ThermoFisher Scientific, Waltham, MA). Sections were imaged on a Zeiss LSM 880 confocal microscope at 10x and 25x magnification.
2.4. scRNA-Seq data analysis
A scRNA-Seq dataset was previously generated from flow-sorted tdTomato+ cells of 7 week old male mWake(Cre/+) hypothalami (Bell et al., 2020) and used for analysis in this study (GSE146166). Briefly, an Act-Seq based protocol was used (Wu, Pan, Zuo, Li, & Hong, 2017) to dissociate the hypothalamus between the medial/lateral preoptic area and the beginning of the supramammillary nucleus. Cells were flow-sorted based on tdTomato+ fluorescence, and scRNA-Seq was then performed using the 10x Genomics Chromium Single Cell system (v3.0 chemistry), following manufacturer’s guidelines.
Data were processed as described previously (Bell et al., 2020) using Seurat V3 (Stuart et al., 2019) to perform downstream analyses. Expression data were normalized using the Seurat v3.10 “scTransform” function (Hafemeister & Satija, 2017). Low-quality cells were filtered, and initial clustering was performed using default parameters. Initially, the dataset was divided into 3 distinct clusters: SCN neurons, non-SCN neurons, and ependymal cells (see Figure 5). Non-SCN neurons were divided further based on spatial information (based on region-specific markers) derived from previous work (Bell et al., 2020) into 4 additional clusters: ventromedial hypothalamus, preoptic area, dorsomedial hypothalamus, and tuberomammillary nucleus.
FIGURE 5. Main scRNA-seq clusters of mWake+ cells from the hypothalamus.

(a) UMAP plot of mWake+ scRNA-Seq data from Bell et. al. (2020), identifying three main clusters of cells in the hypothalamus: SCN neurons (blue), Non-SCN neurons (green), and ependymal cells (red). (b) Violin plot depicting the expression of key molecular markers within each cluster population. Each row depicts the expression of a single gene, with expression level on the y-axis, and the percentage of the cells expressing at that level forming the width.
Two major data analyses were performed in this study. First, mWake+ neurons identified from our collected cells belonging to individual hypothalamic subregions were extracted and further reclustered to identify different sub-clusters of mWake+ neurons. Reclustering was repeated until the child clusters could not generate any further clusters that had differential expression of neuropeptides and neurotransmitters. Second, we sought to identify mWake+ neurons in existing scRNA-Seq datasets. However, due to its very low expression levels, Ankfn1/mWake is not faithfully detected by droplet-based scRNA-Seq methods, which have limited capture efficiency (Wang, Li, Nelson, & Nabavi, 2019). Thus, in order to identify the distribution of mWake+ neurons in individual hypothalamic regions, key molecular markers of our FACS-sorted mWake+ neurons were used to train existing hypothalamus scRNA-Seq datasets using Garnett (Pliner, Shendure, & Trapnell, 2019). Only scRNA-Seq datasets from male mice were used. To validate this approach, we trained a previously published VMH SMART-Seq dataset (Kim et al., 2019), where Ankfn1/mWake expression could be directly captured. The trained SMART-Seq dataset of putative mWake+ cells was compared to Ankfn1/mWake gene expression and demonstrated 90% concordance in cell distribution with a 2% false positive rate (see Figure 4), suggesting that the training method should efficiently identify mWake+ populations in any hypothalamic dataset. The data training process was then applied to a SCN 10x Genomics and Drop-seq dataset (Wen et al., 2020) and a POA 10x Genomics dataset (Moffitt et al., 2018).
FIGURE 4. Validation of mWake expression identification using key molecular markers.

(a) UMAP plot of single-cells isolated from the VMH by Kim et. al. (2019). (b) UMAP of same data with expression of Ankfn1/mWake in clustered cells shown as color intensity (purple). (c) UMAP plot of same cells with putative mWake+ cells identified by analysis of key molecular markers from mWake+ cells in the VMH of Bell et. al. (2020) colored (purple).
3. Results
3.1. Experimental models for investigating mWAKE expression
To perform a comprehensive examination of mWake expression in the murine brain, we applied three parallel strategies for visualizing mWake mRNA, mWAKE protein, and mWAKE+ cells (Figure 1a–c). We previously used standard chromogenic ISH to identify mWake in the SCN, where its expression is relatively high (Liu et al., 2014). Here, to significantly enhance sensitivity and detect mWake mRNA expression more broadly, we used the RNAscope system (ACD Biosystems) (Wang et al., 2012) (Figure 1a). In order to directly visualize mWAKE protein, we made multiple attempts to generate anti-mWAKE antibodies that could be used for immunostaining, but were unsuccessful (data not shown). We and others similarly failed at producing such antibodies against the Drosophila WAKE protein and a related isoform (Liu et al., 2014; Mauri, Reichardt, Mummery-Widmer, Yamazaki, & Knoblich, 2014), suggesting that this family of proteins may be particularly refractory to this approach. Thus, as an alternative approach, we used CRISPR/Cas9 to generate a V5 epitope-tagged mouse (mWakeV5), where the V5 tag is fused in-frame at the 3’ end of the mWAKE protein, immediately preceding the stop codon (Figure 1b). Lastly, to identify mWAKE+ cells, we used a previously described mWakeCre mouse line (Bell et al., 2020), where exon 5 of the mWake gene is replaced with a cassette containing tdTomato and a split Cre-recombinase, separated by a p2A self-cleaving peptide (Figure 1c).
FIGURE 1. Methods for visualizing mWake expression.

The three main approaches for characterizing mWake expression are shown. (a) mWake mRNA was visualized using RNAscope, a high sensitivity technique for ISH, using probes bridging exons 3 and 4. (b) mWAKE protein was characterized by anti-V5 immunostaining of a transgenic mouse line where an inserted V5 epitope tag was fused to the C-terminus of mWAKE. (c) mWAKE+ cell bodies and processes were labeled by imaging tdTomato native fluorescence in a previously described transgenic mouse line (Bell et al., 2020), where exon 5 was replaced with a cassette containing both tdTomato and Cre-recombinase. Representative images from each approach are depicted. (d) IF using α-V5 antibodies (green) in the SCN of an mWake(V5/+) mouse shows mWAKE-V5 fusion protein in the cytosol. (e) Chromogenic labeling of mWake mRNA (red) via RNAscope ISH in wild-type SCN. (f) SCN neurons filled with tdTomato fluorescence (red) in an mWake(Cre/+) mouse, labelling both the cell bodies as well as the mWAKE+ processes. Images (d) and (f) also include the nuclear counterstain DAPI (blue), while (e) includes a hematoxylin counterstain (purple). The scale bar in (d) is 25 μm and applies to all images.
Each approach provides specific and complementary information about mWake and mWAKE+ cells. mWAKE-V5 allows for visualization of the protein, and mWAKE-V5 signal is primarily found in the cytosol (where mWAKE presumably functions) and is not detected in the nucleus or at synaptic terminals (Figure 1d). Not only does RNAscope directly label mWake mRNA, but because RNAscope signal is strongest in the nucleus in most cells, it is helpful for visualizing mWAKE+ cell bodies in projection-dense regions (Figure 1e). Finally, tdTomato in mWakeCre mice, as a non-native protein untethered to mWAKE localization, fills the cytosol of putative mWAKE+ cells, and is therefore well-suited for visualizing projections of mWAKE+ neurons (Figure 1f). Below, for all of the mWAKE+ regions identified across the brain, we utilized these 3 approaches to characterize mWake expression and mWAKE+ cells.
To examine the specificity of our RNAscope ISH and V5 immunostaining protocol, we compared RNAscope signal between wild-type and mWake mutant SCN tissue and also performed our V5 immunostaining protocol on wild-type mice. As shown in Figure 2a–c, RNAscope signal is markedly reduced in mWake mutants compared to controls, and negligible signal was observed immunostaining wild-type mice with anti-V5 antibodies. To further demonstrate the fidelity of the expression patterns derived from the two transgenic mouse lines, we performed two additional comparisons. First, anti-V5 staining in mWakeV5 mice and native tdTomato fluorescence in mWake(Cre/+) mice were both compared to mWake mRNA expression assessed by RNAscope at the regional level. As described in the figures below, every region exhibiting significant mWake expression by RNAscope also demonstrated mWAKE-V5 and tdTomato signal in mWake(V5/+) and mWake(Cre/+) mice, respectively. Second, we directly examined co-localization of mWAKE-V5 and tdTomato expression at the individual cell level in transheterozygote mWake(V5/Cre) mice. For the majority of regions examined, there was >90% concordance between mWAKE-V5 and tdTomato signal, with a maximum and minimum of 98% and 81% co-labeling, respectively (Figure 2d–y). Together, these data argue that the mWakeV5 and mWakeCre mice serve as valuable models for investigating the expression pattern of mWAKE in the murine brain.
FIGURE 2. Validation of tools used to study mWake expression.

(a) Representative chromogenic RNAscope ISH for mWake mRNA (red) in SCN with hematoxylin counterstain (purple) in (a) wild-type (WT) (n=3) vs (b) mWake mutant (mWakeko) (n=3). The mWake mutant is described in Bell et al., 2020. In (a), the scale bar denotes 100 μm and also applies to (b). (c) Anti-V5 IF staining (green) of SCN with DAPI in a wild-type mouse, demonstrating negligible green signal. Scale bar in (c) denotes 200 μm. In (d-y), images representative of 7 locations with discrete mWake expression were used to assess correlation at the cellular level between mWakeV5 and mWakeCre transgenic models. Representative images from Pir (d-f), SuVe (g-i), SCN (j-l), LSc (m-o), CeA (p-r), cells adjacent to the Re (s-u), and PBG (v-x) are shown. Dashed outline in (j-l) indicates the unilateral portion used for quantification. (d), (g), (j), (m), (p), (s) and (v) Endogenous tdTomato fluorescence (magenta) in mWake(V5/Cre) mice. (e), (h), (k), (n), (q), (t), and (w) Anti-V5 IF staining (cyan) in the same mWake(V5/Cre) mice. (f), (i), (l), (o), (r), (u), and (x) Merged images for counting colabeled cells (white). (y) Colabeling quantification presented as % of V5+ cells with tdTomato fluorescence. Number of tdTomato+ cells and V5+ cells counted: Pir (n=404; n=423), SuVe (n=251; n=281), SCN (n=428; n=408), LSc (n=429; n=467), CeA (n=431; n=449), near Re (n = 430; n=468), PBG (n=246; n=261). Scale bars in (d-x) represent 200 μm. Abbreviations: CeA, central amygdala; LSc, lateral septal center; PBG, parabigeminal nucleus; Pir, piriform cortex; Re, thalamic reuniens nucleus; SCN, suprachiasmatic nucleus; SuVe, superior vestibular nucleus.
As discussed below, our analysis reveals that mWAKE exhibits a restricted, but distributed, expression pattern across the brainstem, subcortical regions, and the cortex (Figure 3). Because of the substantial mWake expression in the hypothalamus, we discuss this region first, followed by other subcortical regions, the brainstem, and the cortex. Finally, we describe mWake expression in areas of the brain that were not easily categorized using standard atlases.
FIGURE 3. Overview of mWAKE expression in the murine brain.

Schematic using selected Paxinos and Franklin coronal plates illustrating areas of significant mWAKE expression, as determined by RNAscope in situ hybridization, mWAKE-V5 immunostaining, and endogenous tdTomato fluorescence in mWake(Cre/+) mice. Areas of patchy or sparse mWAKE expression are denoted by stippled fill, whereas dense expression is indicated by denser fill. A-P coordinates relative to Bregma for the sections are listed above. Abbreviations: 3v-ependymal, ependymal cells of 3rd ventricle; ACc, anterior cingulate cortex; AudC, auditory cortex; BMA, basomedial amygdala; BNST, bed nucleus of the stria terminalis; cc, corpus callosum; CeA, central amygdala; CN, cochlear nucleus; CPu, caudate putamen; DMH, dorsomedial hypothalamus; ICj, islands of Calleja; ICjM, islands of Calleja insula magna; LA, lateral amygdala; LC, locus coeruleus; LH, lateral hypothalamus; LS, lateral septum; MVe, medial vestibular nucleus; nDB, nucleus of the diagonal band; OB(gc), olfactory bulb granule cell layer; PB, parabrachial nucleus; PBG, parabigeminal nucleus; Pir, piriform cortex; Re, thalamic reuniens nucleus; SC, superior colliculus; SCN, suprachiasmatic nucleus; SFO, subfornical organ; SSc, somatosensory cortex; SuVe, superior vestibular nucleus; TMN, tuberomammillary nucleus; vlPAG, ventrolateral periaqueductal gray; VMH, ventromedial hypothalamus; vmPOA, ventromedial preoptic area; and ZI, zona incerta.
3.2. Characterization of mWAKE+ populations in the hypothalamus
Overview
The hypothalamus is a subcortical region involved in the homeostatic and circadian regulation of wide array of physiological processes and behaviors (McKinsey, Ahmed, & Shah, 2018; Saper, Lu, Chou, & Gooley, 2005; Sisley & Sandoval, 2011; Tan & Knight, 2018). mWake exhibits significant expression in multiple regions of the hypothalamus, with notable enrichment in the SCN, the circadian pacemaker in mammals (Bell et al., 2020; Liu et al., 2014; Zhang et al., 2015). Beyond the 3 main approaches outlined above, we also analyzed scRNA-Seq data from mWake+ cells in the hypothalamus to gain deeper insights into the molecular identities of these cells. We previously generated a scRNA-Seq dataset from tdTomato-labeled cells sorted from dissected hypothalami of mWake(Cre/+) mice (Bell et al., 2020), and here we perform additional analyses to further discriminate the identity of mWake+ populations. In particular, we performed location-specific reclustering to sub-divide mWake+ cells within a given hypothalamic region and also identified mWake+ neuronal subsets within previously published scRNA-Seq datasets.
Since single-cell expression profiles in published scRNA-Seq datasets often do not capture mWake due to its low endogenous expression (see Methods), we derived and used key molecular markers for mWake+ hypothalamic neurons to identify putative mWake+ cells in these datasets. Specifically, we are aware of only one published scRNA-Seq dataset from hypothalamic tissue (which used the highly sensitive SMART-Seq protocol on VMH tissue (Kim et al., 2019)) where Ankfn1/mWake expression is captured, and thus mWake+ cells can be directly identified (Figure 4a). Using the expression profiles of our FACS-sorted mWake+ cells, we generated a list of key genetic markers that putatively define mWake-expressing cells without the need for mWake mRNA capture. We found ~90% concordance between the transcriptional profiles of the Ankfn1/mWake-expressing cells from Kim et al. (2019) and those from their dataset we identified as mWake+ using our predictive genetic markers (Figure 4b,c). This finding validates our approach and argues that we should be able to reliably identify mWake+ cells within other published scRNA-Seq datasets.
The UMAP plot containing all sequenced mWake+ cells from our FACS-sorted tdTomato+ dataset reveals three distinct mWake+ clusters containing SCN neuron, non-SCN neuron, and non-neuronal ependymal cell populations (Figure 5a). The mWake+ SCN neuron cluster demonstrates marked enrichment of the neuropeptides vasoactive intestinal peptide (Vip) and gastrin-releasing peptide (Grp), as well as the transcription factors Lhx1 and Six3 (Bedont et al., 2017; Bell et al., 2020; Welsh, Takahashi, & Kay, 2010). The non-SCN mWAKE neurons are a heterogenous population containing both GABAergic or glutamatergic populations (Bell et al., 2020). As discussed below, these non-SCN mWake+ neurons are found in the dorsomedial hypothalamus (DMH), ventromedial hypothalamus (VMH), POA, tuberomammillary nucleus (TMN), and lateral hypothalamus (LH). Finally, the mWake+ ependymal cell group exhibits substantial expression of the ependymal cell markers forkhead box J1 (Foxj1) and retinoic acid receptor responder 2 (Rarres2) (Figure 5b) (Miranda-Angulo, Byerly, Mesa, Wang, & Blackshaw, 2014; Shah et al., 2018).
Suprachiasmatic nucleus
We and others previously demonstrated that mWake mRNA expression is enriched in the SCN (Bell et al., 2020; Liu et al., 2014; Zhang et al., 2015). In mice, the SCN can be roughly divided into a ventrolateral region (as defined by Vip expression), a central region (as defined by Grp expression), and a dorsomedial region (as defined by arginine vasopressin/Avp expression), where the VIP+ and GRP+ regions receive direct projections from intrinsically-photosensitive retinal ganglion cells (ipRGC) in the retina via the retinohypothalamic tract (Moore, Speh, & Leak, 2002; Altimus et al., 2008; Welsh et al., 2010; Yan et al., 2007). Staining for the mWAKE-V5 fusion protein reveals that a substantial number of the central neurons of the SCN express mWAKE protein, and endogenous tdTomato fluorescence indicates these cell bodies are intermingled with axons and processes stemming from mWAKE+ neurons (Figure 6a–c). The density of these cell bodies is highest in the ventral and central regions of the SCN. Additionally, the dorsal apex of the SCN contains a population of tdTomato+ fibers, which likely stem from ventrally-located mWAKE+ neurons, although we cannot rule out other mWAKE+ cells projecting to this region (Figure 6c).
FIGURE 6. Visualization and subclustering of mWAKE+ neurons in the SCN.

(a-c) Representative images of mWake expression in the SCN are shown. (a) Anti-V5 IF staining (green) with DAPI in mWake(V5/+) mice. (b) Chromogenic RNAscope ISH for mWake mRNA (red) with hematoxylin counterstain (purple) in wild-type (WT) mice. (c) Endogenous tdTomato fluorescence (red) in mWake(Cre/+) mice with DAPI. In (a-c), the dashed line outlines the SCN. The asterisks in (c) indicate the tdTomato+ processes in the dorsal SCN. The scale bar in (a) is equivalent to 500 μm, and applies across the row. (d) UMAP plot of mWakeSCN neurons reveals five subgroups with key gene markers: cluster 0 (Vip, Grp, red, n=160 cells); cluster 1 (Rorb, Penk, yellow, n=140 cells); cluster 2 (Grp, Pcp4, green, n=119 cells); cluster 3 (Vip, Penk, blue, n=89 cells); cluster 4 (Vip, Prok2, Nms, purple, n=33 cells). (e) Violin plot depicting the expression of key molecular markers for each of the 5 clusters. Each row depicts the expression of a single gene, with expression level on the y-axis, and the percentage of the cells expressing at that level forming the width. (f-s) Multiplex fluorescent RNAscope in situ hybridization from mWake(Cre/+) SCN showing relative distribution of markers. (f-i) Representative images using Vip (f), tdTomato (g), Prok2 (h) probes, as well as merged image with DAPI (i) are shown. (j) Higher magnification image of the area denoted by the box in (i). Dashed circles highlight Vip+, tdTomato+, Prok2+ cells from cluster 4. (k-n) Representative images using Vip (k), tdTomato (l), Rorb (m) probes, as well as merged image with DAPI (n) are shown. (o) Higher magnification image of the area denoted by the box in (n). Dashed circles highlight Vip−, tdTomato+, Rorb+ cells from cluster 1. (p-s) Representative images using Grp (p), tdTomato (q), Rorb (r) probes, as well as merged image with DAPI (s) are shown. The scale bars in (i), (n), and (s) denote 100 μm, and the scale bars in (j) and (o) denote 25 μm.
Next, we examined the expression profiles of the mWake+ SCN neurons identified from our scRNA-Seq dataset. We previously identified multiple subpopulations of mWake+ SCN neurons directly from the entire hypothalamic population (Bell et al., 2020). Here, we first isolated mWake+ SCN neurons and then further stratified this population to reveal 5 main clusters identified by distinct expression patterns of SCN neuropeptides (Figure 6d). mWakeSCN neurons are generally enriched for Vip and Grp, but do not significantly express Avp (Abrahamson & Moore, 2001; Welsh et al., 2010; Yan et al., 2007) (Figure 6d,e). Two mWakeSCN clusters (clusters 3 and 4) express moderate to high levels of Vip, with little Grp expression. Grp labels ventral and central SCN neurons and is highly expressed by two mWakeSCN clusters (clusters 0 and 2).. Finally, one cluster (cluster 1) does not exhibit significant levels of either Vip or Grp, but instead is enriched for pro-enkephalin (Penk) and retinoic acid-related orphan receptor β (Rorb) (Wen et al., 2020). Additional SCN markers include the following: neuromedin S (Nms) (Lee et al., 2015), which is expressed at high levels in cluster 4; prokineticin 2 (Prok2) (Cheng et al., 2002), which is expressed at moderate to high levels in cluster 4; and synaptotagmin 10 (Syt10) (Husse, Zhou, Shostak, Oster, & Eichele, 2011), which is expressed at moderate to high levels in clusters 1, 3 and 4.
To probe the anatomical relationship between these clusters, we performed multiplex fluorescent RNAscope ISH on mWake(Cre/+) SCN tissue using traditional SCN markers and markers derived from our scRNA-Seq analysis. These data suggest that Vip+ mWake SCN neurons in clusters 3 and 4 likely consist of the dorsal subset of Vip+ neurons (Figure 6f–o). Among these dorsal Vip+ neurons, Prok2 specifically defines cluster 4 (Figure 6g–j). Cluster 1 is identified by the presence of Rorb and the absence of Vip, and appears to be located more dorsally than clusters 3 and 4 (Figure 6k–o). Clusters 0 and 2 highly express Grp, but not Rorb, and are likely found in ventral to central regions of the SCN (Figure 6p–s).
Finally, in order to distinguish mWakeSCN cells within the entire population of SCN neurons, we identified putative mWake+ cells from a published whole-SCN scRNA-Seq dataset and reclustered their data (Figure 7) (Wen et al., 2020). Consistent with our scRNA-seq analyses, the cells from this population which express the key molecular markers for mWake primarily occupy those clusters which express Vip, Grp, and Penk. Taken together, these analyses underscore the diversity of mWakeSCN neuron identity within an anatomically restricted population. Moreover, given the proposed role of Vip+ and Grp+ SCN neurons in light-dependent circadian processes (Herzog, Hermanstyne, Smyllie, & Hastings, 2017; Yan et al., 2007), these findings suggest that mWAKE regulates light-dependent behaviors.
FIGURE 7. Clustering of SCN scRNA-Seq dataset.

UMAP plot of SCN neurons from Wen et. al. (2020), with clustering redrawn and labeled with key molecular identities. The thick red line outlines the clusters which exhibit substantial mWake expression.
Dorsomedial hypothalamus
Outside of the SCN, we also observed mWAKE+ cells throughout the hypothalamus using our mouse models and RNAscope ISH, as well as from spatial information encoded in scRNA-Seq transcript data (Bell et al., 2020). The DMH plays a key role in circadian-dependent arousal and output behaviors, including sleep-wake patterns, locomotor activity, and the timing of feeding (Saper, Lu, Chou, & Gooley, 2005). mWAKE+ neurons within this nucleus exhibit greater spiking frequency during the night compared to the day and promote arousal, likely via outputs to noradrenergic locus coeruleus (LC) neurons and processes broadly projecting throughout the mouse brain (Bell et al., 2020). mWake ISH and staining for V5 reveals cell bodies distributed throughout much of the DMH extending to the posterior aspect, with increased density in the ventral portion (Figure 8a–d). tdTomato-expressing processes are not significantly enriched within the DMH region compared to the rest of the hypothalamus (Figure 8e). We previously demonstrated the broad projection patterns of these neurons, targeting regions including the BF, striatum, brainstem, and the corpus callosum (cc) white matter tract underlying the neocortex (Bell et al., 2020).
FIGURE 8. mWAKE+ cells in the DMH.

Representative images of mWake expression in the DMH are shown. (a-c) Anti-V5 IF staining (green) with DAPI in mWake(V5/+) mice. (d) Chromogenic RNAscope ISH for mWake mRNA (red) with hematoxylin counterstain (purple) in wild-type (WT) mice. (e) Endogenous tdTomato fluorescence (red) in mWake(Cre/+) mice with DAPI. (a, b) DMH, posterior DMH, and surrounding region. Dashed lines outline the DMH and VMH in (a) and the posterior DMH in (b). In (c-e), the dashed outline denotes the boundary of the DMH. Scale bar denotes 200 μm in (a) and (b). In (c), the scale bar is equivalent to 500 μm, and the arrows indicate dorsal (d) and medial (m) directions, and both also apply to (d) and (e). Abbreviations: 3v, third ventricle; DMH, dorsomedial hypothalamus; fx, fornix; VMH, ventromedial hypothalamus.
Our original scRNA-Seq clustering revealed two main subpopulations of mWakeDMH neurons (Bell et al., 2020). Here, we have refined our classification of mWakeDMH neurons (Figure 9a–d) and further separated these two clusters. The original mWakeDMH cluster 0 neurons can be sub-divided into five sub-clusters, all of which are GABAergic (Slc32a1+): two clusters strongly express Calb1, one of which also expresses Nxph1, while the other strongly expresses Nrgn; one cluster expresses Nfix and Trh; and two clusters are defined by Calcr or Ecel1 expression, respectively. Further stratification of mWakeDMH cluster 4 neurons into three groups reveals two strongly glutamatergic (Slc17a6+) subclusters. One of these is enriched for nitric oxide synthase 1 (Nos1), proposed as a marker of hypothalamic neurons involved in regulation of energy homeostasis (Rupp et al., 2018). The other strongly glutamatergic cluster is enriched for Nrn1. The third subcluster is both glutamatergic and GABAergic and enriched for Crabp1 and Cartpt.
FIGURE 9. mWake+ scRNAseq populations in the DMH.

(a) and (c) UMAP plots of two mWakeDMH populations, with 5 and 3 subclusters, respectively. (b) and (d) Violin plots showing expression of key molecular markers for the subclusters shown in (a) and (c), respectively. Each row depicts the expression of a single gene, with expression level on the y-axis, and the percentage of the cells expressing at that level forming the width. For (a) and (b), the original population was named ‘Cluster 0’ in Bell et. al (2020), and the 5 subclusters are defined as cluster 0 (Calb1, Nxph1 red, n=57 cells), cluster 1 (Nfix, Trh, yellow, n=55 cells), cluster 2 (Nrgn, green, n=48 cells), cluster 3 (Calcr, blue, n=24 cells), cluster 4 (Ecel1, purple, n=16 cells). For (c) and (d), the original population was called ‘Cluster 4’ in Bell et. al (2020), and the 3 subclusters are defined as cluster 0 (Ntng1, Nos1, red, n=47 cells), cluster 1 (Nrn1, green, n=36 cells), cluster 2 (Crabp1, blue, n=25 cells).
Ventromedial hypothalamus
The VMH has been implicated in the regulation of a variety of motivated behaviors, including appetitive-drive, aggression, and sexual function (Hashikawa, Hashikawa, Falkner, & Lin, 2017; King, 2006; Yang et al., 2013). mWakeVMH cell bodies, labelled by V5 fusion protein and particularly ISH, are found in the ventrolateral portion of the region, which has previously been implicated in circadian regulation of aggression (Todd et al., 2018) (Figure 10a–c). The VMH is particularly notable for the dense tdTomato+ projections that cover this region (Figure 10d).
FIGURE 10. mWake+ cells and scRNA-Seq populations in the VMH.

Representative images of mWake expression in the VMH are shown. (a) anti-V5 IF staining (green) in a mWake(V5/+) mouse. (b) Anti-V5 IF staining (green) with DAPI in a mWake(V5/+) mouse. (c) Chromogenic RNAscope ISH for mWake mRNA (red) with hematoxylin counterstain (purple) in wild-type (WT) mice. (d) Endogenous tdTomato fluorescence (red) in mWake(Cre/+) mice with DAPI. In (b-d), the dashed line denotes the boundary of the VMH. In (a), the scale bar denotes 200 μm. In (b), the scale bar is equivalent to 500 μm, and the arrows indicate the dorsal (d) and medial (m) directions, and both also apply to (c) and (d). (e) UMAP plot of all cells from Kim et. al. (2019) re-clustered. Clusters where putative mWake+ cells constitute >70% of the population are colored and represent 7 out of 46 identified transcriptional profiles: cluster 31 (Nup62cl, yellow), cluster 34 (Dlk1, Il1rapl2, steel blue), cluster 40 (Scgn, teal blue), cluster 42 (Nr5a1, Glipr1, dark purple), cluster 43 (Nr5a1, Tcf7l2, green), cluster 44 (Nr5a1, Ctxn3, light purple), cluster 45 (Nr5a1, Car8, deep purple). Abbreviations: 3v, third ventricle; VMH, ventromedial hypothalamus; and ZI, zona incerta.
While the low abundance of mWake+ neurons in the VMH prevented further subclustering of our previously defined scRNA-Seq VMH cluster, we identified mWake+ cells from a previously published VMH scRNA-Seq dataset (Kim et al., 2019) as described above. Kim et al. (2019) performed a systematic analysis of VMH neurons using 10x Genomics and SMART-seq scRNA-Seq, combined with seq-FISH, and classified VMH neurons into 46 distinct clusters. Putative mWake+ neurons were broadly distributed throughout these clusters, but 7 of these clusters contained high (>70%) numbers of these neurons (Figure 10e). Of these, four groups were primarily defined by their expression of nuclear receptor subfamily 5 group a member 1 (Nr5a1), and one by secretagogin (Scgn); these groups were largely constrained to the central VMH (Kim et al., 2019). Two additional clusters with high percentages of mWake+ neurons are defined by expression of Nucleoporin-62 C-terminal-like (Nup62cl) and Delta-like 1 homolog (Dlk1), and both primarily consisted of cells from the ventrolateral VMH. Interestingly, despite extensive testing, these individual transcriptionally-defined VMH clusters did not exhibit distinct projection patterns or specific roles in behavior (Kim et al., 2019).
Pre-optic area
The POA occupies the transitional edge of the hypothalamus where its rostral terminus merges with structures of the BF. Circuits in the POA region are involved in thermoregulation, sexually-dimorphic reproductive behaviors, and control of sleep-wake states (Gaus, Strecker, Tate, Parker, & Saper, 2002; Wei et al., 2018; Zhao et al., 2017). Interestingly, we observed no cell bodies (mWake mRNA or V5 staining) and no tdTomato+ processes in the ventrolateral preoptic area (VLPO), a well-established sleep regulatory center (Figure 11a). Instead, cell bodies and processes are found where the BF and hypothalamus meet, with a particularly dense ventromedial grouping immediately rostral to the SCN, nearly lining the ventral portion of the 3v (Figure 11a–d).
FIGURE 11. mWAKE+ cells and scRNA-Seq populations in the POA.

Representative images of mWake expression in the POA are shown. (a, b) Anti-V5 IF staining (green) with DAPI in mWake(V5/+) mice. (c) Chromogenic RNAscope ISH for mWake mRNA (red) with hematoxylin counterstain (purple) in wild-type (WT) mice. (d) Endogenous tdTomato fluorescence (red) in mWake(Cre/+) mice with DAPI. In (b-d), the dashed outlines denote the ventromedial POA. In (a), the scale bar denotes 200 μm. The scale bar in (b) is equivalent to 500 μm and applies to (c) and (d). e) UMAP plot of mWakePOA neurons demonstrating 4 sub-clusters marked by expression of key genes: cluster 0 (Tmem35, Cartpt, red, n=52 cells), cluster 1 (Th, Gal, yellow, n=51 cells), cluster 2 (Cited1, blue, n=49 cells) cluster 3 (Nfix, Cck, purple, n=30 cells). (f) Violin plot depicting the expression of key molecular markers for the clusters shown in (e). Each row depicts the expression of a single gene, with expression level on the y-axis, and the percentage of the cells expressing at that level forming the width. Abbreviations: oc, optic chiasm; VLPO, ventrolateral preoptic nucleus; vmPOA, ventromedial preoptic area.
Our scRNA-Seq reclustering analysis takes the two original POA groups (clusters 1 and 9 (Bell et al., 2020)), and delineates four subgroups of mWakePOA neurons based on expression patterns of POA-relevant genes (Figure 11e,f). These subgroups are all primarily GABAergic. Three of the subclusters express Gal. Gal+ neurons in the POA are thought to be sleep-promoting and located in VLPO (Kroeger et al., 2018). One subcluster is defined by strong Tmem35 and Cartpt expression; another subcluster exhibits significant Cited1 expression; and a third subcluster is identified by Nfix and Cck expression. We next applied our training algorithm to a published scRNA-Seq dataset of all POA neurons (Moffitt et al., 2018). mWake expression is largely localized to four clusters within their population (where mWake+ cells constitute >90% cells) and is found in <10% of cells in the other clusters (Figure 12a,b). All of these groups were GABAergic, with two co-expressing Gal, and the other two expressing Trh or Pnoc. Interestingly, one of our clusters, and two clusters of putative mWakePOA cells, express tyrosine hydroxylase (TH), raising the possibility that mWake may label dopaminergic or noradrenergic neurons.
FIGURE 12. Identification of mWake-expressing cells in the POA.

(a) UMAP plot of all POA neurons from Moffit et. al. (2019), with key genetic markers and glutamatergic/GABAergic identity indicated for each. (b) UMAP plot of all POA neurons from Moffit et. al. (2019), where 4 clusters with >90% putative mWake+ cells highlighted in color. These clusters correspond to ‘cluster 1’ (purple) and ‘cluster 9’ (red) from Bell et. al. (2020), are all GABAergic, and defined by the following markers: Gal and Nts; Gal and Th; Trh and Th; and Pnoc.
Tuberomammillary nucleus
The TMN contains nearly all of the histaminergic neurons in the mammalian brain, and their widespread projections have been implicated in the maintenance of waking states and attentional vigilance (Fujita et al., 2017; Gerashchenko, Chou, Blanco-Centurion, Saper, & Shiromani, 2004). Here, we describe mWake expression in the “TMN region”, which we are defining to include additional cell types beyond the histaminergic neurons. mWake-expressing cell bodies are found in two TMN sub-regions, one which lines the ventral-most portion of the lateral hypothalamus underneath the fornix (fx) (Figure 13a–c), and a medial group adjacent to the third ventricle (3v) above the arcuate nucleus (Figure 13g–i). The highest density of cell bodies as seen by mWake ISH signal and V5 staining are in the medial groups adjacent to the 3v (Figure 13g,h), but the tdTomato+ projections appear densest in the perifornicular area, delineating the boundaries of the white matter tract (Figure 13c). Both the perifornicular and medial regions contain histaminergic neurons, as shown by anti-HDC (histadine decarboxylase) staining, which are distinct from the mWAKE+ neurons. (Figure 13d–f, 13j–l).
FIGURE 13. mWAKE+ cells in the TMN.

Representative images of mWake expression in 2 areas of the TMN are shown (the perifornicular region and the medial 3v region). (a) and (g) Anti-V5 IF staining (green) with DAPI in mWake(V5/+) mice. (b) and (h) Chromogenic RNAscope ISH for mWake mRNA (red) with hematoxylin counterstain (purple) in wild-type (WT) mice. (c) and (i) Endogenous tdTomato fluorescence (red) in mWake(Cre/+) mice with DAPI. The arrows in (a) indicate the dorsal (d) and medial (m) directions and also apply to (b) and (c). (d-f, j-l) mWAKE+ neurons in the TMN are distinct from histaminergic neurons. tdTomato fluorescence (red) (d and j), anti-HDC (green) (e and k), and merged images (f and l) from mWake(Cre/+) are shown. All scale bars denote 500 μm and apply to other panels across a row. Abbreviations: 3v, third ventricle; fx, fornix; HDC, histidine decarboxylase; ot, optic tract; TMN, tuberomammillary nucleus.
The anatomical division of mWakeTMN neurons into two groups appears to be recapitulated by our scRNA-Seq clustering analysis. This evaluation yields only two sub-clusters of mWakeTMN neurons which both express VGlut2, but which can be distinguished by their expression of Trh (cluster 0) or Tac1, Pnoc, Nrgn, and Calb2 (cluster 1) (Figure 14a,b). To characterize the relationship between these clusters and the two anatomical subsets, we used the Allen Brain Atlas ISH database to locate expression of key genes from each cluster within the TMN. Trh expression is densest along the 3v, while Tac1 expression is primarily more ventral and lateral. These data suggest that the scRNA-Seq mWakeTMN cluster 0 subgroup corresponds to the anatomically-defined 3v-adjacent medial group (Figure 13g–i), while the cluster 1 subgroup encompasses the more ventral portion of the TMN (Figure 13a–c). Currently, there are no known functional differences between these anatomically and genetically distinct regions of the TMN.
FIGURE 14. scRNA-Seq defined mWake+ clusters in the TMN.

(a) UMAP plot of mWakeTMN neurons depicting 2 sub-clusters and their key genetic markers: cluster 0 (Trh, blue, n=38 cells), cluster 1 (Tac1, red). (b) Violin plot depicting the expression of key molecular markers for the clusters shown in (a). Each row depicts the expression of a single gene, with expression level on the y-axis, and the percentage of the cells expressing at that level forming the width.
Lateral hypothalamus
We observed sparsely distributed mWAKE+ cell bodies, labeled by anti-V5 and RNAscope ISH areas with dense tdTomato+ processes, throughout the LH (Figures 15a–c). In particular, the dorsolateral quadrant of the LH contains dense mWAKE+ processes, as well as a population of cell bodies. This region is known to be occupied by orexinergic cell bodies (de Lecea et al., 1998). The LH contains a variety of arousal-promoting circuits and cell types in addition to orexin, including wake-promoting populations of both glutamatergic and GABAergic neurons (Heiss, Yamanaka, & Kilduff, 2018; Herrera et al., 2016; Tyree, Borniger, & de Lecea, 2018; Venner, Anaclet, Broadhurst, Saper, & Fuller, 2016).
FIGURE 15. mWake expression in the LH.

(a-c) Representative images of mWake expression in the LH area. (a) Anti-V5 IF staining (green) with DAPI in mWake(V5/+) mice. (b) Chromogenic RNAscope ISH for mWake mRNA (red) with hematoxylin counterstain (purple) in wild-type (WT) mice. (c) Endogenous tdTomato fluorescence (red) in mWake(Cre/+) mice with DAPI. Dashed lines in (a-c) demarcate the edge of the optic tract along the ventral edge of the hypothalamus. The arrows in (a) indicate the dorsal (d) and medial (m) directions. Scale bar denotes 500 μm and applies to other panels across a row. Abbreviations: fx, fornix; LH, lateral hypothalamus; ot, optic tract.
3.3. Subcortical areas expressing mWAKE
Zona incerta
Outside of the hypothalamus, there are a number of subcortical regions that contain mWAKE+ cell-bodies and processes, including the zona incerta (ZI), the BF, the caudate putamen nucleus (CPu), the subparafascicular nucleus (SPFp), the subfornical organ (SFO), and multiple regions within the limbic system. Immediately dorsal to the hypothalamus, mWAKE+ neurons and processes label the ZI, a subthalamic gray matter tract implicated in integration of multisensory inputs, regulation of behavioral outputs, and modulation of plasticity (Figure 16a–c) (Wang, Chou, Zhang, & Tao, 2020). We observed V5 staining and mWake mRNA in cell bodies throughout this tract, as well as tdTomato-fluorescent projections stretching lengthwise across the area. The destinations of projections from mWakeZI neurons remain unclear, but many ZI subregions are defined by their projection pattern and/or role in behavior, such as the sleep-promoting Lhx6+ cells, which extend GABAergic projections to inhibit orexinergic and GABAergic neurons in the LH, and more distant arousal-promoting neuronal subtypes in the midbrain (Liu et al., 2017; Mitrofanis, 2005).
FIGURE 16. mWake expression in subcortical regions.

Representative images of mWake expression in subcortical areas. Images of a ZI (a-c), the nDB (c-f), a CPu (g-i), a SPFp (j-l), and the SFO (m-o) are shown. In (a-c), the dashed line outlines the ZI. In (d-f), thicker dashed lines mark the perimeter of the nDB, and the thinner dashed line encircles the ICjM. Dashed lines outline the SPFp (j-l) and SFO (m-o), respectively. Asterisks label tdTomato+ processes in (c) and (f). “+” symbols in (m-o) indicate mWAKE+ ependymal cells. (a), (d), (g), (j), and (m) Anti-V5 IF staining (green) with DAPI in mWake(V5/+) mice. (b), (e), (h), (k), and (n) Chromogenic RNAscope ISH for mWake mRNA (red) with hematoxylin counterstain (purple) in wild-type (WT) mice. (c), (f), (i), (l), and (o) Endogenous tdTomato fluorescence (red) in mWake(Cre/+) mice with DAPI. The black boxes in (h) and (n) depict the location of the inset in the lower right corner, where the scale bars denote 50 μm. Scale bars in (a), (d), (g), (j), and (m) denote 500 μm and apply to other main panels across a row. Arrows in (a), (g), and (j) indicate the dorsal (d) and medial (m) directions, and apply to (b) and (c), (h) and (i), and (k) and (l), respectively. Abbreviations: 3v, third ventricle; cc, corpus collosum; CPu, caudate putamen; ICjM, Islands of Calleja insula magna; nDB, nucleus of the diagonal band; ot, optic tract; SFO, subfornicular organ; SPFp, subparafascicular nucleus parvicellular part; ZI, zona incerta.
Basal forebrain
The BF comprises a collection of subcortical regions arranged within the generally ventromedial space rostral to the hypothalamus, including the ventral pallidum, nucleus of the diagonal band (nDB), and substantia innominata. These regions contain a mixture of glutamatergic, GABAergic, and cholinergic neurons, which are all involved in maintenance of arousal and cortical synchrony (Anaclet et al., 2015; Kim et al., 2015; Xu et al., 2015). Within the BF, ISH and V5 staining labeled cell bodies distributed along the ventral portion of the nDB extending into the horizontal limbs, but not upwards through the vertical limb (Figure 16d–f). Additionally, tdTomato fluorescence revealed dense projections from mWAKE+ neurons filling the lateral aspects of the nDB where there are few cell bodies (Figure 16f).
Caudate putamen nucleus
In mice, the combined CPu comprises much of the dorsal striatum and is primarily responsible for integrating cortical and sensory information and enabling regulation of voluntary movement (Schroder, Moser, & Huggenberger, 2020). V5+ neurons in the CPu are organized in a lattice-like pattern, where cell bodies are generally distributed at similar distances from each other in three dimensions. tdTomato+ branching processes were observed to fill the spaces between these mWAKE+ cell bodies (Figure 16g–i). This pattern is seen throughout the CPu, bound by the nucleus accumbens on the medial side, with a somewhat higher density along the cc at the dorsolateral edge, the region more strongly associated with sensorimotor integration rather than reward (Voorn, Vanderschuren, Groenewegen, Robbins, & Pennartz, 2004).
Subparafascicular nucleus
Towards the caudal edge of the thalamus, near the junction with the ZI, mWAKE+ neurons label the parvocellular section of the SPFp (Figure 16j–l). The SPFp is implicated in receiving stimuli from genito-sensory inputs, as well as visual and auditory sensory inputs (Coolen, Veening, Wells, & Shipley, 2003). mWake mRNA expression and V5 protein signal was observed in cell bodies within the nucleus. tdTomato+ projections were enriched in the lateral aspect of the nucleus and also comprise columnar tracts underlying the optic tract (ot).
Subfornical organ
A particularly interesting structure containing mWake-expressing cells is the SFO (Figure 16m–o). This circumventricular organ is located along the dorsal edge of the 3v and lacks an effective blood brain barrier due to the presence of fenestrated capillaries. This structural feature enables both osmoregulation and monitoring of hunger and thirst hormones by the SFO (McKinley et al., 2019). mWAKE-V5 signal and mWake mRNA label cell bodies in the SFO, and can also be observed in the ependymal cells lining the 3v (see below, Figure 23) (Del Bigio, 2010).
FIGURE 23. Ependymal cells express mWake.

Representative images of mWake expression in ependymal cells. Images of the 3v (a-c), 4v (d-f), and one lv (g-i) are shown. (a), (d), and (g) Anti-V5 IF staining (green) with DAPI in mWake(V5/+) mice. (b), (e), (h) Chromogenic RNAscope ISH for mWake mRNA (red) with hematoxylin counterstain (purple) in wild-type (WT) mice. (c), (f), and (i) Endogenous tdTomato fluorescence (red) in mWake(Cre/+) mice with DAPI. In all images, “+” indicates mWAKE+ ependymal cells. Black boxes in (b), (e), and (h) indicate the location of the inset in the lower right corner, where the scale bars denote 30 μm. Scale bars in (a), (d), and (g) denote 300 μm and apply to (b) and (c), (e) and (f), and (h) and (i), respectively. Arrows in (g) indicate dorsal (d) and medial (m) directions, and apply to (h) and (i). Abbreviations: 3v, third ventricle; 4v, fourth ventricle; cc, corpus collosum; LSc, lateral septal center; lv, lateral ventricle.
Limbic system
We observed mWake expression in multiple interconnected structures of the limbic system—the lateral septal center (LSc), bed nucleus of the stria terminals (BNST), amygdala, and islands of Calleja (ICj). These integrate external and internal information to regulate emotion and motivation, as well as downstream effects on behavior and memory (Catani, Dell’acqua, & Thiebaut de Schotten, 2013; Sokolowski & Corbin, 2012).
The LSc is broadly involved in regulation of both mood and motivation, acting as a primary relay station within the mesocorticolimbic dopaminergic system as well as other limbic areas (Sheehan, Chambers, & Russell, 2004). Here, we observed a dense band of cell bodies containing mWake ISH and V5 labeling, under the cc and stretching ventrally adjacent to the lateral ventricles, with tdTomato signal filling the dorsolateral portion of the septal area (Figure 17a–d). This group of cell bodies terminates above the nucleus accumbens (NAc) and ICj. There are additional cell bodies sparsely distributed throughout the LSc, but few in the medial region, where dense tdTomato+ projections pass broadly through the septal area and outline the lateral structure of the nDB below. The dorsolateral edge of the LSc, where mWAKE appears to be expressed, has been shown to receive significant catecholaminergic innervation (Lindvall & Stenevi, 1978).
FIGURE 17. Limbic system centers with mWAKE+ cells.

Representative images of mWake expression in brain regions of the limbic system. (a) BNST, LSc, and surrounding area. (b-d) Images of the LSc, with the thicker dashed line outlining the boundary of the LSc, and the thinner dashed line marking the limits of the MS. (e-g) Images of a BNST, encircled by a dashed line. (h-j) Images of an amygdala area, with sub-regions LA, CeA, and BMA denoted by dashed outlines. (k-m) Images of the ICjM, encircled by the thinner dashed line, while the thicker dashed line marks the medial limits of the NAc. (n-p) Images of multiple ICjs, with each individual island outlined by thin dashed lines. (a), (b), (e), (h), (k) and (n) Anti-V5 IF staining (green) with DAPI in mWake(V5/+) mice. (c), (f), (i), (l), and (o) Chromogenic RNAscope ISH for mWake mRNA (red) with hematoxylin counterstain (purple) in wild-type (WT) mice. (d), (g), (j), (m), and (p) Endogenous tdTomato fluorescence (red) in mWake(Cre/+) mice with DAPI. Asterisks in (d), (g), and (j) mark the presence of tdTomato+ fibers and processes. Scale bar in (a) denotes 200 μm. Scale bars in (b), (e), (h), (k), and (n) denote 500 μm and apply to other panels across a row. Arrows in (e), (h), and (n) indicate the dorsal (d) and medial (m) directions, and apply to (f) and (g), (i) and (j), and (o) and (p), respectively. Abbreviations: ac, anterior commissure; BMA, basomedial amygdala; BNST, bed nucleus of the stria terminalis; cc, corpus collosum; CeA, central amygdala; ICj, islands of Calleja; ICjM, islands of Calleja, insula magna; LA, lateral amygdala; LSc, lateral septal center; lv, lateral ventricle; MS, medial septal nucleus; NAc, nucleus accumbens.
mWAKE is also expressed in the BNST, another limbic region which serves as a major output of the amygdala to integrate mood information with ascending internal-state information from the hypothalamus (Crestani et al., 2013; Lebow & Chen, 2016). In this region, ISH and V5 staining revealed clusters of mWAKE+ cell bodies in the dorsolateral BNST, considered to modulate anxiety behaviors and fear conditioning (Duvarci, Bauer, & Paré, 2009) (Figure 17a,e,f). Additionally, a small but dense cluster of tdTomato+ projections sit directly underneath the anterior commissure (ac), which receives extensive medullary noradrenergic innervation (Figure 17g) (Gungor & Paré, 2016).
The amygdala produces emotional salience, which is an important driving force behind many behaviors in humans and rodents (Sokolowski & Corbin, 2012). We observed mWake mRNA, staining for the mWAKE-V5 fusion protein, and tdTomato fluorescence in several subdivisions of the amygdala (Figure 17h–j). There is a prominent cluster of both mWAKE+ cell bodies and processes in the lateral amygdala (LA), with the highest density in the dorsal-most boundary where the external capsule (ec) and cc meet, a region implicated in the acquisition of associative fear learning and its memory storage (Johnson et al., 2008). In the central amygdala (CeA), cell bodies containing mWake mRNA and V5 protein and processes expressing tdTomato line its lateral portion along the ec. An additional cluster of cell bodies containing ISH and V5 signal, along with tdTomato fluorescent projections, is found in the posterior portion of the basomedial amygdala nucleus (BMA) (Figure 17h–j). Both the CeA and BMA have been implicated in acquisition of conditioned defensive responses (Fadok, Markovic, Tovote, & Lüthi, 2018).
The ICj are small clusters of granule cells and interneurons dispersed throughout the olfactory tubercle. These clusters form bidirectional connections with both ascending dopaminergic circuits and olfactory components of the limbic system (De Marchis et al., 2004; Fallon, Riley, Sipe, & Moore, 1978; Hsieh & Puche, 2013). The density and small size of the ICj cells results in strong and distinct signals from the ISH of mWake mRNA, as well as mWAKE-V5 immunolabeling and tdTomato fluorescence, with each of the smaller islands and the larger insula magna (ICjM) containing >90% mWAKE+ neurons (Figure 17n–p). The hippocampus and cingulate cortex are also often considered part of the “limbic system.” As mentioned below, mWAKE expression is not found in the hippocampus (see Discussion), but is seen in the anterior cingulate cortex (see “Cortical” section). The presence of mWAKE+ cells in multiple components of the limbic system suggests that mWAKE may serve a functional role related to emotional arousal.
3.4. mWAKE expression in the brainstem
Midbrain
mWake expression was noted in a number of regions within the brainstem, specifically within the midbrain and pons. In the midbrain, we observed a cluster of neurons with signals for mWake mRNA, as well as V5 and tdTomato proteins, throughout the ventrolateral periaqueductal grey (vlPAG), with the medial-most cells overlapping the dorsolateral extensions of the dorsal raphe (DR). ISH-and V5-positive cell bodies are primarily limited to the rostral half of the vlPAG, with few or no cell bodies ventral to the aqueduct as it enlarges further along the caudal axis (Figure 18a–f). Immunostaining with anti-TPH2 (tryptophan hydryoxlyase 2) demonstrates that the mWAKE+ cells in this region are distinct from the serotonergic cells of the DR (Figure 18g–i).
FIGURE 18. mWake expression in the midbrain.

(a-c) mWAKE-V5 expression in the periqueductal gray at different A-P coordinates relative to Bregma: −4.0 mm (a), −4.5 mm (b), and −4.8 mm (c). (d-f) vlPAG denoted by thicker dashed lines, and DR outlined by a thinner dashed line. (g-i) mWAKE+ neurons in the vlPAG/DR are distinct from serotonergic neurons. (j-l) SC, outlined by the dashed line. (m-o) mWAKE expression in the PBG. (a-c) anti-V5 IF staining (green) in mWake(V5/+) mice. (d), (j), (m) Anti-V5 IF staining (green) with DAPI in mWake(V5/+) mice. (e), (k), (n) Chromogenic RNAscope ISH for mWake mRNA (red) with hematoxylin counterstain (purple) in wild-type (WT) mice. (f), (l), (o) Endogenous tdTomato fluorescence (red) in a mWake(Cre/+) mouse with DAPI. tdTomato fluorescence (red) (g), anti-TPH2 (green) (h), and merged images (i) from mWake(Cre/+) mice are shown. Scale bar in (a) denotes 200 μm and applies to (b) and (c). All other scale bars denote 500 μm and apply to other panels across a row. Arrows in (m) indicate the dorsal (d) and medial (m) directions, and apply to (n) and (o). Asterisks in (l) label tdTomato+ fibers. Abbreviations: aq, aqueduct; DR, dorsal raphe; PBG, parabigeminal nucleus; SC, superior colliculus; TPH2, tryptophan hydroxylase 2; vlPAG, ventrolateral periaqueductal gray.
Along the tectum of the mammalian midbrain, the dorsal-most portion of the superior colliculus (SC) contains a band of cell bodies, as visualized by mWake mRNA ISH and V5 staining, as well as significant tdTomato+ fibers (Figure 18j–l). This superficial layer of the SC receives afferent projections from both retinal ganglion cells (RGCs) and the visual cortex, which meet in the visually-mapped laminae of the SC, enabling tuning of responses to sensorimotor stimuli (Ito & Feldheim, 2018; Zhao, Liu, & Cang, 2014). Interestingly, the SC is one of the few regions with significant connectivity differences between mice and primates, with only 10% of RGCs projecting to the SC in primates compared to 80% in mice, although there is no evidence that the SC is composed of different cellular and neuronal populations between species (Dhande & Huberman, 2014; Ito & Feldheim, 2018). In addition, the parabigeminal nucleus (PBG) is generally considered a satellite region of the superficial SC. The PBG exhibits dense labeling of mWAKE+ neurons as demonstrated by mWake ISH and V5 staining, as well as interwoven tdTomato+ processes (Figure 18m–o) (Graybiel, 1978).
Pons
In the pons, mWake mRNA- and mWAKE-V5-expressing cells cluster beneath the lateral edge of the 4th ventricle (4v), with groups on both the medial and lateral side of the fiber tract of the superior cerebellar peduncle (scp), and prominent tdTomato+ projections stretching across the scp (Figure 19a–d). The most medial of these cells intermingle with the lateral portion of the noradrenergic LC region, which regulates arousal, attention, and wakefulness (Figure 19e–h) (Schwarz & Luo, 2015). Other mWAKE-V5+ cell bodies and tdTomato+ projections located around the scp and anterior to the LC are located within the parabrachial nucleus (PB) (Figure 19i–k). Specifically, mWake expression labels both the dorsolateral and medial PB regions, which can produce a persistent coma-like state in rats when lesioned (Fuller, Sherman, Pedersen, Saper, & Lu, 2011). In contrast, there is a distinct absence of mWake mRNA, mWAKE-V5, and tdTomato protein signal in the external lateral subsection of the PB, involved in the hypercapnic response to noxious stimuli (Carter, Soden, Zweifel, & Palmiter, 2013; Kaur et al., 2013).
FIGURE 19. mWake expression in the pons.

(a) The LC and surrounding region. (b-d) LC area encircled by a dashed line. (e) mWAKE+ neurons are near the LC. (f-h) mWAKE+ neurons near the LC are distinct from noradrenergic neurons. (i-k) PB, with the entire area encircled by the thicker dashed line, and the PBdl, PBe, and PBm subregions outlined by thin dashed lines. (a), (b), and (i) Anti-V5 IF staining (green) with DAPI in mWake(V5/+) mice. (c, j) Chromogenic RNAscope ISH for mWake mRNA (red) with hematoxylin counterstain (purple) in wild-type (WT) mice. (d, k) Endogenous tdTomato fluorescence (red) in mWake(Cre/+) mice with DAPI. (e) anti-TH (green), tdTomato fluorescence (red), and DAPI in mWake(Cre/+) mice. tdTomato fluorescence (red) (f), anti-TH (green) (g), and merged images (h) from mWake(Cre/+) mice are shown. Scale bars in (a) and (e) denote 200 μm. Scale bars in (b), (f), and (i) denote 500 μm and apply to other panels across a row. Arrows in (b) and (i) indicate the dorsal (d) and medial (m) directions, and apply to (e) and (f), and (j) and (k), respectively. Asterisks in (d) label tdTomato+ fibers. Abbreviations: 4v, fourth ventricle; aq, aqueduct; DR, dorsal raphe; LC, locus coeruleus; PBdl, dorsolateral parabrachial nucleus; PBe, external parabrachial nucleus; PBm, medial parabrachial nucleus; scp, superior cerebellar peduncle; TH, tyrosine hydroxylase.
We observed additional mWake signals in multiple regions of the brainstem involved in sensory processing and integration. In the auditory-processing cochlear nucleus (CN), mWAKE+ cells, as visualized by V5 immunostaining and RNAscope, appear to occupy both the ventral and dorsal subdivisions, which are involved in identifying sound localization and source, but it is unclear if mWAKE+ cells are limited to any particular layer within the CN (Figure 20a–c) (Mao, Montgomery, Kubke, & Thorne, 2015; May, 2000; Shore & Zhou, 2006). mWake mRNA, V5 staining, and tdTomato fluorescence also indicate the presence of mWAKE+ neurons and their projections in the inferior colliculus (IC), the main midbrain structure for processing aural information communicated between the sensory receptive regions and the auditory cortex (Figure 20d–f) (Aitkin, 1986). These cell bodies are primarily limited to the medial aspect of the IC, with tdTomato+ projections enriched along the tectum.
FIGURE 20. Sensory-related regions containing mWake expression.

Representative images of mWake expression in sensory-related areas of the brainstem. Images of a CN (a-c), IC (d-f), SuVe (g-i), and MVe (j-l) are shown. In (a-c), the dashed line outlines the CN. In (d-f), the thicker dashed line outlines the IC, which is divided into medial and lateral portions by the thinner dashed line. In (g-i), the dashed line encircles the SuVe. (a), (d), (g), and (j) Anti-V5 IF staining (green) with DAPI in mWake(V5/+) mice. (b), (e), (h), and (k) Chromogenic RNAscope ISH for mWake mRNA (red) with hematoxylin counterstain (purple) in wild-type (WT) mice. (c), (f), (i), and (l) endogenous tdTomato fluorescence (red) in mWake(Cre/+) mice with DAPI. The black boxes in (b), (h), and (k) highlight areas of ISH signal. Asterisks in (f) mark tdTomato+ fibers. Scale bars in (a), (d), (g), and (j) denote 500 μm and apply to other panels across a row. Arrows in (a), (d), (g) and (j) indicate the dorsal (d) and medial (m) directions, and apply to other panels across a row. Abbreviations: 4v, fourth ventricle; CN, cochlear nucleus; IC, inferior colliculus; MVe, medial vestibular nucleus; scp, superior cerebellar peduncle; SuVe, superior vestibular nucleus.
We further observed two anatomically distinct populations of mWake-expressing neurons within the brainstem vestibular nuclei, involved in kinesthesia and the maintenance of balance. mWake mRNA and mWAKE-V5 protein marked cell bodies found clustered in the superior vestibular nucleus (SuVe) directly under the scp (Figure 20g–i). Similarly, signals from mWAKE+ cell bodies are scattered in the larger medial vestibular nucleus (MVe), directly caudal to the SuVe, where we observed tdTomato+ processes innervating much of the area directly ventral to the lateral wing of the 4v (Figure 20j–l).
3.5. Cortical regions with mWAKE+ cells
In addition to subcortical and brainstem expression, mWAKE is observed in several structures in both the paleocortex and neocortex. In the olfactory transduction pathway, the olfactory bulb (OB) serves as the primary relay, receiving inputs directly from receptor neurons of the olfactory endothelium and transmitting scent information to the olfactory cortex and tubercle for processing (Nagayama, Homma, & Imamura, 2014). We observed substantial labeling of mWAKE+ cell bodies, as evidenced by ISH and V5 staining, in the granule layer of the OB, which is comprised mostly of inhibitory interneurons (Figure 21a,b). However, there are also extensive tdTomato+ processes innervating the superficial glomeruli layer, where mitral and tufted cells synapse with the primary olfactory receptor axons, suggesting a role for mWAKE+ neurons in the initial processing of odor sensation (Figure 21c) (Nagayama, Homma, & Imamura, 2014).
FIGURE 21. mWAKE+ expression in the paleocortex.

Representative images of mWake expression in 2 structures of the paleocortex. (a-c) OB, with dashed line indicating the outer limits of the granule cell layer. (d-f) Pir, with dashed lines separating layers I, II, and II. (a) and (d) Anti-V5 IF staining (green) with DAPI in mWake(V5/+) mice. (b) and (e) Chromogenic RNAscope ISH for mWake mRNA (red) with hematoxylin counterstain (purple) in wild-type (WT) mice. (c) and (f) Endogenous tdTomato fluorescence (red) in mWake(Cre/+) mice with DAPI. In (c) and (f), asterisks indicate tdTomato+ processes. Black box in (b) depicts the location of the inset in the lower right corner, where the scale bar denotes 50 μm. Scale bars in (a) and (d) denote 500 μm, and apply to other main panels across a row. Arrows in (d) indicate the dorsal (d) and medial (m) directions, and apply to (e) and (f). Abbreviations: OB, olfactory bulb; Pir, piriform cortex.
The piriform area (Pir) contains one of the densest layers of mWAKE+ cell bodies seen throughout the brain. As shown by anti-V5 labeling, ISH, and tdTomato fluorescence, these neurons broadly occupy pyramidal layer II, with tdTomato+ projections extending outwards through the superficial layer I, as well as inwards through the less dense layer III (Figure 21d–f). Pyramidal cells of Pir layer II have been shown to synapse with granule cells of the OB and ICj, as well as with multiple olfactory subcircuits of the amygdala, to process and integrate olfactory information with memory and emotional salience (Bekkers & Suzuki, 2013; Illig & Wilson, 2009; Soudry, Lemogne, Malinvaud, Consoli, & Bonfils, 2011).
In the neocortex, mWake expression is restricted to several discrete locations. Throughout much of the somatosensory (SS) cortex, including the primary (SSp), barrel field (SSb), and supplemental areas (SSs), cell bodies containing mWake mRNA and V5 protein label layer IV, while tdTomato-filled processes extend through the more superficial layers I, II, and III (Figure 22a–d). This thin band of cell bodies is nearly absent in layer IV of the more caudal parietal and auditory areas. Although the morphology of mWAKE+ cells is not easily discerned in these dense bands, most of layer IV of the SSp are comprised of stellate cells (~75%), rather than the pyramidal neurons which comprise the majority in other cortical areas (Scala et al., 2019). The auditory (AudC) and temporal (TeA) cortical areas contain dense labeling of neurons with mWake mRNA, V5 protein, and tdTomato which nearly fill layers II/III (Figure 22e–g). The anterior-posterior distribution of this cortical cluster is delimited anteriorly by the visceral and gustatory cortical areas, and posteriorly by the entorhinal cortical areas. Within the central sulcus above the medial transmission of the cc, the anterior cingulate cortex (ACC) has been implicated as a central node for cognitive processes involving motivation and as a hub for social interactions (Apps, Rushworth, & Chang, 2016; Holroyd & Yeung, 2012). mWAKE+ cell bodies are observed in layer IV of the ventral portion of this structure, with processes tagged with tdTomato extending medially (toward the central sulcus) through the superficial layers (Figure 22h–k). In addition to the mWAKE+ cortical cell bodies, the tdTomato fluorophore labels the cc underneath these cortical regions, suggesting that axons emanating from mWAKE+ neurons are present in transhemispheric and subcortical-cortical axonal pathways (Figure 22l).
FIGURE 22. mWake expression within the neocortex.

Representative images of mWake expression in the neocortex. (a-c) Somatosensory area of the cortex, with dashed lines separating the SSp, SSb, and SSs, and solid lines delineating layers I, II/III, IV, V, and VI. (d) Higher-magnification image of the SSb area containing tdTomato+ cell bodies and processes, with cortical layers labeled. (e-g) AudC and TeA, separated by dashed lines with cortical layers I, II/III, IV, V, and VI separated by solid lines. (h-j) Bilateral ACC, with a dashed line separating the dorsal (d) and ventral (v) portions. (k) A representative higher-magnification image of the tdTomato+ projections from the approximate region marked by the asterisks in (j). (l) Higher-magnification image of tdTomato fluorescence in the cc. (a), (e), and (h) Anti-V5 IF staining (green) with DAPI in mWake(V5/+) mice. (b), (f), and (i) Chromogenic RNAscope ISH for mWake mRNA (red) with hematoxylin counterstain (purple) in wild-type (WT) mice. (c), (d), (g), (j), (k), and (l) Endogenous tdTomato fluorescence (red) in mWake(Cre/+) mice with DAPI. In (c), (d), (j), and (l), asterisks indicate tdTomato+ processes. The black box in (b) depicts the location of the inset in the upper right corner, where the scale bar denotes 100 μm. The black box in (i) highlights ISH signal along the dorsal-ventral axis of the ACC. Scale bar in (a) denotes 1 mm, and applies to (b) and (c). Scale bars in (d) and (l) denote 300 μm. Scale bars in (e) and (h) denote 500 μm and apply to (f) and (g), and (i) and (j), respectively. Scale bar in (k) denotes 100 μm. Arrows in (a) and (e) indicate the dorsal (d) and medial (m) directions, and apply to (b), (c), (f) and (g). Abbreviations: ACC, anterior cingulate cortex; AudC, auditory cortex; cc, corpus callosum; SSb, somatosensory cortex barrel region; SSp, primary somatosensory cortex; SSs, supplemental somatosensory cortex; TeA, temporal cortex area.
3.6. Ependymal cells
mWAKE expression is not solely restricted to neurons. mWAKE-V5, mWake mRNA, and tdTomato protein were also found in ependymal cells, which form the walls of the ventricular system and regulate access between the brain parenchyma and the cerebrospinal fluid (CSF) (Jimenez, Dominguez-Pinos, Guerra, Fernandez-Llebrez, & Perez-Figares, 2014) (Figure 23a–i). In the hypothalamus, we observed mWake mRNA, as well as anti-V5 and tdTomato signal, in these cells lining the dorsal portion of the 3v (Figure 23a–c), and they constitute a significant cluster in our hypothalamic scRNAseq data, identified by high levels of Foxj1 expression (Figure 5). However, it is worth noting that these ependymal cells are likely overrepresented in our scRNA-Seq dataset, since they tend to survive the sorting procedure better than neurons (Saxena et al., 2012). In addition to the 3v, we noted similar expression of mWake mRNA, mWAKE-V5, and tdTomato in ependymal cells lining the lv and 4v (Figure 23d–i). These findings are somewhat reminiscent of the expression of mWAKE in the SFO (Figure 16m–o), which together suggest a potential role for mWAKE in osmoregulation.
3.7. mWAKE is expressed in additional structures
To identify regions and structures labelled by mWAKE, we relied on standard atlases in the field: Paxinos and Franklin’s The Mouse Brain in Stereotaxic Coordinates and the Allen Brain Institute’s Reference Mouse Brain Atlas. Using these references, we were able to clearly catalog mWAKE expression, with two possible exceptions. The first sits at the junction of the hypothalamic and thalamic regions, directly above the 3v and delimited below by the paraventricular nucleus, which lacks mWAKE expression (Figure 24a–c,g). The thalamic structure in this area, the reuniens nucleus (Re), appears to delineate the region lacking mWAKE seen in our RNAscope, anti-V5, and tdTomato fluorescence imaging. This mWAKE labeling likely belongs to the xiphoid nucleus (Xi) of the thalamus, although we have not found clear examples of the dorsal bifurcation seen in Figure 24a–c. The other undefined cluster of mWAKE+ cells appears at the junction of the paleocortex and neocortex, and forms a round structure, which is tubular in the rostral-caudal axis. This structure is located lateral to the LA (Figure 24d–f,h). This cell group appears to be in the perirhinal cortical (PRh) region. Although there are relatively few mWAKE+ cells in this cluster, its location is remarkably consistent between hemispheres and between animals.
FIGURE 24. mWake expression in additional regions.

Representative images of mWake expression in 2 additional structures. Images of mWAKE expression in a supra-hypothalamic region likely Xi (a-c) and a round mid-cortical cluster, likely in the PRh (d-f), encircled by a dashed line. In addition, broader view images of mWAKE expression are shown for the supra-hypothalamic region (g) and the mid-cortical cluster (h). In (g), dashed lines indicate the Xi and the surrounding Re, and mWAKE expression in the aZI and anterolateral hypothalamus is also noted. In (h), dashed lines outline the PRh and encircle the DEn. (a), (d), (g), and (h) Anti-V5 IF staining (green) with DAPI in mWake(V5/+) mice. (b) and (e) chromogenic RNAscope ISH for mWake mRNA (red) with hematoxylin counterstain (purple) in wild-type (WT) mice. (c) and (f) Endogenous tdTomato fluorescence (red) in mWake(Cre/+) mice with DAPI. The scale bars in (a) and (d) denote 500 μm, and apply to other panels across a row. Scale bars in (g) and (h) denote 200 μm. Arrows in (d) indicate the dorsal (d) and medial (m) directions, and apply to (e) and (f). Abbreviations: 3v, third ventricle; aZI, anterior zona incerta; DEn, dorsal endopiriform nucleus; f, fornix; LA, lateral amygdala; PRh, perirhinal area of the cortex; PVN, paraventricular nucleus; Re, thalamic reuniens nucleus; Xi, xiphoid nucleus.
4. DISCUSSION
In this study, we performed a brain-wide analysis of mWake expression using three complementary approaches that allow visualization of mWake mRNA, protein, and cellular processes. Overall, we show that mWAKE+ cell bodies are found in a restricted pattern, but distributed across multiple levels of the brain, including the brainstem, subcortical, and cortical regions. Although mWake expression can be observed in specific areas in multiple brain regions, there are locations distinctly lacking mWAKE expression. For example, in the brainstem, there is little to no clear mWAKE expression in the medulla; while we did observe sparse V5-expressing cells within the dorsomedial aspect, it was unclear whether this represented bona fide mWAKE expression, as the ISH for mWake mRNA and tdTomato reporter did not label this region. In general, the thalamus is largely devoid of mWAKE+ neurons, with the exception of the SPFp and probably the Xi. However, the thalamus is intensely labeled with tdTomato+ processes, suggesting signaling influenced by mWAKE passes through and connects to thalamic circuits. Interestingly, despite its presence in several areas with direct connections to the hippocampus (e.g., amygdala, BF), we observed no evidence of mWake expression in any components of the hippocampus. mWake is also not found in most broad neocortical regions, such as the frontal or occipital lobes, as well as the motor cortex. Moreover, in those cortical regions containing mWAKE+ cells, they are limited almost exclusively to Layer II/III or IV. In contrast to the discrete labeling of mWAKE+ cells in specific regions, tdTomato labeling observed in mWakeCre mice was often diffusely distributed throughout much of the brain, suggesting that mWAKE-expressing cells receive or transmit information broadly; this conclusion is supported by our previous projection tracing of mWAKEDMH neurons (Bell et al., 2020).
To complement these imaging experiments, we also performed detailed analyses of scRNA-Seq data from hypothalamic mWake+ cells. We chose the hypothalamus because this region contains the highest number of mWake-expressing sub-regions throughout the brain and likely contains the highest overall number of mWAKE+ cells. These analyses reveal the diversity of cell types that express mWAKE and set the stage for future, highly refined dissections of mWAKE+ sub-circuit function. Of particular interest is the characterization of mWake expression in the SCN. Here, mWake substantially overlaps with Vip and Grp expression. Our molecular analyses coupled with multiplex fluorescent ISH analyses suggests that specific mWake+ clusters can be found among the dorsal susbset of Vip+ neurons, further dorsal and centrally located Rorb+, Vip− neurons, and overlapping with Grp+ neurons. Grp+ and especially Vip+ neurons have been shown to receive direct projections from ipRGCs and are thought to mediate light-sensitive circadian behaviors such as photoentrainment (Jones, Simon, Lones, & Herzog, 2018; Mazuski et al., 2018; Welsh et al., 2010; Yan et al., 2007). Strikingly, this parallels the expression and function of WAKE in the large ventrolateral (l-LNv) neurons in Drosophila (Liu et al., 2014). The l-LNvs are photorecipient clock neurons in flies that are weakly rhythmic and send major projections to the small ventrolateral (s-LNv) neurons, which function as master circadian pacemaker neurons in constant darkness (Nitabach & Taghert, 2008). Similarly, in mice the photorecipient Vip+ and Grp+ SCNc neurons are weakly rhythmic and project to the strongly rhythmic SCNs neurons (Abrahamson & Moore, 2001; Welsh et al., 2010; Yan et al., 2007). These observations suggest that mWake in the SCN may serve a special role in light-dependent circadian behaviors in mammals, the details of which remain to be elucidated.
Our previous studies of WAKE in fruit flies and mWake in mice (Bell et al., 2020; Liu et al., 2014; Tabuchi et al., 2018) suggest that these molecules act downstream of the circadian clock to upregulate specific receptors or channels and inhibit neural excitability at night. Based on these prior findings, we speculate that mWake might specifically label neurons involved in rhythmic processes or behaviors. For example, we have previously shown that, outside of the SCN, mWAKE+ neurons in the DMH also exhibit cyclical firing, and loss of mWAKE in these cells selectively promotes locomotor activity at night (Bell et al., 2020). Although yet unstudied, it is plausible that a similar situation exists for mWAKE+ neurons across the brain. Interestingly, while mWake generally labels neurons, non-neuronal ependymal cells lining the 3v, lv, and 4v are also largely mWAKE+. These glial cells form a partial barrier between the CSF and brain parenchyma and assist with osmoregulation, as well as regulation of transport for various molecules between the brain and CSF compartments (Jimenez et al., 2014). Recently, in Drosophila, permeability of the blood-brain barrier has been shown to be under circadian control, likely via specific multidrug transporter molecules (Cuddapah, Zhang, & Sehgal, 2019; Zhang, Yue, Arnold, Artiushin, & Sehgal, 2018). Interestingly, ependymal cells in mammals have been shown to exhibit rhythmic clock gene expression (Guilding, Hughes, Brown, Namvar, & Piggins, 2009; Wen et al., 2020). Thus, the expression of mWake in ependymal cells and its role as a clock output molecule raise the possibility that the permeability of the brain/CSF interface in mammals is also modulated by circadian influences, possibly through mWAKE.
In the mouse brain, mWake is expressed in a limited number of neurons that are distributed across a variety of regions. Many of these regions can be loosely grouped into different functional systems. For instance, the DMH, TMN, LH, and PB have all been implicated in regulating arousal, while the amygdala, LSc, BNST, and ICj can be considered part of the limbic system. In addition, several regions (e.g., OB, CN, IC, SuVe, MVe) are directly connected to a role in sensory perception and processing. These different systems may be functionally distinct and unrelated. However, the prominent hyperarousal phenotype seen in mWake mutants makes it tempting to speculate that these mWAKE+ circuits may be tied to the perception of arousal. That is, in addition to “classical” arousal regions, we hypothesize that mWAKE functions in the limbic and sensory systems to enable tuning of “emotional” and “sensory” arousal in a rhythmic manner.
In addition, mWake expression is often found in multiple nodes along a circuit pathway. For example, mWake labels several components of the limbic system, all of which form a highly interconnected network with bidirectional pathways (Catani et al., 2013; Sokolowski & Corbin, 2012). Furthermore, mWake is also found in both the OB and its downstream target (Pir), as well as the CN and its direct (IC) and indirect (AudC) downstream targets. A similar situation exists for Drosophila WAKE, which acts at multiple levels of the clock network (i.e., l-LNv and DN1p) (Liu et al., 2014; Tabuchi et al., 2018). Although the function of mWAKE expression in multiple components of a given circuit pathway remains unclear, one possibility may be to amplify rhythmic control of circuit activity. In summary, our systematic characterization of mWake expression in the mouse brain lays the foundation for future investigations into the role of this protein in a variety of neural circuits and behaviors. We hypothesize that mWAKE+ cells are particularly sensitive to intrinsic circadian input and that they regulate light-dependent circadian behaviors, arousal, emotional valence, and sensory perception. Future studies using intersectional approaches with the mWakeCre line should help unravel the specific circuit mechanisms underlying rhythmic modulation of these processes.
Acknowledgments
We thank members of the Wu Lab for discussion. This work was supported by a Maryland Stem Cell Research Fund (2019-MSCRFF-5124, D.W.K), NIH grants R01DK108230 (S.B.) and R01NS094571 (M.N.W.), and a NINDS Center grant NS050274 for generation of the mWakeV5 mouse line and access to confocal microscopes. The graphical abstract was created using Biorender.com.
List of Abbreviations
- I-VI
layers of the cortex
- 3v
third ventricle
- 4v
fourth ventricle
- ac
anterior commissure
- ACC
anterior cingulate cortex
- aq
cerebral aqueduct
- AudC
auditory cortex
- aZI
anterior zona incerta
- BF
basal forebrain
- BMA
basomedial amygdala
- BNST
bed nucleus of the stria terminalis
- cc
corpus callosum
- CeA
central amygdala
- CN
cochlear nucleus
- CPu
caudate putamen
- DEn
dorsal endopiriform nucleus
- DMH
dorsomedial hypothalamus
- DR
dorsal raphe
- ec
external capsule
- fc
fornicular column
- fx
fornix
- IC
inferior colliculus
- ICj
islands of Calleja
- ICjM
islands of Calleja insula magna
- LA
lateral amygdala
- LC
locus coeruleus
- LH
lateral hypothalamus
- LSc
lateral septal center
- lv
lateral ventricle
- MS
medial septum
- MVe
medial vestibular nucleus
- NAc
nucleus accumbens
- nDB
nucleus of the diagonal band
- OB
olfactory bulb
- oc
optic chiasm
- ot
optic tract
- PBdl
dorsolateral parabrachial nucleus
- PBe
external parabrachial area
- PBG
parabigeminal nucleus
- PBm
medial parabrachial nucleus
- Pir
piriform cortex
- POA
preoptic area
- PRh
perirhinal cortex
- PVN
paraventricular nucleus
- Re
thalamic reuniens nucleus
- RGC
retinal ganglion cell
- SC
superior colliculus
- scp
superior cerebellar peduncle
- SCN
suprachiasmatic nucleus
- SFO
subfornical organ
- SPFp
parvocellular subparafascicular nucleus
- SSp
primary somatosensory cortex
- SSb
barrel field somatosensory cortex
- SSs
supplemental somatosensory cortex
- SuVe
superior vestibular nucleus
- TeA
temporal cortical area
- TMN
tuberomammillary nucleus
- vlPAG
ventrolateral periaqueductal gray
- VMH
ventromedial hypothalamus
- vmPOA
ventromedial preoptic area
- Xi
xiphoid nucleus
- ZI
zona incerta
Footnotes
Data Availability Statement
The data that support the findings of this study are available from the corresponding author upon reasonable request.
References
- Abrahamson EE, & Moore RY (2001). Suprachiasmatic nucleus in the mouse: retinal innervation, intrinsic organization and efferent projections. Brain Res, 916(1–2), 172–191. doi: 10.1016/s0006-8993(01)02890-6 [DOI] [PubMed] [Google Scholar]
- Aitkin LM (1986). The Auditory Midbrain. Humana Press, Clifton, NJ. [Google Scholar]
- Altimus CM, Guler AD, Villa KL, McNeill DS, Legates TA, & Hattar S (2008). Rods-cones and melanopsin detect light and dark to modulate sleep independent of image formation. Proc Natl Acad Sci U S A, 105(50), 19998–20003. [DOI] [PMC free article] [PubMed] [Google Scholar]
- Anaclet C, Pedersen NP, Ferrari LL, Venner A, Bass CE, Arrigoni E, & Fuller PM (2015). Basal forebrain control of wakefulness and cortical rhythms. Nat. Commun, 6, 8744. doi: 10.1038/ncomms9744 [DOI] [PMC free article] [PubMed] [Google Scholar]
- Apps MAJ, Rushworth MFS, & Chang SWC (2016). The Anterior Cingulate Gyrus and Social Cognition: Tracking the Motivation of Others. Neuron, 90(4), 692–707. doi: 10.1016/j.neuron.2016.04.018 [DOI] [PMC free article] [PubMed] [Google Scholar]
- Auer TO, & Benton R (2016). Sexual circuitry in Drosophila. Curr Opin Neurobiol, 38, 18–26. doi: 10.1016/j.conb.2016.01.004 [DOI] [PubMed] [Google Scholar]
- Bedont JL, LeGates TA, Buhr E, Bathini A, Ling JP, Bell B, … Blackshaw S (2017). An LHX1-Regulated Transcriptional Network Controls Sleep/Wake Coupling and Thermal Resistance of the Central Circadian Clockworks. Curr. Biol, 27(1), 128–136. doi: 10.1016/j.cub.2016.11.008 [DOI] [PMC free article] [PubMed] [Google Scholar]
- Bekkers JM, & Suzuki N (2013). Neurons and circuits for odor processing in the piriform cortex. Trends Neurosci., 36(7), 429–438. doi: 10.1016/j.tins.2013.04.005 [DOI] [PubMed] [Google Scholar]
- Bell BJ, Liu Q, Kim DW, Lee SS, Liu Q, Blum ID, … Wu MN (2020). A Clock-Driven Neural Network Critical for Arousal. bioRxiv, doi: 10.1101/2020.03.12.989921. [DOI] [Google Scholar]
- Bianchi L (1895). The Functions of the Frontal Lobes. Brain, 18, 497–522. [Google Scholar]
- Carter ME, Soden ME, Zweifel LS, & Palmiter RD (2013). Genetic identification of a neural circuit that suppresses appetite. Nature, 503(7474), 111–114. doi: 10.1038/nature12596 [DOI] [PMC free article] [PubMed] [Google Scholar]
- Catani M, Dell’acqua F, & Thiebaut de Schotten M (2013). A revised limbic system model for memory, emotion and behaviour. Neurosci. Biobehav. Rev, 37(8), 1724–1737. doi: 10.1016/j.neubiorev.2013.07.001 [DOI] [PubMed] [Google Scholar]
- Cheng MY, Bullock CM, Li CY, Lee AG, Bermak JC, Belluzzi J, … Zhou QY (2002). Prokineticin 2 transmits the behavioural circadian rhythm of the suprachiasmatic nucleus. Nature, 417(6887), 405–410. doi:Doi 10.1038/417405a [DOI] [PubMed] [Google Scholar]
- Coolen LM, Veening JG, Wells AB, & Shipley MT (2003). Afferent connections of the parvocellular subparafascicular thalamic nucleus in the rat: evidence for functional subdivisions. J. Comp. Neurol, 463(2), 132–156. doi: 10.1002/cne.10739 [DOI] [PubMed] [Google Scholar]
- Crestani CC, Alves FH, Gomes FV, Resstel LB, Correa FM, & Herman JP (2013). Mechanisms in the bed nucleus of the stria terminalis involved in control of autonomic and neuroendocrine functions: a review. Curr. Neuropharmacol, 11(2), 141–159. doi: 10.2174/1570159X11311020002 [DOI] [PMC free article] [PubMed] [Google Scholar]
- Cuddapah VA, Zhang SL, & Sehgal A (2019). Regulation of the Blood-Brain Barrier by Circadian Rhythms and Sleep. Trends Neurosci, 42(7), 500–510. doi: 10.1016/j.tins.2019.05.001 [DOI] [PMC free article] [PubMed] [Google Scholar]
- de Lecea L, Kilduff TS, Peyron C, Gao X-B, Foye PE, Danielson PE, … Sutcliffe JG (1998). The hypocretins: Hypothalamus-specific peptides with neuroexcitatory activity. Proc Natl Acad Sci U S A, 95(1), 322–327. [DOI] [PMC free article] [PubMed] [Google Scholar]
- De Marchis S, Temoney S, Erdelyi F, Bovetti S, Bovolin P, Szabo G, & Puche AC (2004). GABAergic phenotypic differentiation of a subpopulation of subventricular derived migrating progenitors. Eur. J. Neurosci, 20(5), 1307–1317. doi: 10.1111/j.1460-9568.2004.03584.x [DOI] [PubMed] [Google Scholar]
- Del Bigio MR (2010). Ependymal cells: biology and pathology. Acta Neuropathol, 119(1), 55–73. doi: 10.1007/s00401-009-0624-y [DOI] [PubMed] [Google Scholar]
- Dhande OS, & Huberman AD (2014). Retinal ganglion cell maps in the brain: implications for visual processing. Curr Opin Neurobiol, 24(1), 133–142. doi: 10.1016/j.conb.2013.08.006 [DOI] [PMC free article] [PubMed] [Google Scholar]
- Duvarci S, Bauer EP, & Paré D (2009). The bed nucleus of the stria terminalis mediates inter-individual variations in anxiety and fear. J. Neurosci, 29(33), 10357–10361. doi: 10.1523/JNEUROSCI.2119-09.2009 [DOI] [PMC free article] [PubMed] [Google Scholar]
- Fadok JP, Markovic M, Tovote P, & Lüthi A (2018). New perspectives on central amygdala function. Curr. Opin. Neurobiol, 49, 141–147. doi: 10.1016/j.conb.2018.02.009 [DOI] [PubMed] [Google Scholar]
- Fallon JH, Riley JN, Sipe JC, & Moore RY (1978). The islands of Calleja: organization and connections. J. Comp. Neurol, 181(2), 375–395. doi: 10.1002/cne.901810209 [DOI] [PubMed] [Google Scholar]
- Fujita A, Bonnavion P, Wilson MH, Mickelsen LE, Bloit J, de Lecea L, & Jackson AC (2017). Hypothalamic Tuberomammillary Nucleus Neurons: Electrophysiological Diversity and Essential Role in Arousal Stability. J. Neurosci, 37(39), 9574–9592. doi: 10.1523/JNEUROSCI.0580-17.2017 [DOI] [PMC free article] [PubMed] [Google Scholar]
- Fuller PM, Sherman D, Pedersen NP, Saper CB, & Lu J (2011). Reassessment of the structural basis of the ascending arousal system. J Comp Neurol, 519(5), 933–956. doi: 10.1002/cne.22559 [DOI] [PMC free article] [PubMed] [Google Scholar]
- Gaus SE, Strecker RE, Tate BA, Parker RA, & Saper CB (2002). Ventrolateral preoptic nucleus contains sleep-active, galaninergic neurons in multiple mammalian species. Neuroscience, 115(1), 285–294. doi: 10.1016/s0306-4522(02)00308-1 [DOI] [PubMed] [Google Scholar]
- Gerashchenko D, Chou TC, Blanco-Centurion CA, Saper CB, & Shiromani PJ (2004). Effects of lesions of the histaminergic tuberomammillary nucleus on spontaneous sleep in rats. Sleep, 27(7), 1275–1281. doi: 10.1093/sleep/27.7.1275 [DOI] [PMC free article] [PubMed] [Google Scholar]
- Grand W (1999). The anatomy of the brain, by Thomas Willis. Neurosurgery, 45(5), 1234–1236; disscusion 1236–1237. doi: 10.1097/00006123-199911000-00046 [DOI] [PubMed] [Google Scholar]
- Graybiel AM (1978). A satellite system of the superior colliculus: the parabigeminal nucleus and its projections to the superficial collicular layers. Brain Res, 145(2), 365–374. doi: 10.1016/0006-8993(78)90870-3 [DOI] [PubMed] [Google Scholar]
- Guilding C, Hughes AT, Brown TM, Namvar S, & Piggins HD (2009). A riot of rhythms: neuronal and glial circadian oscillators in the mediobasal hypothalamus. Mol Brain, 2, 28. doi: 10.1186/1756-6606-2-28 [DOI] [PMC free article] [PubMed] [Google Scholar]
- Gungor NZ, & Paré D (2016). Functional Heterogeneity in the Bed Nucleus of the Stria Terminalis. J. Neurosci, 36(31), 8038–8049. doi: 10.1523/JNEUROSCI.0856-16.2016 [DOI] [PMC free article] [PubMed] [Google Scholar]
- Hafemeister C & Satija R (2019). Normalization and variance stabilization of single-cell RNA-seq data using regularized negative binomial regression. Genome Biol, 20, 296. doi: 10.1186/s13059-019-1874-1. [DOI] [PMC free article] [PubMed] [Google Scholar]
- Hashikawa Y, Hashikawa K, Falkner AL, & Lin D (2017). Ventromedial Hypothalamus and the Generation of Aggression. Front. Syst. Neurosci, 11, 94. doi: 10.3389/fnsys.2017.00094 [DOI] [PMC free article] [PubMed] [Google Scholar]
- Heiss JE, Yamanaka A, & Kilduff TS (2018). Parallel Arousal Pathways in the Lateral Hypothalamus. eNeuro, ENEURO.0228–0218.2018. doi: 10.1523/ENEURO.0228-18.2018 [DOI] [PMC free article] [PubMed] [Google Scholar]
- Herrera CG, Cadavieco MC, Jego S, Ponomarenko A, Korotkova T, & Adamantidis A (2016). Hypothalamic feedforward inhibition of thalamocortical network controls arousal and consciousness. Nat Neurosci, 19(2), 290–298. doi: 10.1038/nn.4209 [DOI] [PMC free article] [PubMed] [Google Scholar]
- Herzog ED, Hermanstyne T, Smyllie NJ, & Hastings MH (2017). Regulating the Suprachiasmatic Nucleus (SCN) Circadian Clockwork: Interplay between Cell-Autonomous and Circuit-Level Mechanisms. Cold Spring Harb. Perspect. Biol, 9(1). doi: 10.1101/cshperspect.a027706 [DOI] [PMC free article] [PubMed] [Google Scholar]
- Holroyd CB, & Yeung N (2012). Motivation of extended behaviors by anterior cingulate cortex. Trends Cogn. Sci, 16(2), 122–128. doi: 10.1016/j.tics.2011.12.008 [DOI] [PubMed] [Google Scholar]
- Hsieh Y-C, & Puche AC (2013). Development of the Islands of Calleja. Brain Res, 1490, 52–60. doi: 10.1016/j.brainres.2012.10.051 [DOI] [PubMed] [Google Scholar]
- Hsu PD, Lander ES, & Zhang F (2014). Development and applications of CRISPR-Cas9 for genome engineering. Cell, 157(6), 1262–1278. doi: 10.1016/j.cell.2014.05.010 [DOI] [PMC free article] [PubMed] [Google Scholar]
- Husse J, Zhou X, Shostak A, Oster H, & Eichele G (2011). Synaptotagmin10-Cre, a driver to disrupt clock genes in the SCN. J Biol Rhythms, 26(5), 379–389. doi: 10.1177/0748730411415363 [DOI] [PubMed] [Google Scholar]
- Illig KR, & Wilson DA (2009). Olfactory Cortex: Comparative Anatomy. In Squire LR (Ed.), Encyclopedia of Neuroscience (pp. 101–106). Oxford: Academic Press. [Google Scholar]
- Ito S, & Feldheim DA (2018). The Mouse Superior Colliculus: An Emerging Model for Studying Circuit Formation and Function. Front Neural Circuits, 12, 10. doi: 10.3389/fncir.2018.00010 [DOI] [PMC free article] [PubMed] [Google Scholar]
- Jimenez AJ, Dominguez-Pinos MD, Guerra MM, Fernandez-Llebrez P, & Perez-Figares JM (2014). Structure and function of the ependymal barrier and diseases associated with ependyma disruption. Tissue Barriers, 2, e28426. doi: 10.4161/tisb.28426 [DOI] [PMC free article] [PubMed] [Google Scholar]
- Johnson LR, Hou M, Ponce-Alvarez A, Gribelyuk LM, Alphs HH, Albert L, … Doyère V (2008). A recurrent network in the lateral amygdala: a mechanism for coincidence detection. Front. Neural Circuits, 2, 3. doi: 10.3389/neuro.04.003.2008 [DOI] [PMC free article] [PubMed] [Google Scholar]
- Jones JR, Simon T, Lones L, & Herzog ED (2018). SCN VIP Neurons Are Essential for Normal Light-Mediated Resetting of the Circadian System. J. Neurosci, 38(37), 7986–7995. doi: 10.1523/JNEUROSCI.1322-18.2018 [DOI] [PMC free article] [PubMed] [Google Scholar]
- Kaur S, Pedersen NP, Yokota S, Hur EE, Fuller PM, Lazarus M, … Saper CB (2013). Glutamatergic signaling from the parabrachial nucleus plays a critical role in hypercapnic arousal. J. Neurosci, 33(18), 7627–7640. doi: 10.1523/JNEUROSCI.0173-13.2013 [DOI] [PMC free article] [PubMed] [Google Scholar]
- Kim D-W, Yao Z, Graybuck LT, Kim TK, Nguyen TN, Smith KA, … Anderson DJ (2019). Multimodal Analysis of Cell Types in a Hypothalamic Node Controlling Social Behavior. Cell, 179(3), 713–728.e717. doi: 10.1016/j.cell.2019.09.020 [DOI] [PMC free article] [PubMed] [Google Scholar]
- Kim T, Thankachan S, McKenna JT, McNally JM, Yang C, Choi JH, … McCarley RW (2015). Cortically projecting basal forebrain parvalbumin neurons regulate cortical gamma band oscillations. Proc Natl Acad Sci U S A, 112(11), 3535–3540. doi: 10.1073/pnas.1413625112 [DOI] [PMC free article] [PubMed] [Google Scholar]
- King BM (2006). The rise, fall, and resurrection of the ventromedial hypothalamus in the regulation of feeding behavior and body weight. Physiol. Behav, 87(2), 221–244. doi: 10.1016/j.physbeh.2005.10.007 [DOI] [PubMed] [Google Scholar]
- Kroeger D, Absi G, Gagliardi C, Bandaru SS, Madara JC, Ferrari LL, … Vetrivelan R (2018). Galanin neurons in the ventrolateral preoptic area promote sleep and heat loss in mice. Nat Commun, 9(1), 4129. doi: 10.1038/s41467-018-06590-7 [DOI] [PMC free article] [PubMed] [Google Scholar]
- Lebow MA, & Chen A (2016). Overshadowed by the amygdala: the bed nucleus of the stria terminalis emerges as key to psychiatric disorders. Mol. Psychiatry, 21(4), 450–463. doi: 10.1038/mp.2016.1 [DOI] [PMC free article] [PubMed] [Google Scholar]
- Lee IT, Chang AS, Manandhar M, Shan Y, Fan J, Izumo M, … Yanagisawa M (2015). Neuromedin s-producing neurons act as essential pacemakers in the suprachiasmatic nucleus to couple clock neurons and dictate circadian rhythms. Neuron, 85(5), 1086–1102. doi: 10.1016/j.neuron.2015.02.006 [DOI] [PMC free article] [PubMed] [Google Scholar]
- Lindvall O, & Stenevi U (1978). Dopamine and noradrenaline neurons projecting to the septal area in the rat. Cell Tissue Res, 190(3), 383–407. doi: 10.1007/bf00219554 [DOI] [PubMed] [Google Scholar]
- Liu K, Kim J, Kim DW, Zhang YS, Bao H, Denaxa M, … Blackshaw S (2017). Lhx6-positive GABA-releasing neurons of the zona incerta promote sleep. Nature, 548(7669), 582–587. doi: 10.1038/nature23663 [DOI] [PMC free article] [PubMed] [Google Scholar]
- Liu S, Lamaze A, Liu Q, Tabuchi M, Yang Y, Fowler M, … Wu MN (2014). WIDE AWAKE mediates the circadian timing of sleep onset. Neuron, 82(1), 151–166. doi: 10.1016/j.neuron.2014.01.040 [DOI] [PMC free article] [PubMed] [Google Scholar]
- Mao M, Montgomery JM, Kubke MF, & Thorne PR (2015). The Structural Development of the Mouse Dorsal Cochlear Nucleus. J Assoc Res Otolaryngol, 16(4), 473–486. doi: 10.1007/s10162-015-0520-1 [DOI] [PMC free article] [PubMed] [Google Scholar]
- Mauri F, Reichardt I, Mummery-Widmer JL, Yamazaki M, & Knoblich JA (2014). The conserved discs-large binding partner Banderuola regulates asymmetric cell division in Drosophila. Curr Biol, 24(16), 1811–1825. doi: 10.1016/j.cub.2014.06.059 [DOI] [PubMed] [Google Scholar]
- May BJ (2000). Role of the dorsal cochlear nucleus in the sound localization behavior of cats. Hear. Res, 148(1–2), 74–87. doi: 10.1016/s0378-5955(00)00142-8 [DOI] [PubMed] [Google Scholar]
- Mazuski C, Abel JH, Chen SP, Hermanstyne TO, Jones JR, Simon T, … Herzog ED (2018). Entrainment of Circadian Rhythms Depends on Firing Rates and Neuropeptide Release of VIP SCN Neurons. Neuron, 99(3), 555–563 e555. doi: 10.1016/j.neuron.2018.06.029 [DOI] [PMC free article] [PubMed] [Google Scholar]
- McKinley MJ, Denton DA, Ryan PJ, Yao ST, Stefanidis A, & Oldfield BJ (2019). From sensory circumventricular organs to cerebral cortex: Neural pathways controlling thirst and hunger. J. Neuroendocrinol, 31(3), e12689. doi: 10.1111/jne.12689 [DOI] [PubMed] [Google Scholar]
- McKinsey G, Ahmed OM, & Shah NM (2018). Neural control of sexually dimorphic social behaviors. Curr Opin Physiol, 6, 89–95. doi: 10.1016/j.cophys.2018.08.003 [DOI] [PMC free article] [PubMed] [Google Scholar]
- Miranda-Angulo AL, Byerly MS, Mesa J, Wang H, & Blackshaw S (2014). Rax regulates hypothalamic tanycyte differentiation and barrier function in mice. J Comp Neurol, 522(4), 876–899. doi: 10.1002/cne.23451 [DOI] [PMC free article] [PubMed] [Google Scholar]
- Mitrofanis J (2005). Some certainty for the “zone of uncertainty”? Exploring the function of the zona incerta. Neuroscience, 130(1), 1–15. doi: 10.1016/j.neuroscience.2004.08.017 [DOI] [PubMed] [Google Scholar]
- Moffitt JR, Bambah-Mukku D, Eichhorn SW, Vaughn E, Shekhar K, Perez JD, … Zhuang X (2018). Molecular, spatial, and functional single-cell profiling of the hypothalamic preoptic region. Science, 362(6416). doi: 10.1126/science.aau5324 [DOI] [PMC free article] [PubMed] [Google Scholar]
- Moore RY, Speh JC, & Leak RK (2002). Suprachiasmatic nucleus organization. Cell Tissue Res. 309(1), 89–98. doi: 10.1007/s00441-002-0575-2. [DOI] [PubMed] [Google Scholar]
- Nagayama S, Homma R, & Imamura F (2014). Neuronal organization of olfactory bulb circuits. Front. Neural Circuits, 8, 98. doi: 10.3389/fncir.2014.00098 [DOI] [PMC free article] [PubMed] [Google Scholar]
- Nirenberg S, & Cepko C (1993). Targeted ablation of diverse cell classes in the nervous system in vivo. J Neurosci, 13(8), 3238–3251. [DOI] [PMC free article] [PubMed] [Google Scholar]
- Nitabach MN, & Taghert PH (2008). Organization of the Drosophila circadian control circuit. Curr Biol, 18(2), R84–93. [DOI] [PubMed] [Google Scholar]
- Pearce JMS (2008). Marie-Jean-Pierre Flourens (1794–1867) and Cortical Localization. Eur Neurol, 61, 311–314. doi: 10.1159/000206858 [DOI] [PubMed] [Google Scholar]
- Pliner HA, Shendure J, & Trapnell C (2019). Supervised classification enables rapid annotation of cell atlases. Nat Methods, 16(10), 983–986. doi: 10.1038/s41592-019-0535-3 [DOI] [PMC free article] [PubMed] [Google Scholar]
- Rupp AC, Allison MB, Jones JC, Patterson CM, Faber CL, Bozadjieva N, … Myers MG Jr. (2018). Specific subpopulations of hypothalamic leptin receptor-expressing neurons mediate the effects of early developmental leptin receptor deletion on energy balance. Mol Metab, 14, 130–138. doi: 10.1016/j.molmet.2018.06.001 [DOI] [PMC free article] [PubMed] [Google Scholar]
- Saper CB, Lu J, Chou TC, & Gooley J (2005). The hypothalamic integrator for circadian rhythms. Trends Neurosci, 28(3), 152–157. doi: 10.1016/j.tins.2004.12.009 [DOI] [PubMed] [Google Scholar]
- Saxena A, Wagatsuma A, Noro Y, Kuji T, Asaka-Oba A, Watahiki A, … Carninci P (2012). Trehalose-enhanced isolation of neuronal sub-types from adult mouse brain. Biotechniques, 52(6), 381–385. doi: 10.2144/0000113878 [DOI] [PMC free article] [PubMed] [Google Scholar]
- Scala F, Kobak D, Shan S, Bernaerts Y, Laturnus S, Cadwell CR, … Tolias AS (2019). Layer 4 of mouse neocortex differs in cell types and circuit organization between sensory areas. Nat. Commun, 10(1), 4174. doi: 10.1038/s41467-019-12058-z [DOI] [PMC free article] [PubMed] [Google Scholar]
- Schroder H, Moser N, & Huggenberger S (2020). The Mouse Caudate Putamen, Motor System, and Nucleus Accumbens. in Neuroanatomy of the Mouse (Springer Switzerland Nature AG; ). [Google Scholar]
- Schwarz LA, & Luo L (2015). Organization of the locus coeruleus-norepinephrine system. Curr. Biol, 25(21), R1051–R1056. doi: 10.1016/j.cub.2015.09.039 [DOI] [PubMed] [Google Scholar]
- Shah NM, Pisapia DJ, Maniatis S, Mendelsohn MM, Nemes A, & Axel R (2004). Visualizing sexual dimorphism in the brain. Neuron, 43(3), 313–319. doi: 10.1016/j.neuron.2004.07.008 [DOI] [PubMed] [Google Scholar]
- Shah PT, Stratton JA, Stykel MG, Abbasi S, Sharma S, Mayr KA, … Biernaskie J (2018). Single-Cell Transcriptomics and Fate Mapping of Ependymal Cells Reveals an Absence of Neural Stem Cell Function. Cell, 173(4), 1045–1057 e1049. doi: 10.1016/j.cell.2018.03.063 [DOI] [PubMed] [Google Scholar]
- Sheehan TP, Chambers RA, & Russell DS (2004). Regulation of affect by the lateral septum: implications for neuropsychiatry. Brain Res. Brain Res. Rev, 46(1), 71–117. doi: 10.1016/j.brainresrev.2004.04.009 [DOI] [PubMed] [Google Scholar]
- Shore SE, & Zhou J (2006). Somatosensory influence on the cochlear nucleus and beyond. Hear. Res, 216–217, 90–99. doi: 10.1016/j.heares.2006.01.006 [DOI] [PubMed] [Google Scholar]
- Sisley S, & Sandoval D (2011). Hypothalamic control of energy and glucose metabolism. Rev Endocr Metab Disord, 12(3), 219–233. doi: 10.1007/s11154-011-9189-x [DOI] [PMC free article] [PubMed] [Google Scholar]
- Sokolowski K, & Corbin JG (2012). Wired for behaviors: from development to function of innate limbic system circuitry. Front. Mol. Neurosci, 5, 55. doi: 10.3389/fnmol.2012.00055 [DOI] [PMC free article] [PubMed] [Google Scholar]
- Soudry Y, Lemogne C, Malinvaud D, Consoli SM, & Bonfils P (2011). Olfactory system and emotion: common substrates. Eur. Ann. Otorhinolaryngol. Head Neck Dis, 128(1), 18–23. doi: 10.1016/j.anorl.2010.09.007 [DOI] [PubMed] [Google Scholar]
- Stuart T, Butler A, Hoffman P, Hafemeister C, Papalexi E, Mauck WM 3rd, … Satija R (2019). Comprehensive Integration of Single-Cell Data. Cell, 177(7), 1888–1902 e1821. doi: 10.1016/j.cell.2019.05.031 [DOI] [PMC free article] [PubMed] [Google Scholar]
- Tabuchi M, Monaco JD, Duan G, Bell B, Liu S, Liu Q, … Wu MN (2018). Clock-Generated Temporal Codes Determine Synaptic Plasticity to Control Sleep. Cell, 175(5), 1213–1227 e1218. doi: 10.1016/j.cell.2018.09.016 [DOI] [PMC free article] [PubMed] [Google Scholar]
- Tan CL, & Knight ZA (2018). Regulation of Body Temperature by the Nervous System. Neuron, 98(1), 31–48. doi: 10.1016/j.neuron.2018.02.022 [DOI] [PMC free article] [PubMed] [Google Scholar]
- Todd WD, Fenselau H, Wang JL, Zhang R, Machado NL, Venner A, … Saper CB (2018). A hypothalamic circuit for the circadian control of aggression. Nat. Neurosci, 21(5), 717–724. doi: 10.1038/s41593-018-0126-0 [DOI] [PMC free article] [PubMed] [Google Scholar]
- Tyree SM, Borniger JC, & de Lecea L (2018). Hypocretin as a Hub for Arousal and Motivation. Front. Neurol, 9, 413. doi: 10.3389/fneur.2018.00413 [DOI] [PMC free article] [PubMed] [Google Scholar]
- Venner A, Anaclet C, Broadhurst RY, Saper CB, & Fuller PM (2016). A Novel Population of Wake-Promoting GABAergic Neurons in the Ventral Lateral Hypothalamus. Curr. Biol, 26(16), 2137–2143. doi: 10.1016/j.cub.2016.05.078 [DOI] [PMC free article] [PubMed] [Google Scholar]
- Voorn P, Vanderschuren LJMJ, Groenewegen HJ, Robbins TW, & Pennartz CMA (2004). Putting a spin on the dorsal-ventral divide of the striatum. Trends Neurosci, 27(8), 468–474. doi: 10.1016/j.tins.2004.06.006 [DOI] [PubMed] [Google Scholar]
- Wang F, Flanagan J, Su N, Wang L-C, Bui S, Nielson A, … Luo Y (2012). RNAscope: a novel in situ RNA analysis platform for formalin-fixed, paraffin-embedded tissues. J. Mol. Diagn, 14(1), 22–29. doi: 10.1016/j.jmoldx.2011.08.002 [DOI] [PMC free article] [PubMed] [Google Scholar]
- Wang T, Li B, Nelson CE, & Nabavi S (2019). Comparative analysis of differential gene expression analysis tools for single-cell RNA sequencing data. BMC Bioinformatics, 20, 40. doi: 10.1186/s12859-019-2599-6. [DOI] [PMC free article] [PubMed] [Google Scholar]
- Wang X, Chou X-L, Zhang LI, & Tao HW (2020). Zona Incerta: An Integrative Node for Global Behavioral Modulation. Trends Neurosci, 43(2), 82–87. doi: 10.1016/j.tins.2019.11.007 [DOI] [PMC free article] [PubMed] [Google Scholar]
- Wei Y-C, Wang S-R, Jiao Z-L, Zhang W, Lin J-K, Li X-Y, … Xu X-H (2018). Medial preoptic area in mice is capable of mediating sexually dimorphic behaviors regardless of gender. Nat. Commun, 9(1), 279. doi: 10.1038/s41467-017-02648-0 [DOI] [PMC free article] [PubMed] [Google Scholar]
- Welsh DK, Takahashi JS, & Kay SA (2010). Suprachiasmatic nucleus: cell autonomy and network properties. Annu Rev Physiol, 72, 551–577. doi: 10.1146/annurev-physiol-021909-135919 [DOI] [PMC free article] [PubMed] [Google Scholar]
- Wen S, Ma D, Zhao M, Xie L, Wu Q, Gou L, … Yan J (2020). Spatiotemporal single-cell analysis of gene expression in the mouse suprachiasmatic nucleus. Nat Neurosci, 23(3), 456–467. doi: 10.1038/s41593-020-0586-x [DOI] [PubMed] [Google Scholar]
- Wu YE, Pan L, Zuo Y, Li X & Hong W (2017). Detecting Activated Cell Populations Using Single-Cell RNA-Seq. Neuron, 96, 313–329. doi: 10.1016/j.neuron.2017.09.026. [DOI] [PubMed] [Google Scholar]
- Xu M, Chung S, Zhang S, Zhong P, Ma C, Chang WC, … Dan Y (2015). Basal forebrain circuit for sleep-wake control. Nat Neurosci, 18(11), 1641–1647. doi: 10.1038/nn.4143 [DOI] [PMC free article] [PubMed] [Google Scholar]
- Yan L, Karatsoreos I, Lesauter J, Welsh DK, Kay S, Foley D, & Silver R (2007). Exploring spatiotemporal organization of SCN circuits. Cold Spring Harb Symp Quant Biol, 72, 527–541. [DOI] [PMC free article] [PubMed] [Google Scholar]
- Yang CF, Chiang MC, Gray DC, Prabhakaran M, Alvarado M, Juntti SA, … Shah NM (2013). Sexually dimorphic neurons in the ventromedial hypothalamus govern mating in both sexes and aggression in males. Cell, 153(4), 896–909. doi: 10.1016/j.cell.2013.04.017 [DOI] [PMC free article] [PubMed] [Google Scholar]
- Zhang S, Ross KD, Seidner GA, Gorman MR, Poon TH, Wang X, … Hamilton BA (2015). Nmf9 Encodes a Highly Conserved Protein Important to Neurological Function in Mice and Flies. PLoS Genet, 11(7), e1005344. doi: 10.1371/journal.pgen.1005344 [DOI] [PMC free article] [PubMed] [Google Scholar]
- Zhang SL, Yue Z, Arnold DM, Artiushin G, & Sehgal A (2018). A Circadian Clock in the Blood-Brain Barrier Regulates Xenobiotic Efflux. Cell, 173(1), 130–139 e110. doi: 10.1016/j.cell.2018.02.017 [DOI] [PMC free article] [PubMed] [Google Scholar]
- Zhao X, Liu M, & Cang J (2014). Visual cortex modulates the magnitude but not the selectivity of looming-evoked responses in the superior colliculus of awake mice. Neuron, 84(1), 202–213. doi: 10.1016/j.neuron.2014.08.037 [DOI] [PMC free article] [PubMed] [Google Scholar]
- Zhao ZD, Yang WZ, Gao C, Fu X, Zhang W, Zhou Q, … Shen WL (2017). A hypothalamic circuit that controls body temperature. Proc Natl Acad Sci U S A, 114(8), 2042–2047. doi: 10.1073/pnas.1616255114 [DOI] [PMC free article] [PubMed] [Google Scholar]