

Abstract
Background:
A language is constructed of a finite/infinite set of sentences composing of words. Similar to natural languages, the Electrocardiogram (ECG) signal, the most common noninvasive tool to study the functionality of the heart and diagnose several abnormal arrhythmias, is made up of sequences of three or four distinct waves, including the P-wave, QRS complex, T-wave, and U-wave. An ECG signal may contain several different varieties of each wave (e.g., the QRS complex can have various appearances). For this reason, the ECG signal is a sequence of heartbeats similar to sentences in natural languages) and each heartbeat is composed of a set of waves (similar to words in a sentence) of different morphologies.
Methods:
Analogous to natural language processing (NLP), which is used to help computers understand and interpret the human’s natural language, it is possible to develop methods inspired by NLP to aid computers to gain a deeper understanding of Electrocardiogram signals. In this work, our goal is to propose a novel ECG analysis technique, ECG language processing (ELP), focusing on empowering computers to understand ECG signals in a way physicians do.
Results:
We evaluated the proposed approach on two tasks, including the classification of heartbeats and the detection of atrial fibrillation in the ECG signals. Overall, our technique resulted in better performance or comparable performance with smaller neural networks compared to other deep neural networks and existing algorithms.
Conclusion:
Experimental results on three databases (i.e., PhysioNet’s MIT-BIH, MIT-BIH AFIB, and PhysioNet Challenge 2017 AFIB Dataset databases) reveal that the proposed approach as a general idea can be applied to a variety of biomedical applications and can achieve remarkable performance.
Keywords: ECG Analysis, ECG Language Processing, Deep learning, Heart Arrhythmia, Bidirectional recurrent neural networks
1. Introduction
ECG is the most common signal used by physicians and cardiologists to monitor the functionality of the heart. Manual analysis of ECG signals by a human is a very challenging and time-consuming task due to dealing with long ECG recordings and the existence of complex patterns associated with a different heart arrhythmia in the ECG signal. Therefore, to deal with the issues related to the manual analysis of ECG signals, several studies focus on developing automatic ECG analysis techniques to perform this task with high accuracy and in a real-time manner. Machine learning algorithms are commonly used to detect arrhythmia in the ECG signals [1, 10, 23, 38]. Typically, these methods consider four main steps in their workflows: (1) Pre-processing signal that includes re-sampling the signals, noise removal (using bandpass filters, etc.), signal normalization/standardization, etc., (2) Heartbeat segmentation that involves detection of the R-peak (i.e., the QRS complex) using some algorithms such as Pan and Tompkins’s algorithm [27], open-source gqrs package provided by PhysioNet community [28], etc., (3) Feature extraction that includes transforming raw signal to features best suited to the specific task (i.e., classification, prediction, regression, etc.). and (4) Learning that considers classical machine learning techniques such as multilayer perceptron (MLP) and decision trees for analyzing ECG signals [38].
Even though conventional machine learning algorithms with the handcrafted features have achieved acceptable performance for ECG analysis, deep neural network methods with the power of automated extraction of features and representation learning have proven to get human-level performance in analyzing biomedical signals [32, 37, 25]. However, deep learning techniques need a large amount of data and are composed of many parameters to be learned. Besides, most of the suggested methods and workflows for analyzing ECG signals are tailored to the specific task and are not generalizable to other biomedical problems.
In this study, we open a new research avenue for ECG signal analysis by introducing a novel framework called ECG language processing (ELP) that processes the ECG signal in a way a text document is treated in natural language processing (NLP) framework. The proposed framework is applicable to various biomedical applications and also can improve the performance of the shallow machine learning algorithms. A language is constructed of a finite/infinite set of sentences composing of words. Similar to natural languages, an ECG signal is made up of sequences of three or four distinct waves, including the P-wave, QRS complex, T-wave, and U-wave [8, 7] (refer to Figure 1). Each normal ECG includes different varieties of each wave. For instance, the QRS complex can have various shapes, as shown in Figure 2. Hence, an ECG signal is a sequence of heartbeats (like sentences in natural languages) and each heartbeat is composed of a set of waves (like words in a sentence) of different morphologies. Analogous to NLP, which is utilized to help computers/machines to understand and interpret the human’s natural language, our proposed NLP-inspired ECG language processing can aid the computers to gain a deeper understanding of Electrocardiogram signals.
Figure 1:
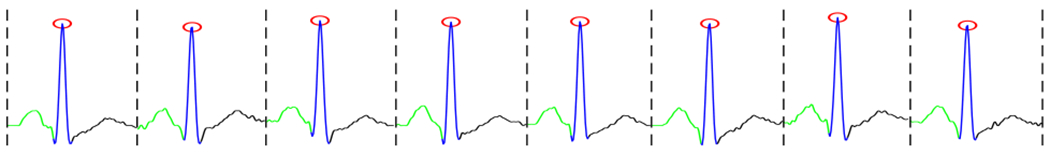
A segmented ECG signal in which red circles show R-peaks, and green, blue and black lines show P-, QRS- and T-waves respectively.
Figure 2:

The QRS complex morphology; adopted from [6].
The rest of this work is structured as follows. Section 2 explains the proposed ELP method. Section 3 introduces potential applications of the ELP method. Section 4 describes the datasets to assess the suggested method and gives a performance comparison of the proposed approach against the existing algorithms in the literature, following by a discussion. Finally, Section 5 concludes the study.
2. Methodology
In this section, we describe main components of ECG Language Processing. Figure 3 shows the ELP pipeline. The ELP includes two main steps as follows:
Figure 3:
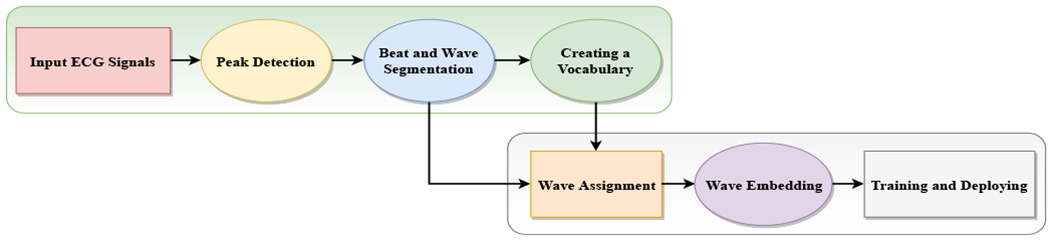
ECG language processing (ELP) Pipeline.
Step 1: Creating a Wave Vocabulary
Peak Detection: it includes finding the R-peaks of given ECG signal or detecting the QRS complexes. The commonly used algorithms for such purpose are the Pan-Tompkins algorithm [27, 33] and Shannon’s energy-based R-peak detector [16]. Herein, we applied an algorithm that uses the agreement of a few algorithms such as the Pan-Tompkins algorithm [27] and gqrs package suggested by [28] to find R-peaks. The red circles in Figure 1 depict the R-peaks of a sample ECG signal.
Beat and Wave Segmentation: it involves dividing continual ECG signal into a sequence of heartbeats, and divide the heartbeats into separate units called waves. After detecting R-peaks, the presence of other building waves (i.e., P, QRS and T waves) in the ECG signal can be extracted using adaptive searching windows. To do heartbeat segmentation, one can identify a segment as a fixed number of samples before the R-peak location to the fixed number of samples after the R-peak location or from the start of a P-wave to the offset of the next T-wave. Figure 1 illustrates a segmented ECG signal specified R-peaks, P, QRS, and T waves.
Creating a Vocabulary: it includes building a vocabulary of the waves based on the extracted waves from the ECG signals. We can cluster all the waves, then consider the mean of each cluster as an entry of the vocabulary. This can be done by feeding all waves into off-the-shelf clustering algorithms such as K-means, spectral clustering, or agglomerative clustering algorithms [11, 36, 26]. After doing wave clustering, the mean of each cluster can represent a distinct wave of the vocabulary. In our experiments, we applied a K-means clustering method to group the waves. Figure 4 visualizes the extracted waves of an ECG signal dataset and extracted clusters (20 clusters) using t-Distributed Stochastic Neighbor Embedding (t-SNE) technique [15]. Figure 6 shows a wave clustering results on the dataset of the 2017 PhysioNet/CinC Challenge [30]. Each row of the figure presents 10 sample waves of a specific extracted cluster.
Figure 4:

Visualizations of thousands of extracted waves along with their 20 clusters on the 2017 PhysioNet/CinC Challenge database. The K-means clustering algorithm, K = 20 as the number of clusters, is used to cluster the extracted waves from the ECG signals and t-SNE technique is used to show how waves are presented in a high-dimensional space.
Figure 6:

Visualization of extracted waves and their corresponding clusters; the K-means clustering algorithm has been used to cluster waves of the dataset of the 2017 PhysioNet/CinC Challenge. The numbers above waves indicate their cluster number.
Step 2: Training and Deploying
Wave Assignment the beat and wave segmentation process produces a sequence of waves for each ECG signal. Then, the cluster of each wave of the sequence is identified using the output of the previous step (i.e., the step 2 of the pipeline). In other words, it assigns a unique integer value (the cluster number) to each wave of the sequence. In this way, each ECG signal is integer-encoded so that each integer represents a specific wave (or cluster) in the vocabulary.
Wave Embedding or Wave Vectorization it takes the integer-encoded vocabulary and builds the embedding vector (i.e., a vector of a specified length) for each wave of the vocabulary. The main reason behind word embedding is that it allows us to apply advanced machine learning like artificial neural networks on the integer-encoded ECG signals for a specific task. Inspired by natural language processing, we can use several approaches such as Count Vectorizer, in which a sequence of waves is converted into a fixed-length vector with the size of the vocabulary. The value in each position in the vector would be a count of each wave in the encoded signal or Word2Vec approach that uses neural network techniques to represent waves in a vector space. The latter approach is more efficient so that it recognizes context, relation, and similarity between waves [18].
Training and Deploying it involves using machine learning and deep learning techniques to train models on the output of the wave embedding step for any learning tasks including classification, prediction, etc. To give a better understanding of ELP applications, we outline some main ECG language processing examples in the following section.
3. ECG Language Processing Examples
ECG Language Processing (ELP) can be used in a variety of biomedical applications where the collected data are ECG signals. Below are the most common applications of ELP:
Heartbeat classification/detection it involves assigning a specific label to heartbeats of a given ECG signal.
Arrhythmia prediction it includes predicting the onset of life-threatening arrhythmia such as Atrial Fibrillation (AFib) in patients based on their current and past states.
Automatic heartbeat annotation it involves automatic annotation of the heartbeats in a sequence of heartbeats (i.e., an ECG signal). This problem is also called automatic sequence labeling [14, 19].
Summarize a long ECG signal ECG signals are typically 8 hours (or more) long (e.g., in sleep stage detection task). Thus, interpreting such a long ECG signal by cardiologists and physicians is a very time-consuming and prone to error task. One way to tackle this problem is the ECG signal summarization and only extracting the most related regions of the ECG signal which contribute to a specific event. This can be done by using attention mechanisms [35, 22].
Translate ECG to other physiological signals it involves estimating other physiological signals such as Arterial Blood Pressure (ABP) and photoplethysmography (PPG) from ECG signals. The main application of such translations is imputation, in which the missing values (may be caused by the device inadvertent detachment) of the signals can be estimated.
4. Experiments
In this section, we evaluate our proposed ECG analysis approach (i.e., ECG Language Processing) using two different clinical tasks, including atrial fibrillation detection and automatic heartbeat classification. We show performing the ELP pipeline to process ECG signals results in better performance compared to the existing methods.
4.1. Data Description
The MIT-BIH AFIB [29] and the 2017 PhysioNet/CinC Challenge datasets [30] were utilized to build models to perform the detection of atrial fibrillation, and the PhysioNet MIT-BIH Arrhythmia database [31] was used to build an automatic heartbeat annotation model.
MIT-BIH AFIB Database includes 23 long-term ECG recordings of subjects with generally AFIB arrhythmia. Each subject of the database contains 2 ten-hours long ECG recordings (i.e., ECG1 andECG2). The ECG signals were sampled at 250 Hz with 12-bit resolution over a range of ±10 millivolts. Herein, we split each ECG signal into data segments of 5 seconds and annotated each one with respect to a threshold parameter, p. We considered the labeling method used by [34, 4]. Indeed, a data segment is considered as AFIB if the percentage of labeled AFIB heartbeats of the data segment is ≥ p, otherwise, it is labeled as a non-AFIB arrhythmia. Similar to the literature, the parameter p was set to 50%. Overall, 167,422 5-s data segments from the ECG1 recordings of the database were extracted. The number of AFIB and non-AFIB samples were 66,939 and 100,483, respectively. To cope with the class imbalance problem existing in the extracted data segments, we selected the same number of segments for both AFIB and non-AFIB classes randomly; 66, 939 data segments for each class.
PhysioNet Challenge AFIB Database was applied for the PhysioNet Challenge 2017 in which the purpose was to propose algorithms to classify a single-short-ECG lead recording (with duration 30–60s) as normal sinus rhythm (N), atrial fibrillation (AFIB), an alternative rhythm (O), or too noisy (~). The training dataset contains 8,528 single-lead ECG signals and the testing dataset includes 3,658 ECG signals. Because the testing dataset was not accessible, we utilized the training dataset for building and evaluating the model. The ECG signals were collected by AliveCor devices at a sample rate of 300Hz and passed through a bandpass filter. Table 1 shows the statistics of each classification type in the PhysioNet Challenge AFIB database (i.e., the training dataset).
Table 1.
Details of number of each classification type in the PhysioNet Challenge AFIB dataset; Normal sinus rhythm (N), atrial fibrillation (AFIB), alternative rhythm (O), noisy (~).
| Dataset | N | AFIB | O | ~ | Total |
|---|---|---|---|---|---|
| PhysioNet Challenge AFIB | 5,154 | 771 | 2,557 | 46 | 8,528 |
PhysioNet MIT-BIH Database contains the ECG recordings of 48 different subjects. The signals were recorded at the sampling rate of 360 Hz, and each record includes two ECG leads; ECG lead II and lead V1. In this study, to be consistent with the previous works in the literature, the ECG lead II is used to build the heartbeat annotator. The dataset is recommended by the American association of medical instrumentation (AAMI) [3] and is composed of the five essential arrhythmia groups. Table 2 presents the categories of heartbeats that existed in the database, and Table 3 shows the statistics of the numbers of each heartbeat group in the MIT-BIH database.
Table 2.
Groups of heartbeats presented in the MIT-BIH database based on AAMI.
| Category | Class |
|---|---|
| N | • Normal beat (N) |
| • Left and right bundle branch block beats (L,R) | |
| • Atrial escape beat (e) | |
| • Nodal (junctional) escape beat (j) | |
| S | • Atrial premature beat (A) |
| • Aberrated atrial premature beat (a) | |
| • Nodal (junctional) premature beat (J) | |
| • Supraventricular premature beat (S) | |
| V | • Premature ventricular contraction (V) |
| • Ventricular escape beat (E) | |
| F | • Fusion of ventricular and normal beat (F) |
| Q | • Paced beat (/) |
| • Fusion of paced and normal beat (f) | |
| • Unclassifiable beat (U) | |
Table 3.
Details of number of each heartbeat group in the MIT-BIH database.
| Dataset | N | S | V | F | Q | Total |
|---|---|---|---|---|---|---|
| MIT-BIH Arrhythmia | 90,462 | 2,777 | 7,223 | 802 | 8,027 | 109,291 |
4.2. Experimental setup
We built three different neural networks for each clinical task and compared them to the state-of-the-art algorithms. Below is list of the models we used to build the detective models.
Convolutional neural network (CNN) we use three consecutive 1D convolutional layers in which each layer is composed of 128 filters with a kernel size of 5 × 1, a stride 1 and a Rectified Linear Unit (ReLU) activation function. All convolutional layers are followed by max-pooling layers with pooling regions of size 5 × 1 with stride sizes of 5. The output of the last convolutional layer is passed through a dropout layer followed by a fully-connected layer with a size of 64 followed by a softmax layer to perform the classification task. Figure 5a presents the architecture of the CNN model. Because the length of input signals in the MIT-BIH AFIB and PhysioNet MIT-BIH databases were too short, we use two consecutive 1D convolutional layers for both datasets with small pooling regions of sizes 3 × 1 with a stride 3 and 2 × 1 with a stride 2, respectfully.
Recurrent neural network (RNN) we utilize 2-layer bi-directional long short term memory (LSTM) with 128 neurons followed by a dropout layer and a fully-connected layer of 64 neurons. Again, to do classification, a softmax layer is used on top of the last dense layer. Figure 5b visualizes the architecture of the RNN model.
RNN-Attention we added an attention layer on top of an RNN model analogous to the one mentioned above to put more emphasis on the important waves of the input signal(s) that have the most contribution in detecting the arrhythmia. Figure 5c depicts the architecture of the RNN-Attention model. The attention layer assigns a probability value to each feature vector extracted from the input by the RNN. In the probability vector, each value is the importance of the corresponding feature vector. Then, an expected value (i.e., it is a linear weighted vector) of the input feature vectors is computed according to the weights provided by the attention layer. Finally, the weighted vector is fed into a softmax layer to perform the classification task.
Figure 5:

Architectures of the used networks in the experiments
We followed the aforementioned steps of the ELP pipeline in Section 2 in which we converted each input signal to an integer encoded vector and computed its corresponding embedding vector using a shallow neural network. Then, we used the embedding vectors as input for the mentioned models (i.e., CNN, RNN, and RNN-Attention) for building the detective models.
Implementation details
We trained all models with a maximum number of 25 epochs and a batch size of 64 samples. The Adam optimizer was applied to minimize the loss with a learning rate α = 0.001. To mitigate the effect of the overfitting problem, an L2 regularization approach with a coefficient β = 1e – 5 and a dropout technique with a probability of retaining input units of 0.8 were used. We implemented the models using Python programming language and Google Tensorflow deep learning library on a machine equipped with 32 GB memory, 8 CPUs (Intel(R) Xeon(R) CPU @ 3.60 GHz), and Ubuntu 18.04 operating system.
4.3. Results and discussion
We report the performance of all built models using all databases and show that following the ELP steps lead to better performance compared to the existing algorithms. We evaluate the models in terms of the overall accuracy, precision (positive predictive value (PPV)), recall (sensitivity), specificity, and F1-score. We also computed macro-averaging of F1-score (MF1), which is the sum of per-class F1-score over the number of classes.
We used ten-fold cross-validation to assess the performance of our technique for the heartbeat classification task using the MIT-BIH arrhythmia dataset. Table 4 presents the detection scores on the MIT-BIH arrhythmia database. We see that ELP work with CNN, RNN, and RNN-Attention approaches outperform all other methods reported in the table. The RNN-Attention model performs as good as the CNN model indicating the attention mechanism helps in getting better performance. Furthermore, Table 5 reports a confusion matrix of classified heartbeats and performance of each class achieved by the ELP while we use the CNN approach to build the classifier. According to Table 5, the smallest sensitivity values are obtained for the categories F and S. The reason is the class imbalance problem existed in the database where the group F has only 802 heartbeats and the group S has 2,777 heartbeats. An imbalanced dataset can negatively affect the performance of a machine learning algorithm. Typically, generating synthetic data or tweaking loss functions are used to mitigate this problem [20].
Table 4.
Comparison of performance of the proposed approach against other existing algorithms on the MIT-BIH arrhythmia database.
| Work | Approach | Accuracy (%) |
|---|---|---|
| ELP | CNN | 97.00 |
| ELP | RNN | 96.96 |
| ELP | RNN-Attention | 97.00 |
| Kachuee et al. [10] | Deep residual CNN | 93.4 |
| Acharya et al. [1] | Augmentation + CNN | 93.47 |
| Li et al. [13] | DWT + random forest | 94.61 |
| Martis et al. [17] | DWT + SVM | 93.8 |
DWT: Discrete wavelet transform; SVM: Support vector machine
Table 5.
Confusion matrix and per-class performance (%) achieved by the proposed method across all ten-folds using the CNN model and based on the MIT-BIH arrhythmia database.
| Predicted |
Per-class Performance (%) |
|||||||||
|---|---|---|---|---|---|---|---|---|---|---|
| N | S | V | F | Q | acc | ppv | sen | spec | ||
| Actual | N | 89774 | 203 | 357 | 37 | 91 | 97.35 | 97.60 | 99.24 | 88.30 |
| S | 757 | 1945 | 56 | 1 | 18 | 98.99 | 87.89 | 70.04 | 99.75 | |
| V | 632 | 51 | 6449 | 44 | 47 | 98.77 | 91.88 | 89.28 | 99.94 | |
| F | 175 | 3 | 95 | 527 | 2 | 99.67 | 86.39 | 65.71 | 99.92 | |
| Q | 639 | 11 | 62 | 1 | 7314 | 99.20 | 97.89 | 91.12 | 99.84 | |
acc: accuracy; ppv: positive predictive value; sen: sensitivity; spec: specificity
We employed five-fold cross-validation to assess the performance of the proposed technique for the atrial fibrillation classification problem using the 2017 PhysioNet/CinC Challenge dataset. Table 6 shows a performance comparison of the 3 models (i.e., CNN, RNN, and RNN-Attention) following our proposed method on detecting atrial fibrillation against the state-of-the-art algorithms. From the table, we can observe that the ELP work with the CNN approach outperforms other methods listed in Table 6, obtaining an MF1 score of 64.40%. As it is shown in the table, the RNN-attention achieves better performance compared to the RNN, showing the attention mechanism leads to performance improvement. Applying the attention approach to the RNN (or other deep learning models) not only improves the model performance but also it provides interpretability into the model [21, 5, 22, 24]. Table 7 presents a confusion matrix and per-class performance of the atrial fibrillation classification task on the PhysioNet challenge AFIB dataset. Herein, we reported the model’s results with the best performance (i.e., the CNN model). Even though the number of samples for class O (2,557) is larger than the number of samples for class A (771), the model performs better for class A. This may be because the class Other rhythms (O) contains a variety of rhythms with different morphologies that make it hard for the network to learn the associated patterns with the class O.
Table 6.
Comparison of performance of the proposed approach against other algorithms for the atrial fibrillation (AFIB) classification problem on the 2017 PhysioNet/CinC Challenge dataset.
| Work | Approach | Per-class Performance (F1%) |
Overall Performance |
||||
|---|---|---|---|---|---|---|---|
| N | A | O | ~ | MF1 | Accuracy | ||
| ELP | CNN | 82.26 | 63.47 | 56.69 | 55.18 | 64.40 | 72.62 |
| ELP | RNN | 79.88 | 56.06 | 44.32 | 43.31 | 55.89 | 67.66 |
| ELP | RNN-Attention | 83.98 | 64.57 | 55.84 | 52.58 | 64.24 | 74.22 |
| Andreotti et al. [2] | Deep residual CNN | 82.6 | 46.6 | 60.0 | 60.2 | 62.4 | - |
MF1: Macro-averaging of F1-score
Table 7.
Confusion matrix and per-class performance achieved by the proposed method across all five-folds for the atrial fibrillation (AFIB) classification task on the 2017 PhysioNet/CinC Challenge database.
| Predicted |
Per-class Performance (%) |
||||||||
|---|---|---|---|---|---|---|---|---|---|
| N | A | O | ~ | acc | ppv | sen | spec | ||
| Actual | N | 4221 | 53 | 738 | 63 | 78.65 | 81.83 | 83.17 | 71.98 |
| A | 70 | 463 | 207 | 18 | 93.75 | 66.05 | 61.08 | 96.93 | |
| O | 839 | 172 | 1348 | 53 | 75.83 | 57.51 | 55.89 | 83.70 | |
| ~ | 57 | 13 | 51 | 157 | 97.01 | 53.95 | 56.47 | 98.37 | |
acc: accuracy; ppv: positive predictive value; sen: sensitivity; spec: specificity
To show the model learning performance, we have also reported the learning curves. Fig 7a (left) shows the loss curves on the training and testing data. From Fig 7a (left), we can see that the loss curve of the testing data is almost constant at the final epochs meaning that the more epochs would not help get better performance. In addition, as we mentioned earlier, the presence of the class Other rhythms (O) in the database requires the network to learn the different patterns associated with the class O. Therefore, we think this is the reason that the training loss is not decreasing smoothly.
Figure 7:

Accuracy and loss curves of the RNN-Attention model on the 2017 PhysioNet/CinC Challenge dataset (averaged over the five-folds).
Fig 7b (right) depicts the accuracy curves in the training and testing phases. Again, we can see from the plot that the model would not result in better performance with increasing the number of epochs.
To evaluate the performance of our method for another AFIB classification task, we utilized a ten-fold cross-validation procedure on the MIT-BIH AFIB dataset, where we extracted 5-s data segments. Table 8 reports the detection scores on the AFIB detection task. We see that the proposed work with the CNN model achieves a good performance, but slightly low performance compared to the Xia et al. [34] work.
Table 8.
Comparison of performance of the proposed approach against other state-of-the-art algorithms for the AFIB detection task on the MIT-BIH AFIB database with the ECG segment of size 5-s.
| Work | Approach | Best Performance (%) |
|||
|---|---|---|---|---|---|
| accuracy | ppv | sensitivity | specificity | ||
| ELP | CNN | 98.17 | 97.78 | 98.57 | 97.76 |
| ELP | RNN | 97.93 | 97.63 | 98.24 | 97.61 |
| ELP | RNN-Attention | 97.96 | 97.87 | 98.08 | 97.84 |
| Xia et al. [34] | SWT + CNN | 98.63 | - | 98.79 | 97.87 |
| Asgari et al. [4] | SWT + SVM | - | - | 97.00 | 97.10 |
| Jiang et al. [9] | RR interval irregularity + P-wave absence | - | - | 98.20 | 97.50 |
ppv: positive predictive value; SWT: stationary wavelet transform
From all experiments for three databases, we can see that our method can result in better performance or comparable performance with smaller neural networks compared to other deep neural networks and existing algorithms. Therefore, this makes the proposed method implementable on devices with limited hardware such as wearable devices. It is worth mentioning that in the first step of the ELP pipeline (Step 1: Creating a Wave Vocabulary), we extracted the waves in the ECG signals based on the extracted R-peaks and employing adaptive searching windows (using fixed-length windows for all waves, i.e., P, QRS, and T-waves). In other words, the output of the search method was a 1-dimensional vector representing the beginning and end positions of the waves. Then, we used a K-means clustering algorithm to cluster waves (fixed-length sizes) to build the vocabulary (one can apply other clustering methods to improve the performance) and to estimate the optimal number of clusters we used a graphical tool named elbow method [12]. Similar to many clustering techniques, the number of clusters might have a considerable impact on the performance of the algorithm. For each problem (and its dataset), we conducted clustering using the each dataset independently. We believe, applying better segmentation algorithms or more sophisticated clustering methods can yield higher detection scores.
5. Conclusion
In this study, we proposed a new technique to analyze ECG signals named ECG language processing (ELP). The proposed approach is composed of two main steps: 1) Creating a Wave Vocabulary, building a vocabulary of waves based on the extracted waves from the ECG signals, and 2) Training and Deploying, developing predictive and detective models using the extracted vocabulary and machine learning algorithms for different clinical tasks. The experiment results on two different tasks, including the heartbeat classification and atrial fibrillation tasks with three databases, show that our method results in state-of-the-art performance. Future work includes, but not limited to, improving the segmentation and creating the vocabulary steps to improve the performance of the detection process and applying the ELP method for other biomedical applications such as the prediction of arrhythmia (see Section 3 for more examples).
Highlights.
A new technique to analyze ECG signals named ECG language processing (ELP) is introduced.
ECG language processing (ELP) empowers computers to understand ECG signals in a way physicians do.
The proposed technique can be applied to applied to a variety of biomedical applications (e.g., classification and prediction).
The proposed technique facilitates developing interpretable algorithms.
Acknowledgments
This study is based upon work supported by the National Science Foundation under Grant Number 1657260. Research reported in this publication was supported by the National Institute On Minority Health And Health Disparities of the National Institutes of Health under Award Number U54MD012388.
Footnotes
Publisher's Disclaimer: This is a PDF file of an unedited manuscript that has been accepted for publication. As a service to our customers we are providing this early version of the manuscript. The manuscript will undergo copyediting, typesetting, and review of the resulting proof before it is published in its final form. Please note that during the production process errors may be discovered which could affect the content, and all legal disclaimers that apply to the journal pertain.
The authors declare that there is no conflict of interest.
References
- [1].Acharya UR, Oh SL, Hagiwara Y, Tan JH, Adam M, Gertych A, San Tan R, 2017. A deep convolutional neural network model to classify heartbeats. Computers in biology and medicine 89, 389–396. [DOI] [PubMed] [Google Scholar]
- [2].Andreotti F, Carr O, Pimentel MA, Mahdi A, De Vos M, 2017. Comparing feature-based classifiers and convolutional neural networks to detect arrhythmia from short segments of ecg, in: 2017 Computing in Cardiology (CinC), IEEE. pp. 1–4. [Google Scholar]
- [3].ANSI-AAMI, 1998–2008. Testing and reporting performance results of cardiac rhythm and st segment measurement algorithms. American National Standards Institute, Inc. (ANSI), Association for the Advancement of Medical Instrumentation (AAMI), ANSI/AAMI/ISO; . [Google Scholar]
- [4]. Asgari S, Mehrnia A, Moussavi M, 2015. Automatic detection of atrial fibrillation using stationary wavelet transform and support vector machine. Computers in biology and medicine 60, 132–142. [DOI] [PubMed] [Google Scholar]
- [5].Choi E, Bahadori MT, Sun J, Kulas J, Schuetz A, Stewart W, 2016. Retain: An interpretable predictive model for healthcare using reverse time attention mechanism, in: Advances in Neural Information Processing Systems, pp. 3504–3512. [Google Scholar]
- [6].Esquillo J, 2017. EKG: Waves, Complexes, Straight Lines, and Intervals/Labeling and Interpreting. URL: https://brilliantnurse.com. [Google Scholar]
- [7].Harvard, 2018. Understanding The ECG Reading The Waves. URL: https://www.health.harvard.edu/heart-health/understanding-the-ecg-reading-the-waves. [PubMed]
- [8].Hurst JW, 1998. Naming of the waves in the ecg, with a brief account of their genesis. Circulation 98, 1937–1942. [DOI] [PubMed] [Google Scholar]
- [9].Jiang K, Huang C, Ye S.m., Chen H, 2012. High accuracy in automatic detection of atrial fibrillation for holter monitoring. Journal of Zhejiang University SCIENCE B 13, 751–756. [DOI] [PMC free article] [PubMed] [Google Scholar]
- [10].Kachuee M, Fazeli S, Sarrafzadeh M, 2018. Ecg heartbeat classification: A deep transferable representation, in: 2018 IEEE International Conference on Healthcare Informatics (ICHI), IEEE. pp. 443– 444. [Google Scholar]
- [11].Kanungo T, Mount DM, Netanyahu NS, Piatko CD, Silverman R, Wu AY, 2002. An efficient k-means clustering algorithm: Analysis and implementation. IEEE Transactions on Pattern Analysis & Machine Intelligence , 881–892. [Google Scholar]
- [12].Kodinariya TM, Makwana PR, 2013. Review on determining number of cluster in k-means clustering. International Journal 1, 90–95. [Google Scholar]
- [13].Li T, Zhou M, 2016. Ecg classification using wavelet packet entropy and random forests. Entropy 18, 285. [Google Scholar]
- [14].Ma X, Hovy E, 2016. End-to-end sequence labeling via bi-directional lstm-cnns-crf. arXiv preprint arXiv:1603.01354 . [Google Scholar]
- [15].Maaten L.v.d., Hinton G, 2008. Visualizing data using t-sne. Journal of machine learning research 9, 2579–2605. [Google Scholar]
- [16].Manikandan MS, Soman K, 2012. A novel method for detecting r-peaks in electrocardiogram (ecg) signal. Biomedical Signal Processing and Control 7, 118–128. [Google Scholar]
- [17].Martis RJ, Acharya UR, Lim CM, Mandana K, Ray AK, Chakraborty C, 2013. Application of higher order cumulant features for cardiac health diagnosis using ecg signals. International journal of neural systems 23, 1350014. [DOI] [PubMed] [Google Scholar]
- [18].Mikolov T, Sutskever I, Chen K, Corrado GS, Dean J, 2013. Distributed representations of words and phrases and their compositionality, in: Advances in neural information processing systems, pp. 3111–3119. [Google Scholar]
- [19].Mousavi S, Afghah F, 2019. Inter-and intra-patient ecg heartbeat classification for arrhythmia detection: a sequence to sequence deep learning approach, in: ICASSP 2019–2019 IEEE International Conference on Acoustics, Speech and Signal Processing (ICASSP), IEEE. pp. 1308–1312. [DOI] [PMC free article] [PubMed] [Google Scholar]
- [20].Mousavi S, Afghah F, Acharya UR, 2019a. SleepEEGNet: Automated sleep stage scoring with sequence to sequence deep learning approach. PloS one 14. [DOI] [PMC free article] [PubMed] [Google Scholar]
- [21].Mousavi S, Afghah F, Acharya UR, 2020a. HAN-ECG: An interpretable atrial fibrillation detection model using hierarchical attention networks. arXiv preprint arXiv:2002.05262 . [DOI] [PMC free article] [PubMed] [Google Scholar]
- [22].Mousavi S, Afghah F, Razi A, Acharya UR, 2019b. ECGNET: Learning where to attend for detection of atrial fibrillation with deep visual attention, in: 2019 IEEE EMBS International Conference on Biomedical & Health Informatics (BHI), IEEE. pp. 1–4. [DOI] [PMC free article] [PubMed] [Google Scholar]
- [23].Mousavi S, Fotoohinasab A, Afghah F, 2020b. Single-modal and multi-modal false arrhythmia alarm reduction using attention-based convolutional and recurrent neural networks. PloS one 15, e0226990. [DOI] [PMC free article] [PubMed] [Google Scholar]
- [24].Mousavi S, Schukat M, Howley E, Borji A, Mozayani N, 2016. Learning to predict where to look in interactive environments using deep recurrent q-learning. arXiv preprint arXiv:1612.05753 . [Google Scholar]
- [25].Murat F, Yildirim O, Talo M, Baloglu UB, Demir Y, Acharya UR, 2020. Application of deep learning techniques for heartbeats detection using ecg signals-analysis and review. Computers in Biology and Medicine , 103726. [DOI] [PubMed] [Google Scholar]
- [26].Ng AY, Jordan MI, Weiss Y, 2002. On spectral clustering: Analysis and an algorithm, in: Advances in neural information processing systems, pp. 849–856. [Google Scholar]
- [27].Pan J, Tompkins WJ, 1985. A real-time qrs detection algorithm. IEEE Trans. Biomed. Eng 32, 230–236. [DOI] [PubMed] [Google Scholar]
- [28].PhysioNet, 2000a. PhysioNet community. URL: https://www.physionet.org/.
- [29].PhysioNet, 2000b. PhysioNet MIT-BIH Atrial Fibrillation Database. URL: https://physionet.org/content/afdb/1.0.0/.
- [30].PhysioNet, 2001. AF Classification from a Short Single Lead ECG Recording - The PhysioNet Computing in Cardiology Challenge 2017. URL: https://physionet.org/physiobank/database/mitdb/. [DOI] [PMC free article] [PubMed]
- [31].PhysioNet, 2001. Physionet MIT-BIH arrhythmia database. URL: https://physionet.org/physiobank/database/mitdb/.
- [32].Rajpurkar P, Hannun AY, Haghpanahi M, Bourn C, Ng AY, 2017. Cardiologist-level arrhythmia detection with convolutional neural networks. arXiv preprint arXiv:1707.01836 . [Google Scholar]
- [33].Sathyapriya L, Murali L, Manigandan T, 2014. Analysis and detection r-peak detection using modified pan-tompkins algorithm, in: 2014 IEEE International Conference on Advanced Communications, Control and Computing Technologies, IEEE. pp. 483–487. [Google Scholar]
- [34].Xia Y, Wulan N, Wang K,Zhang H, 2018. Detecting atrial fibrillation by deep convolutional neural networks. Computers in biology and medicine 93, 84–92. [DOI] [PubMed] [Google Scholar]
- [35].Xu K, Ba J, Kiros R, Cho K, Courville A, Salakhudinov R, Zemel R, Bengio Y, 2015. Show, attend and tell: Neural image caption generation with visual attention, in: International conference on machine learning, pp. 2048–2057. [Google Scholar]
- [36].Xu R, Wunsch DC, 2005. Survey of clustering algorithms . [DOI] [PubMed] [Google Scholar]
- [37].Yildirim Ö, Pławiak P,Tan RS,Acharya UR, 2018. Arrhythmia detection using deep convolutional neural network with long duration ecg signals. Computers in biology and medicine 102, 411–420. [DOI] [PubMed] [Google Scholar]
- [38].Zaeri-Amirani M, Afghah F, Mousavi S, 2018. A feature selection method based on shapley value to false alarm reduction in icus a genetic-algorithm approach, in: 2018 40th Annual International Conference of the IEEE Engineering in Medicine and Biology Society (EMBC), IEEE. pp. 319–323. [DOI] [PubMed] [Google Scholar]