Figure 3.
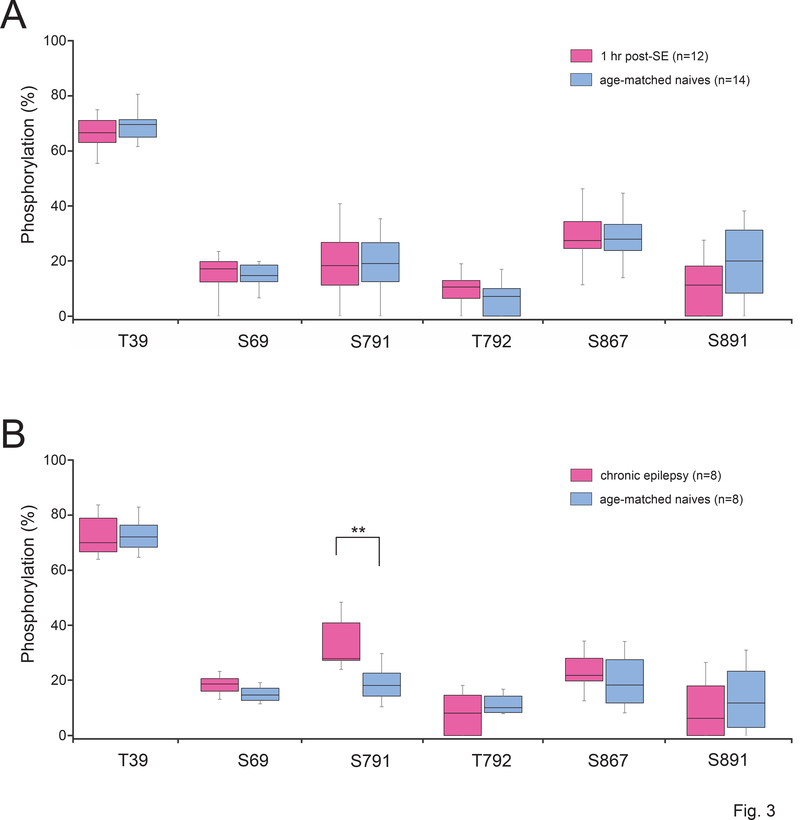
HCN1 phosphorylation levels in epileptic vs naïve conditions in rats. Shown are the phosphorylation levels at six HCN1 phosphosites (where phosphorylation was detected in ≥ 50% of rat samples) between the chronic epilepsy group and their age-matched naïve group at two stages of epileptogenesis: acute (1 hour post-SE) and chronic (6–9 weeks post-SE). The limits of each box show the 25th and 75th percentiles of the data values; the median is depicted as the line within the box; and the whiskers show the 95th and 5th percentiles. (A) No phosphorylation changes were observed in 1 hr post-SE rats compared to age-matched naïve animals. (B) In chronic epileptic rats, S791 showed a significantly increased phosphorylation level compared to age-matched naïve animals, indicated by (**).

