

Abstract
Chronic graft versus host disease (cGvHD) is the most common cause of non-relapse mortality after allogeneic hematopoietic cell transplant (alloHCT). Cutaneous cGvHD is characterized by thickening of the skin and connective tissues resulting in discomfort and limitations in mobility. Current assessments of these skin lesions are based on physical examination of their thickening, pinchability, and movability. Optical coherence tomography (OCT) is a non-invasive, high-resolution technique using near infra-red light to interrogate tissues and image the microstructure without the use of contrast agents. We determined the applicability of OCT to human cutaneous cGvHD. Seven patients with varying degrees of cutaneous GvHD including three controls who received autologous hematopoietic cell transplant were prospectively examined using the cGvHD Skin (Vienna) Scale and imaged with OCT. Analysis of OCT images and clinical exams revealed that stratum corneum thickness, epidermal thickness, and depth of light transmission correlated with cutaneous cGvHD severity in the hands, forearms, upper arms, legs, thighs, and upper back (p ≤ 0.03). Longitudinal OCT changes during cGVHD treatment paralleled clinical changes in the arm and upper back. OCT changes were observed in the absence of clinical changes.
Conclusion:
OCT imaging reflects the severity of cutaneous cGVHD and can be used to follow these lesions. OCT may facilitate the design of therapeutic trials in cGvHD by providing a quantitative measurement of cGvHD severity. Additional studies are necessary.
Graphical abstract.
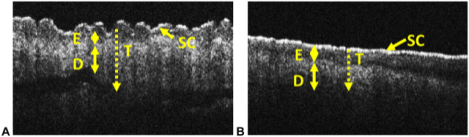
In this study, we applied OCT to cutaneous chronic graft versus host disease (GvHD) to determine if OCT could detect differences between normal (A) and chronic GVHD affected skin (B). Representative images are shown. The different skin layers are identified. Key: D -dermis, E – epidermis, SC – stratum corneum, T – depth of light penetration. Double headed arrows indicate the thickness of the specific skin layer. Dotted line and arrow indicate the depth of light penetration which is indicated by T.
Introduction
Allogeneic hematopoietic cell transplant (alloHCT) is a standard potentially curative therapy for many hematologic malignancies. However, its full use is limited by chronic graft versus host disease (cGvHD), the major complication and the leading cause of non-relapse mortality after alloHCT.[1] Chronic GvHD is the reaction of the donor’s immune system against the recipient’s body and is characterized by immune dysfunction and multi-organ fibrosis. Cutaneous disease is the most common manifestation resulting in skin thickening and loss of elasticity.[2]
Current assessments of cutaneous cGvHD are based on gradation of the skin’s thickness, movability, pinchability, and appearance by physical examination, as well as visual estimates of the involved body surface area.[3–5] Serial assessments of cutaneous cGvHD using these descriptors are difficult to compare due to inter-observer differences. The development of new anti-cGvHD therapeutic agents is partially limited by imprecise measurements of response. A machine based quantitative method could improve the serial assessment of cutaneous cGvHD and facilitate the development of new therapeutic agents in clinical trials.
Optical coherence tomography (OCT) is a non-invasive, high-resolution technique which can provide images of the tissue microstructure without the use of contrast agents.[6] It interrogates target tissues using near infra-red light which is reflected back and compared to a reference beam using interferometry principles to generate cross sectional images. The resolution of OCT ranges from 1 to 30 μm. OCT has been clinically used to image the coronary artery wall, eye, and skin.[7–9] These clinical OCT systems, however, are typically non-portable instruments which require that the patient be brought to the machine and positioned appropriately in order to image the correct body part. Depending on the specific clinical situation, a handheld OCT probe for various clinical environments could improve patient convenience as well as imaging quality by allowing better adaptability to varying body contours.[10, 11]
In these prospective clinical studies, we applied OCT imaging to human cutaneous cGvHD lesions. We correlated OCT measurements of the skin ultrastructure with clinical exams of affected body parts in a pilot study of one patient and a healthy control, then a cross sectional study of six patients with varying degrees of cGvHD including three autologous hematopoietic cell transplant (autoHCT) controls, and finally, a longitudinal study of one patient with cGvHD before and after treatment with nilotinib in the context of a phase I/II clinical trial.
Methods
Clinical studies
The Roswell Park Comprehensive Cancer Center (RPCCC) Institutional Review Board approved these studies. All participants provided informed consent. All authors had access to the primary clinical data.
Each patient received a comprehensive examination of his / her skin. Cutaneous lesions were graded using the Chronic GvHD Skin (Vienna) Scale which ranges from 0 to 4 with 0 being unaffected, 1 erythematous, 2 mildly thickened, pinchable, and moveable, 3 moderately thickened and pinchable but not moveable, and 4 severely thickened, not pinchable, and not moveable.[4] OCT imaging of the same body sites occurred immediately after the physical examination by applying the handheld probe directly to the skin for approximately 20 seconds. The clinical examination and OCT imaging occurred during the same patient visit in the outpatient Transplant and Cellular Therapy Program clinic or an inpatient hospital room. GLC performed the clinical examination. MJ performed OCT imaging. The interpretation of OCT imaging (MH and CK) including quantification of skin layer thicknesses occurred after the clinic visit without knowledge of the clinical examination results.
A preliminary study of a limited number of body sites was performed in a single patient with cutaneous cGvHD and a healthy normal control. Based upon the encouraging results that were obtained, a modified protocol was implemented to allow for more comprehensive clinical examination and OCT imaging at 33 pre-defined body sites (Supplemental Table 1). Complete clinical examination, OCT imaging, and data storage of all body sites was performed in 60–75 minutes. Six patients with varying degrees of cGvHD including three autoHCT controls were imaged and examined. One patient with cGvHD was followed longitudinally after being treated with nilotinib and received serial imaging.
The demographic characteristics of the seven patients from the pilot and cross-sectional studies are presented in Supplemental Table 2.
OCT imaging technique
Figure 1A shows the system schematic. The broadband OCT light (super-luminescent emitting diode; Denslight DL-BD9-CS31159A) is centered at 1310 nm with the full width at half maximum (FWHM) of 150 nm. The light is split into reference and sample arms via a 2×2 fiber coupler. A rapidly scanning optical delay-line (RSOD) is implemented at the reference arm to change the path length.[12] In the sample arm, a handheld probe is implemented. All optics including a galvanometer scanner, interchangeable lens mounts, and miniaturized video camera are packaged inside a light and robust plastic box (12×12×6 cm along the x, y, and z axes, respectively) as shown in Figure 1B. The reflected beams from the reference and sample arms are recombined again through the fiber coupler, and the resulting interference signals are detected by a balanced photodiode (Thorlabs; PDB140C). The optical components are aligned on a 25×20 cm optical breadboard. The field of view (FOV) is ~ 8×2 mm along the x and z axes, respectively. The axial and lateral resolutions are ~6 and ~60 μm, respectively. One B-scan image is acquired every second. Each B-scan contains 400 A-lines with 2500 axial points per A-line. Charge coupled device (CCD) camera based color video and OCT images at the same imaging location are acquired simultaneously using a 0.27M-pixel-CCD camera with a size of 1.6 (diameter) × 2.1 cm (length) integrated within the handheld probe. Two light emitting diodes (LEDs) are positioned directly behind the OCT objective lens to illuminate the imaging site for video imaging. A 3.5-inch-display is integrated into the probe to allow simultaneous visualization and OCT imaging of the skin lesion. OCT and video images are also displayed on a computer monitor during acquisition (Figure 1C). All subsystems including the optics, necessary electronics and power supplies, handheld probe, and data acquisition computer were equipped into a small movable cart (Figure 1D).
Figure 1. OCT imaging technique and methodology.
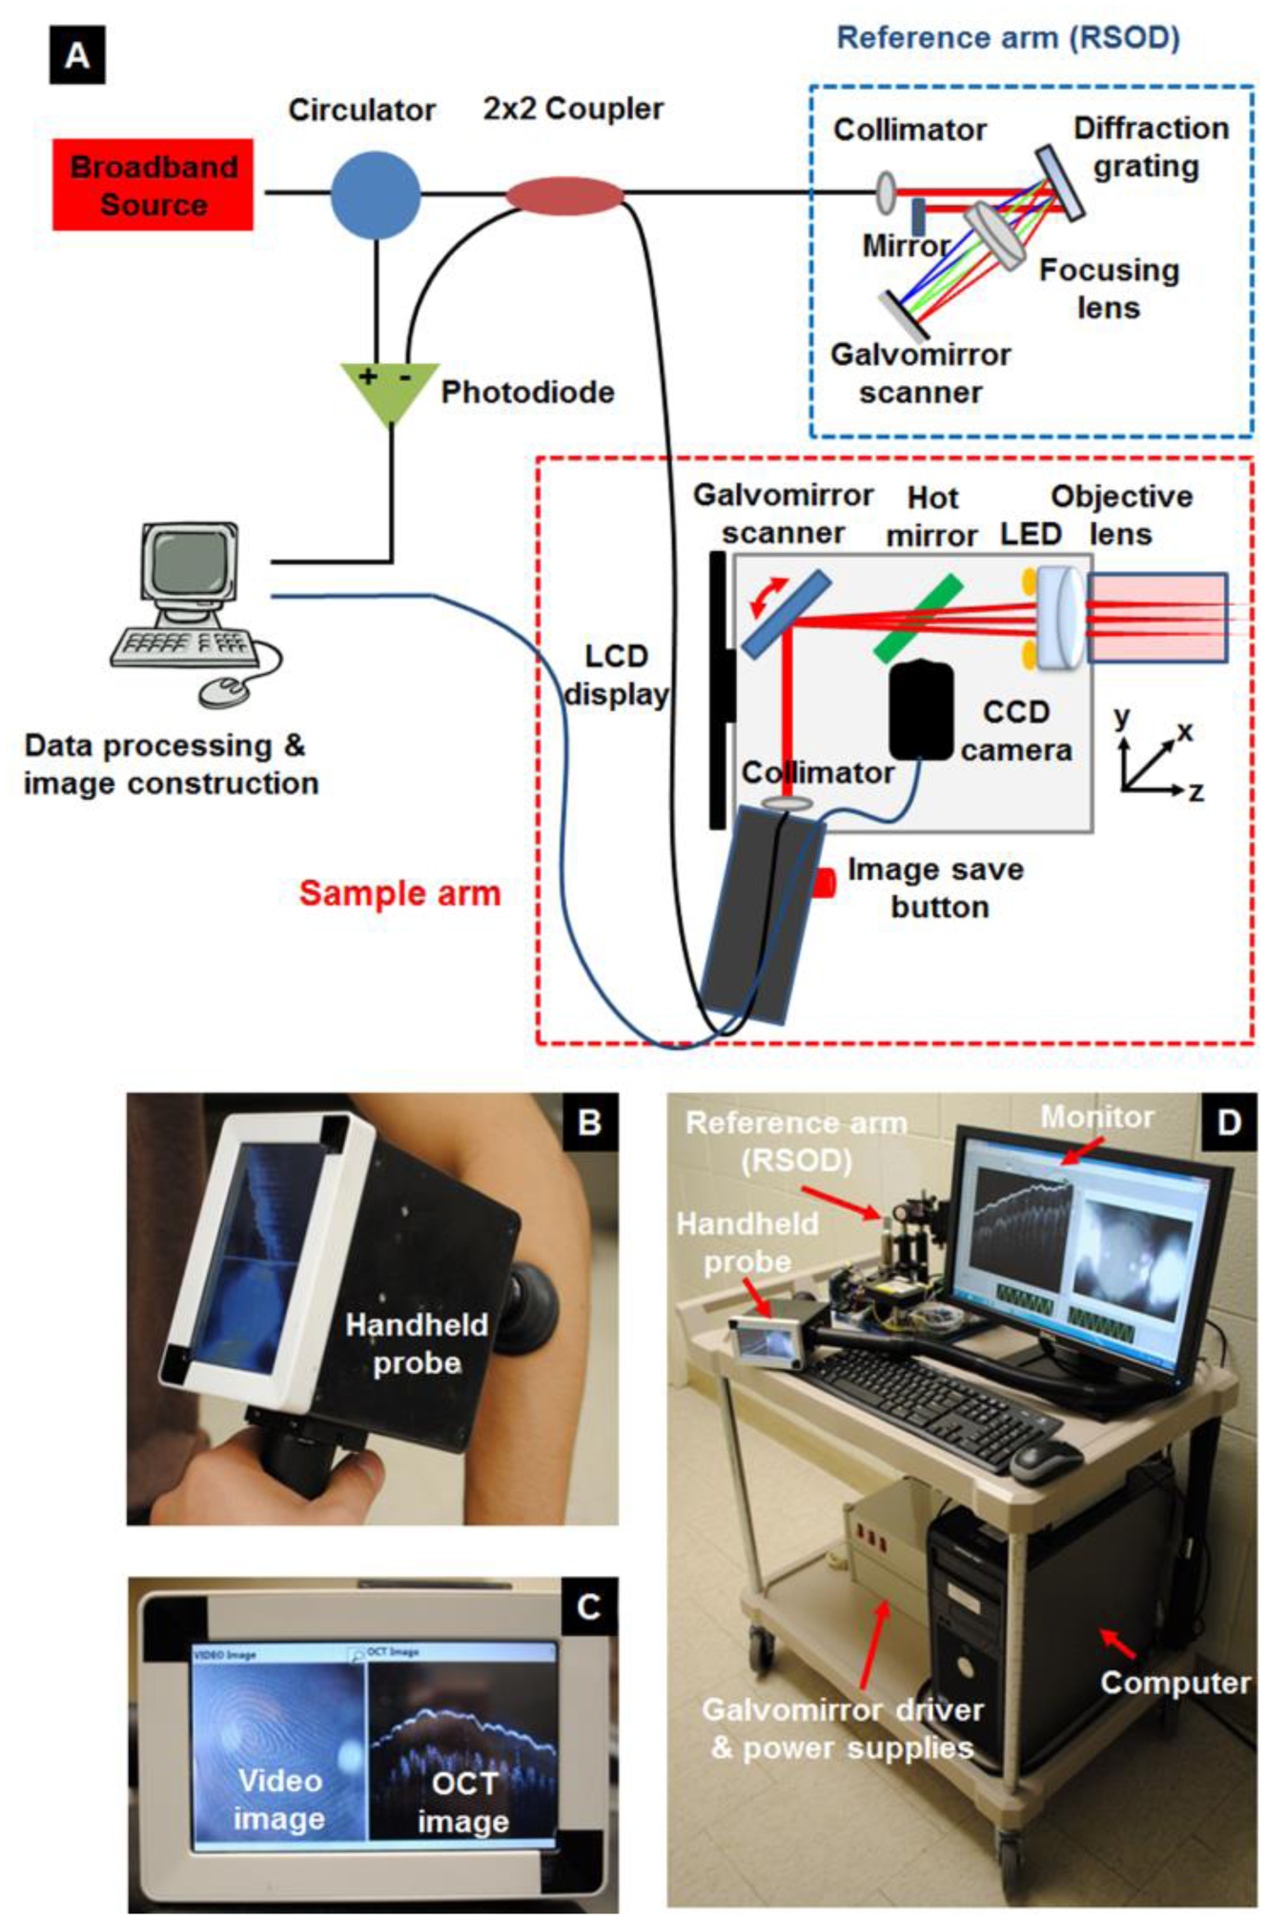
(a) Schematic of the dual-modal handheld OCT and video imaging probe. (b) Photograph of the handheld scanner. (c) Photograph of the dual display mounted on the probe. (d) Photograph of the movable cart equipping including all optics, electronics and power supplies, handheld probe, and computer. Key: OCT – optical coherence tomography.
OCT classification of dermatologic layers
The stratum corneum (SC) was defined as the first layer of skin. The epidermis (E) was defined as all layers below the SC down to the papillary dermis. The thickness of the SC layer was determined using OCT A-line profiles (Supplemental Figure 1). First, the peak OCT signal within the SC layer was selected, and then the full width at 30% of the maxima was measured in each A-line. After calculating the full widths at 30% of the maxima in all 400 A-lines, we chose the dominant 50 values. The averaged values and standard deviations were defined as the averaged SC thickness. Second, the thickness of the E layer was estimated to the distance from a position at 30% of the maxima in the decreasing A-line profile of the SC layer to a position at 30% of the maxima in the increasing A-line profile of the dermis layer. Again, we selected the dominant 50 thicknesses in all A-lines, and the averaged values and standard deviations were defined as the averaged E thickness. The depth of light penetration (T) was defined as the distance from the SC layer to the deepest position where the OCT signals were still detectable. After we calculated the depth of light penetration in all 400 A-lines, we averaged the 50 highest values and standard deviations.
Statistical analysis
This was a clinical pilot study designed to gather data about the feasibility and applicability of OCT imaging to cutaneous cGvHD. Clinical examinations (Vienna Scale) were collected as ordinal categorical data. OCT examinations were summarized as real number measurements of visually identified morphologic layers of skin. Correlation between clinical examination and OCT measurements were determined with the Spearman rank correlation method. Differences in longitudinal assessments of clinical disease and OCT measurements before and after nilotinib treatment were described. P values ≤ 0.05 were considered statistically significant. Statistical analysis was performed with R software.[13]
Results
OCT imaging identifies differences between cutaneous cGvHD and healthy normal skin
An exploratory study was performed to determine if OCT imaging could demonstrate differences between severe cutaneous cGvHD and normal healthy skin. The cGvHD patient was a 33 year old male who received a 10/10 HLA matched unrelated donor peripheral blood stem cell graft for acute myeloid leukemia. The conditioning regimen was cyclophosphamide / 1200 cGy total body irradiation and the acute GvHD prophylaxis regimen was tacrolimus / methotrexate. The patient developed cutaneous cGvHD on day+341 after alloHCT. He received and progressed through multiple lines of therapy including methylprednisolone, tacrolimus, hydroxychloroquine, acitretin, extra-corporeal photopheresis (ECP), rituximab, and imatinib. At the time of OCT imaging on day+978 after alloHCT, the patient had extensive cutaneous cGvHD. The patient had moveable sclerosis or non-moveable subcutaneous sclerosis or fasciitis covering 54% of his body surface area and involving his anterior and posterior torso, both upper extremities, and both lower extremities. His joint range of motion according to the photographic range of motion (P-ROM) scale was rated at 6/7 in the shoulders, 5/7 in the elbows, 5/7 in the wrist, and 3/4 in the ankle. The control was a healthy normal male volunteer.
Quantitative OCT and corresponding physical examination results from the body sites examined are presented in Table 1. OCT images from the healthy control show clear visualization of the putative SC, E, epidermal/dermal junction, papillary dermis, blood vessels, and sweat duct (Figure 2).[14] Comparison of OCT images of cGVHD skin lesions with normal skin reveals multiple differences. In cGvHD affected skin, the SC layer is a median 2.05 (range 1.69–2.16) times thicker and brighter in intensity in comparison to healthy control skin. The epidermis is narrowed a median 0.31 (range <0.04 – 0.49) times in the cGvHD patient compared to the healthy control. At the right thigh and right flank, the epidermis was narrowed beyond the limit of detection of the OCT imaging device (6 μm). The SC:E ratio is >1 in the cGvHD subject and inverts to <1 in the normal subject. Finally, the surface of cGvHD affected skin is flattened whereas that of normal skin is wavy in the left beltline, right shoulder, right thigh, and right flank.
Table 1.
Pilot study of OCT imaging for cutaneous cGvHD versus healthy normal skin
| Physical exam | OCT measurement | |||||||||
|---|---|---|---|---|---|---|---|---|---|---|
| SC | E | SC:E | ||||||||
| Body Site | Patient (Vienna Scale) | Patient (μm ± SD) | Normal (μm ± SD) | Patient : Normal Ratio | Patient (μm ± SD) | Normal (μm ± SD) | Patient : Normal Ratio | Patient (μm ± SD) | Normal (μm ± SD) | Patient : Normal Ratio |
| Left beltline | 4 | 115 ± 9 | 56 ± 8 | 2.05 | 68 ± 4 | 139 ± 7 | 0.49 | 1.69 | 0.40 | 4.23 |
| Right shoulder | 2 | 101 ± 10 | 55 ± 5 | 1.84 | 61 ± 5 | 145± 7 | 0.42 | 1.66 | 0.38 | 4.42 |
| Right thigh | 3 | 125 ± 7 | 58 ± 12 | 2.16 | ND | 138 ± 14 | <0.04 | >20.83 | 0.42 | >49.60 |
| Right flank | 4 | 98 ± 5 | 58 ± 8 | 1.69 | ND | 116 ± 9 | <0.05 | >16.33 | 0.50 | >32.66 |
| Left back | 4 | 112 ± 5 | 52 ± 5 | 2.15 | 67 ± 13 | 146 ± 20 | 0.46 | 1.67 | 0.36 | 4.64 |
| Right palm | 4 | 123 ± 7 | 58 ± 11 | 2.12 | 61 ± 10 | 305 ± 18 | 0.2 | 2.02 | 0.19 | 10.63 |
Key: E – epidermis, GvHD – graft-versus-host disease, ND - Beyond resolution (6 μm) of OCT device to quantify, OCT – optical coherence tomography, SC – stratum corneum, SD – standard deviation
Figure 2. Representative OCT images from the pilot study.
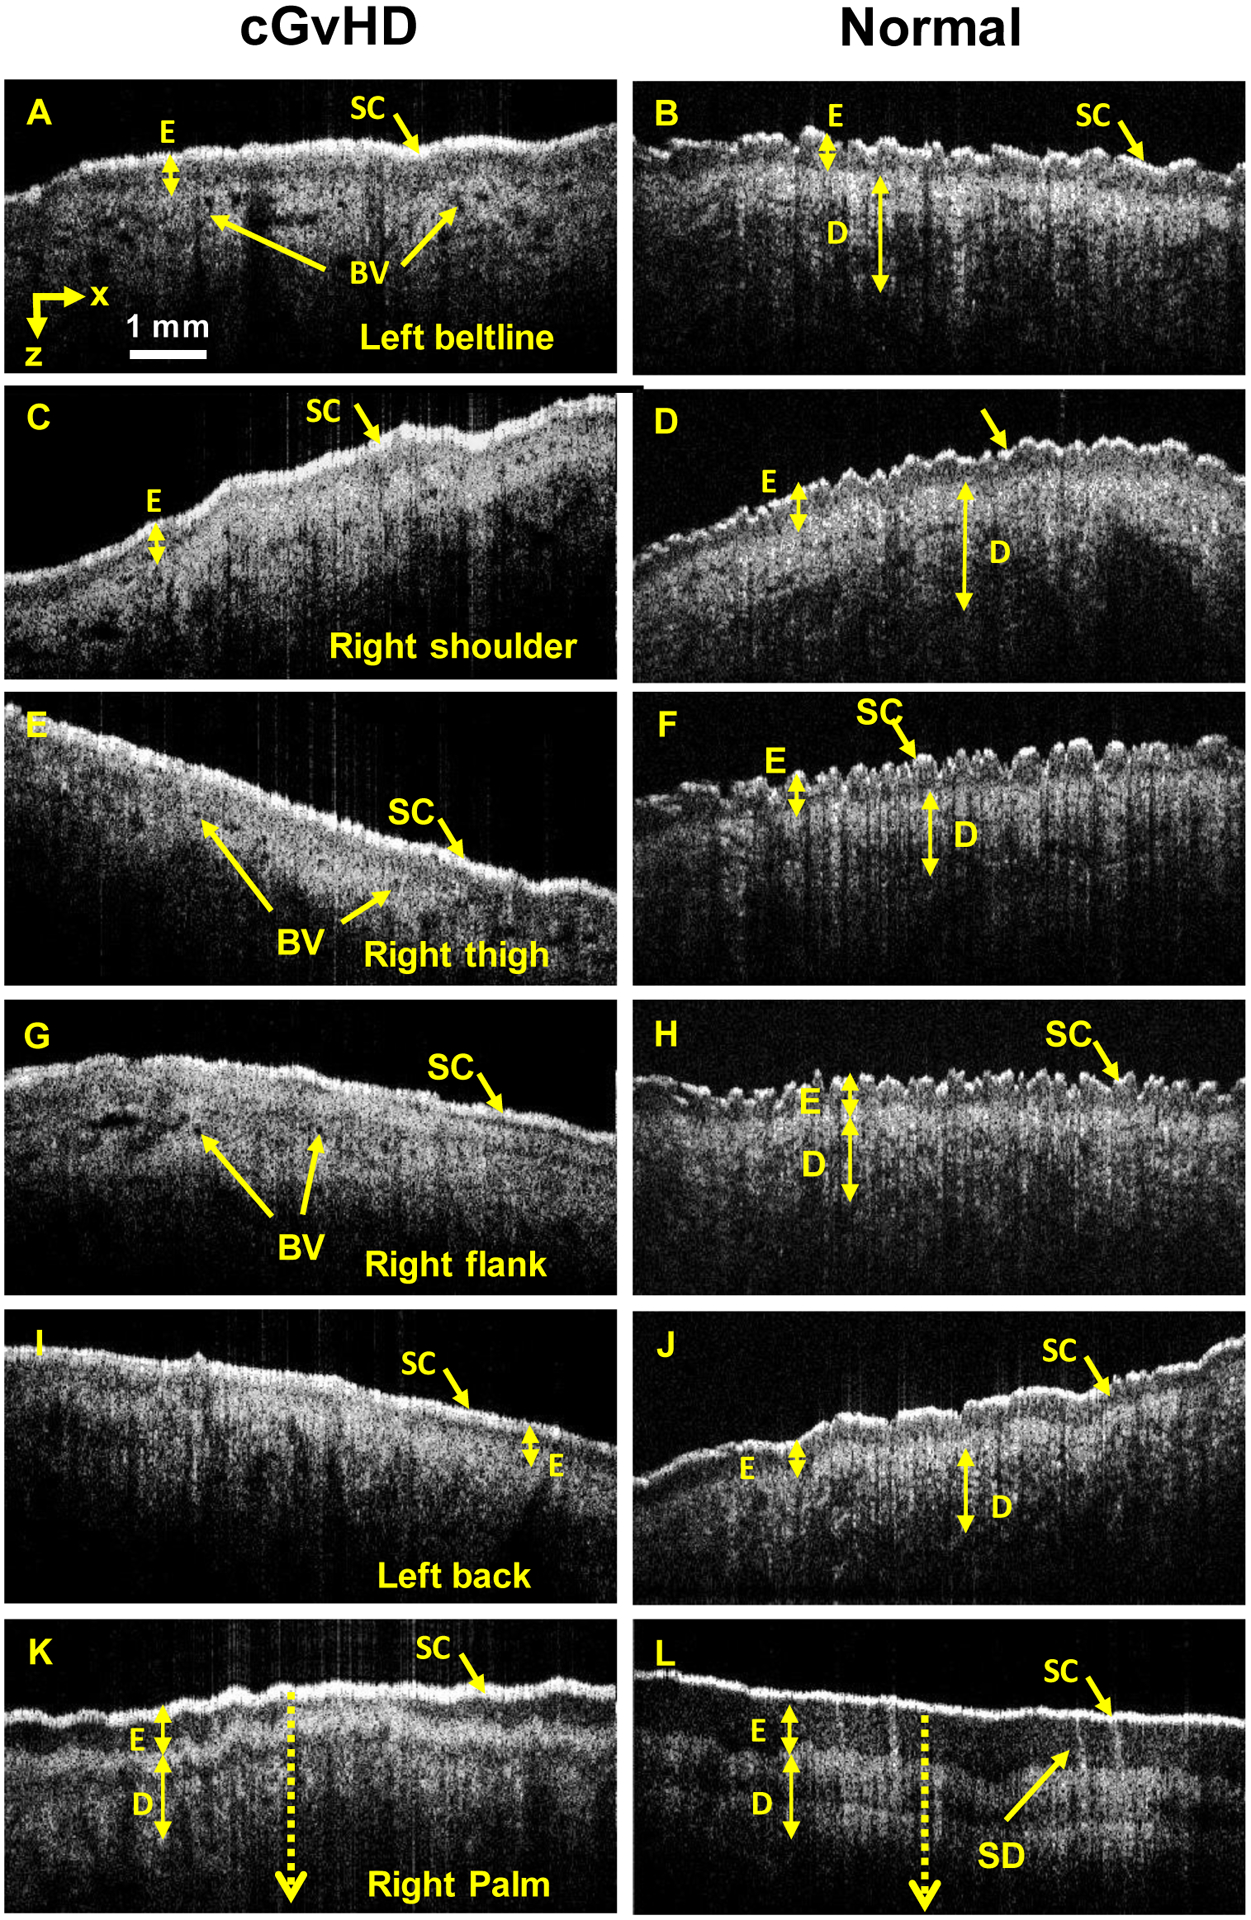
Cross sectional profiles (B-scan) and surface imaging at the left beltline (A+B), right shoulder (C+D), right thigh (E+F), right flank (G+H), left back (I+J), and right palm (K+L) are shown. SC and E measurements are presented in Table 1. Baseline SC +E values were determined from the control images. Key: BV – blood vessel, D -dermis, E – epidermis, SC – stratum corneum, SD – sweat duct.
This exploratory study comparing cGvHD with healthy normal skin demonstrated that in cGvHD, the SC layer is thickened, the E layer is thinned, the SC:E ratio reverses, and a change in cross sectional skin surface morphology occurs. Based upon these results demonstrating quantitative and qualitative imaging differences between cGvHD affected and normal skin at a limited number of body sites, a more comprehensive evaluation of OCT imaging of cutaneous cGvHD at 33 body sites was implemented.
OCT imaging of a cross section of cutaneous cGVHD and control skin lesions
Six additional patients with varying degrees of cutaneous cGvHD including three autoHCT controls underwent clinical examination and OCT imaging at 33 body sites (Supplemental Tables 1 & 2). Although cGvHD is a systemic disease, not all body sites were clinically affected by cGvHD in the study population.
The correlation between clinical examination and OCT measurements was considered at each body site (Table 2). In this analysis, paired body sites (ie. the left and right side) were considered together. We observed significant positive correlation between physical examination ratings of the skin and OCT measurements of SC thickness in the upper back, E thickness in the dorsum of the hand, flexor forearm, extensor forearm, medial upper arm, and center palm, and T depth in the center palm. Clinical examination of the skin negatively correlated with E thickness in the posterior thigh and T depth in the anterolateral leg, and calf. OCT did not correlate with the clinical examination at the remaining body sites. OCT changes observed at the posterior thigh and upper back in the cross sectional study paralleled the OCT changes observed at the thigh and back in the pilot study.
Table 2.
Correlation between OCT imaging and clinical examination in cross-sectional study
| Body Site | SC | E | T | ||||||
|---|---|---|---|---|---|---|---|---|---|
| N | P value | Rho | N | P value | Rho | N | P value | Rho | |
| Middle Finger | 12 | * | 12 | * | 12 | * | |||
| Dorsum Hand | 12 | * | 12 | <0.01 | 0.77 | 12 | * | ||
| Flexor Forearm | 12 | * | 12 | 0.02 | 0.67 | 12 | * | ||
| Extensor Forearm | 12 | * | 12 | <0.01 | 0.77 | 12 | * | ||
| Medial Upper Arm | 12 | * | 12 | <0.01 | 0.81 | 12 | * | ||
| Anterior Thigh | 12 | * | 12 | * | 12 | * | |||
| Posterior Thigh | 10 | * | 10 | 0.03 | −0.70 | 10 | * | ||
| Anterolateral Leg | 12 | * | 12 | * | 12 | <0.01 | −0.77 | ||
| Calf | 10 | * | 10 | * | 10 | 0.03 | −0.70 | ||
| Dorsum Foot | 12 | * | 12 | * | 12 | * | |||
| Anterior Chest | 6 | * | 6 | * | 6 | * | |||
| Anterior Axillary Fold | 11 | * | 11 | * | 11 | * | |||
| Forehead | 5 | * | 5 | * | 5 | * | |||
| Anterior Flank | 10 | * | 10 | * | 10 | * | |||
| Anterior Abdomen | 6 | * | 6 | * | 6 | * | |||
| Posterior Flank | 10 | * | 10 | * | 10 | * | |||
| Center Palm | 12 | * | 12 | <0.01 | 0.86 | 12 | <0.01 | 0.92 | |
| Upper Back | 10 | 0.03 | 0.70 | 10 | * | 10 | * | ||
Key:
nonsignificant, E – epidermis, NA – not available, OCT – optical coherence tomography, SC – stratum corneum, T – depth of light transmission
We used the statistically significant correlations which were identified in this cross sectional analysis to generate a set of body site specific guidelines to interpret OCT imaging of cutaneous cGvHD lesions (Table 3).
Table 3.
Proposed guidelines for interpreting OCT imaging in cutaneous cGvHD
| Body site | Interpretation |
|---|---|
| Dorsum hand Flexor forearm Extensor forearm Medial upper arm Center palm |
E thickness increases as cGvHD worsens |
| Center palm | T depth increases as cGvHD worsens |
| Upper back | SC thickness increases as cGvHD worsens |
| Posterior thigh | E thickness decreases as cGvHD worsens |
| Anterolateral leg Calf |
T depth decreases as cGvHD worsens |
Key: E – epidermis, cGvHD – chronic graft-versus-host disease, OCT – optical coherence tomography, SC – stratum corneum, T – depth of light transmission
OCT imaging of evolving cutaneous cGvHD lesions
Longitudinal OCT imaging and clinical examination of one of the six patients in the cross-sectional study was performed in the context of a phase 1/2 clinical trial of nilotinib for cGvHD.[15]
The patient was a 51 year old female who received a 10/10 HLA matched unrelated donor peripheral blood stem cell graft for myelodysplastic syndrome. The conditioning regimen was fludarabine / melphalan and the aGVHD prophylaxis regimen was micro-dose methotrexate, tacrolimus, and mycophenolate mofetil.[16] Approximately two years after her donor graft infusion, the patient developed cutaneous cGvHD. The patient received and progressed through multiple treatments for cGvHD over next two years including tacrolimus, methylprednisolone, extra-corporeal photopheresis, hydroxychloroquine, rituximab, and acitretin.
1615 days after her donor cell infusion, the patient was enrolled onto a phase I clinical trial of nilotinib for cGvHD (NCT01155817) and underwent OCT imaging at baseline and at 3 months.[15] Upon enrollment, cutaneous cGvHD covered 90% of her body surface area. The NIH cGvHD skin score was 3. Hidebound non-moveable disease involved her anterior torso, arms, and legs, and moveable disease involved her posterior torso. Due to the combination of cutaneous sclerosis and deep fasciitis, the range of motion in the patient’s wrists and shoulders was decreased limiting the patient’s ability to dress herself and tie shoelaces. The joint range of motion graded by the P-ROM scale 5/7 in the shoulders and elbow, 2/7 in the wrists, and 2/4 in the ankles.
At 3 months of follow-up, the patient had a mixed response to therapy (Supplemental Table 3). The NIH cGvHD skin score remained 3. Clinically significant improvement occurred in the left and right anterior axillary fold and left and right upper back overlying the scapula. The wrist range of motion graded by the P-ROM scale improved from 2/7 to 5/7 (the shoulder, elbow, and ankle P-ROM remained the same). However, the dose of methylprednisolone had increased to 48 mg daily and the patient remained on nilotinib, hydroxychloroquine, tacrolimus, topical tacrolimus, and topical hydrocortisone.
Supplemental Table 3 shows serial OCT imaging measurements at 33 body sites for this patient with representative images in Figure 3 and Supplemental Figure 2. We applied the proposed guidelines (Table 3) for OCT imaging determined by the cross sectional analysis to the baseline and post therapy images to determine if OCT imaging could be used to follow cutaneous cGvHD lesions serially. For the body sites that improved or worsened on clinical examination, the OCT imaging changed as expected in 8/11 instances. For those body sites that did not change upon clinical examination, OCT imaging changed in a way that suggested improvement in 7/9 instances.
Figure 3. OCT images from longitudinal study at body sites with clinical responses by Vienna Scale.
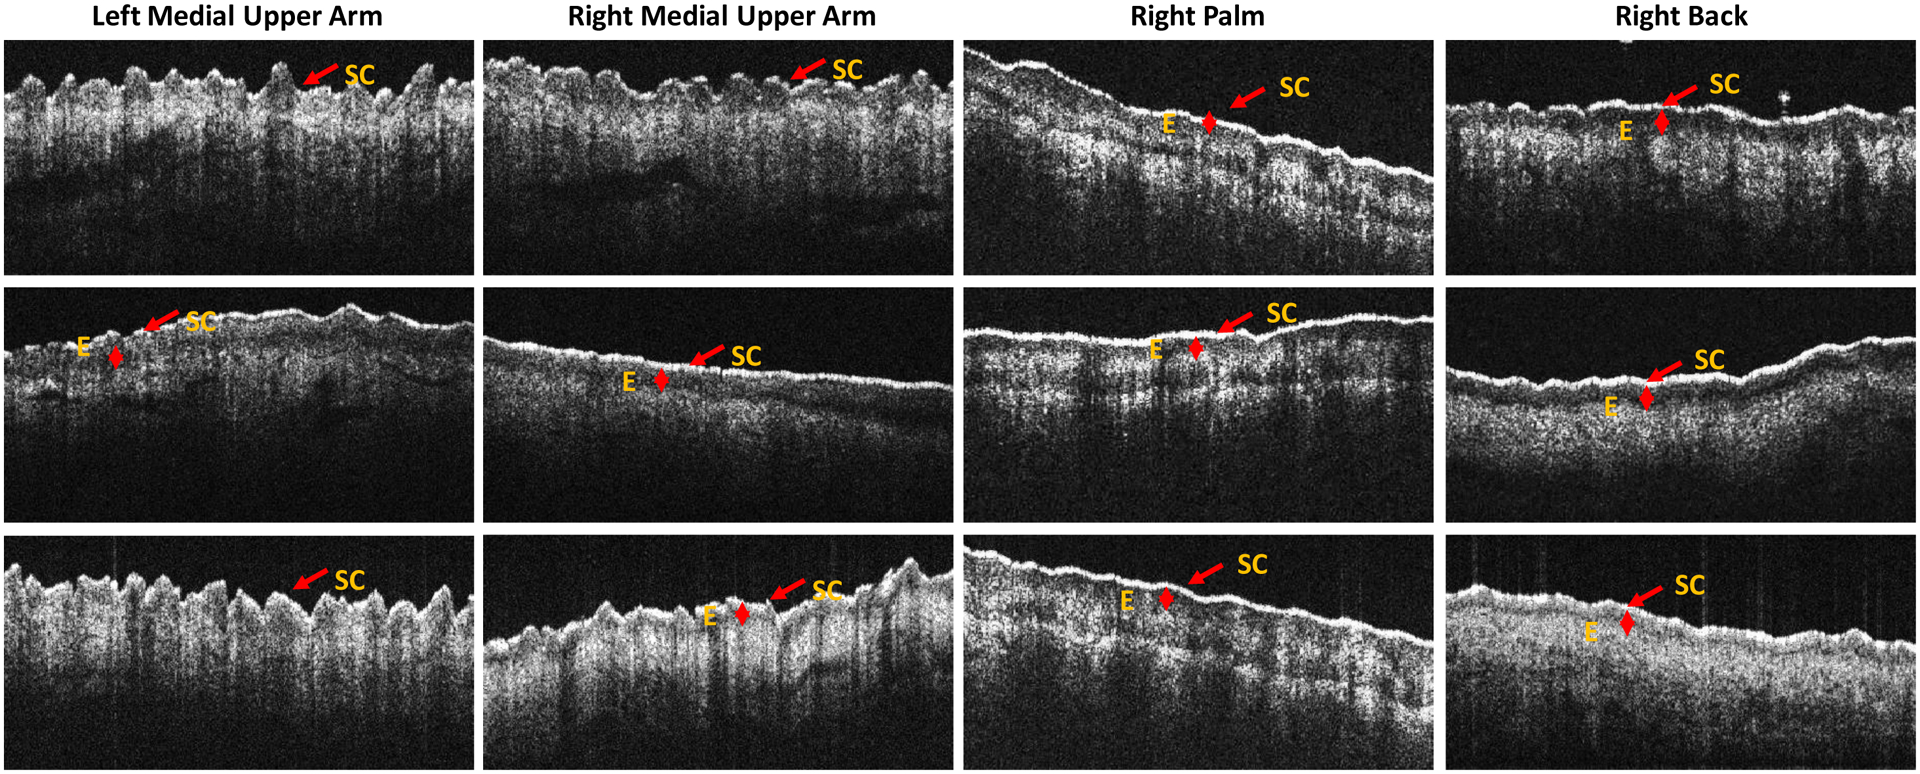
Top row – healthy normal control. Middle row – pre-nilotinib treatment. Bottom row – post-nilotinib treatment. In the left medial upper arm, the Vienna Scale improved from 4 to 3. The expected OCT change was decreased E which changed from 190 to undetectable. Similar changes occurred in the right medial upper arm with improvement in Vienna Scale from 4 to 3 and decrease in E from 124 to 83. In the right palm, the Vienna Scale worsened from 0 to 2. The expected OCT change was increased E which changed from 124 to 148 and increased T which changed from 835 to 925. In the right upper back, the Vienna Scale improved from 4 to 2. The expected OCT change was decreased SC thickness which changed from 105 to 82. Key: SC – stratum corneum, E – epidermal layer.
Discussion
In this study, we evaluated the applicability of OCT imaging to cutaneous cGvHD. The feasibility of this approach has been previously demonstrated in patients with cGvHD and scleroderma.[17] OCT imaging from subjects with varying severities of cGvHD was compared to imaging from a healthy normal control and subjects who received high dose chemotherapy and autologous stem cell rescue. We demonstrated that OCT can detect differences between cutaneous cGvHD and normal skin, that OCT imaging parameters positively and negatively correlate with the clinical examination of the skin at the dorsum of the hand, forearm, medial upper arm, posterior thigh, leg, calf, palm, and upper back, and that it is possible to follow cutaneous cGVHD lesions at these sites with serial OCT imaging before and after treatment.
The correlations we observed between the clinical examination and OCT parameters were biologically plausible. At the dorsum of the hand, forearm, medial upper arm, leg, calf, and upper back, SC and E magnitude increased as Vienna Scale increased and cGvHD worsened, paralleling the epidermal hyperplasia and hyperkeratosis of the stratum corneum that is observed in the histology of lichenoid cutaneous cGvHD.[18–20] Decreased depth of light transmission (T) with worsened cGvHD severity may have been due to changes in the optical qualities of the underlying tissues caused by the inflammatory cellular infiltrate and hypergranulosis which are also observed in lichenoid cutaneous cGvHD.
In contrast, the correlation between the Vienna Scale and E thickness at the posterior thigh and T depth at the palm was reversed and not consistent with what was observed at the other sites. Decreased E thickness could be consistent with the epithelial and adnexal atrophy seen in the histology of sclerotic cutaneous cGvHD. Similarly, increased T depth could be consistent the decreased cellular infiltrate and homogenization of the dermal layer that is also observed in sclerotic cutaneous cGVHD.
Lichenoid cutaneous cGvHD is thought to represent an earlier lesion than sclerotic cutaneous cGvHD. The presence of dyssynchronous lesions (ie. upper back versus the arm or leg) in the same patient may be due to the predilection of certain body sites to develop cutaneous cGVHD. Thus, some body sites may have more advanced lesions than others. The palm in this case might represent a lesion transitioning between the lichenoid and sclerotic histology. These differences between body sites highlight the importance of site specific serial measurements as well as the need to establish body site specific criteria for interpreting OCT imaging.
Our data suggest that OCT imaging could be used to monitor cGvHD cutaneous lesions. Because OCT imaging is based upon the physical characteristics (refraction of light, transmission of light) and microanatomy of the lesions and not specific to the underlying pathophysiology, OCT could be used as a pharmacodynamic response variable to any single therapy or combination of therapies for cGVHD. These data, however, are preliminary and will need additional validation before OCT can be used in cGvHD clinical trials to quantify responses. Ultimately, OCT could be used at the point of care in clinical practice in conjunction with physical examination. OCT is unlikely to supplant physical examination and skin grading systems such as the Vienna Scale because of the relative ease of the latter. But, if OCT can be shown to be more sensitive to the development of cutaneous cGVHD, then it may be possible to pre-emptively treat cGvHD before the development of symptoms detectable by physical examination. This could potentially change the treatment of chronic GvHD after alloHCT.
Ultrasound and MRI ± PET have previously been used to image cutaneous chronic GvHD. [21–24] Ultrasound is analogous to OCT with regard to the logistics of imaging and the form of output with the possible exception that the image resolution may be lower due to the longer wavelength that is used. Imaging time is likely to be similar depending on the extent of the examination (number of sites imaged). Costs between commercially available ultrasound and OCT imaging systems are comparable. In contrast, MRI provides a different perspective because it can image tissues deeper than the skin such as muscle and subcutaneous fat. It may be less feasible to apply MRI at the point of care and with the same frequency as OCT/ultrasound. Finally, MRI machines are likely to be more expensive that OCT machines although this is less of an issue given that many hospitals already have MRI capabilities.
The strength of this study was that it was a prospective study with systematic collection of measurement over a large number of different body sites for many different severities of cGvHD lesions ranging from 0 to 4 on the Vienna Scale and that for paired body sites replicate measures could be obtained.
This study, however, is limited by its preliminary nature. Although we found correlation between the clinical exam and OCT measurements at some of the body sites tested, no correlation was found in approximately half the body sites that were studied. This may have been due to small number of patients and because not every anatomic site was affected making it not possible to determine if severity varied with OCT measurements. There may not have been enough variation and datapoints to generate a trend which resulted in the lack of correlation that was found between OCT measurements and clinical examination in some of the body sites in the cross sectional study. Similarly, in the longitudinal study, there were not enough repeat measures to determine the temporal relationship between OCT and clinical examination changes. Therefore, future studies should seek to enroll an adequate number of subjects to ensure that the underlying variability is captured in all body sites to validate and extend our finding that OCT measurements reflect the severity of cutaneous chronic GvHD. Furthermore, an adequate number of serial measurements should be done to truly determine if OCT changes can precede clinical changes. Data gathering should be as comprehensive as possible. Significant correlations between OCT and clinical examinations could potentially be found at additional body sites with a more comprehensive data set. Finally, if multiple sites are involved in future studies, standardization of OCT imaging methodology will be necessary to ensure comparability of data.
During these initial studies with the prototype handheld OCT imaging scanner, we experienced technical difficulties associated with the sensitivity of the optical systems to environmental variables. Delays occurred due to the sensitivity of the laser alignment to environmental forces such as jarring of the cart upon which the optics were mounted. Prior to full application of OCT imaging to the clinical setting, design and implementation of OCT portable imaging should be refined so that the optics can better withstand the vicissitudes of the clinical environment.
In conclusion, we present the in vivo use of OCT to image human cGvHD cutaneous lesions. Quantifiable features that can be detected and may reflect cGvHD severity and response to therapy are depth of light transmission and thickness of the stratum corneum and epidermal layer. Other quantifiable features may be identified with further refinement and experience with OCT imaging. These results suggest that OCT imaging may be a clinically useful technique for following cGvHD skin lesions. Further prospective studies are necessary to determine if OCT imaging changes can predict the development of cGvHD prior to the onset of clinically observable changes.
Supplementary Material
Highlights.
We tested the applicability of optical coherence tomography (OCT) to visualize and quantitate the thickness of skin layers in cutaneous chronic graft versus host disease (cGvHD) lesions.
We found that the thickness of the stratum corneum and epidermal layers, and the depth of light transmission as measured by OCT varied with the severity of cutaneous cGvHD as measured by the Vienna Skin Scale in the hands, forearms, upper arms, legs, thighs, and upper back.
Acknowledgements
We thank the patients who participated in this study and the Transplant and Cellular Therapy clinical team for excellent patient care.
This research was supported by the Pilot Studies program of the University at Buffalo Clinical and Translational Research Center and the Buffalo Translational Consortium, funds from the RPCCC Department of Medicine, NCI grant # P30-CA016056, the National Research Foundation of Korea (NRF) grant funded by the Korean government Ministry of Science and Information and Communication Technology (NRF-2019R1A2C2006269), and in part by the Basic Science Research Program through the NRF funded by the Ministry of Education (2020R1A6A1A03047902).
Footnotes
Conflict of interest disclosures
None of the authors have a competing financial interest to disclose.
References
- [1].Socie G, Stone JV, Wingard JR, Weisdorf D, Henslee-Downey PJ, Bredeson C, et al. Long-term survival and late deaths after allogeneic bone marrow transplantation. Late Effects Working Committee of the International Bone Marrow Transplant Registry. N Engl J Med. 1999;341:14–21. [DOI] [PubMed] [Google Scholar]
- [2].Inamoto Y, Storer BE, Petersdorf EW, Nelson JL, Lee SJ, Carpenter PA, et al. Incidence, risk factors, and outcomes of sclerosis in patients with chronic graft-versus-host disease. Blood. 2013;121:5098–103. [DOI] [PMC free article] [PubMed] [Google Scholar]
- [3].Jacobsohn DA, Chen AR, Zahurak M, Piantadosi S, Anders V, Bolanos-Meade J, et al. Phase II study of pentostatin in patients with corticosteroid-refractory chronic graft-versus-host disease. J Clin Oncol. 2007;25:4255–61. [DOI] [PubMed] [Google Scholar]
- [4].Greinix HT, Pohlreich D, Maalouf J, Soukup P, Supper V, Kalhs P, et al. A single-center pilot validation study of a new chronic GVHD skin scoring system. Biol Blood Marrow Transplant. 2007;13:715–23. [DOI] [PubMed] [Google Scholar]
- [5].Jagasia MH, Greinix HT, Arora M, Williams KM, Wolff D, Cowen EW, et al. National Institutes of Health Consensus Development Project on Criteria for Clinical Trials in Chronic Graft-versus-Host Disease: I. The 2014 Diagnosis and Staging Working Group report. Biol Blood Marrow Transplant. 2015;21:389–401 e1. [DOI] [PMC free article] [PubMed] [Google Scholar]
- [6].Huang D, Swanson EA, Lin CP, Schuman JS, Stinson WG, Chang W, et al. Optical coherence tomography. Science. 1991;254:1178–81. [DOI] [PMC free article] [PubMed] [Google Scholar]
- [7].Moharram MA, Yeoh T, Lowe HC. Swings and roundabouts: Intravascular Optical Coherence Tomography (OCT) in the evaluation of the left main stem coronary artery. Int J Cardiol. 2011;148:243–4. [DOI] [PubMed] [Google Scholar]
- [8].Povazay B, Hofer B, Torti C, Hermann B, Tumlinson AR, Esmaeelpour M, et al. Impact of enhanced resolution, speed and penetration on three-dimensional retinal optical coherence tomography. Opt Express. 2009;17:4134–50. [DOI] [PubMed] [Google Scholar]
- [9].Sattler E, Kastle R, Welzel J. Optical coherence tomography in dermatology. Journal of biomedical optics. 2013;18:061224. [DOI] [PubMed] [Google Scholar]
- [10].Jung W, Kim J, Jeon M, Chaney EJ, Stewart CN, Boppart SA. Handheld optical coherence tomography scanner for primary care diagnostics. IEEE Trans Biomed Eng. 2011;58:741–4. [DOI] [PMC free article] [PubMed] [Google Scholar]
- [11].Pan Y, Li Z, Xie T, Chu CR. Hand-held arthroscopic optical coherence tomography for in vivo high-resolution imaging of articular cartilage. J Biomed Opt. 2003;8:648–54. [DOI] [PubMed] [Google Scholar]
- [12].Rollins A, Yazdanfar S, Kulkarni M, Ung-Arunyawee R, Izatt J. In vivo video rate optical coherence tomography. Opt Express. 1998;3:219–29. [DOI] [PubMed] [Google Scholar]
- [13].Team RC. R: A language and environment for statistical computing. R Foundation for Statistical Computing, Vienna, Austria. ISBN 3-900051-07-0; 2015. [Google Scholar]
- [14].Alex A, Povazay B, Hofer B, Popov S, Glittenberg C, Binder S, et al. Multispectral in vivo three-dimensional optical coherence tomography of human skin. Journal of biomedical optics. 2010;15:026025. [DOI] [PubMed] [Google Scholar]
- [15].Chen GL, Carpenter PA, Broady R, Gregory TK, Johnston LJ, Storer BE, et al. Anti-Platelet-Derived Growth Factor Receptor Alpha Chain Antibodies Predict for Response to Nilotinib in Steroid-Refractory or -Dependent Chronic Graft-Versus-Host Disease. Biol Blood Marrow Transplant. 2018;24:373–80. [DOI] [PMC free article] [PubMed] [Google Scholar]
- [16].Chen GL, Zhang Y, Hahn T, Abrams S, Ross M, Liu H, et al. Acute GVHD prophylaxis with standard-dose, micro-dose or no MTX after fludarabine/melphalan conditioning. Bone Marrow Transplant. 2014;49:248–53. [DOI] [PMC free article] [PubMed] [Google Scholar]
- [17].Deegan AJ, Talebi-Liasi F, Song S, Li Y, Xu J, Men S, et al. Optical coherence tomography angiography of normal skin and inflammatory dermatologic conditions. Lasers Surg Med. 2018;50:183–93. [DOI] [PMC free article] [PubMed] [Google Scholar]
- [18].Ziemer M Graft-versus-host disease of the skin and adjacent mucous membranes. J Dtsch Dermatol Ges. 2013;11:477–95. [DOI] [PubMed] [Google Scholar]
- [19].Shulman HM, Cardona DM, Greenson JK, Hingorani S, Horn T, Huber E, et al. NIH Consensus development project on criteria for clinical trials in chronic graft-versus-host disease: II. The 2014 Pathology Working Group Report. Biol Blood Marrow Transplant. 2015;21:589–603. [DOI] [PMC free article] [PubMed] [Google Scholar]
- [20].Heymer B, Bunjes D, Friedrich W. Clinical and diagnostic pathology of graft-versus-host disease (GvHD). Berlin ; New York: Springer; 2002. [Google Scholar]
- [21].Sauter AW, Schmidt H, Mantlik F, Kolb A, Federmann B, Pfannenberg C, et al. Imaging findings and therapy response monitoring in chronic sclerodermatous graft-versus-host disease: preliminary data of a simultaneous PET/MRI approach. Clin Nucl Med. 2013;38:e309–17. [DOI] [PubMed] [Google Scholar]
- [22].Horger M, Boss A, Bethge W, Faul C, Fierlbeck G, Bornemann A, et al. MR findings in patients with disabling musculocutaneous chronic graft-versus-host disease. Skeletal Radiol. 2008;37:885–94. [DOI] [PubMed] [Google Scholar]
- [23].Osmola-Mankowska A, Silny W, Danczak-Pazdrowska A, Polanska A, Olek-Hrab K, Sadowska-Przytocka A, et al. “Assessment of chronic sclerodermoid Graft-versus-Host Disease patients, using 20 MHz high-frequency ultrasonography and cutometer methods”. Skin Res Technol. 2013;19:e417–22. [DOI] [PubMed] [Google Scholar]
- [24].Clark J, Yao L, Pavletic SZ, Krumlauf M, Mitchell S, Turner ML, et al. Magnetic resonance imaging in sclerotic-type chronic graft-vs-host disease. Arch Dermatol. 2009;145:918–22. [DOI] [PMC free article] [PubMed] [Google Scholar]
Associated Data
This section collects any data citations, data availability statements, or supplementary materials included in this article.