

Abstract
Most of the adrenal masses are incidentally detected. Multiphasic CT forms the mainstay for diagnosis and characterization of adrenal masses. MRI can further be used if the masses are indeterminate on CT scan. But as these investigations are expensive with risk of radiation exposure, contrast-enhanced ultrasound (CEUS) is currently under evaluation to assess its utility to act as a screening modality to differentiate benign vs malignant adrenal masses This investigative modality is relatively safe and can be used in patients having renal dysfunction or allergy to CT contrast. We, hereby, present a pictorial review of imaging appearance of various adrenal lesions on CEUS with CT and MRI correlation.
Introduction
Since the introduction of ultrasound contrast in 1996, it has come a long way with substantial increase in its applications.1 It was first introduced to be utilised in cardiovascular imaging. Since then contrast-enhanced ultrasound (CEUS) has been found to be useful in vascular ultrasound, characterization of breast lesion and hepatic masses. Only few studies2 have been performed in humans which have shown potential of CEUS in differentiating benign vs malignant masses in adrenal masses.
Approximately 10% of adrenal masses are functional and can produce symptoms due to excess production of hormones.3 Rest of the masses are usually detected incidentally or when they produce symptoms due to mass effect. The incidence of adrenal incidentalomas varies from 3 to 7% with majority being benign, amongst which most common is adenomas.4 Malignancy is seen in only 5% of the cases.3 Triphasic CECT (adrenal protocol), which includes a limited non-contrast scan followed by porto venous phase of CECT and delayed scan at 15 min, is currently investigation of choice for characterisation of adrenal lesions. MRI is further obtained in indeterminate lesions. The adrenal masses can be detected with ultrasound. However, non-contrast ultrasound cannot reliably differentiate benign from malignant masses. With the introduction of contrast in ultrasound, characterisation of adrenal masses is under evaluation. A study by Friedrich-Rust has obtained sensitivity of 100% and specificity of 67% in diagnosing malignant adrenal masses with CEUS.2 In contrast, another study by Dietrich et al5 found low sensitivity of about 50% and specificity of ~68% of centripetal contrast filling pattern (peripheral to central) in detecting malignancy in adrenal lesions.
CUES can prove as a reliable screening modality for adrenal lesions. Its sensitivity to identify malignant adrenal masses is 100%, thus it is unlikely to miss malignancy, although the specificity is 82%.2 It can prove to be useful especially in renal dysfunction where contrast cannot be administered either in CT or MRI or in cases of contrast allergy. The objective of this pictorial review is to depict imaging appearance of various adrenal lesions on CEUS as compared to CT/MRI.
CEUS technique
The CEUS technique comprised of intravenous injection of 0.6 ml of SonoVue followed by 10 ml saline bolus through 18 G cannula. Scanning was performed continuously from start of injection to 3 min using low mechanical index (MI: 0.1–0.5). This was followed by momentary “burst” of CEUS agent at high MI (MI > 0.5). Intermittent scanning at low MI was subsequently performed till 5 min. CEUS in adrenal lesions was assessed for feasibility and qualitative enhancement patterns in arterial (0–30 s), venous (30–120 s) and delayed (120–180 s). Lesions were characterised based on ultrasound morphology, CEUS pattern and degree of enhancement. Patients were observed for any complication, which is although rare following USG contrast administration, however rarely anaphylactic reactions may occur as reported by Olson et al.
CEUS appearances of various adrenal lesions
Early enhancement was noted in pheochromocytoma, adrenocortical carcinoma and metastasis whereas hypoenhancing lesions were observed in adenomas and granulomatosis. These findings were consistent with the early arterial and arterial pattern of enhancement (Type I and II curves, respectively) described in all malignant lesions by Freidrich-Rust et al2. Bunni et al6 also described rapid early enhancement with very late washout in a pheochromocytoma. Arterial enhancement is significantly less common in benign adenomatous lesions. Necrosis was well picked up on CEUS and favoured non-benign aetiology.
Adrenal adenoma
Adrenal adenomas are the most common tumours of adrenal gland.3 They are non-functioning in 95% cases and the affected patients remain asymptomatic.7 They are generally small in size (<3 cm) and homogeneous in density. Lipid-rich adenoma is the one which has abundance of fat within the lesion whereas those which contain only little or microscopic fat, or haemorrhage, calcification or necrosis are atypical adenomas.
On NCCT, if the density of the adrenal incidentaloma is less than 10 HU, it is diagnostic for adrenal adenoma sensitivity and specificity of which is nearly 71 and 98%.8 If the density is greater than 10 HU, Absolute percentage washout (APW) >60% and Relative percentage washout (RPW) >40% confirms it to be adenoma9 (Figure 1). Lipid poor adenoma can be diagnosed on MRI with chemical shift imaging. On non-contrast ultrasound, these lesions are small solid masses having an average size of 1.5 cm, which makes them difficult to detect on ultrasound. They have regular, well-defined margins and are hypoechoic in echogenicity. On colour doppler, they appear as hypovascular lesions. CEUS would depict these lesions to be non-enhancing in all the phases. If on the right side, the enhancement is to be compared to liver and on the left side-with spleen (Figure 2).
Figure 1.

CECT axial images of 43-year-old female with incidentally detected left adrenal lesion. Attenuation on non-contrast image (a) was 21 HU, venous phase (b) was 70 HU and delayed phase (c) was 27 HU with absolute washout value of 87% and relative washout value of 61% consistent with lipid-poor adenoma.
Figure 2.

B-mode US image (a) shows hypoechoic appearance of adenoma (arrow). CEUS at 30 s (b) shows non-enhancing spleen (S), at 44 s (c) and 134 s (d)show enhancing spleen (S) while adenoma remains non-enhancing (arrow).
Pheochromocytoma
Pheochromocytoma account for 3% of all the adrenal incidentalomas in patients having no history of cancer.10 As most of the patients are symptomatic, diagnosis is established by combination of clinical history, biochemical evaluation, radiological investigation and nuclear scanning (MIBG scan).
Pheochromocytoma can have variable size, ranging from 1 to 15 cm.11 On CT, they can be solid, cystic or complex masses having variable density, there may be presence of hemorrhage or calcification or necrosis. They show avid post contrast enhancement which is usually heterogeneous (Figure 3). Necrosis may or may not be present. Rarely, they can mimic adenomas and show wash in and wash out pattern like adenoma. On MRI, pheochromocytoma may show marked hyperintense signal on T2W images, also known as light bulb sign (Figure 4). On USG, the mass may have variable size with heterogeneous echogenicity. They are generally well encapsulated and show marked vascularity on colour doppler. On CEUS, they show arterial enhancement with wash out of contrast in venous phase. Necrosis, if present, will be evident in delayed contrast enhanced scans (Figures 5–7).
Figure 3.

Axial (a), Coronal (b) CECT images in a proven case of pheochromocytoma shows enhancing left adrenal mass (red arrow) with central necrosis.
Figure 4.

Axial T1 W MR image (a) depicts an hypointense mass in right suprarenal location, axial (b) & coronal (c, d) T2W images depict heterogeneously hyperintense mass in right suprernal location. There are areas of even brighter T2 hyperintensity within the lesion likely necrosis. This was a confirmed case of pheochromocytoma.
Figure 5.

CEUS at 33 s (a) shows initial enhancement at the same time as spleen and is isovascular to spleen at 44 s (b) and 60 s (c) also. Washout was seen at 140 s (d) with central area of necrosis.
Figure 6.

CEUS images at 20 s (a), 23 s (b) and 29 s (c) show early enhancement of right adrenal lesion, is intensely hypervascular to liver (L) at 20, 23 s and slightly hypervascular to liver 29 s.
Figure 7.

CEUS image at 40 s (a) depicts the lesion is isovascular to liver and shows central non-enhancing area consistent with necrosis, (b) at 150 s, the liver shows washout of contrast while the lesion is still mildly hypervascular to liver. F/s/o hypervascular tumor – pheochromocytoma, (c) CEUS image shows an enhancing right renal hilar lymph node s/o nodal metastasis.
Granulomatous infections
Granulomatous infections like tuberculosis, histoplasmosis, coccidiomycosis rarely affect adrenal gland.12 Usually, there is asymmetric bilateral involvement in granulomatous infections. On CT, adrenal masses are hypoenhancing with cystic changes and speck of calcification. The manifestations of infection in other organs like pulmonary tuberculosis or histoplasmosis raise the suspicion for infective aetiology of adrenal masses with confirmation from histopathology (Figure 8). On ultrasound, bilateral adrenal glands show mass like enlargement with smooth contours and having heterogeneous echogenicity. Hyperechoic foci with twinkling artefact or posterior acoustic shadowing may be appreciated when there is calcification. On CEUS, no or late enhancement (pattern III &IV) may be seen (Figure 9).
Figure 8.

CECT coronal reformats (a, b) of chest show fibrotic opacities in right upper lobe and superior segment of right lower lobe. CECT abdomen axial images (c, d) show bilateral bulky adrenals with specks of calcification (arrows)-biopsy proven histoplasmosis.
Figure 9.

CEUS images of right adrenal mass at 39 s (a) and 69 s (b) show hypovascular right adrenal mass (arrows). CEUS image of left adrenal mass (c) at 141 s show similar hypovascular mass (arrow).
Adrenocortical carcinoma
Adrenocortical carcinomas are rare tumours with an incidence of 0.05–0.2%.13 Adrenocortical carcinoma should be suspected whenever the size of adrenal mass is greater than 4 cm and the tumour shows heterogeneous enhancement. Other subtle pointers are ill defined margins, presence of central necrosis, haemorrhage, calcification, invasion into surrounding organs and vascular structures and metastasis.
On CT, they have well or poorly defined margins. They can show heterogeneous enhancement with hemorrhage, calcification or central necrosis. Presence of necrosis as evaluated by few studies, has high correlation with presence of malignancy (Figure 10). APW and RPW are less than 60 and 40%, respectively. On MRI, adrenocortical carcinomas are usually iso to hypointense to liver on T1W images and heterogeneously hyperintense on T2W images. Rarely there can be fat within(less than <30%). On post contrast, there is rapid uptake of contrast with delayed wash out.
Figure 10.

CECT axial (a–c) and coronal (d) images of a 17-year-old girl show heterogeneously enhancing right adrenal mass (black arrow) with areas of necrosis (red arrow). This was a proven case of adrenocortical carcinoma.
On ultrasound, malignancy is suspected whenever the mass is large and heterogeneous. When small, they may be homogeneous. They have irregular outline with indistinct margins and are markedly hypervascular on colour doppler. On CEUS, there is rapid uptake of contrast in arterial phase with progressive fill in of contrast in venous phase. Wash out is seen only in delayed phase. There is usually an area of central necrosis (Figures 11 and 12).
Figure 11.

CEUS images at 16 s (a), 18 s (b), 23 s (c) and 29 s (d) show rapid, progressive enhancement of right adrenal mass (arrows).
Figure 12.

CEUS images at 44 s (a), s (b), 60 s (c) and 200 s show persistent enhancement at 44 s and 60 s with washout after 3 min. There are non-enhancing areas (red arrow) s/o necrosis-also seen on corresponding CT image.
Metastasis
Metastasis is second-most common incidentaloma and most common amongst the malignant adrenal lesions14 with the prevalence of around 3.1% . Usually, it is bilateral but can involve single adrenal gland or asymmetrically involve both adrenal glands. Small masses may be homogeneous but more commonly these are heterogeneous with or without presence of hemorrhage and necrosis. Calcification is rare in adrenal metastasis. They can appear as rounded masses or just as distortion of the architecture of adrenal glands. They show thick rim or solid enhancement. They will show wash out characteristics of malignant lesions. On MRI, they are hypo to isointense on T1W and heterogeneously hyperintense on T2W image. On routine ultrasound, it is difficult to detect small adrenal metastasis (<2 cm). When large, they are inhomogeneous masses with irregular outline. They are difficult to differentiate from primary adrenal carcinoma. In patients with history of known malignancy, any adrenal masses should be viewed with suspicion for metastasis. On CEUS, there will be rapid enhancement in arterial phase with persistence of contrast in venous phase. Delayed wash out is seen in most of the cases (Figure 13).
Figure 13.
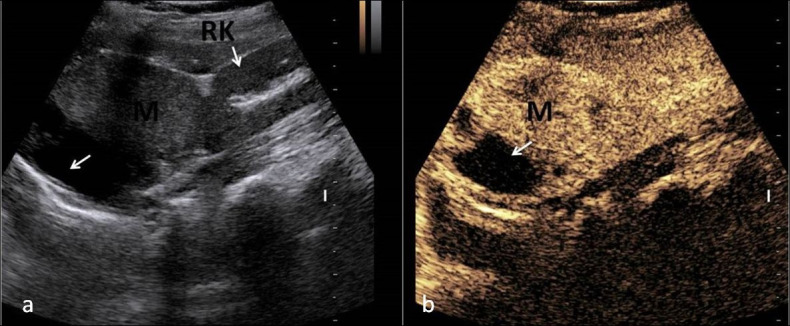
USG image (a) showing large heterogeneous mass in right suprarenal location, in a known case of carcinoma lung, Contrast-enhanced ultrasound image (b) showing avidly enhancing mass having area of necrosis in right suprarenal location consistent with metastasis.
Future role of contrast-enhanced ultrasound
Detection of adrenal incidentalomas has immensely increased, largely due to increased number of investigations the patient undergoes. In the work up of adrenal incidentalomas, the first step is to obtain a good clinical history followed by a thorough clinical examination. Second major step is hormonal testing. This is followed by the third step of imaging. In imaging, in accordance with the current guidelines,15 CECT or MRI is the first-line investigation for characterising the adrenal incidentalomas. However as the diagnostic ability of CEUS is seen to be high in a study by Friedrich et al2, CEUS could become as a first line screening modality. In addition, it could be helpful in patients with contrast issues or allergy but if metastasis or a malignancy is detected, at the present time, a biopsy is necessary. The investigation is inexpensive, free of radiation, safe from major side effects of contrast and easy to perform.
Conclusion
CEUS in adrenal lesions is still in an evolving stage. However as not many studies have been done to evaluate its role, studies with larger number of study group needs to be done for validating the efficacy of CEUS. Once validated, CEUS is a viable tool to characterize adrenal lesions without the risk of radiation exposure of CT and renal toxicity of CT and nephrogenic systemic fibrosis due to gadolinium retention in tissues with MR contrast agents.
Footnotes
Acknowledgements: We acknowledge the help of Dr Barun Bagga in preparation of the manuscript. This paper was presented as poster in ECR.
Contributor Information
Ankita Aggarwal, Email: dr.ankitaaggarwal@gmail.com.
Chandan Jyoti Das, Email: dascj@yahoo.com.
REFERENCES
- 1.Chung YE, Kim KW. Contrast-Enhanced ultrasonography: advance and current status in abdominal imaging. Ultrasonography 2015; 34: 3–18. doi: 10.14366/usg.14034 [DOI] [PMC free article] [PubMed] [Google Scholar]
- 2.Friedrich-Rust M, Glasemann T, Polta A, Eichler K, Holzer K, Kriener S, et al. Differentiation between benign and malignant adrenal mass using contrast-enhanced ultrasound. Ultraschall Med 2011; 32: 460–71. doi: 10.1055/s-0031-1273408 [DOI] [PubMed] [Google Scholar]
- 3.Dietrich CF, Correas JM, Dong Y, Nolsoe C, Westerway SC, Jenssen C. WFUMB position paper on the management incidental findings: adrenal incidentaloma. Ultrasonography 2020; 39: 11–21. doi: 10.14366/usg.19029 [DOI] [PMC free article] [PubMed] [Google Scholar]
- 4.Foti G, Faccioli N, Manfredi R, Mantovani W, Mucelli RP. Evaluation of relative wash-in ratio of adrenal lesions at early biphasic CT. AJR Am J Roentgenol 2010; 194: 1484–91. doi: 10.2214/AJR.09.3636 [DOI] [PubMed] [Google Scholar]
- 5.Dietrich CF, Ignee A, Barreiros AP, Schreiber-Dietrich D, Sienz M, Bojunga J, et al. Contrast-Enhanced ultrasound for imaging of adrenal masses. Ultraschall Med 2010; 31: 163–8. doi: 10.1055/s-0028-1109357 [DOI] [PubMed] [Google Scholar]
- 6.Al Bunni F, Deganello A, Sellars ME, Schulte K-M, Al-Adnani M, Sidhu PS. Contrast-Enhanced ultrasound (CEUS) appearances of an adrenal phaeochromocytoma in a child with von Hippel-Lindau disease. J Ultrasound 2014; 17: 307–11. doi: 10.1007/s40477-014-0083-8 [DOI] [PMC free article] [PubMed] [Google Scholar]
- 7.Bovio S, Cataldi A, Reimondo G, Sperone P, Novello S, Berruti A, et al. Prevalence of adrenal incidentaloma in a contemporary computerized tomography series. J Endocrinol Invest 2006; 29: 298–302. doi: 10.1007/BF03344099 [DOI] [PubMed] [Google Scholar]
- 8.Boland GW, Lee MJ, Gazelle GS, Halpern EF, McNicholas MM, Mueller PR. Characterization of adrenal masses using unenhanced CT: an analysis of the CT literature. AJR Am J Roentgenol 1998; 171: 201–4. doi: 10.2214/ajr.171.1.9648789 [DOI] [PubMed] [Google Scholar]
- 9.Caoili EM, Korobkin M, Francis IR, Cohan RH, Dunnick NR. Delayed enhanced CT of lipid-poor adrenal adenomas. AJR Am J Roentgenol 2000; 175: 1411–5. doi: 10.2214/ajr.175.5.1751411 [DOI] [PubMed] [Google Scholar]
- 10.Song JH, Chaudhry FS, Mayo-Smith WW. The incidental adrenal mass on CT: prevalence of adrenal disease in 1,049 consecutive adrenal masses in patients with no known malignancy. AJR Am J Roentgenol 2008; 190: 1163–8. doi: 10.2214/AJR.07.2799 [DOI] [PubMed] [Google Scholar]
- 11.Jacques AET, Sahdev A, Sandrasagara M, Goldstein R, Berney D, Rockall AG, et al. Adrenal phaeochromocytoma: correlation of MRI appearances with histology and function. Eur Radiol 2008; 18: 2885–92. doi: 10.1007/s00330-008-1073-z [DOI] [PubMed] [Google Scholar]
- 12.Upadhyay J, Sudhindra P, Abraham G, Trivedi N. Tuberculosis of the adrenal gland: a case report and review of the literature of infections of the adrenal gland. vol. 2014, Int J Endocrinol. Hindawi 2014; 876037. [DOI] [PMC free article] [PubMed] [Google Scholar]
- 13.Bharwani N, Rockall AG, Sahdev A, Gueorguiev M, Drake W, Grossman AB, et al. Adrenocortical carcinoma: the range of appearances on CT and MRI. AJR Am J Roentgenol 2011; 196: W706–14. doi: 10.2214/AJR.10.5540 [DOI] [PubMed] [Google Scholar]
- 14.Cingam SR, Mukkamalla SKR, Karanchi H. In: StatPearls [Internet]. Treasure Island (FL): StatPearls Publishing. 2020. Available from: http://www.ncbi.nlm.nih.gov/books/NBK441879/ [cited 2020 May 29].
- 15.Mayo-Smith WW, Song JH, Boland GL, Francis IR, Israel GM, Mazzaglia PJ, et al. Management of Incidental Adrenal Masses: A White Paper of the ACR Incidental Findings Committee. J Am Coll Radiol 2017; 14: 1038–44. doi: 10.1016/j.jacr.2017.05.001 [DOI] [PubMed] [Google Scholar]