Abstract
Objective:
A new Bayesian penalized likelihood reconstruction algorithm for positron emission tomography (PET) (Q.Clear) is now in clinical use for fludeoxyglucose (FDG) PET/CT. However, experience with non-FDG tracers and in special patient populations is limited. This pilot study aims to compare Q.Clear to standard PET reconstructions for 18F sodium fluoride (18F-NaF) PET in obese patients.
Methods:
30 whole body 18F-NaF PET/CT scans (10 patients with BMI 30–40 Kg/m2 and 20 patients with BMI >40 Kg/m2) and a NEMA image quality phantom scans were analyzed using ordered subset expectation maximization (OSEM) and Q.Clear reconstructions methods with B400, 600, 800 and 1000. The images were assessed for overall image quality (IQ), noise level, background soft tissue, and lesion detectability, contrast recovery (CR), background variability (BV) and contrast-to-noise ratio (CNR) for both algorithms.
Results:
CNR for clinical cases was higher for Q.Clear than OSEM (p < 0.05). Mean CNR for OSEM was (21.62 ± 8.9), and for Q.Clear B400 (31.82 ± 14.6), B600 (35.54 ± 14.9), B800 (39.81 ± 16.1), and B1000 (40.9 ± 17.8). As the β value increased the CNR increased in all clinical cases. B600 was the preferred β value for reconstruction in obese patients. The phantom study showed Q.Clear reconstructions gave lower CR and lower BV than OSEM. The CNR for all spheres was significantly higher for Q.Clear (independent of β) than OSEM (p < 0.05), suggesting superiority of Q.Clear.
Conclusion:
This pilot clinical study shows that Q.Clear reconstruction algorithm improves overall IQ of 18F-NaF PET in obese patients. Our clinical and phantom measurement results demonstrate improved CNR and reduced BV when using Q.Clear. A β value of 600 is preferred for reconstructing 18F-NaF PET/CT with Q.Clear in obese patients.
Advances in knowledge:
18F-NaF PET/CT is less susceptible to artifacts induced by body habitus. Bayesian penalized likelihood reconstruction with18F-NaF PET improves overall IQ in obese patients.
Introduction
The prevalence of obesity is increasing, and the incidence worldwide has more than doubled since 1980 with the condition predicted to affect more than 1 billion people by the year 2020.1 Conventional bone scan with 99mTc-MDP can be of poor quality in obese patients due to a combination of high background soft tissue activity and considerable attenuation and scattering of photons. 18F sodium fluoride (18F-NaF) positron emissiontomography (PET)/CT is superior to conventional bone scan in due to its better pharmacokinetics, particularly in obese patients.2,3 18F-NaF PET/CT is less susceptible to artifacts induced by body habitus and a sensitive tool for detecting skeletal metastases.4,5 In a previous study, Usmani et al6 reported high sensitivity, specificity, and accuracy of 18F-NaF PET/CT in morbidly obese patients and we suggested 18F-NaF PET/CT as the imaging modality of choice for skeletal staging in obese patients.
A patient’s body mass index (BMI) can affect image quality (IQ). Image reconstruction algorithms can impact IQ as well by changing contrast and noise levels even though these are hardly ever investigated before clinical implementation in specific patient groups or for tracers other than 18F-fludeoxyglucose (18F-FDG).7 Therefore, it is worthwhile exploring the role of emerging reconstruction algorithms in lesion detectability in obese patients. Recently, GE Healthcare introduced a Bayesian penalized likelihood (BPL) iterative PET reconstruction algorithm, named Q.Clear, which includes point spread function (PSF) modeling.8 This Q.Clear algorithm uses a customizable penalization factor (β) for noise suppression.9 The Q.Clear algorithm provides better quality images and potentially more accurate standardized uptake value (SUV) measurements than conventionally ordered subset expectation maximization (OSEM) reconstructions.10 Studies have shown that Q.Clear can significantly improve signal-to-noise in clinical 18F-FDG PET/CT scans compared to OSEM, especially for small faintly avid abnormalities.11,12 However clinical data for this technique is predominantly limited to FDG and to the best of our knowledge no prior work has been done to evaluate the clinical effectiveness of Q.Clear algorithm in 18F-NaF PET/CT. This pilot study aims to assess the clinical significance of using Q.Clear in 18F-NaF PET/CT and determine the optimum penalization factor (β) for obese patients, using both phantom studies and clinical cases.
Methods and material
Phantom evaluation
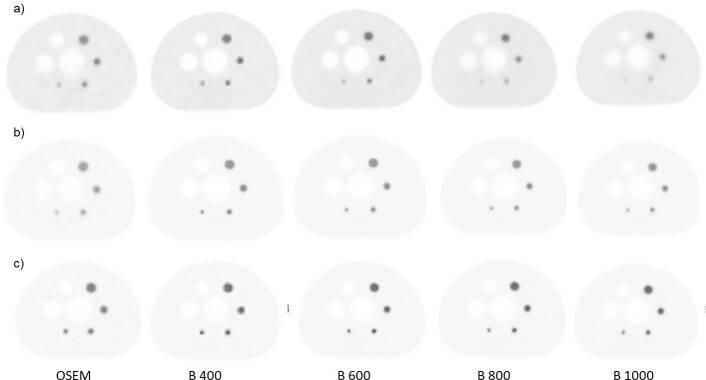
A NEMA IQ phantom13 was scanned on a GE Discovery 710 (GE Healthcare) with the four smallest spheres filled with an activity concentration in 6:1, 10:1, and 14:1 ratios to the background activity concentration (Figure 1). The background activity is approximately 1.5mCi in all phantom studies, and tracer activity in the sphere is according to the ratios. The higher ratios 10:1 and 14:1 ratio, were specifically used to mimic the high bone to background ratio usually seen in clinical studies with 18F-NaF PET/CT. The phantom was scanned following the prescribed NEMA procedure and was reconstructed using our center’s standard, time-of-flight (ToF) OSEM PSF protocol (3 iterations, 32 subsets, Gaussian filter 6.4 mm), as well as using Q.Clear over a range of β values (400, 600, 800 and 1000). Contrast recovery (CR), background variability (BV) and contrast-to-noise ratio (CNR) were calculated from the scans reconstructed with the different algorithms and β values.
Figure 1.
Axial 18F-NaF PET images of phantom evaluation with different reconstructions rated in clinical evaluation for the background ratio a) 6:1 b) 10:1 c) 14:1.18F-NaF, 18F sodium fluoride;PET, positron emission tomography.
Patient scans
We consecutively selected 30 whole body 18F-NaF PET/CT scans performed for skeletal staging in obese patients (10 patients with BMI 30–40 kg/m² and 20 patients with BMI >40 kg/m²). Images were acquired after intravenous (i.v.) injection of 0.06 mCi/kg (2.2 MBq/kg) 18F-NaF and a 60- to 90 min uptake period.14,15 PET emission images were acquired in a three-dimensional (3D) mode on a ToF GE Discovery 710 PET/CT system (Discovery 690 and 710; GE Healthcare, Milwaukee, WI) at 3 min per bed position from vertex to toes. A non-contrast CT was performed using a reference tube current of 50–120 mA determined by an automated algorithm based on the planar view to achieve a noise index of 20, 120 kVp, and pitch 1.3. The CT axial images were reconstructed in a 512 × 512 matrix, with a thickness of 2.5 mm. PET, CT, and fusion images were reviewed on a workstation integrated with PACS on Hermes (Stockholm, Sweden) Hybrid viewer v. 2.2.
PET images were reconstructed using different algorithms. Each of them used the CT scan for attenuation correction and the same normalization correction factors with scatter and randoms corrected as previously described.15 Our center’s standard PET reconstruction algorithm is ToF OSEM PSF protocol (3 iterations, 32 subsets, 6.4 mm filter) and the new Q.Clear reconstruction algorithm used the following penalization factors (betas): 400, 600, 800 and 1000.
The patients in the cohort had a range of pathologic findings, including metastatic lesions and degenerative arthropathy, and normal studies. Pertinent clinical data are summarized in Table 1. Images were visually analyzed by two scorers and scored by rank against a panel of parameters, i.e. overall IQ, noise level, background.
Table 1.
Patient characteristics.
| Mean (SD)/Frequency | |
|---|---|
| Mean age | 56.33 ± 9.7 |
| Injected activity (mCi) | 5.8 ± 0.93 |
| Female:Male | 25:5 |
| Weight (kg) | 97.7 ± 17.1 |
| BMI (kg/m2) | 40.8 ± 5.2 |
| Primary tumor Breast cancer Prostate cancer Others |
23 5 2 |
|
18F-NaF PET-CT findings Definitely benign Possibly benign Equivocal Possibly malignant Definitely malignant |
30 12 5 2 2 9 |
18F-NaF, 18F sodium fluoride;BMI, body mass index; PET, positron emission tomography; SD, standarddeviation.
Reconstruction and analyses
Clinical cases
Visual analyses of the OSEM PSF, and Q.Clear PET images (i.e. a total of five reconstructions per case), were performed by two nuclear medicine consultants (designated Scorer 1 and 2, respectively) with experience of more than 5 years. The reconstructions were labelled A to E in a randomized order, with the CT component available for image fusion. Cases were reviewed sequentially, and the reconstructions were ranked (from 1 to 5) according to four IQ parameters: overall IQ (1 – excellent, 5 – worst), background soft tissue IQ (1 – excellent, 5 – worst), noise level (1 – minimal, 5 – unacceptable), and lesion detectability (1 – excellent, 5 – poor).
Scorers also indicated their most and least preferred reconstruction for each case. Inter-rater agreement on ranking within each of the five IQ parameters was assessed using Cohen’s κ statistic. We calculated the proportions of the highest and lowest-ranked reconstructions for each parameter, alongside the highest frequencies of the most and least preferred reconstruction indicated by the scorers. For each reconstruction, we summed the scores of both scorers for all parameters across.
Contrast-noise ratio analysis
Contrast-noise ratio analysis was performed using the methodology described by Beijst et al..16 The CNR is defined as:
Where is the mean count or standard uptake value (SUV) value in the target volume of interest (VOI), is the mean count or SUV value in the background VOI, and is the standard deviation (SD) in the background VOI. The target VOI was a sphere with a diameter of 2 cm (volume 4.2 cm³) centered in the L3 vertebra. Background spherical VOIs of the same diameter was centered on the right or left psoas muscle at the L3 level.
NEMA phantom
The data were analyzed using the GE NEMA analysis tool (GE Healthcare) to determine CR and BV for each sphere (j).
Where, is the average counts within a region of interest (ROI) drawn on each sphere j on the central PET slice. the average background counts for ROIs of the same size, the activity concentration in the hot spheres, the activity concentration in the background, , the standard deviation of the background ROI counts. CNR was defined as .
Statistical analysis
Statistical analyses were performed using SPSS Statistics 20.0 (IBM Corporation, New York). Results were presented as mean ± SD. Analysis of variance (ANOVA) was used to test the significance of the differences between the reconstructions. Post-hoc testing was done by Tukey HSD to determine whether there is a difference between the mean of all possible pairs using a studentized range distribution. p values less than 0.05 were considered to be significant.
Inter-rater agreement on ranking within each of the five IQ parameters was assessed using Cohen’s κ statistic. The possible range of weighted κ values is from −1 (complete disagreement) to +1 (perfect agreement) and is corrected to eliminate agreement expected by chance alone. κ was classified as follows17: 0, chance agreement;<0.20, poor agreement; 0.21–0.40, fair agreement; 0.41–0.60, moderate agreement; 0.61–0.80, substantial agreement; 0.81–1.00, very good agreement.
Results
Phantom study
The NEMA phantom study was repeated with three background activity concentration ratios (6:1, 10:1 and 14:1). The results for the phantom study are summarized in Table 2. As the noise penalization factor (β) was increased, the CR and BV decreased for all sphere sizes. Q.Clear reconstructions generally gave lower BV than OSEM, regardless of the target-to-background ratio activity concentration (6:1, 10:1 and 14:1) (Figure 1). The absolute mean BV was less for Q.Clear (independent of β) and was significantly lower compared to OSEM (p < 0.05). While Q clear showed lower CR, the CNR for all spheres was significantly higher for Q.Clear (independent of β) than OSEM (p < 0.05). B600 showed the highest CNR for the smallest sphere (Figure 2).
Table 2.
Mean contrast recovery and background variability for hot spheres with diameter 10mm, 13, 17, 22 and cold spheres 28, 37, as defined by NEMA with background activity concentration ratio a) 6:1 b) 10:1 c) 14:1
| Contrast Recovery | Background variability | |||||||||||
|---|---|---|---|---|---|---|---|---|---|---|---|---|
| Sphere size (mm) | 10 | 13 | 17 | 22 | 28 | 37 | 10 | 13 | 17 | 22 | 28 | 37 |
| OSEM | 39.3 | 58.8 | 62.9 | 68.1 | 75.4 | 83.6 | 7.9 | 7.3 | 6.6 | 5.9 | 5.3 | 4.7 |
| B 400 | 37.2 | 57.5 | 64.9 | 71.5 | 75 | 84 | 4.7 | 4.6 | 4.4 | 4.2 | 4.1 | 4.1 |
| B 600 | 29.4 | 49.7 | 62.5 | 73.7 | 73.3 | 81.7 | 4 | 3.9 | 3.9 | 3.9 | 3.9 | 4 |
| B 800 | 14.8 | 32.1 | 49.5 | 65.9 | 58.7 | 64.1 | 3.8 | 3.7 | 3.6 | 3.6 | 3.5 | 3.5 |
| B 1000 | 12.5 | 28.2 | 45.7 | 63.3 | 55.8 | 61.6 | 3.8 | 3.7 | 3.6 | 3.5 | 3.5 | 3.5 |
| Contrast Recovery | Background variability | |||||||||||
| Sphere size (mm) | 10 | 13 | 17 | 22 | 28 | 37 | 10 | 13 | 17 | 22 | 28 | 37 |
| OSEM | 61.2 | 72 | 73.6 | 76.4 | 78.6 | 83.8 | 7 | 6 | 4.9 | 4 | 3.6 | 3.4 |
| B 400 | 63 | 77.6 | 84.8 | 88.4 | 78.5 | 86.4 | 3.2 | 2.7 | 2.4 | 2.5 | 2.7 | 2.8 |
| B 600 | 54.6 | 72.4 | 81.9 | 86.8 | 75 | 83.8 | 2.7 | 2.4 | 2.2 | 2.4 | 2.6 | 2.8 |
| B 800 | 47.8 | 67.8 | 79.2 | 85.3 | 72.1 | 81.6 | 2.4 | 2.2 | 2.2 | 2.3 | 2.6 | 2.7 |
| B 1000 | 42.3 | 63.8 | 76.7 | 83.9 | 69.6 | 79.6 | 2.3 | 2.1 | 2.1 | 2.3 | 2.6 | 2.7 |
| Contrast Recovery | Background variability | |||||||||||
| Sphere size (mm) | 10 | 13 | 17 | 22 | 28 | 37 | 10 | 13 | 17 | 22 | 28 | 37 |
| OSEM | 62.4 | 67.5 | 70.3 | 77.5 | 78.7 | 83.5 | 6.6 | 6 | 5.2 | 4.6 | 4 | 3.3 |
| B 400 | 64.1 | 66 | 72.8 | 78.9 | 69 | 73 | 3.9 | 3.6 | 3.4 | 3.1 | 2.9 | 2.7 |
| B 600 | 55.8 | 71.3 | 78.7 | 85 | 74.9 | 82.8 | 3 | 2.8 | 2.6 | 2.4 | 2.2 | 2.1 |
| B 800 | 49.4 | 67.2 | 76.4 | 83.7 | 71.8 | 80.5 | 2.8 | 2.7 | 2.5 | 2.3 | 2.1 | 2.1 |
| B 1000 | 44.1 | 63.5 | 74.3 | 82.4 | 69.3 | 78.5 | 2.6 | 2.5 | 2.4 | 2.2 | 2.1 | 2.1 |
Figure 2.
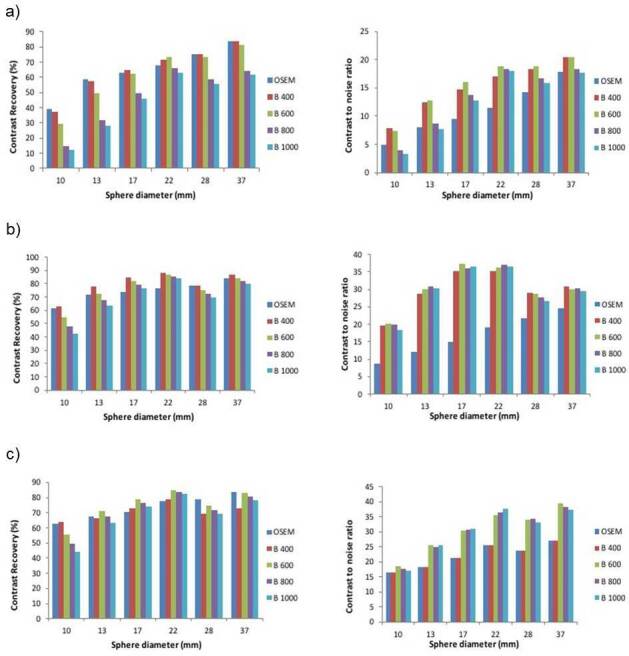
Graphs showing mean contrast recovery and contrast-to-noise ratio for all spheres in the NEMA IQ phantom with background ratio a) 6:1 b) 10:1 c) 14:1 with sphere size 10, 13, 17, 22 mm were hot and 28, 37 mm cold. These are shown for OSEM (3 iterations, 32 subsets, 6.4 mm filter), and the new Q.Clear reconstruction algorithm for penalization factors (βs): 400, 600, 800 and 1000. IQ, image quality; OSEM,ordered subset expectation maximization.
Evaluation of clinical cases
The CNR for clinical cases was significantly higher in Q.Clear than OSEM (p < 0.05) images. For Q.Clear, as the noise penalization factor (β) was increased the CNR increased, in all clinical cases (Figure 3); however, on ANOVA analysis, there was no statistical difference between the CNR from among the different β values of Q clear (p < 0.05). Mean CNR for OSEM is (21.62 ± 8.9) and for Q.Clear B400 (31.82 ± 14.6), B600 (35.54 ± 14.9), B800 (39.81 ± 16.1) and B1000 (40.9 ± 17.8).
Figure 3.
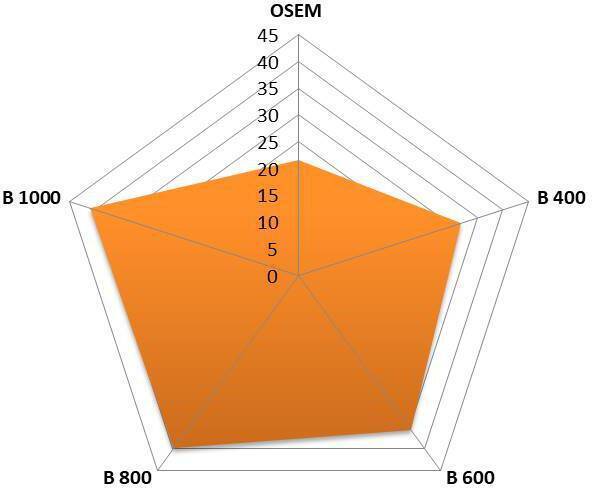
Mean of contrast to noise ratio of 18F-NaF PET in clinical case (n = 30). 18F-NaF, 18F sodium fluoride;BMI, body mass index; OSEM, ordered subset expectation maximization; PET,positron emission tomography; SD, standard deviation.
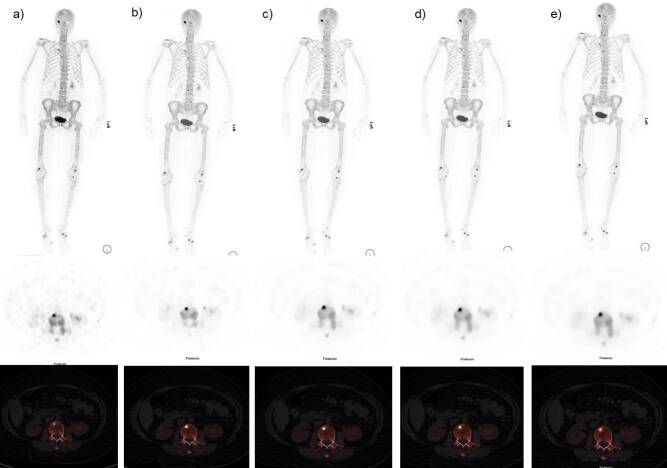
In the most of cases (63 and 53% by Scorers 1 and 2 respectively), both scorers chose B600 as their most preferred reconstruction (Table 3). The least preferred reconstruction was OSEM (Figure 4). This was confirmed by the combined scores for each reconstruction: 182, 123, 95, 107, 110 (OSEM, B400, B600, B800, B1000 respectively).
Table 3.
Clinical evaluation of inter-rater agreement and individual IQ parameter rankings.
| Parameter | Highest ranked reconstruction (%) | Agreement | K (95% CI) | P value | |
|---|---|---|---|---|---|
| Scorer 1 | Scorer 2 | ||||
| Overall IQ | B 600 (63%) | B 600 (53%) | moderate | 0.656 | <0.001 |
| Background soft tissue | B 800 (56%) | B 800 (50%) | poor | 0.273 | 0.07 |
| Noise level | B 1000 (56%) | B 1000 (56%) | moderate | 0.762 | <0.001 |
| Lesion detectability | B 600 (46%) | B 600 (50%) | moderate | 0.696 | <0.001 |
Figure 4.
Case of 44-year-old female BMI 42 kg/m2. Anterior MIP, axial PET and fused 18F-NaF PET images with different reconstructions. (a) OSEM b) Q.Clear B400 c) Q.Clear B600 d) Q.Clear B800 and d) Q.Clear B1000. We can see clearly a noise gradient decrease from images (a-e). The scorer considers the image reconstruction (c) with B600 has the best clinical information quality and signal to noise ratio without losing information. 18F-NaF, 18F sodium fluoride;BMI, body mass index; OSEM, ordered subset expectation maximization; PET,positron emission tomography
Visual analysis of the individual IQ parameters shows that B600 followed by B800 were the most consistently ranked highest, whereas OSEM was the lowest-ranked reconstruction. Both scorers ranked B1000 highest for noise level, but for lesion detectability, both scorers ranked B600 highest with a moderate inter-rater agreement (p < 0.001). There was poor inter-rater agreement among the scorers regarding the soft-tissue background (p = 0.07).
In all patients, 18F-NaF PET/CT images showed high tracer extraction with low soft tissue and background activity, and none of the scans were categorized as suboptimal for diagnostic reading. 18F-NaF PET/CT findings were graded as definitely benign in 12, possibly benign in 5, equivocal in 2, possibly malignant in 2, and definitely malignant in 9 patients. For analytical purposes, 57% of lesions were classified as benign (graded as 1–2), 6% as indeterminate (Grade 3), and 37% as malignant (Grades 4–5). The two patients rated as equivocal on 18F-NaF PET/CT had solitary foci in the vertebra, and subsequent MRI examination did not show any evidence of metastasis.
Discussion
In routine clinical practice OSEM algorithm is generally used for image reconstruction of 18F-NaF PET/CT. It has been improved in the last few years by adding time-of-flight (ToF) and point spread function (PSF), but still has some limitations.18 One major drawback is that noise in the image increases with each iteration.19 New iterative PET reconstruction methods like Q.Clear integrate both ToF and PSF, and have improved SNR, providing more accuracy in PET quantitation over the OSEM.20 Q.Clear’s penalty function controls the noise amplification at high iterations and allows iterations until effective convergence of the data. The resulting PET images have lower noise and higher contrast.21 The BPL can maximize the benefits of reconstruction by optimizing the penalty factor (β) during the reconstruction process,22 with smoother images as β increases.23
In our study, for visual analysis of overall IQ, there was an agreement from both scorers that B600 is the preferred reconstruction of 18F-NaF in obese patients. Study of the individual IQ parameters showed that B600 followed by B800 were consistently ranked highest, while OSEM was the lowest ranked reconstruction. As expected, a higher β value (B1000) provided the lowest noise. 18F-NaF PET/CT has low background activity in general due to its differing pharmacokinetics to 18F-FDG. 18F-NaF bone uptake is related to blood flow, and almost all 18F-NaF delivered is retained by bone after a single pass of blood, resulting in a nearly 100% first-pass extraction.3,4
Many studies have shown that a patient’s BMI alters IQ.24 18F-NaF PET images have low contrast as BMI increases due to high background noise. In obese patients, the noise is increased due to reduced count statistics from scattering and increased attenuation. Some authors suggest that for better IQ higher administered activity per kilogram should be used whilst others report that longer PET acquisitions up to 5 min/bed are required. In our study, we adopted a low dose protocol of 18F-NaF PET by injecting 0.06 mCi/Kg, which is considerably lower when compared to the fixed activity of 5–10 mCi.15,16 Recently published data25 show that a good quality adult scan can be achieved with as low as 0.06 mCi/Kg of 18F-NaF. Our clinical experience shows that 18F-NaF PET/CT retains its IQ even with patients with high BMI despite a lower injected activity (0.06 mCi/kg) and a shorter acquisition duration (3 min/bed).
The results of this study show that Q.Clear reconstructions produce a relatively smooth and homogeneous appearance of background structures, and its noise suppression leads to better quality images. In our clinical cases, there was no difference in lesion detectability between Q.Clear and OSEM, but with Q.Clear reconstructions, specifically between B400 and B600, the lesions were somewhat more conspicuous. These results, are supported by the phantom study results, showing a high CR value on B400, and a decrease with higher β values. The phantom study showed that Q.Clear reconstructions generally gave lower CR, and lower BV than OSEM. While low CR can be considered a shortcoming, a balance usually needs to be struck between acceptable CR, BV and CNR when selecting a β value. This can be done by taking into account patient specific factors for example BMI. The CNR for all spheres was significantly higher for Q.Clear (independent of β) than OSEM (p < 0.05). These results complement the clinical scans and show that CNR was higher for Q.Clear than OSEM (p < 0.05). As the β factor was increased, the CNR increased in all clinical cases. A recent study by Lantos et al26 describes that Q.Clear outperforms OSEM in terms of contrast recovery and organ uniformity. They suggested using higher β values, especially if the data have low count statistics to avoid image noise and artifacts. Another study by Vallot et al27 also reported that the BPL algorithm improves the IQ and lesion contrast and appears to be particularly appropriate for patients with a high BMI as it improves the SNR.
Overall, the IQ, background, and noise level was judged to be the best in Q.Clear reconstructions, specifically between B600 and B800, which produced a relatively smooth and homogeneous appearance of background structures (Figure 4). Small β values may result in noisy images and may interfere with accurate interpretation. Our study clearly showed an agreement between the two readers for B600 as the most preferred reconstruction for high BMI patients. Q.Clear B600 leads to smooth images, removing noise from images and improving quality without losing data.
The phantom data also suggest that B600 would be an appropriate choice that strikes a balance between optimizing CR and noise level. The lesions are better delineated on Q.Clear reconstructions by suppression of edge artifacts.28
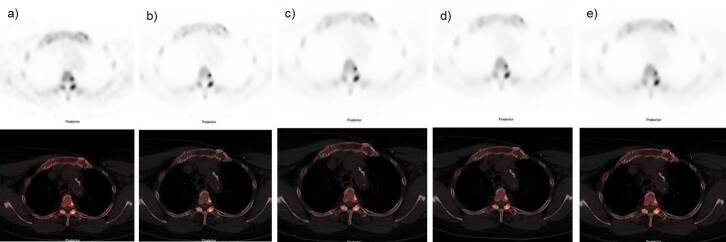
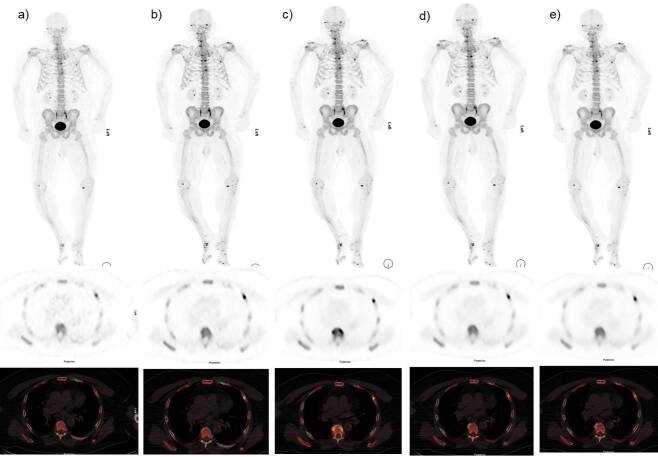
Our study shows that Q.Clear’s use, specifically between B400 and B600, may improve the delineation of small foci (Figure 5). The use of Q.Clear in 18F-NaF may have a clinical impact in the detection of small lesions (e.g. in ribs [Figure 6]), when β value selection is optimized for the clinical situation. Although a higher β suppressed noise more effectively, it also decreased contrast improvement in small spheres. Therefore, the penalty factor’s properties should be considered a trade-off between lesion detectability and noise correction.
Figure 5.
Axial PET images demonstrating an 18F-NaF -avid 6 mm sclerotic lesion at body of D3 vertebrae with different reconstructions. (a) OSEM b) Q.Clear B400 c) Q.Clear B600. (d) Q.Clear B800 and d) Q.Clear B1000. The degree of uptake was shown to be higher using Q.Clear reconstruction and there is improvement background noise as B values increase. Overall IQ and lesion is better delineated is better with B400-B600. 18F-NaF, 18F sodium fluoride;BMI, body mass index; IQ, image quality; OSEM, ordered subsetexpectation maximization; PET, positron emission tomography.
Figure 6.
Case of 74-year-old female BMI 43 kg/m2. Anterior MIP, axial PET and fused 18F-NaF PET images with different reconstructions. (a) OSEM b) Q.Clear B400 c) Q.Clear B600 d) Q.Clear B800 and d) Q.Clear B1000. The study demonstrates focal increase tracer uptake at left fourth rib anteriorly. We can see clearly a noise gradient decrease from images (a-e). The readers consider the image (c) with the best clinical information quality and signal to noise ratio without losing information. 18F-NaF, 18F sodium fluoride;BMI, body mass index; IQ, image quality; OSEM, ordered subsetexpectation maximization; PET, positron emission tomography.
One interesting and clinically pertinent observation on data analysis was that for OSEM, there is approximately a linear relationship between sphere size and CNR for every target-to-background ratio. However, for Q.Clear, there was a maximum for a particular sphere size, after which the CNR declined with larger sphere sizes. Therefore, it is evident that the potential benefit of Q.Clear over OSEM is predominantly seen for small sphere sizes and might translate into better conspicuity of smaller index lesions in a clinical environment (Figure 7). Our study has some limitations, including a relatively small number of both cases and scorers. Also, the image data set comprising of all reconstructed images were not completely randomized. Therefore, all the different reconstructed images for one patient were scored by the observers at the same time. However, this study’s primary objective was to evaluate Q.Clear reconstruction in 18F-NaF, particularly in obese patients, and determine the optimum β factor in obese patients. The results have suggested that adaptation of the acquisition and reconstruction techniques must be customized to the BMI. Phantom and clinical cases clearly show that Q.Clear gives better results than OSEM. In clinical practice, the contrast varies according to both anatomical location and weight of the patient. Using a high β Q.Clear seems to minimize the defects generated by the noise in the image. Therefore, selection of β values can perhaps be optimized for patients based on their BMI and the anatomical location and nature of the skeletal abnormality.
Figure 7.
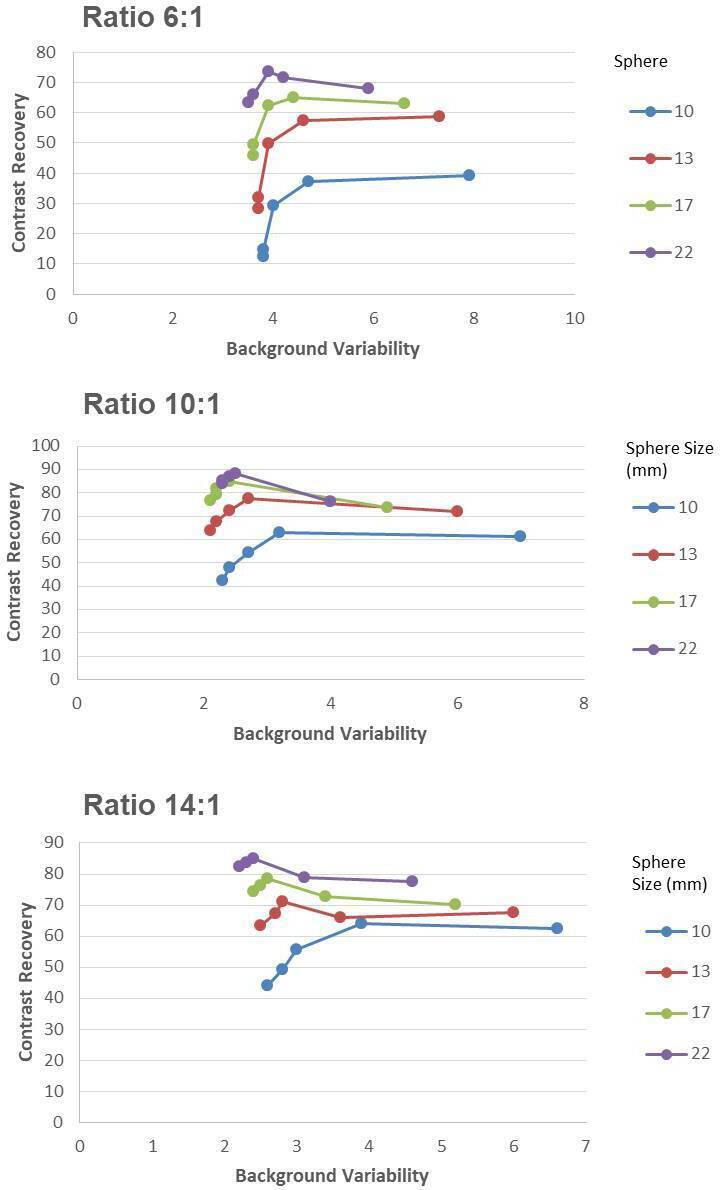
Graphs show mean contrast recovery and background variability for hot spheres with diameter 10 mm, 13, 17, 22 mm (cold spheres of 28 and 37 mm are excluded). These are shown for OSEM (3 iterations, 32 subsets, 6.4 mm filter), and the new Q.Clear reconstruction algorithm for penalization factors (betas): 400, 600, 800 and 1000. OSEM, ordered subsetexpectation maximization
Conclusions
The Q.Clear reconstruction algorithm improves IQ and facilitates the interpretation of 18F-NaF PET imaging in obese patients. Our pilot clinical and phantom measurements demonstrate improved CNR when using Q.Clear without decreasing lesion detectability compared to standard OSEM reconstructions. A potential shortcoming for Q.Clear is the reduced CR, which is dependent on the penalization factor. We found a β value of 600, as the one that strikes the most appropriate balance between optimizing CR and image noise levels in obese patients. The current study provides initial evidence of usefulness of this reconstruction technique; however, further studies are required in other special populations and non-FDG tracers to make more informed choices of the penalization factor used in Q.Clear for clinical use in various clinical settings.
Footnotes
Conflict of interest: The authors declare that they have no conflict of interest. No financial help or grant is taken by any governmental and non-governmental organization.
Ethical Approval: All procedure performed in studies involving human participants were in accordance with the ethical standard of the institutional and/or national research committee and with the 1964 Helsinki Declaration and its later amendments or comparable ethical standards.
Informed Consent: The institutional review board of our institute approved this study and informed consent was waived.
Contributor Information
Sharjeel Usmani, Email: dr_shajji@yahoo.com.
Najeeb Ahmed, Email: ahmed.najeeb@gmail.com.
Gopinath Gnanasegaran, Email: segaran06@hotmail.com.
Rashid Rasheed, Email: dr.nmd.paec@gmail.com.
Fahad Marafi, Email: fahadmarafi@yahoo.com.
Mashari Alnaaimi, Email: m.alnaaimi@gmail.com.
Mohammad Omar, Email: momerma@gmail.com.
Ahmed Musbah, Email: ahmedabbasabms@hotmail.com.
Fareeda al Kandari, Email: dr_usamni@icloud.com.
Stijn De Schepper, Email: stijn.deschepper@uantwerpen.be.
Tim Van den Wyngaert, Email: tim.vandenwyngaert@uza.b.
REFERENCES
- 1.HOW Obesity: preventing and managi.g the global epidemic Report on a WHO Consultation. WHO Technifal Report Series 894. Geneva: Wcrld Health Organization, 2000. o[1]. Flier JS. Obesity wars: molecular progress confronts an expanding epidemic. Cell 2004; 116: 337–50. [DOI] [PubMed] [Google Scholar]
- 2.Grant FD, Fahey FH, Packard AB, Davis RT, Alavi A, Treves ST. Skeletal PET with 18F-fluoride: applying new technology to an old tracer. J Nucl Med 2008; 49: 68–78. doi: 10.2967/jnumed.106.037200 [DOI] [PubMed] [Google Scholar]
- 3.Czernin J, Satyamurthy N, Schiepers C. Molecular mechanisms of bone 18F-NaF deposition. J Nucl Med 2010; 51: 1826–9. doi: 10.2967/jnumed.110.077933 [DOI] [PMC free article] [PubMed] [Google Scholar]
- 4.Löfgren J, Mortensen J, Rasmussen SH, Madsen C, Loft A, Hansen AE, et al. A Prospective Study Comparing 99mTc-Hydroxyethylene-Diphosphonate Planar Bone Scintigraphy and Whole-Body SPECT/CT with 18F-Fluoride PET/CT and 18F-Fluoride PET/MRI for Diagnosing Bone Metastases. J Nucl Med 2017; 58: 1778–85. doi: 10.2967/jnumed.116.189183 [DOI] [PubMed] [Google Scholar]
- 5.Even-Sapir E, Metser U, Mishani E, Lievshitz G, Lerman H, Leibovitch I. The detection of bone metastases in patients with high-risk prostate cancer: 99mTc-MDP planar bone scintigraphy, single- and multi-field-of-view SPECT, 18F-fluoride PET, and 18F-fluoride PET/CT. J Nucl Med 2006; 47: 287–97. [PubMed] [Google Scholar]
- 6.Usmani S, Marafi F, Ahmed N, Esmail A, Al Kandari F, Van den Wyngaert T. Diagnostic challenge of staging metastatic bone disease in the morbidly obese patients: a primary study evaluating the usefulness of 18F-Sodium fluoride (NaF) PET-CT. Clin Nucl Med 2017; 42: 829–36. doi: 10.1097/RLU.0000000000001823 [DOI] [PubMed] [Google Scholar]
- 7.Adams MC, Turkington TG, Wilson JM, Wong TZ. A systematic review of the factors affecting accuracy of SUV measurements. AJR Am J Roentgenol 2010; 195: 310–20. doi: 10.2214/AJR.10.4923 [DOI] [PubMed] [Google Scholar]
- 8.Ross S. (GE healthcare white paper). 2014. Available from: https://www.gehealthcare.ae//jssmedia/739d885baa59485aaef5ac0e0eeb44a4.pdf [Accessed 23 April 2020].
- 9.Nuyts J, Beque D, Dupont P, Mortelmans L, et al. A concave prior penalizing relative differences for maximum-a-posteriori reconstruction in emission tomography. IEEE Trans Nucl Sci 2002; 49: 56–60. doi: 10.1109/TNS.2002.998681 [DOI] [Google Scholar]
- 10.Te Riet J, Rijnsdorp S, Roef MJ, Arends AJ. Evaluation of a Bayesian penalized likelihood reconstruction algorithm for low-count clinical 18F-FDG PET/CT. EJNMMI Phys 2019; 6: 32. doi: 10.1186/s40658-019-0262-y [DOI] [PMC free article] [PubMed] [Google Scholar]
- 11.Parvizi N, Franklin JM, McGowan DR, Teoh EJ, Bradley KM, Gleeson FV. Does a novel penalized likelihood reconstruction of 18F-FDG PET-CT improve signal-to-background in colorectal liver metastases? Eur J Radiol 2015; 84: 1873–8. doi: 10.1016/j.ejrad.2015.06.025 [DOI] [PubMed] [Google Scholar]
- 12.Teoh EJ, McGowan DR, Bradley KM, Belcher E, Black E, Gleeson FV. Novel penalised likelihood reconstruction of PET in the assessment of histologically verified small pulmonary nodules. Eur Radiol 2016; 26: 576–84. doi: 10.1007/s00330-015-3832-y [DOI] [PMC free article] [PubMed] [Google Scholar]
- 13.National Electrical Manufacturers Association NEMA NU-2-2012 performance measurement of positron emission tomography. Rosslyn, VA 2013;. [Google Scholar]
- 14.Beheshti M, Mottaghy FM, Paycha F, Behrendt FFF, Van den Wyngaert T, Fogelman I, et al. 18)F-NaF PET/CT: EANM procedure guidelines for bone imaging. Eur J Nucl Med Mol Imaging 2015; 42: 1767–77. doi: 10.1007/s00259-015-3138-y [DOI] [PubMed] [Google Scholar]
- 15.Segall G, Delbeke D, Stabin MG, Even-Sapir E, Fair J, Sajdak R, et al. Snm practice guideline for sodium 18F-fluoride PET/CT bone scans 1.0. J Nucl Med 2010; 51: 1813–20. doi: 10.2967/jnumed.110.082263 [DOI] [PubMed] [Google Scholar]
- 16.Beijst C, Kist JW, Elschot M, Viergever MA, Hoekstra OS, de Keizer B, et al. Quantitative comparison of 124I PET/CT and 131I SPECT/CT detectability. J Nucl Med 2016; 57: 103–8. doi: 10.2967/jnumed.115.162750 [DOI] [PubMed] [Google Scholar]
- 17.Svanholm H, Starklint H, Gundersen HJ, Fabricius J, Barlebo H, Olsen S. Reproducibility of histomorphologic diagnoses with special reference to the kappa statistic. APMIS 1989; 97: 689–98. doi: 10.1111/j.1699-0463.1989.tb00464.x [DOI] [PubMed] [Google Scholar]
- 18.Prieto E, Domínguez-Prado I, García-Velloso MJ, Peñuelas I, Richter José Ángel, Martí-Climent JM, Domínguez P, García VMJ. Impact of time-of-flight and point-spread-function in SUV quantification for oncological PET. Clin Nucl Med 2013; 38: 103–9. doi: 10.1097/RLU.0b013e318279b9df [DOI] [PubMed] [Google Scholar]
- 19.Hudson HM, Larkin RS. Accelerated image reconstruction using ordered subsets of projection data. IEEE Trans Med Imaging 1994; 13: 601–9. doi: 10.1109/42.363108 [DOI] [PubMed] [Google Scholar]
- 20.Howard BA, Morgan R, Thorpe MP, Turkington TG, Oldan J, James OG, et al. Comparison of Bayesian penalized likelihood reconstruction versus OS-EM for characterization of small pulmonary nodules in oncologic PET/CT. Ann Nucl Med 2017; 31: 623–8. doi: 10.1007/s12149-017-1192-1 [DOI] [PubMed] [Google Scholar]
- 21.Parvizi N, Franklin JM, McGowan DR, Teoh EJ, Bradley KM, Gleeson FV. Does a novel penalized likelihood reconstruction of 18F-FDG PET-CT improve signal-to-background in colorectal liver metastases? Eur J Radiol 2015; 84: 1873–8. doi: 10.1016/j.ejrad.2015.06.025 [DOI] [PubMed] [Google Scholar]
- 22.Asma E, Ahn S, Ross SG, Chen A, Manjeshwar RM. Accurate and consistent lesion quantitation with clinically acceptable penalized likelihood images. Ieee Nss/mic 2012;: 4062–6. [Google Scholar]
- 23.Teoh EJ, McGowan DR, Macpherson RE, et al. Phantom and clinical evaluation of the bayesian penalized likelihood reconstruction algorithm Q.Clear on an LYSO PET/CT system. J Nucl Med 2015; 56: 1447–52. [DOI] [PMC free article] [PubMed] [Google Scholar]
- 24.Chang T, Chang G, Kohlmyer S, Clark JW, Rohren E, Mawlawi OR. Effects of injected dose, BMI and scanner type on NECR and image noise in PET imaging. Phys Med Biol 2011; 56: 5275–85. doi: 10.1088/0031-9155/56/16/013 [DOI] [PubMed] [Google Scholar]
- 25.Marafi F, Esmail A, Rasheed R, Alkandari F, Usmani S. Novel weight-based dose threshold for 18F-NaF PET-CT imaging using advanced PET-CT systems: a potential tool for reducing radiation burden. Nucl Med Commun 2017; 38: 764–70. doi: 10.1097/MNM.0000000000000706 [DOI] [PubMed] [Google Scholar]
- 26.Lantos J, Mittra ES, Levin CS, Iagaru A. Standard OSEM vs. regularized PET image reconstruction: qualitative and quantitative comparison using phantom data and various clinical radiopharmaceuticals. Am J Nucl Med Mol Imaging 2018; 8: 110–8. [PMC free article] [PubMed] [Google Scholar]
- 27.Vallot D, Caselles O, Chaltiel L, Fernandez A, Gabiache E, Dierickx L, et al. A clinical evaluation of the impact of the Bayesian penalized likelihood reconstruction algorithm on PET FDG metrics. Nucl Med Commun 2017; 38: 979–84. doi: 10.1097/MNM.0000000000000729 [DOI] [PubMed] [Google Scholar]
- 28.Yamaguchi S, Wagatsuma K, Miwa K, Ishii K, Inoue K, Fukushi M. Bayesian penalized-likelihood reconstruction algorithm suppresses edge artifacts in PET reconstruction based on point-spread-function. Phys Med 2018; 47: 73–9. doi: 10.1016/j.ejmp.2018.02.013 [DOI] [PubMed] [Google Scholar]


