Abstract
Leukaemia stem cells (LSCs) underlie cancer therapy resistance but targeting these cells remains difficult. The Wnt-β-catenin and PI3K-Akt pathways cooperate to promote tumorigenesis and resistance to therapy. In a mouse model in which both pathways are activated in stem and progenitor cells, LSCs expanded under chemotherapy-induced stress. Since Akt can activate β-catenin, inhibiting this interaction might target therapy-resistant LSCs. High-throughput screening identified doxorubicin (DXR) as an inhibitor of the Akt-β-catenin interaction at low doses. Here we repurposed DXR as a targeted inhibitor rather than a broadly cytotoxic chemotherapy. Targeted DXR reduced Akt-activated β-catenin levels in chemoresistant LSCs and reduced LSC tumorigenic activity. Mechanistically, β-catenin binds multiple immune-checkpoint gene loci, and targeted DXR treatment inhibited expression of multiple immune checkpoints specifically in LSCs, including PD-L1, TIM3 and CD24. Overall, LSCs exhibit distinct properties of immune resistance that are reduced by inhibiting Akt-activated β-catenin. These findings suggest a strategy for overcoming cancer therapy resistance and immune escape.
Resistance to anticancer therapies leads to relapse, a critical barrier to successful treatment. Chemotherapy relies on broad cytotoxicity, resulting in adverse side effects and the evolution of resistant clones1-3. Although the initial cytoreduction by these anticancer therapies can be substantial, chemoresistant LSCs, a subpopulation within minimal residual disease (MRD), often lead to therapy-resistant relapse3-10.
Mutations in the PTEN–PI3K–Akt pathway are common in many cancers and drive resistance to therapies11-15. Recent studies in paediatric acute lymphocytic leukaemia showed that additional epigenetic mutations in relapsed versus diagnostic samples converged on the Wnt pathway16,17. Similarly, in acute myelogenous leukaemia (AML), genetic inhibitors of the Wnt pathway are frequently silenced, which predicts increased relapse18,19. Since intensified chemotherapy does not improve the poor prognosis of relapsed patients, there is a critical need for improved targeting of chemoresistant cells20.
The Wnt–β-catenin and PI3K–Akt pathways are among the most frequently mutated in cancer21, and cooperation between these pathways promotes stem cell survival, proliferation, tumorigenesis and therapy resistance22-28. Previous studies illustrate the potential but also reveal limitations of targeting the Wnt–β-catenin and PI3K–Akt pathways separately in anticancer therapy. Targeting elements of these pathways individually has shown limited efficacy and often results in the outgrowth of resistant clones29-34. Cooperation between Wnt–β-catenin and PI3K–Akt pathways has a critical role in stem cell regulation and tumorigenesis22-24,26-28,31,32,35-40. Mechanistically, this cooperation can be driven in part by Akt C-terminal phosphorylation of β-catenin, which, unlike N-terminal phosphorylation, results in enhanced β-catenin activity26. Akt phosphorylation of β-catenin occurs predominantly at serine 552 and potentially three additional sites26. Thus, pS552-β-catenin antibody can be used as a readout to indicate cooperation between the Wnt–β-catenin and PI3K–Akt pathways25,26,41.
Immunotherapy has been successful in a subset of patients with cancer, but it fails to show efficacy in a broad range of cancers. Resistance to immunotherapy is also driven by a combination of Wnt, PI3K and/or MAPK signalling, and lack of anticancer T cell response42. Indeed, Wnt signalling reduces T cell recruitment to tumours43,44, but the mechanism for this is unclear. Similarly, loss of PTEN, resulting in PI3K activation, inhibits T cell-mediated anticancer activity11. Furthermore, the efficacy of conventional and targeted therapies often relies on both direct cytotoxic effects and the restoration of cancer-targeting immune responses45. As chemotherapeutic drugs are often given at or near the maximum-tolerated dose, which causes immunosuppression, beneficial immunological side effects of these drugs could be compromised at high doses.
Given the cooperative role of the Wnt–β-catenin and PI3K–Akt pathways in resistance to multiple anticancer therapies, we used a mouse model in which both pathways are activated in a subset of stem cells to study therapeutic resistance. Unexpectedly, the anthracycline antibiotic DXR, a long-established chemotherapeutic agent, can selectively inhibit Akt-activation of β-catenin at low doses. At high doses typically used in the clinic, DXR is broadly toxic; however, toxicity may be reduced if DXR was repurposed as a targeted inhibitor of the Akt–β-catenin interaction at a low dosage. We show that by using low but more sustained doses of DXR, leukaemia-initiating activity of LSCs is inhibited. Mechanistically, β-catenin binds multiple immune-checkpoint gene loci, and while targeted DXR treatment inhibits expression of multiple immune checkpoints and promotes the restoration of anticancer immunity, clinical doses induce oncogenic resistance mechanisms and reduce the number of cancer-fighting T cells. Residual post-chemotherapy pS552-β-catenin+ LSCs in patients with relapse or refractory AML and leukaemia-initiating activity of human leukaemia containing chemoresistant pS552-β-catenin+ LSCs can be reduced with low-dose anthracycline treatment, indicating potential clinical applications in reducing relapse.
Results
Simultaneous activation of Wnt–β-catenin and PI3K–Akt pathways results in successive expansion of HSPCs, LSCs and blast cells.
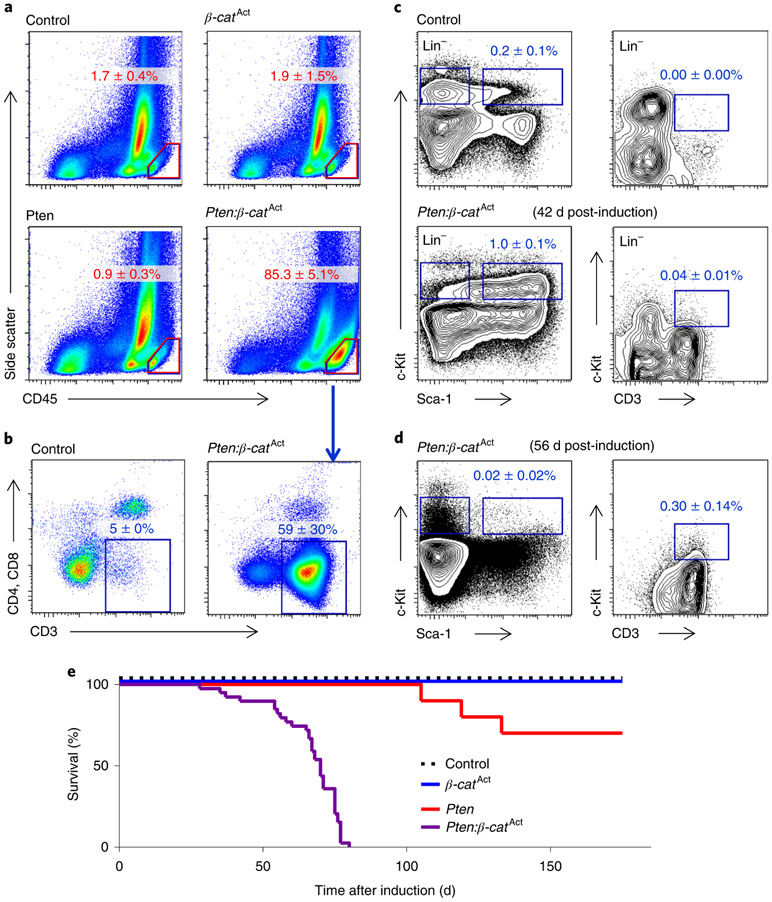
Previous work showed that cooperative activation of the Wnt–β-catenin and PI3K–Akt pathways drove self-renewal but resulted in leukaemic transformation27,32. Here we explored the ontogeny and nature of leukaemogenesis in Pten:β-catAct mice (the β-catenin gene, here designated β-cat, is also known as Ctnnb1), in which both pathways are activated specifically in haematopoietic stem and progenitor cells (HSPCs) using HSC-SCL-Cre-ERT, a tamoxifen-inducible recombinase controlling the stem cell leukemia enhancer (ref. 27,46). Pten:β-catAct mice developed T cell acute lymphoblastic leukaemia (T-ALL), indicated by more than 20% CD45Hi leukaemic blasts, which expressed CD3 (Fig. 1a,b). We analysed bone marrow at earlier time points for HSPCs (Lin−Sca-1+c-Kit+) and LSCs. T-ALL LSCs driven by overactivation of β-catenin have been well characterized as Lin−CD3+c-KitMid cells32,34. We observed accumulation of HSPCs in Pten:β-catAct mice six weeks post-induction (wpi), with commensurate reduction in more mature (Lin−c-Kit+Sca-1−) progenitor cells, consistent with broad differentiation blockage (Fig. 1c; see ref. 27). Rare LSCs at 6 wpi became more abundant by 8 wpi as the HSPC population collapsed (Fig. 1d). By 12 wpi, all Pten:β-catAct mice succumbed to leukaemia (Fig. 1e). Collectively, these data demonstrate that cooperative activation of the Wnt–β-catenin and PI3K–Akt pathways drive the progressive expansion of HSPCs with transformation to LSCs resulting in leukaemogenesis.
Fig. 1 ∣. Cooperative activation of the Wnt–β-catenin and PI3K–Akt pathways successively expands HSPCs, LSCs and T-ALL blast cells.
Pten:β-catAct mice were induced by tamoxifen treatment. a, At 8–9 wpi, FACS analysis of bone marrow showed that all Pten:β-catAct mice, but not Pten or β-catAct single-mutant mice, developed leukaemia, characterized by ≥20% CD45Hi blast cells (indicated by red outline). b, These cells predominantly expressed CD3 but lacked both CD4 and CD8, indicative of early T-ALL. c, Before development of T-ALL, Pten:β-catAct mice exhibited expansion of HSPCs, identified by FACS as Lin−Sca-1+c-Kit+ cells. d, The HSPC population collapsed as LSCs, identified as Lin−c-KitMidCD3+ cells, expanded. Data are mean ± s.d.; n = 5 biologically independent mice (a–d). e, Kaplan–Meier survival curves indicated that all all Pten:β-catAct mice, but not Pten or β-catAct single-mutant mice, succumbed to leukaemia by 12 wpi.
DXR targets the Akt–β-catenin interaction.
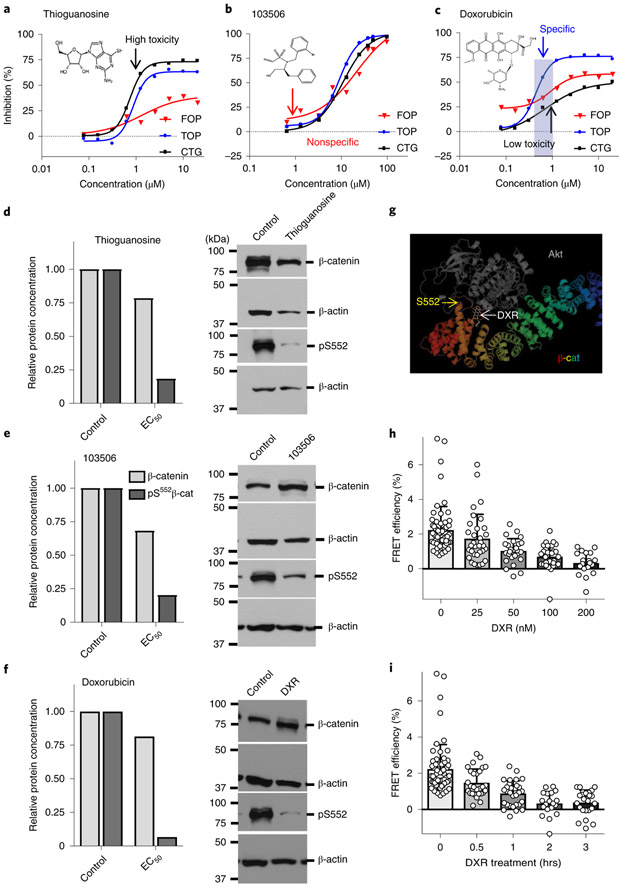
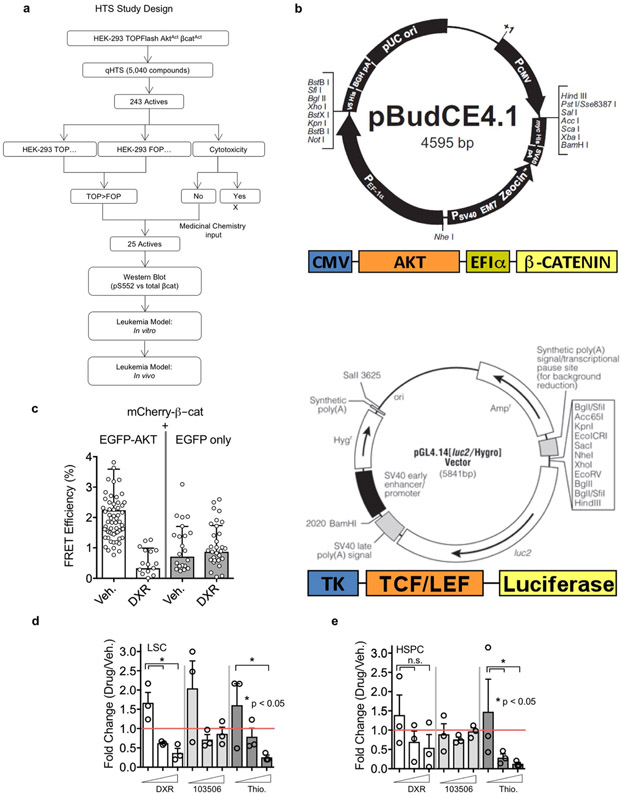
Since pharmacological activation of the Wnt–β-catenin and PI3K–Akt pathways in normal haematopoietic stem cells (HSCs) synergistically expands functional HSCs27, we tested whether inhibition of this cooperation could reduce the number of LSCs. Given the development of resistance to inhibitors of PI3K and Wnt pathways shown by previous studies13,29,31,47, we focused on inhibiting the pS552 active form of β-catenin to target the cooperative activity of the pathways. High-throughput screening of a Food and Drug Administration-approved small-molecule library identified candidate inhibitors (Extended Data Fig. 1a,b), which we narrowed to compounds that could inhibit pS552-β-catenin with less effect on pan β-catenin (Fig. 2a-c). Most promising was DXR, which specifically inhibited Akt-enhanced β-catenin activity at submicromolar concentrations, while higher concentrations showed reduced specificity and increased toxicity (Fig. 2c). Furthermore, pS552-β-catenin was inhibited while having only minimal effect on β-catenin generally, particularly at low concentrations of DXR (Fig. 2d-f). Computational docking indicated that DXR binds to Akt and interferes with its ability to phosphorylate β-catenin at the C-terminal S552 site (forming pS552-β-catenin, hereafter pS552-β-cat; Fig. 2g). Fluorescence resonance energy transfer (FRET) analysis demonstrated that the Akt–β-catenin interaction decreased with increasing concentrations and exposure time to DXR (Fig. 2h,i and Extended Data Fig. 1c). These data further indicate that Akt interacts with β-catenin and that DXR inhibits this interaction at low concentrations. In vitro tests on bone marrow cells isolated from leukaemic Pten:β-catAct mice showed that DXR significantly decreased the number of LSCs, with less effect on HSPCs (Extended Data Fig. 1d,e); we therefore focused our in vivo studies on DXR.
Fig. 2 ∣. DXR inhibits β-catenin activation by Akt.
a–c, Activities of compounds from a validation library were tested against HEK-293 TOPFlash AktActβ-catAct (TOP) and control HEK-293 FOPFlash AktActβ-catAct (FOP) cells at the indicated doses for inhibition of luciferase activity. Cytotoxicity profiles (Cell Titer-Glo, CTG) of compounds were also determined. Shown are chemical structures of and representative data from three compounds of interest. Median IC50 values in FOP, TOP and CTG assays, respectively, are 1.3 μM, 0.9 μM and 0.7 μM for thioguanosine; 21.5 μM, 8.9 μM and 11.0 μM for 103506, and 1.2 μM, 0.5 μM and >20 μM for DXR. At least one additional replicate experiment yielded similar results for each compound. d–f, Dose-response data from a–c were used to calculate the effective concentration of compounds resulting in 90%, 50%, and 25% inhibition of luminescence or cytotoxicity (EC90, EC50 and EC25) using nonlinear-regression analysis. TOP and FOP cells were treated with candidate compounds at EC90, EC50 and EC25 concentrations derived from a–c for 48 h, washed and flash-frozen for western blot analysis (EC50 is shown). Data are mean of two biologically independent experiments. See Methods for additional detail and Statistical Source Data for full blot images. g, Computational model showing predicted binding of Akt and DXR to β-catenin. h,i, FRET analysis verifying the interaction between Akt and β-catenin. h, Cells transfected with eGFP-Akt and mCherry-β-catenin were treated with vehicle or DXR at the indicated concentrations and FRET efficiency was determined. Two biologically independent experiments with n = 62 (vehicle), 33 (25 nM), 26 (50 nM), 29 (100 nM) and 19 (200 nM) independent cells; data are mean ± s.d. i, FRET efficiency at the indicated time points after addition of 200 nM DXR. Two biologically independent experiments with n = 62 (0 h), 28 (0.5 h), 30 (1 h), 19 (2 h) and 24 (3 h); data are mean ± s.d.
Low-dose DXR treatment selectively targets LSCs expressing Akt-activated β-catenin, which expand in response to chemotherapy.
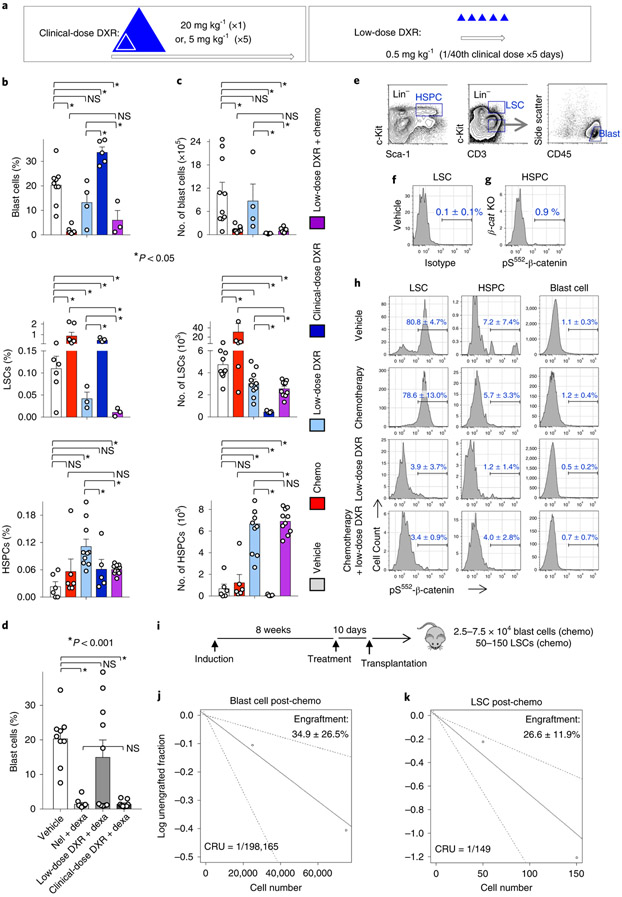
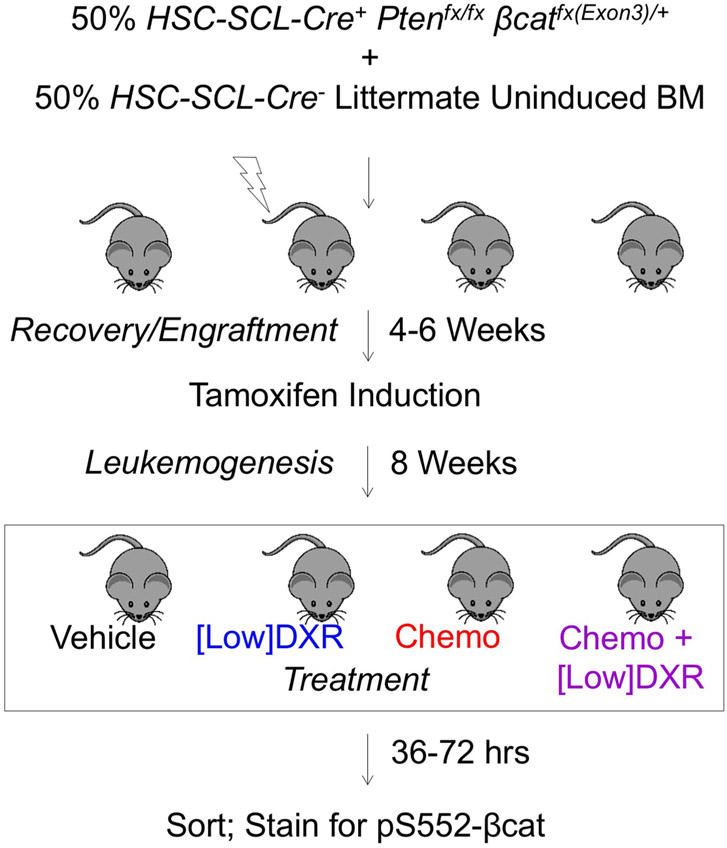
We next determined whether DXR could be repurposed as a targeted treatment, rather than a broadly cytotoxic chemotherapeutic agent in vivo, using cohorts of leukaemic mice (Extended Data Fig. 2). To target the Akt–β-catenin interaction, after testing different doses, we used doses well below the typical clinical dose, termed targeted or low-dose DXR (Fig. 3a; see also Methods). We next determined the differential effects of chemotherapy and low-dose DXR on blast cells, LSCs and HSPCs. Chemotherapy (see Methods) and low-dose DXR had divergent effects on blasts and LSCs, with chemotherapy targeting blast cells but inducing LSC expansion, whereas low-dose DXR specifically reduced the number of LSCs. In combination, this treatment reduced blasts, prevented LSC expansion and reduced LSCs while allowing HSPCs to recover (Fig. 3b).
Fig. 3 ∣. Differential response of LSCs, HSPCs and blast cells to treatment.
a, Strategy for repurposing DXR as a targeted therapy. Open arrows indicate a single treatment cycle for typical clinical use of DXR and targeted use strategy drawn to relative scales. Triangles represent DXR treatment drawn proportionally to scale. The cumulative targeted dose (distributed over 5 d consecutively) is indicated to relative scale by the inner triangle (white) (see Methods). b,c, Leukaemic mice were treated with vehicle, chemotherapy, low-dose DXR (5 × 0.5 mgkg−1), clinical DXR (1 × 20 mgkg−1) or chemotherapy + low-dose DXR (see Extended Data Fig. 2) and their bone marrow was analysed by FACS after 5 d of treatment. Average frequency (b) and absolute number per femur (c). n = 6 (vehicle), 6 (chemotherapy), 3 (low-dose DXR), 3 (chemotherapy + low-dose DXR) and 5 (clinical DXR) biologically independent mice; data are mean ± s.e.m. d, Leukaemic mice treated with vehicle, chemotherapy (nelarabine (nel) + dexamethasone (dexa)), low-dose DXR with dexa, or clinical-dose DXR (here, 5 × 4mgkg−1 daily) with dexa. Bone marrow analysis by FACS after 10 d of treatment. Data are mean frequency ± s.e.m.; n = 9 (vehicle), 10 (chemotherapy), 10 (low-dose DXR + dexa) and 9 (clinical DXR + dexa) biologically independent mice. In b–d, unpaired two-tailed t-test. e, Representative FACS gates indicating HSPC, LSC and (non-LSC) T-ALL blast cell populations. f,g, Verification of specificity of pS552-β-cat antibody. f, Cell populations from leukaemic mice from the vehicle group were stained with isotype control for anti-pS552-β-cat; gating based on the LSC population shown. g, Cell populations from conditional-knockout β-catenin mice (β-caf KO) were stained with anti-pS552-β-cat. At least one replicate experiment yielded similar results for each. h, Cell populations as described in e, analysed from leukaemic mice. Cells are stained with pS552-β-cat antibody after 4 d of treatment. n = 3 (vehicle), 4 (chemotherapy), 5 (low-dose DXR) and 5 (chemotherapy + low-dose DXR) biologically independent mice; data are mean ± s.d. i–k, Limiting-dilution assays determined CRU frequency among blast cells and LSCs sorted from chemotherapy-treated leukaemic mice using the indicated cell dose. Engraftment (≥1% blast cells) was determined in recipients at 10–12 weeks after transplant. n = 10 (25,000 blasts), 9 (75,000 blasts), 10 (50 LSCs) and 10 (150 LSCs) biologically independent mice; data show average donor engraftment percentage ± s.d. and CRU fraction. NS, not significant.
By contrast, the clinical-dose DXR (see Methods) alone was broadly toxic to all cells in terms of absolute number, particularly HSPCs. However, among the surviving cells, the frequency of blast cells was increased less than twofold and LSC frequency increased fivefold, whereas HSPC frequency was not significantly different from the frequency with vehicle alone. As chemotherapy agents are given in combination, we tested whether DXR could substitute for the DNA-damaging agent in our chemotherapy regimen. While low-dose DXR did not significantly reduce the number of blast cells, the clinical-equivalent dose of DXR could substitute for a DNA-damaging agent to reduce their number (Fig. 3d). These data indicate that low-dose and clinical-dose DXR treatments have substantially different effects, with broad overall toxicity of clinical DXR but more LSC-targeting specificity of low-dose DXR, including targeting of chemoresistant LSCs.
Since pS552-β-cat expression indicates that there is a Akt–β-catenin interaction, we next tested which cells expressed this marker and whether low-dose DXR could inhibit this signal. HSPCs, LSCs and non-LSC blast cells were analysed for pS552-β-cat expression (Fig. 3e-g). pS552-β-cat was detected infrequently in HSPCs and was nearly absent from blast cells, whereas most LSCs—including chemoresistant ones—were positive for pS552-β-cat. However, low-dose DXR treatment substantially reduced levels of pS552-β-cat in LSCs (Fig. 3h). These data demonstrate that, unlike HSPCs and blast cells, most LSCs express Akt-activated β-catenin, and DXR inhibits the Akt–β-catenin interaction in LSCs.
To quantify the tumorigenic activity of LSCs that expand after chemotherapy relative to blast cells, we performed limiting-dilution analysis, which showed a more than 1,300-fold increase in competitive-repopulating unit (CRU) activity of chemoresistant LSCs compared with blast cells surviving chemotherapy (Fig. 3i; Supplementary Table 1). These data show that chemoresistant Lin−c-KitMidCD3+ LSCs are markedly enriched in functional tumorigenic activity, consistent with previous reports32,34.
Low-dose DXR treatment reduces expression of multiple immune checkpoints in LSCs whereas clinical-dose DXR stimulates therapy resistance.
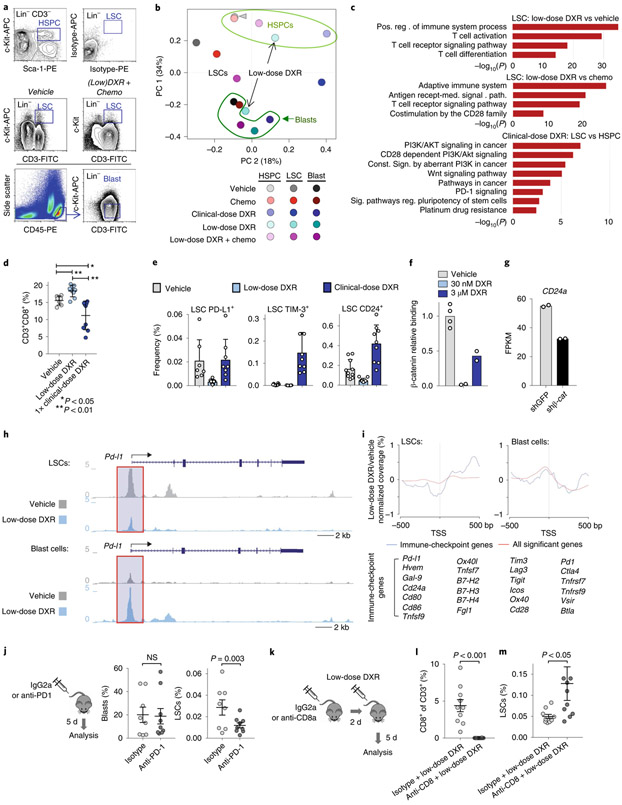
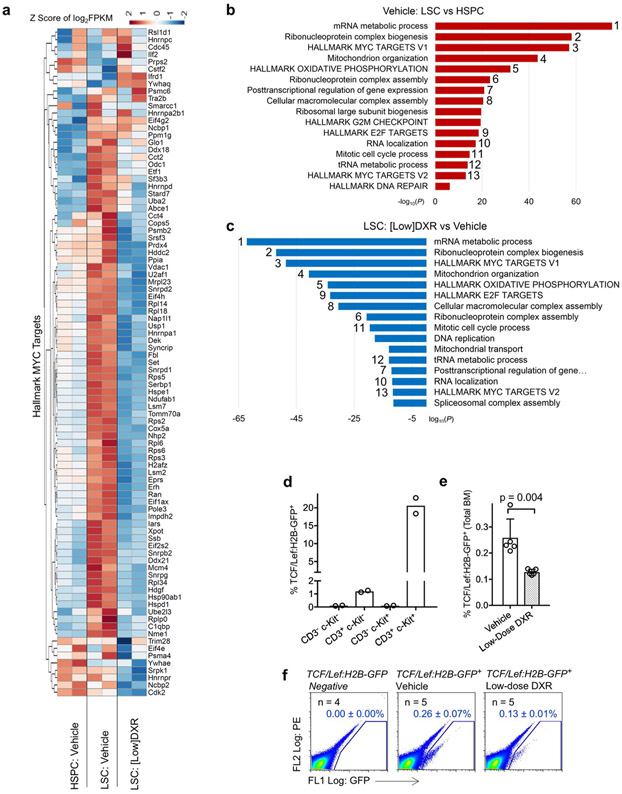
RNA-sequencing (RNA-seq) analysis of blast cells, LSCs and HSPCs sorted from treated mice revealed that LSCs from low-dose DXR-treated mice, unlike those from mice treated with the clinical dose, cluster amongst the blast cell population (Fig. 4a,b). Enriched gene ontology and pathway terms that are upregulated in LSCs relative to HSPCs included hallmark Myc target genes. However, levels of hallmark Myc targets were reduced in LSCs from mice treated with low-dose DXR (Extended Data Fig. 3a). Overall, enriched terms upregulated in LSCs relative to HSPCs but downregulated in LSCs after treatment with low-dose DXR were highly symmetrical (Extended Data Fig. 3b,c). TCF/Lef:H2B-GFP reporter mice showed that low-dose DXR treatment significantly inhibits Wnt-signalling reporter activity, further demonstrating that low-dose DXR inhibits activity of downstream β-catenin targets (Extended Data Fig. 3d-f).
Fig. 4 ∣. LSCs uniquely express immune checkpoints that can be inhibited with low-dose DXR.
a, Transcriptome analysis of indicated populations sorted by FACS at 5 d after treatment; representative gates are indicated. To obtain sufficient cells from the clinical DXR sample, the 5 × 4 mgkg−1 DXR daily dosing schedule was used. At least one replicate experiment yielded similar results for each. b, Principal component analysis (arrowhead indicates overlap of HSPCs from vehicle and chemotherapy). c, Gene ontology enrichment analysis using −log10 of the uncorrected P value as the x axis. Upregulated enriched terms are shown for the indicated population and treatment comparisons. In b,c, n = 2 biologically independent replicates for each (see Methods). d, Peripheral blood from leukaemic mice was analysed using FACS for CD8+ T cells at 48 h after treatment with vehicle, low-dose DXR or clinical DXR (1 × 20 mgkg−1). n = 7 (vehicle), 9 (low-dose DXR) and 9 (clinical DXR) biologically independent mice; data are mean ± s.d. e, LSCs were analysed 24–72 h after treatment for the indicated immune checkpoints. n = 7 biologically independent mice for each; mean ± s.d. f, Relative binding of β-catenin to the Cd24a gene locus (fold enrichment by ChIP-qPCR, normalized to the vehicle samples) 4 h after low (30 nM) or high (3 μM) DXR treatment. n = 4 (vehicle), 2 (30 nm DXR) and 2 (3 μM DXR). g, Cd24a expression in mouse ES cells with β-catenin knockdown (shβ-cat) for 48 h compared with the control (shGFP). n = 2 independent experiments each. FPKM, fragments per kilobase of transcript per million mapped reads. h, Chromatin accessibility profiles of example immune-checkpoint genes observed by ATAC-seq in LSCs and blast cells (see Methods). i, Metagene analysis of LSCs showing chromatin accessibility near the transcriptional start site (TSS) in immune-checkpoint gene loci (listed) compared with all loci showing significant changes. Gene synonyms are listed here in parentheses: Hvem (Tnfrsf14), Gal-9 (Lgals9), Ox40l (Tnfsf4), Tnfsf7 (Cd70), B7-H2 (Icosl), B7-H3 (Cd276), B7-H4 (Vtcn1), Pd1 (Pdcd1), Tnfrsf7 (Cd27), Tim3 (Havcr2), Ox40 (Tnfrsf4). j, Leukaemic mice were treated with PD1 antibody or isotype control and analysed by FACS. n = 8 (isotype) and 9 (anti-PD1) biologically independent mice; data are mean ± s.e.m. k–m, CD8+ T cells were depleted with CD8 antibody before low-dose DXR treatment; bone marrow was analysed by FACS. n = 10 biologically independent mice for each group; data are mean ± s.e.m. In d,j,l,m, unpaired two-tailed t-test.
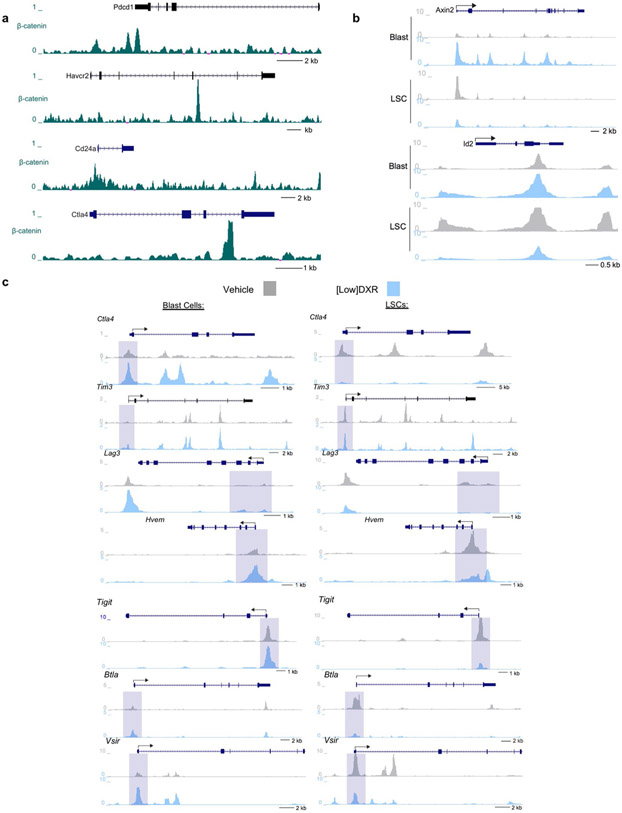
LSCs from mice treated with low-dose DXR showed the most upregulation of immune-related terms, particularly involving T cells (Fig. 4c). Since the therapeutic efficacy of DXR depends on a substantial contribution from the immune system, particularly CD8+ T cells45,48, we measured their frequency after treatment with low or clinical-dose DXR. Low-dose DXR treatment resulted in an increase, whereas clinical-dose DXR resulted in a decrease in CD8+ T cell number (Fig. 4d). While CD8+ T cells can eliminate cancer cells, some tumour cells resist CD8+ T cells by expressing immune checkpoints. LSCs were found to express immune checkpoints such as PD-L1 and CD24. PD-L1 levels associate with stemness in cancer and PD-L1 accumulation on cancer stem cells promotes immune evasion49,50. CD24 serves as an immune checkpoint, suppressing damage-induced immune responses, and marks cancer stem cells exhibiting signatures of immune evasion51,52. These populations were reduced with low-dose DXR treatment, but unchanged or increased with clinical-dose DXR (Fig. 4e). Rare TIM-3+ LSCs increased substantially with clinical-dose DXR but not with low-dose DXR. Thus resistance of LSCs to clinical-dose DXR may involve immunosuppression of CD8+ T cells and expression of immune checkpoints by resistant LSCs. However, since low-dose DXR reduces immune-checkpoint expression, LSCs may become more susceptible to increased CD8+ cell immunosurveillance. Indeed, β-catenin binds multiple immune-checkpoint gene loci at the promoter and/or intergenic regions (Extended Data Fig. 4a). CD24 was the most abundantly expressed immune checkpoint we examined in LSCs. β-catenin binding of the Cd24 promoter region was essentially abolished by low-dose DXR; this effect was partially reversed at higher doses (Fig. 4f). Knockdown of β-catenin also reduced Cd24 expression (Fig. 4g). At high doses of DXR, partial reversal of β-catenin binding and enrichment of CD24+ LSCs suggests that resistance mechanisms lead to retention of CD24 expression in DXR-resistant LSCs. Comparing LSCs and HSPCs from mice treated with clinical-dose DXR revealed increased expression of oncogenic signalling and other resistance pathways (Fig. 4c). These results reveal mechanisms for the differential response of LSCs to low-dose DXR versus clinical-dose DXR, in particular, the potential restoration of tumour-fighting T cells and inhibition of immune checkpoints specifically by low-dose DXR.
Although LSCs are too rare for chromatin immunoprecipatation (ChIP) with sequencing (ChIP–seq), assay for transposase-accessible chromatin with high-throughput sequencing (ATAC-seq) was used to measure chromatin accessibility of immune-checkpoint genes. Accessibility in the promoter regions of Wnt target genes was reduced by low-dose DXR treatment in LSCs but not in blast cells (Extended Data Fig. 4b). In support of reduced protein levels of PD-L1 in LSCs after low-dose DXR treatment (Fig. 4e), Pd-l1 (also known as Cd274) promoter accessibility was reduced in LSCs by low-dose DXR (Fig. 4h). Generally, accessibility of immune-checkpoint genes near the transcriptional start site was reduced by low-dose DXR treatment compared with all significantly changed genes, but this was not observed in blast cells (Fig. 4i). Indeed, in LSCs, multiple immune-checkpoint genes including Pd-l1, Ctla4, Tim3, Lag3, Tigit, Hvem, Vsir and Btla showed reduction in promoter accessibility by low-dose DXR treatment but either no reduction or increases in blast cells (Fig. 4h,i and Extended Data Fig. 4c). Functionally, anti-PD-1 treatment of leukaemic mice reduced LSCs but had no effect on blast cells, thus mimicking the effect of low-dose DXR (Fig. 4j). To test whether the effectiveness of low-dose DXR depends on CD8+ cells, we depleted this population immediately before low-dose DXR treatment. After CD8+ cell depletion, the effect of low-dose DXR on LSCs was reduced (Fig. 4k-m). These data indicate that LSCs, unlike their blast progeny, exhibit unique properties of immune checkpoint-mediated resistance that can be overcome by targeting Akt-activated β-catenin.
Targeting chemoresistant LSCs with low-dose DXR reduces tumorigenicity and increases survival.
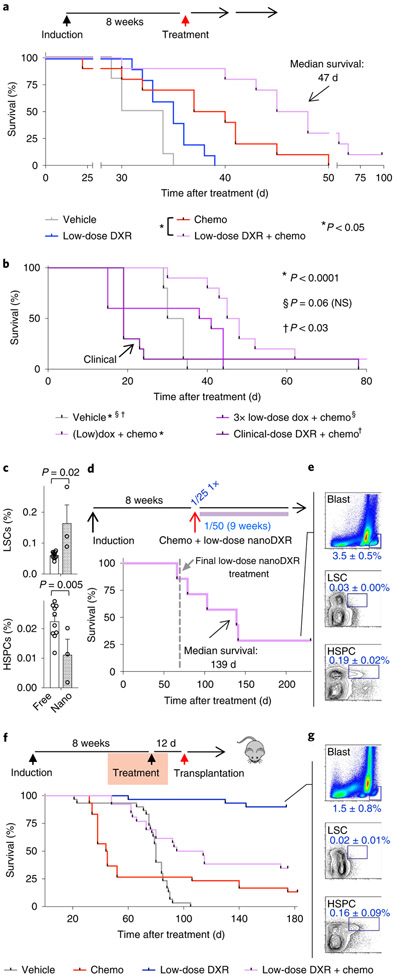
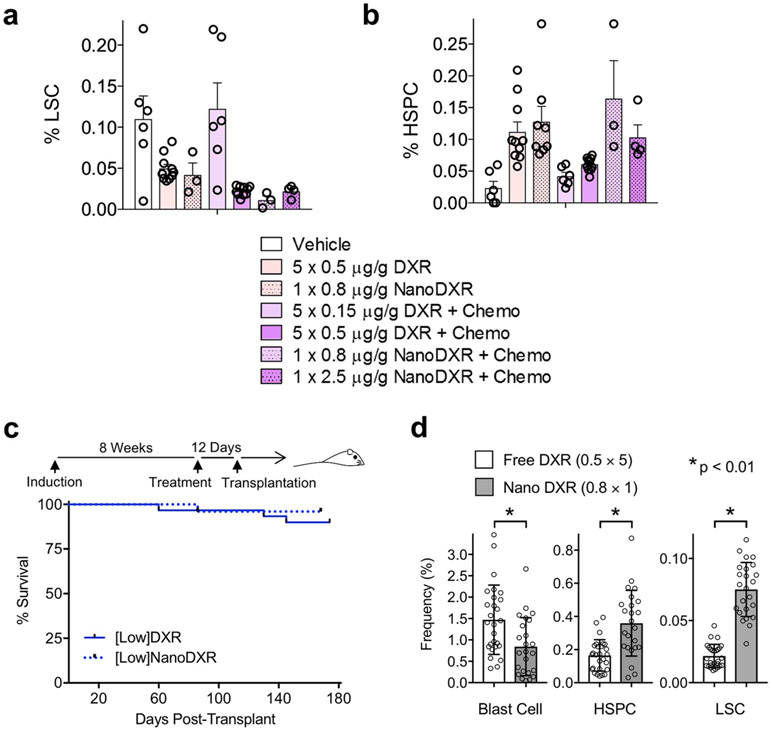
Mice treated with chemotherapy alone showed somewhat improved overall survival (Fig. 5a), but mice treated with only low-dose DXR showed no significant improvement, probably due to the insignificant effect on blast cells (Figs. 3b, 5a). Combining chemotherapy and low-dose DXR significantly increased survival (Fig. 5a). However, a threefold higher dose of DXR did not reduce survival, whereas clinical-dose DXR significantly reduced survival (Fig. 5b). We tested whether maintenance treatment with low-dose DXR might better prevent LSCs from re-establishing leukaemia. Using DXR-loaded nanoparticles (nanoDXR) to allow slow, sustained release of DXR (see Methods), we tested different doses of free DXR and nanoDXR (Extended Data Fig. 5a,b). Sustained nanoDXR significantly reduced LSCs compared with free low-dose DXR (Fig. 5c). Median survival was increased 4.3-fold compared with control (Fig. 5d,e).
Fig. 5 ∣. Chemotherapy induction combined with maintenance targeted/low-dose DXR treatment increases survival.
a, Cohorts of leukaemic mice were treated with vehicle, chemotherapy, low-dose DXR or chemotherapy + low-dose DXR as in Extended Data Fig. 2. Treatment schematic and Kaplan–Meier curves of leukaemic mice treated as indicated. Red arrow indicates day 0 on survival curve. b, Kaplan–Meier survival curves of leukaemic mice treated with a threefold increased dosage of low-dose DXR + chemotherapy or clinical-dose DXR + chemotherapy as indicated and compared with vehicle control. n = 10 biologically independent mice for each group (a,b). c, LSC and HSPC frequency in bone marrow of leukaemic mice at 5 d after treatment with chemotherapy and either free low-dose DXR (free) or low-dose nanoDXR (nano). n = 10 (free DXR), 3 (nanoDXR) biologically independent mice; data are mean ± s.e.m. Unpaired two-tailed t-test. d, Treatment schematic and Kaplan–Meier curves of chemotherapy (week 1 only) + weekly low-dose nanoDXR treatment for 10 weeks total. Dashed line indicates day of final low-dose nanoDXR treatment. e, Low nanoDXR-treated mice were analysed by FACS at 230 d after treatment. n = 3 biologically independent mice; data are mean ± s.d. f,g, Tumorigenic assays for cells from treated, leukaemic mice: cohorts of leukaemic mice were treated with vehicle, chemotherapy, low-dose DXR or chemotherapy + low-dose DXR as in Extended Data Fig. 2. At 12 d after treatment, bone marrow was collected from treated mice and transplanted into sublethally irradiated NSG recipients. f, Treatment and transplantation schematic and Kaplan–Meier curves of recipient mice. Red arrow indicates day 0 in survival curve. g, Recipients of bone marrow from leukaemic mice treated with low-dose DXR only were analysed by FACS at 6 months after transplant. Representative plots of blast cells, LSCs and HSPCs with average frequency ± s.d. of surviving 27 out of 30 recipients from this group. Statistics determined by log-rank (Mantel–Cox) test for survival curves.
To test for tumorigenicity, bone marrow was transplanted from treated mice into secondary recipients one week after completion of treatment. Recipients of chemotherapy-treated bone marrow mostly succumbed more rapidly than control mice. Since LSCs are the tumorigenic population, reduced survival in this group was consistent with functional LSC expansion induced by chemotherapy (Fig. 3b). Notably, we found that 27 out of 30 recipients of bone marrow treated with low-dose DXR remained healthy (Fig. 5f,g). Similar results were obtained with bone marrow treated with low-dose nanoDXR (Extended Data Fig. 5c,d). These data support the specific targeting of LSC tumorigenic activity by targeted DXR treatment.
Median survival of recipients of bone marrow from chemotherapy and low-dose DXR-treated mice was significantly extended from 44.5 d to 104.5 d, compared with the chemotherapy-alone group (Fig. 5f). Thus, although combination treatment reduces phenotypic LSCs similarly to low-dose DXR alone (Fig. 3b), functional LSCs can ultimately recover with exposure to chemotherapy and the resulting chemoresistance. Nonetheless, low-dose DXR treatment significantly reduces the number of chemoresistant cells with tumorigenic activity (Fig. 5f and Extended Data Fig. 5c). Together, these data show that functional, tumorigenic LSCs are differentially targeted by chemotherapy and low-dose DXR—with chemotherapy activating LSCs, whereas low-dose DXR targets LSCs in tumorigenic assays. However, combination therapy is necessary to substantially improve survival in primary leukaemic mice, as chemotherapy reduces blast cells while low-dose DXR targets chemoresistant LSCs.
Low-dose DXR treatment reduces leukaemia-initiating activity of human leukaemia exhibiting chemoresistant pS552-β-cat+ LSCs.
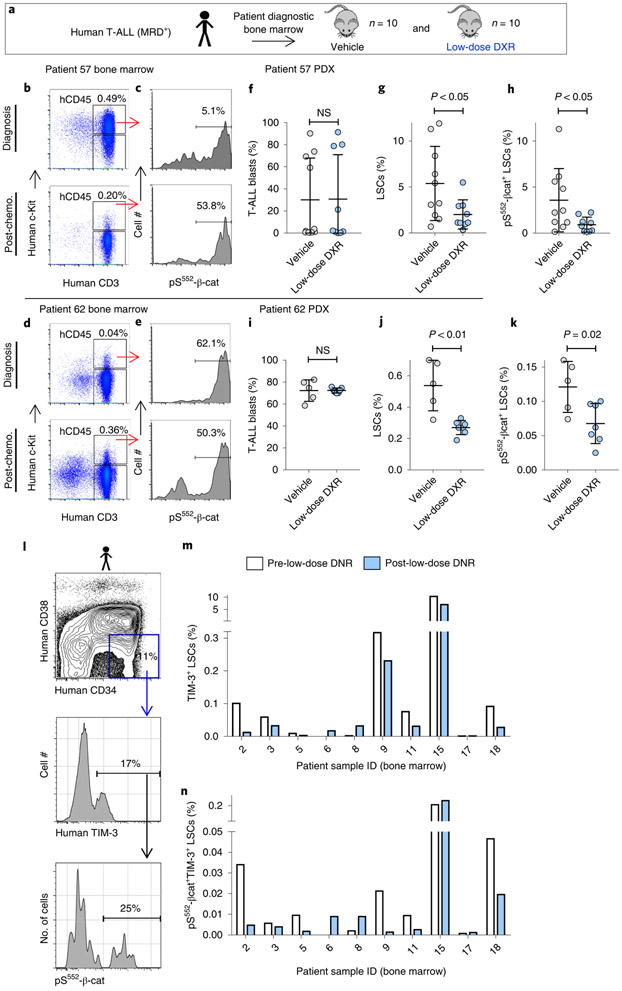
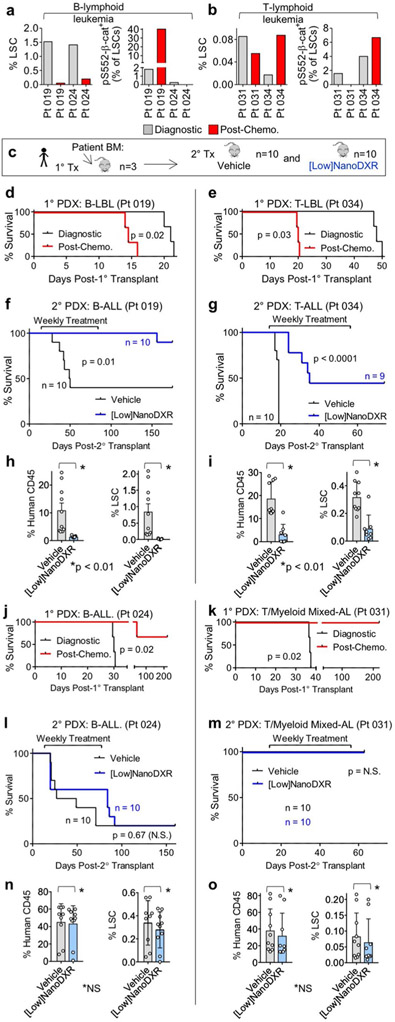
To investigate potential relevance of our findings to patients, we tested whether low-dose DXR treatment could reduce pS552-β-cat+ LSCs in patients with paediatric T-ALLs exhibiting MRD. Given the similar mechanisms responsible for relapse in paediatric ALL as in our mouse model16-19, the lack of verified markers for T-ALL LSCs and the role of c-Kit in activating the PI3K pathway, we used similar fluorescence-activated cell sorting (FACS) analysis to identify putative T-ALL LSCs in samples from two of the patients. In both cases, MRD+ T-ALLs were enriched in pS552-β-cat+ LSCs after chemotherapy, either as a result of an increased LSC frequency (patient 62) or of an increased pS552-β-cat+ fraction of LSCs (patient 57), indicating that they may represent chemoresistant LSCs (Fig. 6a-e). Our data clearly indicate a major role for the immune system in mediating the effect of low-dose DXR in established leukaemias (Fig. 4). However, given the necessity of using immunocompromised mice for the patient-derived xenograft (PDX) experiments, we tested whether low-dose DXR treatment could inhibit the establishment of leukaemia—that is, whether it could inhibit the tumorigenic capacity of LSCs. PDX mice were treated with low-dose DXR two weeks after transplantation. FACS analysis revealed that although engraftment of bulk blast cells was not substantially changed by low-dose DXR treatment, pS552-β-cat+ LSCs were significantly reduced in number (Fig. 6f-k).
Fig. 6 ∣. Low-dose DXR treatment reduces the number of persistent pS552-β-cat+ cells from MRD+ human leukaemia.
a, Experimental schematic of establishment and treatment of patient-derived xenografts (PDX) (see Methods). b–e, FACS analysis of diagnostic and day 29 after chemotherapy T-ALL bone marrow samples from MRD+ leukaemia patients. CD45+c-Kit+CD3+ cells (LSCs) expressing pS552-β-cat were enriched 4.4-fold following chemotherapy in patient 57 and 7.3-fold in patient 62. Similar results were obtained from two additional independent biological samples (Extended Data Fig. 6 and Supplementary Table 2). hCD45, human CD45. f–k, Diagnostic bone marrow samples were transplanted into NSG recipients (4 × 10⁵ cells each), treated for 5 d with vehicle or low-dose DXR at 2 weeks after transplant, and analysed by FACS for human engraftment. Shown are T-ALL blasts (CD45+c-Kit−CD3+), LSCs and pS552-p-cat+ LSCs. n = 10 (patient 57 vehicle), 9 (patient 57 low-dose DXR), 5 (patient 62 vehicle) and 7 (patient 62 low-dose DXR) biologically independent mice; data are mean ± s.d. Unpaired two-tailed t-test. l–n, Relapsed or refractory adult patients with AML received one cycle of low-dose DNR (6.75 mg m−2 daily for 5 d (days 1–5). Pre-treatment (day 0) and post-treatment bone marrow samples were collected and analysed by FACS. l, Representative FACS plots showing gating strategy for analysis. m,n, LSCs (identified as CD45+CD34+CD38−TIM-3+ cells) and pS552-β-cat+ LSCs were quantified according to gating represented in l before and post-low-dose DNR treatment as indicated. n = 10 individual patient samples, pre- and post-treatment samples were analysed individually (m,n).
To determine how indicative chemoresistant human LSCs expressing pS552-β-cat were to tumorigenic capacity and further test how effective low-dose DXR is at targeting them, additional leukaemia bone marrow samples were analysed for phenotypic LSCs53-57 and pS552-β-cat levels. Analysis at diagnosis and at day 29 after chemotherapy found that some patient samples contained chemoresistant pS552-β-cat+ LSCs (Extended Data Fig. 6a,b and Supplementary Table 2). Tumorigenic analysis was performed on diagnostic and post-chemotherapy-treated B-cell and T-lymphoid leukaemia samples that either had or lacked chemoresistant pS552-β-cat+ LSCs (Extended Data Fig. 6c). Samples containing chemoresistant pS552-β-cat+ LSCs showed rapid leukaemia development, with post-chemotherapy bone marrow samples resulting in significantly faster leukaemia development than paired diagnosis samples (Extended Data Fig. 6d,e). However, post-chemotherapy bone marrow from samples lacking chemoresistant pS552-β-cat+ LSCs did not induce leukaemia in recipients (Extended Data Fig. 6j,k). These results are consistent with enriched tumorigenicity of chemoresistant but not chemosensitive pS552-β-cat+ LSCs in patient samples.
We tested whether low-dose DXR could also inhibit tumorigenicity of patient bone marrow containing chemoresistant pS552-β-cat+ LSCs. Bone marrow was collected from primary recipients and transplanted into secondary recipients, which were treated with low-dose DXR or vehicle control. Recipients of patient samples containing chemoresistant pS552-β-cat+ LSCs showed significantly improved survival, and reduced leukaemia engraftment and LSC frequency compared with vehicle control (Extended Data Fig. 6f-i). However, those lacking chemoresistant pS552-β-cat+ LSCs showed no significant difference (Extended Data Fig. 6l-o). These data are consistent with the potential of low-dose DXR for targeting chemoresistant pS552-β-cat+ LSCs in patient samples.
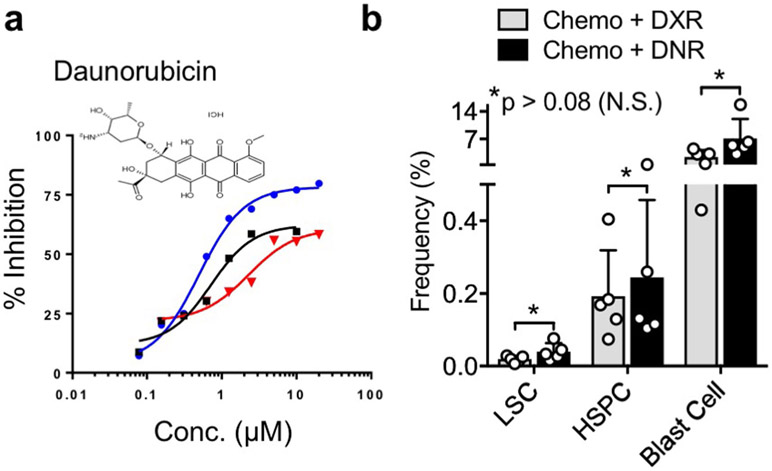
A pilot clinical trial was conducted using low-dose anthracycline treatment on adult patients with relapse or refractory AML (see Methods and Supplementary Table 3). Daunorubicin (DNR) is the anthracycline analogue of DXR used in AML treatment and similarly inhibits pS552-β-cat (Extended Data Fig. 7). AML LSCs, distinguished from HSPCs by TIM-3 expression58,59, showed substantial reductions in pS552-β-cat+ LSCs in five out of ten patients, three were unchanged, and two initially had very low or absent pS552-β-cat+ LSCs (Fig. 6l-n). While future studies will determine the effect of low-dose anthracycline treatment on patient outcomes, these data indicate that pS552-β-cat+ LSCs can be reduced in relapsed or refractory patients.
Discussion
While our data show that immune resistance is a major mechanism of tumour escape for LSCs, our preclinical studies using patient samples involved immunocompromised mice, indicating that LSC-intrinsic mechanisms also occur. The cooperative role of the Wnt–β-catenin and PI3K–Akt pathways in stem cell regulation and the hijacking of stem cell properties by leukaemia-initiating cells probably represent an additional mechanism for the effect of low-dose DXR. Recent links between tumour-initiating stem cells and immune resistance suggest that these properties may not be mutually exclusive60. Although our mouse leukaemia model suggests a strong role for CD8+ cells, in the clinic, an additive or synergistic effect intrinsically on LSCs and extrinsically on CD8+ and other immune cells is possible.
While the precise immunological response is beyond the scope of this study, our data raise several important questions. It remains unknown whether immune-checkpoint inhibitors act directly on LSCs and/or act directly on LSC-reactive CD8+ cells. Furthermore, the nature of these reactive cells and whether they undergo phenotypic changes in response to low-dose DXR and/or immune-checkpoint therapy will be interesting questions for future in-depth immunological studies. It is also unclear whether immunological memory can be established against LSCs; future studies will be important for determining whether this is the case.
In contrast to our targeted use, clinical doses of DXR, while highly effective at reducing the absolute numbers of all cell types, also stimulated resistance mechanisms, including immune checkpoints, in LSCs. However, low-dose DXR uniquely targets LSCs, which are responsible for tumour escape (Extended Data Fig. 8). Our preclinical and early clinical data indicate that Akt-activated β-catenin could serve as a biomarker indicating patients who might benefit from low-dose anthracycline therapy. Accumulating evidence suggests that the therapeutic efficacy of certain conventional chemotherapies, particularly anthracyclines, relies not only on direct cytotoxicity but also on restoring anticancer immune responses45,48. Our data show that repurposing DXR as a targeted therapy inhibits expression of multiple immune checkpoints in the cells responsible for therapy resistance and relapse. Our finding that β-catenin binds multiple immune-checkpoint genes indicates that the Wnt pathway may have a role in stem cells beyond its wellknown role in self-renewal, particularly in protecting stem cells from the immune system.
Online content
Any methods, additional references, Nature Research reporting summaries, source data, extended data, supplementary information, acknowledgements, peer review information; details of author contributions and competing interests; and statements of data and code availability are available at https://doi.org/10.1038/s41556-020-0507-y.
Methods
Mice.
Mice were housed in the animal facility at Stowers Institute for Medical Research (SIMR) and handled according to Institute and NIH guidelines. All procedures were approved by the Institutional Animal Care and Use Committee of SIMR. The HSC-SCL-Cre-ERT PtenloxP/loxPCtnnb1loxP(exon3)/+ (hereafter, Pten:β-catAct) mouse model combines conditional deletion of LoxP-flanked Pten, resulting in activation of the PI3K–Akt pathway, and exon 3 of the β-catenin gene, Ctnnb1, (β-catAct), resulting in constitutive activation of β-catenin61,62. The HSPC-specific Cre recombinase, HSC-SCL-Cre-ERT, was used to study the combined effects of both pathways, starting with HSPCs and without the HSC activating effects of induction by interferon46. Primary HSC-SCL-Cre mice were induced by intraperitoneal injection of tamoxifen daily for 5 d with 5 mg on day 1 and 2 mg on days 2–5, each dissolved in 0.1 ml of corn oil. A Bioruptor sonicator was used to fully solubilize the tamoxifen. HSC-SCL-Cre was induced in transplant recipients by placing transplant recipients on tamoxifen feed (1 mg g−1) for two weeks. HSC-SCL-Cre, Pten and β-catAct were obtained from J. Goethert (University of Duisburg-Essen, Germany), H. Wu (UCLA, Los Angeles, CA) and M. Taketo (Kyoto University, Japan), respectively. TCF/Lef:H2B-GFP reporter mice were obtained from A.-K. Hadjantonakis (Sloan-Kettering, NY, USA). This study is compliant with all relevant ethical regulations regarding animal research.
Transplantation assays.
Whole bone marrow was isolated from uninduced Pten:β-catAct mice and combined with an equal portion of Cre-negative bone marrow from a littermate and transplanted into irradiated (10 Gy) B6.SJL-PtprcaPepcb/BoyJ (Ptprc) recipients. Recipients were placed on tamoxifen feed 4–6 weeks after transplant to induce recombination, resulting in leukaemia development by 7–8 weeks after induction in all recipient mice.
Limiting-dilution and tumorigenic assays were performed by establishing leukaemic mice as described above and treating as indicated at 8 weeks after induction. For limiting-dilution transplants, mice were treated with chemotherapy or low-dose DXR and, at ten days after treatment (based on the first treatment), CD45HiCD3+c-Kit− blast cells or Lin−CD3+c-KitMid LSCs were sorted from chemotherapy-treated mice and Lin−Sca-1+c-Kit+ HSPCs were sorted from low-dose DXR-treated mice. The indicated numbers of these populations were transplanted into 3.25 Gy-irradiated NOD.Cg-Prkdcscid Il2rgtm1Wjl/SzJ (NSG) recipient mice. Recipient bone marrow was analysed by flow cytometry 10–12 weeks after transplant and those with ≥1% CD45Hi blast cells in bone marrow were considered engrafted. CRU frequency was determined using ELDA analysis.63
Tumorigenic assays were performed by transplanting 0.5, 1.5 or 4.5 × 10⁴ bone marrow cells from treated mice 12 d after treatment into 3.25 Gy-irradiated NSG recipient mice. Ten recipients were used for each dose from each group. One male and one female donor was used for each group. Leukaemia was assessed in mice that were euthanized due to poor health by analysing CD45HiCD3+ cell frequency. Mice having >20% blasts in the bone marrow were considered leukaemic. NSG and Ptprc mice were originally obtained from The Jackson Laboratory.
In vitro treatment.
Bone marrow cells from leukaemic mice at 8 weeks after induction were cultured overnight at 5–20 × 104 cells per well in 96-well U-bottom tissue culture plates (Becton, Dickinson; 353077) in HSC expansion medium in low O2 conditions as previously described27. DXR (Sigma; D1515), 105306 (University of Kansas Chemical Methodology and Library Development (CMLD) compound) or thioguanosine was mixed with HSC expansion medium and added to the cultures to obtain final concentrations of 11, 33 or 100 nM. Equivalent amounts of DMSO alone (vehicle control) were added to parallel cultures for comparison. Half-medium changes were performed approximately every 24 h. Cultures were analysed after 72 h exposure to the indicated drug.
In vivo treatment.
Chemotherapy for the mouse model consisted of nelarabine (Selleck) and dexamethasone (BioVision) administered daily for 5 d consecutively. Nelarabine (43.4 mg ml−1) was administered intravenously through the tail vein in a volume of 5 μl per g of body weight, which yielded 217 mg kg−1. Dexamethasone (2.5 mg ml−1) was injected intraperitoneally in a volume of 4 μl per g of body weight, yielding 10 mg kg−1. Targeted low-dose DXR treatment consisted of 5 consecutive daily doses at 0.5 mg kg−1 using doxorubicin hydrochloride (Sigma; D1515) at 0.1 mg ml−1 injected intravenously via the tail vein in a volume of 5 μl per g of body weight, which yielded 0.5 mg kg−1 (clinical DXR used 4.0 mg kg−1). Low NanoDXR treatment used DXR nanoparticles64 administered as a single intravenous injection once per week on day 1 relative to above treatments using 0.8 mg kg−1. Maintenance low NanoDXR consisted of once-per-week injections of 0.4 mg kg−1. Groups combining nelarabine with DXR used a single injection containing both drugs. All drugs were solubilized in 45% (2-hydroxypropyl)-β-cyclodextrin or 0.9% NaCl.
For immune-checkpoint blocker treatment, 250 μg anti-PD-1 or isotype control (BioXcell) was injected intravenously every other day for a total of 3 injections. For CD8+ T cell depletion, 2 × 100 μg and 1 × 250 μg of anti-CD8a or isotype control (BioXcell) was injected intravenously every other day.
Rationale for DXR dosage.
For clinical acute lymphocytic leukaemia therapy, doxorubicin is typically administered as a single dose every 21–28 d at 40–75 mg m−2. Using 60 mg m−2 as the clinical-equivalent dose, this is equivalent to 1.6 mg kg−1 for adult humans (60 mg m−2 × 1 m2/37 kg = 1.6 mg kg−1). Converting to the mouse, this is equivalent to ~20 mg kg−1 (1.6 mg kg−1 × 12.3 (km(Human)/km(mouse)) = 19.7 mg/kg) (km is Michaelis constant) (ref. 65). Cumulatively, 2.5 mg kg−1 doxorubicin was administered, and thus 1/8 the equivalent clinical dose was spread over 5 d.
Clinical trial.
The trial was registered at clinicaltrials.gov with identifier NCT02914977. All patients provided informed consent according to institutional guidelines. At least two prior induction attempts were required for fit patients with primary refractory leukaemia; unfit or relapsed patients were allowed entry with one prior therapy. There was no limit on the number of prior therapies. Patients had an ECOG performance score of 0–3, adequate hepatic and renal function and cardiac ejection fraction ≥45%. Exclusion criteria included the presence of acute promyelocytic leukaemia, central nervous system leukaemia or total lifetime anthracycline exposure exceeding the equivalent of 500 mg m−2 of DNR. Treatment consisted of bone marrow aspiration for correlative studies followed by one cycle of low-dose DNR (6.75 mg m−2 for 5 consecutive days, days 1–5) and a second bone marrow aspiration on day 8. Effects on LSC population were measured by flow cytometry. Adverse events and laboratory values were monitored for safety. This study is compliant with all relevant ethical regulations regarding research involving human participants and was approved by the Human Subjects Committee at the University of Kansas.
Preparation of nanoDXR.
Self-assembled nanoparticles were prepared from new amphiphilic cholesterol-based brush-like block copolymers composed of polynorbonene bearing a cholesterol block and a poly(ethylene glycol) block. DXR-containing self-assembled nanoparticles were prepared from DXR and the newly developed amphiphilic cholesterol-based brush-like block copolymers using the reported methods64. The mean particle size was 135.5 ± 3.5 nm and the drug loading in the nanoparticles was 22%.
Flow cytometry.
Cells were collected from bone marrow (femur and tibia), spleen, peripheral blood and thymus. For cell-surface phenotyping, a lineage cocktail (Lin) was used including CD3 (for HSPC but not LSC analysis), CD4, CD8, Mac-1, Gr1, B220, IgM and Ter119 (eBioscience). Monoclonal antibodies against CD3 (separate fluorophore for LSC analysis), Sca-1, c-Kit, CD45.1 and CD45.2 were also used where indicated. Cell sorting and analysis were performed using an inFlux (BD), MoFlo (Dako) and/or CyAn ADP (Dako). Data analysis was performed using FlowJo software.
For FACS analysis using phycoerythrin-conjugated monoclonal pS552-β-catenin antibody, cells were washed twice after cell-surface staining, resuspended in 250 μl of BD Fixation/Permeabilization solution, incubated for 20 min at 4 °C, washed twice with 1 ml of 1× BD Perm/Wash Buffer, resuspended with 100 μl 1× BD Perm/Wash Buffer, added 1.0 μg μl−1 pS552-β-catenin antibody per 100 μl solution containing up to 3 million cells, incubated 2 h on ice with rocking (resuspended every 15 min), washed 2 times and resuspended in PBS + 2%FBS for analysis. Bone marrow from β-catenin-knockout mouse was collected at 2–3 weeks after knockout induction and stained alongside other test samples.
Immunostaining.
For monoclonal pS552-β-catenin antibody, immunohistochemistry was performed using standard techniques according to the following details: tissues were fixed in zinc formalin, antigen retrieval used citrate buffer for 15 min at 90 °C, samples were cooled to room temperature, washed in PBS, peroxidase activity was quenched with 0.3% H2O2 (peroxide) for 10 min, samples were washed in PBS, blocked with 1× Universal Block for 10 min. at room temperature, washed in PBS, stained with primary antibody diluted 1:1,000 for 1 h at room temperature, washed 3 times in PBS + 0.05% Tween, stained with anti-rat horseradish peroxidase-conjugated secondary antibody at 1:1,000 dilution. Horseradish peroxidase-conjugated antibody was diluted in PBS, 1% BSA, 0.1% gelatine, 0.05% Tween and incubated with samples for 30 min at room temperature, washed 3 times in PBS and developed with DAB reagent for 5 min, washed in ddH2O and counterstained using light (20%) haematoxylin and eosin.
Computational modelling.
Comparative modelling was applied to predict the 3D structures of β-catenin and Akt using MUFOLD and Modeller. Modelling accuracy was further improved by sampling multiple conformations and conducting comprehensive structure-quality assessment. Docking between β-catenin and Akt was conducted using ZDock. We analysed the distributions of docking scores and 3D conformations, and compared the hydrogen bonds formed in individual docking conformations to select the best candidate out of the top-100 predictions from ZDock. Similar methods were applied to dock β-catenin and DXR. There were several possible candidate structures from the Protein Data Bank (PDB) for DXR. Considering the structural similarity and docking stability, PDB 151D was selected and used for Fig. 2g. Protein visualization was produced using PyMol.
FRET assay.
FRET measurement was performed using the acceptor-photobleaching method. In brief, 293 T cells were transfected with eGFP-Akt and mCherry-β-catenin (Addgene #39531 and #55001, respectively). A Perkin-Elmer Ultraview spinning-disc system with a CSU-X1 Yokogawa disc was used for imaging. A ×40 1.2 numerical aperture Plan-Apochromatic objective was used, and emission was collected onto a C9100 Hamamatsu Photonics EM-CCD camera. eGFP was excited with a 488 nm laser and emission was collected through a 500–555 nm bandpass filter. mCherry was illuminated and photobleached with a 561 nm laser. mCherry emission was collected with a 580–650 nm bandpass filter. Six images of eGFP were acquired before, and eight images were acquired after bleaching of the mCherry with intense 561 nm light. After subtraction of camera background, the average intensity of eGFP in a region of interest spanning the bleached cell was determined in the four images before acceptor bleach (I1), or the four images after acceptor bleach (I2). FRET efficiency is reported as 1 – (I1/I2). Calculations were based on more than 500 cell images.
High-throughput screening.
Two-hundred and forty three compounds were selected from primary screening of the validation library (5,040 compounds) drawn from CMLD (1,920), Prestwick (1,120) and MicroSource Spectrum (2,000) libraries and reconfirmed in a 10-concentration dose-response assay. Activity of compounds was tested against HEK-TOP cells versus HEK FOP cells for inhibition of luciferase activity. The cytotoxicity profiles of the compounds were also tested using Cell Titer Glo assay (Promega) on HEK-TOP cell lines. The dose-response data were used to calculate the effective concentration of compounds resulting in 50% inhibition of luminescence or cytotoxicity (EC50) using nonlinear-regression analysis. Approximately 90 compounds showed 2.2 to 3-fold differences in EC50 between the HEK-TOP and HEK FOP cells. Of these, 36 compounds showed a window between luminescence inhibition and cytotoxicity. The structures of compounds were analysed by cheminformatics analysis and medicinal chemists identified 25 compounds for repurchasing as fresh powders. The repurchased compounds were used to treat the cells at compound concentrations that resulted in 90%, 50% and 25% inhibition of luminescence (EC90, EC50 and EC25, respectively) derived from the dose-response curves for luminescence inhibition in the HEK-TOP cell line. The HEK cells and HEK-TOP cells were plated at 300,000 cells per well in 6-well plates and were treated in duplicate with EC90, EC50 and EC25 concentrations of the 25 repurchased compounds and three controls. After 48 h of exposure, the cells were washed with PBS and flash-frozen. The frozen cells were lysed directly in plates for western blot analysis.
RNA-seq.
Cohorts of leukaemic mice were treated with vehicle, chemotherapy, low-dose DXR, clinical-dose DXR or chemotherapy and low-dose DXR as shown in Extended Data Fig. 2. At 10 d after treatment (day 1 is the start of treatment), blast cells, LSCs and HSPCs were sorted using stringent gates (see Fig. 4a) for these populations. For each population, 2 biological replicates were made with 1–3 technical replicates each. Each biological replicate was a pool of sorted cells from 4–5 male and 4–5 female mice. Technical replicates were samples of sorted cells from each biological replicate. One thousand cells per sample were sorted into 96-well plates with 7 μl lysis buffer containing RNase inhibitor (2 U μ−1) from bone marrow. First-strand cDNA synthesis and cDNA libraries were constructed using the SMARTer ultra-low-input RNA kit for sequencing v3 (Clontech) following the manufacturer’s instructions. cDNA quality was determined using the Agilent high-sensitivity DNA kit on an Agilent 2100 BioAnalyzer (Agilent Technologies). Libraries were sequenced at 50 bp on the Illumina HiSeq 2500. Reads were aligned to UCSC mm10 with Tophat v.2.1.166, using gene models from Ensembl 80. Read counts per gene were obtained with HTSeq-count v.0.6.0.67 Analysis was done in R with the EdgeR package68 using default methods. Significantly changed genes were determined at a false discovery rate <10−3 and fold change exceeding ±1.5. Gene ontology analysis was generated using significantly changed genes by Metascape (www.metascape.org).
ChIP and ChIP-qPCR.
The Ctnnb1-3xFlag mouse ES cell line was provided by A. McMahon (University of Southern California) and routinely passaged and maintained on irradiated MEF feeders in conventional ES cell medium supplemented with 200 mg ml−1 G418 and 200 mg ml−1 hygromycin B. Cells were adapted and expanded to serum-free 2i culture for experiments. For serum-free 2i culture, ES cells were cultured without serum in N2B27 medium (neurobasal medium (Invitrogen 21103-049), DMEM/F12 (Invitrogen 10565-018), 0.5× N2 (Invitrogen 17502-048), 0.5× B27 (Invitrogen 17504044), 1× β-mercaptoethanol (Millipore ES-007-E), 2 mM l-glutamine (Invitrogen 25030081), 100 mM nonessential amino acids (SCT 07600), 0.033% BSA (Invitrogen 15260037), 3 mM Chiron (Tocris 4423) and 1 mM PD03 (SCT72184).
A total of 2 × 10⁷ ES cells were used per ChIP assay. Cells were washed with 1x PBS, cross-linked with 1% paraformaldehyde for 10 min at room temperature and quenched with 1 ml 2.5 M glycine. Cells were washed with cold PBS three times and resuspended in 300 ml lysis buffer (15 mM HEPES at pH 7.5, 140 mM NaCl, 1 mM EDTA, 0.5 mM EGTA, 1% Triton X100, 0.1% sodium deoxycholate, 1% SDS and 0.5% N-lauroylsarcosine). The cell suspension was sonicated in Bioruptor Pico sonication device with a 30 s on and 30 s off cycle for 16 cycles followed by centrifugation at maximum speed for 10 min. The supernatant was saved and mixed with antibody-coated protein G dynabeads (Invitrogen 10003D) at a ratio of 5 ml per 1 mg antibody for immunoprecipitation overnight at 4 °C. The next day, the protein G dynabeads were washed with 800 ml RIPA buffer three times (50 mM HEPES at pH 7.5, 1 mM EDTA, 0.7% sodium deoxycholate, 1% IGEPAL CA-630 and 0.5 M LiCl). Each wash lasted 30 s. Elution buffer (150 ml) and 150 ml 1x TE buffer (Invitrogen 12090015) were mixed with the dynabeads for 30 min at 65 °C. After the elution, 4 ml RNase A(10 mg ml−1) was then added to the beads and incubated at 37 °C for 2 h, after which 2 ml protease K (Invitrogen, 20 mg ml−1) was added and the beads were incubated at 55 °C for 2 h. After the RNase A and protease K treatment, the beads were incubated at 55 °C overnight for decross-linking. The next day, the DNA on beads was extracted by 300 ml phenol:chloroform:isoamyl alcohol (25:24:1) with centrifugation at 12,000 rpm for 5 min at room temperature. The supernatant was transferred to a new 1.5 ml tube with 12 ml of 5 M NaCl and 2 ml glycogen (20 mg ml−1). The DNA was precipitated by 750 ml cold 100% ethanol with at least 30 min incubation at −80 °C. The sample was centrifuged for 30 min at 4 °C at maximum speed and the ethanol was decanted. The pellet was washed with 800 ml cold 70% ethanol, centrifuged and air dried. The DNA was resuspended in 55 ml nuclease-free water.
ChIP-qPCR (ChIP with quantitative PCR) was performed with Fast SYBR Green Master Mix (Thermo Fisher Scientific 4385612) and analysed with the Student’s t-test.
ATAC-seq.
Two replicates were pooled from 8–10 mice for blast and vehicle-treated samples. LSCs from low-dose DXR-treated mice required 20 mice pooled together; reservoir random sampling was used to generate pseudoreplicates due to the large biological sample number and high data quality (see Supplementary Information for ATAC-seq quality control report and Extended Data Fig. 4d for additional examples). ATAC-seq was performed as described previously69. In brief, 30,000 FACS-sorted blast cells were washed using 50 μl cold 1× PBS and centrifuged at 500g for 5 min in a pre-chilled (4 °C) fixed-angle centrifuge. Cells were lysed using cold lysis buffer (10 mM Tris-HCl, pH 7.4, 10 mM NaCl, 3 mM MgCl2 and 0.1% IGEPAL CA-630). Following the lysis, the pellet was resuspended in the transposase reaction mix and incubated for 30 min at 37 °C. The sample was then purified using a Qiagen MinElute kit. After purification, library fragments were amplified using 1× NEBnext PCR master mix and 1.25 μM of custom Nextera PCR primers.
Primers used were: Ad1noMX, AATGATACGGCGACCACCGAGATCTACACTCGTCGGCAGCGTCAGATGTG; Ad2.1, TAAGGCGACAAGCAGAAGACGGCATACGAGATTCGCCTTAGTCTCGTGGGCTCGGAGATGT; Ad2.2, CGTACTAGCAAGCAGAAGACGGCATACGAGATCTAGTACGGTCTCGTGGGCTCGGAGATGT; Ad2.3, AGGCAGAACAAGCAGAAGACGGCATACGAGATTTCTGCCTGTCTCGTGGGCTCGGAGATGT; and Ad2.4, TCCTGAGCCAAGCAGAAGACGGCATACGAGATGCTCAGGAGTCTCGTGGGCTCGGAGATGT.
The library was size-selected with BluePippin DNA Size Selection kit with 1.5% Agarose Gel Cassette. To prepare the 15,000-LSC cell library, we modified the protocol. LSCs from multiple mice were FACS-sorted and pooled. Cells resuspended in 1 ml of cold ATAC-seq resuspension buffer (RSB; 10 mM Tris-HCl pH 7.4, 10 mM NaCl and 3 mM MgCl2 in water) and centrifuged at 500g for 5 min. After centrifugation, 900 μl of supernatant was removed in two pipetting steps and the remaining 100 μl of supernatant was carefully aspirated by pipetting with a P200 pipette tip to avoid the cell pellet. Cell pellets were then lysed in 50 μl of RSB containing 0.1% NP40, 0.1% Tween-20 and 0.01% digitonin for 3 min. After lysis, nuclei were washed with 1 ml of RSB containing 0.1% Tween-20 (without NP40 or digitonin) followed by centrifugation for 10 min at 500g. The nuclei were resuspended in 50 μl of transposition mix (25 μl 2× TD (Tagment DNA) buffer, 2.5 μl transposase, 16.5 μl PBS, 0.5 μl 1% digitonin, 0.5 μl 10% Tween-20 and 5 μl water. Transposition reactions were incubated at 37 °C for 30 min.
Patient-derived xenografts.
All patient samples were obtained with research ethics board approval and informed consent. Paediatric patient bone marrow was transplanted into NSG mice. When primary-transplant mice succumbed to leukaemia, their bone marrow was collected, frozen for later use and transplanted into a larger set of secondary NSG recipients. Two weeks after transplant, secondary recipients were treated once per week with vehicle or low-dose nanoDXR (week 1) and maintenance low-dose nanoDXR (weeks 2–10). NSG mice were irradiated with 3.25 Gy on the day of transplantation. Recipients were placed on Baytril water 3 d before irradiation, which was maintained thereafter. Health was monitored independently by technicians blinded to any hypothetical outcome. Cells were frozen in liquid N2 using 10% DMSO, 50% FBS and 40% PBS.
Statistics and reproducibility.
Data are expressed as mean ± s.d. Pairwise comparisons were performed using Student’s t-test. Log-rank (Mantel-Cox) test was used for Kaplan–Meier survival.
Statistical significance was defined as P < 0.05.
Reporting Summary.
Further information on research design is available in the Nature Research Reporting Summary linked to this article.
Extended Data
Extended Data Fig. 1 ∣. HTS screening and in vitro analysis shows DXR preferentially inhibits LSC expansion.
a, Flow chart showing HTS design. b, Vector designs for cells expressing Akt and β-catenin and TCF reporter activity. c, FRET verification between Akt and β-catenin. While FRET was observed in mCherry-β-catenin + EGFP-AKT transfected cells and could be inhibited by DXR, essentially no discernible FRET occurred when mCherry-β-catenin was transfected with EGFP alone (see also Fig. 2h-i). Two biologically independent experiments with n=62, 19, 27, and 36 independent cells for vehicle, [Low] DXR, and vehicle (negative), [Low]DXR (negative), respectively; mean ± SD is indicated. d-e, BM isolated from leukemic Pten:β-catAct mice at 8 wpi was cultured in HSC expansion media (see Methods). Doxorubicin (white), 103506 (light grey), and thioguanosine (dark grey) were added to 11, 33 or 100 nM and cultured for 72 hours and analyzed by flow cytometry for LSCs (d) and HSPCs (e) as in Fig. 1. Fold change before and after culture for each population is indicated relative to equivalent vehicle control concentrations. n=3 biologically independent replicates for each condition; mean ± SEM is indicated. Statistics determined by unpaired two-tailed t-test.
Extended Data Fig. 2 ∣. Schematic representation of experimental setup and treatment scheme for leukemic mice.
See Methods for additional detail.
Extended Data Fig. 3 ∣. Low-dose DXR inhibits downstream Wnt signaling.
a, Heatmap of Hallmark MYC target genes (V1) up and downregulated in HSPCs and LSCs treated with vehicle and LSCs treated with low-dose DXR. Data from two biological replicates of each, differing by <0.3 standard deviations, are shown. b, c, Gene ontology enrichment analysis using −log10 of the uncorrected p value as x axis. The upregulated or downregulated enriched terms are shown in red or blue, respectively. Numbers correspond to the same term upregulated in b but downregulated in c. b, Upregulated terms in LSCs vs. HSPCs in leukemic mice (treated only with vehicle control). c, Downregulated terms in LSCs from low-dose DXR vs. vehicle control treated leukemic mice. n=2 biologically independent replicates for each (see Methods). d, TCF/Lef:H2B-GFP mice were stained with CD3 and c-Kit and analyzed by FACS. Percent of TCF/Lef:H2B-GFP+ cells for each population are indicated. Mean of n=2 biologically independent replicates for each is indicated. e, TCF/Lef:H2B-GFP mice were treated with vehicle or low-dose nanoDXR and analyzed by FACS at 3 hours post-injection for TCF/Lef:H2B-GFP+ cells. n=5 biologically independent replicates for each condition; mean ± SD is indicated. Statistics determined by unpaired two-tailed t-test. f, Representative FACS plots for data quantified in (e) and including untreated, TCF/Lef:H2B-GFP negative littermate control analysis. n=4,5, and 5 biologically independent replicates as indicated; mean ± SD is indicated. Statistics determined by unpaired two-tailed t-test.
Extended Data Fig. 4 ∣. β-catenin binds multiple immune checkpoint gene loci; low-dose DXR has differential effects on IC genes in LSCs and blast cells.
a, CHIP-seq was performed on 2×10⁷ cells from the β-catenin-3xFlag mouse ES cell line. Genome browser view of β-catenin binding density at the Pdcd1 (Pd-1), Havcr2 (Tim-3), Cd24a, and Ctla4 gene loci promoter regions and/or intergenic regions. b, ATAC-seq was used to show chromatin accessibility profiles of Wnt target genes observed in blast cells (~30k cells per replicate) and leukemic stem cells (~15k cells per replicate). c, Accessibility profiles of immuno-checkpoint genes observed by ATAC-seq in blast cells (~30k cells per replicate) and LSCs (~15k cells per replicate). Cells were sorted from BM pooled from 20 leukemia mice treated with low-dose DXR and 8 leukemia mice treated with vehicle control (b-c). Experiment was repeated 1 time with similar results.
Extended Data Fig. 5 ∣. Single-dose DXR-loaded nanoparticles substitute for multiple doses of free DXR in reducing LSCs. [Low]NanoDXR treatment reduces functional LSCs in vivo.
a, b, Leukemic mice established as described in Extended Data. 2 were treated with 5 daily injections of free DXR at 0.5 or 0.15 μg/g with and without chemotherapy. Alternatively, a single injection on day 1 of 0.8 or 2.5 μg/g of DXR-loaded nanoparticles (NanoDXR) was given with and without chemotherapy. At 10 days post-treatment, BM was analyzed by flow cytometry to determine frequency of LSCs (a) and HSPCs (b). n=6,10,3,6,10,6,3 (a) and n=6,10,8,6,10,6,3 (b) (left to right, respectively) biologically independent replicates for each condition; mean ± SEM is indicated. Note that 5 doses of 0.15 μg/g DXR is ineffective; however, a single NanoDXR injection with a similar cumulative dose (0.8 μg/g) is most effective at reducing LSCs while allowing for HSPC recovery. c-d, Cohorts of leukemic mice were prepared and treated as in Figure S2 but with low-dose NanoDXR. At 12 days post-treatment, BM was harvested from treated mice and transplanted into sub-lethally irradiated NSG recipients. c, Treatment schematic and Kaplan-Meier curves of recipient mice. The free low-dose DXR treatment group (solid line) from Fig. 5f is shown for comparison (n = 30 per group). d, Recipients of BM from low-dose DXR and low-dose NanoDXR treated leukemic mice were analyzed by flow cytometry at 6 months post-transplant for Blast cells, HSPCs and LSCs. n=27 (free_ and 24 (nano) biologically independent replicates; mean ± SD is indicated. Statistics determined by unpaired two-tailed t-test.
Extended Data Fig. 6 ∣. Low-dose DXR treatment reduces leukemia-initiating activity only in human leukemia exhibiting chemoresistant pS552-p-cat+ LSCs.
a, b, Summary of pediatric leukemia patients analyzed by FACS for LSCs and pS552-β-cat+ LSCs. B- and T-lymphoid LSCs were identified as enriched in CD45+ CD34+ CD19+ and CD45+ c-Kit+ CD3+ cells, respectively. BM samples at diagnosis and at day 29 post-chemotherapy treatment. Pt samples 019 and 034, B and T-lymphoid leukemias exhibiting chemoresistant pS552-β-cat+ LSCs, were subjected to further in vivo treatment and analysis. Pt 024 and 031, B and T-lymphoid acute leukemias lacking chemoresistant pS552-β-cat+ LSCs, were also tested. c, Experimental schematic of establishment and treatment of patient-derived xenografts (PDX) (see Methods). d, e, Kaplan-Meier survival curve of 1° PDX recipients of diagnostic and post-chemotherapy BM from Pt 019 (d) and Pt 034 (e). n=3 biologically independent replicates each. f, g, Kaplan-Meier survival curve for 2° PDX recipients treated with vehicle or low-dose nanoDXR. BM from 1° recipients of diagnostic (d) or post-chemotherapy (e) was transplanted into 2° PDX recipients and treated with low-dose NanoDXR 14 days post-transplant. h, i, FACs analysis of 2° PDX recipient BM from (f-g). Human CD45+ and human LSC engraftment was determined after succumbing to leukemia or at experimental endpoint. n=10 (each, h) and n=10 and 9 (vehicle and low-dose NanoDXR, respectively, i) biologically independent replicates; mean ± SEM is indicated. Statistics determined by unpaired two-tailed t-test. j–o, Similar analysis to D-I but of patient-derived xenografts (PDX) from Pt 024 and Pt 031, which lack chemoresistant pS552-β-cat+ LSCs. n=3 biologically independent replicates each (j-k). n = biologically independent replicates as indicated (f, g, l, m). n=9,10 (vehicle and low-dose NanoDXR, respectively, n) and n=10,9 (vehicle and low-dose NanoDXR, respectively, o) biologically independent replicates; mean ± SEM is indicated. Statistics determined by unpaired two-tailed t-test. (N.S. = not significant). Statistics determined by Log-rank (Mantel-Cox) test for survival curves.
Extended Data Fig. 7 ∣. Low-dose Daunorubicin performs similarly to Low-dose Doxorubicin.
a, b, Daunorubicin (DNR) dose-response and FACs analysis of LSC, HSPC and Blast Cell frequency in leukemic mice treated with chemotherapy with either low-dose DXR or low-dose DNR. Experiment was repeated 1 time with similar results (a). n=5 biologically independent replicates for each; mean ± SD is indicated. Statistics determined by unpaired two-tailed t-test.
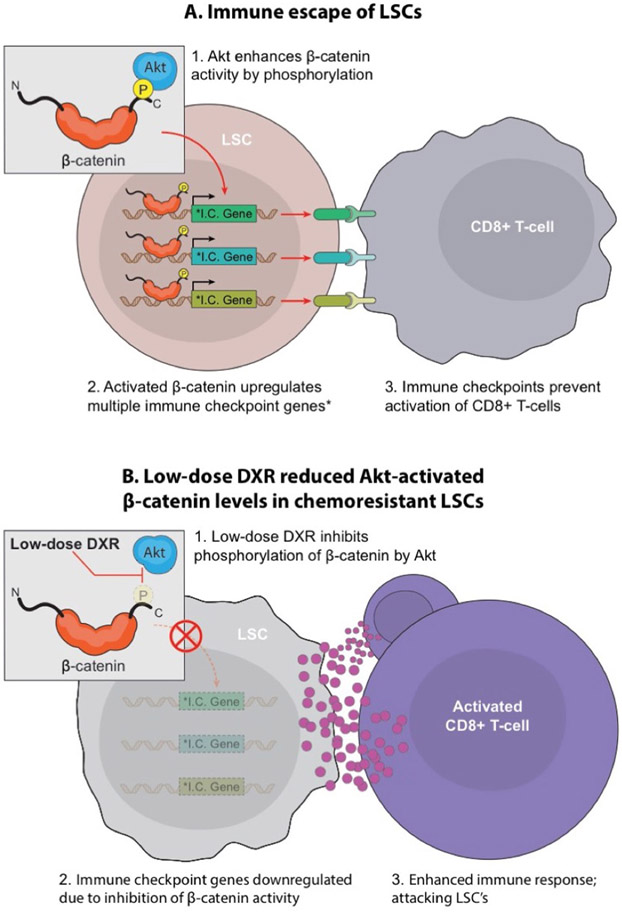
Extended Data Fig. 8 ∣. Targeting Akt-activated β-catenin dependent immune escape in LSCs.
The cooperative role of the Wnt/β-catenin and PI3K/Akt pathway in resistance to anti-cancer therapies, including immune escape, made the Pten:β-catAct double mutant mice served as an ideal model to study cancer therapy resistance. We found that cooperative Akt:β-catenin signaling is particularly critical for therapy-resistant LSCs. a, Investigating the mechanism underlying this resistance, we unexpectedly found that Akt-activated β-catenin binds to multiple IC genes, which are expressed on LSCs. b, In identifying DXR as an inhibitor of Akt:β-catenin interaction at low doses, we found that DXR could be repurposed as a targeted therapy for resistant LSCs, in part by inhibiting multiple ICs, particularly PD-1/PD-L1. Notably, LSCs but not blast cells exhibit unique properties of immune resistance, which can be reduced with low-dose DXR.
Supplementary Material
Acknowledgements
We thank H. Marshall, K. Zapien, J. McCann, S. Billinger, J. Haug, A. Box, C. Semerad, J. Park, L. Blunk, S. Chen, T. Parmely, A. Peak, K. Hall, B. Slaughter and J. Unruh for technical support; K. Tannen for proofreading and editing; H. Wu for providing Pten conditional-mutant mice; J. Goethert for providing HSC-SCL-Cre-ERT mice; M. Taketo for providing the conditional β-catAct mutants; and A. McMahon for providing FLAG: β-catenin ES cells. D. Xu is supported by NIH (R01 GM100701). The synthesis and characterization of polymers for NanoDXR was partly supported by a grant from the National Science Foundation NSF CAREER Award to R.M.K. (DMR-0748398) and ACS PRF 5247200 to R.M.K., managed by the American Chemical Society. The NanoDXR preparation was supported by the Academic Plan Grant from the University of Connecticut. We acknowledge support from the University of Kansas Cancer Center’s Biospecimen Repository Core Facility staff for helping obtain human specimens and the University of Kansas Cancer Center’s Cancer Center Support Grant (P30 CA168524). Research reported in this publication was supported by Stowers Institute for Medical Research, Children’s Mercy Kansas City, Braden’s Hope for Childhood Cancer, the Leukemia and Lymphoma Society (LLS), Kansas Bioscience Authority, Hall Family Foundation and the University of Kansas Cancer Center (KUCC) National Cancer Institute Cancer Center Support Grant (NCI-CCSG) P30 CA168524 and used the KUCC Lead Development and Optimization Shared Resource.
Footnotes
Competing interests
The authors declare no competing interests.
Extended data is available for this paper at https://doi.org/10.1038/s41556-020-0507-y.
Supplementary information is available for this paper at https://doi.org/10.1038/s41556-020-0507-y.
Publisher’s note Springer Nature remains neutral with regard to jurisdictional claims in published maps and institutional affiliations.
Data availability
ChIP–seq, RNA-seq and ATAC-seq data that support the findings of this study have been deposited in the Gene Expression Omnibus under accession code GSE105049. Original data underlying this manuscript can be accessed from the Stowers Original Data Repository at http://www.stowers.org/research/publications/LIBPB-791. Source data for Figs. 1-6 and Extended Data Figs. 1, 3 and 5-7 are presented with the paper. All other data supporting the findings of this study are available from the corresponding author on reasonable request.
References
- 1.Kuttesch JF Jr. Multidrug resistance in pediatric oncology. Invest. New Drugs 14, 55–67 (1996). [DOI] [PubMed] [Google Scholar]
- 2.Greaves M & Maley CC Clonal evolution in cancer. Nature 481, 306–313 (2012). [DOI] [PMC free article] [PubMed] [Google Scholar]
- 3.Kreso A & Dick JE Evolution of the cancer stem cell model. Cell Stem Cell 14, 275–291 (2014). [DOI] [PubMed] [Google Scholar]
- 4.Dick JE Stem cell concepts renew cancer research. Blood 112, 4793–4807 (2008). [DOI] [PubMed] [Google Scholar]
- 5.Eppert K et al. Stem cell gene expression programs influence clinical outcome in human leukemia. Nat. Med 17, 1086–1093 (2011). [DOI] [PubMed] [Google Scholar]
- 6.Greaves M Darwinian medicine: a case for cancer. Nat. Rev. Cancer 7, 213–221 (2007). [DOI] [PubMed] [Google Scholar]
- 7.Greaves M Cancer stem cells renew their impact. Nat. Med 17, 1046–1048 (2011). [DOI] [PubMed] [Google Scholar]
- 8.Ding L et al. Clonal evolution in relapsed acute myeloid leukaemia revealed by whole-genome sequencing. Nature 481, 506–510 (2012). [DOI] [PMC free article] [PubMed] [Google Scholar]
- 9.Hanahan D & Weinberg RA Hallmarks of cancer: the next generation. Cell. 144, 646–674 (2011). [DOI] [PubMed] [Google Scholar]
- 10.Holohan C, Van Schaeybroeck S, Longley DB & Johnston PG Cancer drug resistance: an evolving paradigm. Nat. Rev. Cancer 13, 714–726 (2013). [DOI] [PubMed] [Google Scholar]
- 11.Peng W et al. Loss of PTEN promotes resistance to T cell-mediated immunotherapy. Cancer Discov. 6, 202–216 (2016). [DOI] [PMC free article] [PubMed] [Google Scholar]
- 12.Fruman DA et al. The PI3K pathway in human disease. Cell 170, 605–635 (2017). [DOI] [PMC free article] [PubMed] [Google Scholar]
- 13.Cully M, You H, Levine AJ & Mak TW Beyond PTEN mutations: the PI3K pathway as an integrator of multiple inputs during tumorigenesis. Nat. Rev. Cancer 6, 184–192 (2006). [DOI] [PubMed] [Google Scholar]
- 14.Koren S & Bentires-Alj M Tackling resistance to PI3K inhibition by targeting the epigenome. Cancer Cell 31, 616–618 (2017). [DOI] [PubMed] [Google Scholar]
- 15.Gutierrez A et al. High frequency of PTEN, PI3K, and AKT abnormalities in T-cell acute lymphoblastic leukemia. Blood 114, 647–650 (2009). [DOI] [PMC free article] [PubMed] [Google Scholar]
- 16.Hogan LE et al. Integrated genomic analysis of relapsed childhood acute lymphoblastic leukemia reveals therapeutic strategies. Blood 118, 5218–5226 (2011). [DOI] [PMC free article] [PubMed] [Google Scholar]
- 17.Bhatla T et al. Epigenetic reprogramming reverses the relapse-specific gene expression signature and restores chemosensitivity in childhood B-lymphoblastic leukemia. Blood 119, 5201–5210 (2012). [DOI] [PMC free article] [PubMed] [Google Scholar]
- 18.Bolouri H et al. The molecular landscape of pediatric acute myeloid leukemia reveals recurrent structural alterations and age-specific mutational interactions. Nat. Med 24, 103–112 (2018). [DOI] [PMC free article] [PubMed] [Google Scholar]
- 19.Griffiths EA et al. Acute myeloid leukemia is characterized by Wnt pathway inhibitor promoter hypermethylation. Leuk. Lymphoma 51, 1711–1719 (2010). [DOI] [PMC free article] [PubMed] [Google Scholar]
- 20.Dandekar S et al. Wnt inhibition leads to improved chemosensitivity in paediatric acute lymphoblastic leukaemia. Br. J. Haematol 167, 87–99 (2014). [DOI] [PMC free article] [PubMed] [Google Scholar]
- 21.Kandoth C et al. Mutational landscape and significance across 12 major cancer types. Nature 502, 333–339 (2013). [DOI] [PMC free article] [PubMed] [Google Scholar]
- 22.Huang J, Nguyen-McCarty M, Hexner EO, Danet-Desnoyers G & Klein PS Maintenance of hematopoietic stem cells through regulation of Wnt and mTOR pathways. Nat. Med 18, 1778–1785 (2012). [DOI] [PMC free article] [PubMed] [Google Scholar]
- 23.Korkaya H et al. Regulation of mammary stem/progenitor cells by PTEN/Akt/β-catenin signaling. PLoS Biol. 7, e1000121 (2009). [DOI] [PMC free article] [PubMed] [Google Scholar]
- 24.Huang J et al. Pivotal role for glycogen synthase kinase-3 in hematopoietic stem cell homeostasis in mice. J. Clin. Invest 119, 3519–3529 (2009). [DOI] [PMC free article] [PubMed] [Google Scholar]
- 25.Conley SJ et al. Antiangiogenic agents increase breast cancer stem cells via the generation of tumor hypoxia. Proc. Natl Acad. Sci. USA 109, 2784–2789 (2012). [DOI] [PMC free article] [PubMed] [Google Scholar]
- 26.He XC et al. PTEN-deficient intestinal stem cells initiate intestinal polyposis. Nat. Genet 39, 189–198 (2007). [DOI] [PMC free article] [PubMed] [Google Scholar]
- 27.Perry JM et al. Cooperation between both Wnt/β-catenin and PTEN/PI3K/Akt signaling promotes primitive hematopoietic stem cell self-renewal and expansion. Genes Dev. 25, 1928–1942 (2011). [DOI] [PMC free article] [PubMed] [Google Scholar]
- 28.Knapp DJ et al. Distinct signaling programs control human hematopoietic stem cell survival and proliferation. Blood 129, 307–318 (2017). [DOI] [PMC free article] [PubMed] [Google Scholar]
- 29.Fruman DA & Rommel C PI3K and cancer: lessons, challenges and opportunities. Nat. Rev. Drug Discovery 13, 140–156 (2014). [DOI] [PMC free article] [PubMed] [Google Scholar]
- 30.Zhou H et al. Combined inhibition of β-catenin and Bcr-Abl synergistically targets tyrosine kinase inhibitor-resistant blast crisis chronic myeloid leukemia blasts and progenitors in vitro and in vivo. Leukemia 31, 2065–2074 (2017). [DOI] [PMC free article] [PubMed] [Google Scholar]
- 31.Tenbaum SP et al. β-catenin confers resistance to PI3K and AKT inhibitors and subverts FOXO3a to promote metastasis in colon cancer. Nat. Med 18, 892–901 (2012). [DOI] [PubMed] [Google Scholar]
- 32.Guo W et al. Multi-genetic events collaboratively contribute to Pten-null leukaemia stem-cell formation. Nature 453, 529–533 (2008). [DOI] [PMC free article] [PubMed] [Google Scholar]
- 33.Roderick JE et al. c-Myc inhibition prevents leukemia initiation in mice and impairs the growth of relapsed and induction failure pediatric T-ALL cells. Blood 123, 1040–1050 (2014). [DOI] [PMC free article] [PubMed] [Google Scholar]
- 34.Schubbert S et al. Targeting the MYC and PI3K pathways eliminates leukemia-initiating cells in T-cell acute lymphoblastic leukemia. Cancer Res. 74, 7048–7059 (2014). [DOI] [PMC free article] [PubMed] [Google Scholar]
- 35.Huang W, Chang HY, Fei T, Wu H & Chen YG GSK3β mediates suppression of cyclin D2 expression by tumor suppressor PTEN. Oncogene 26, 2471–2482 (2007). [DOI] [PubMed] [Google Scholar]
- 36.Lechman ER et al. Attenuation of miR-126 activity expands HSC in vivo without exhaustion. Cell Stem Cell 11, 799–811 (2012). [DOI] [PMC free article] [PubMed] [Google Scholar]
- 37.Xu C et al. beta-Catenin/POU5F1/SOX2 transcription factor complex mediates IGF-I receptor signaling and predicts poor prognosis in lung adenocarcinoma. Cancer Res. 73, 3181–3189 (2013). [DOI] [PubMed] [Google Scholar]
- 38.Levine DA & The Cancer Genome Atlas Research Network,. Integrated genomic characterization of endometrial carcinoma. Nature 497, 67–73 (2013). [DOI] [PMC free article] [PubMed] [Google Scholar]
- 39.Kaveri D et al. β-Catenin activation synergizes with Pten loss and Myc overexpression in Notch-independent T-ALL. Blood 122, 694–704 (2013). [DOI] [PubMed] [Google Scholar]
- 40.Al-Dhfyan A, Alhoshani A & Korashy HM Aryl hydrocarbon receptor/cytochrome P450 1A1 pathway mediates breast cancer stem cells expansion through PTEN inhibition and β-Catenin and Akt activation. Mol. Cancer 16, 14 (2017). [DOI] [PMC free article] [PubMed] [Google Scholar]
- 41.Lee G et al. Phosphoinositide 3-kinase signaling mediates β-catenin activation in intestinal epithelial stem and progenitor cells in colitis. Gastroenterology 139, 869–881 (2010). 881 e861-869. [DOI] [PMC free article] [PubMed] [Google Scholar]
- 42.Sharma P, Hu-Lieskovan S, Wargo JA & Ribas A Primary, adaptive, and acquired resistance to cancer immunotherapy. Cell 168, 707–723 (2017). [DOI] [PMC free article] [PubMed] [Google Scholar]
- 43.Spranger S, Bao R & Gajewski TF Melanoma-intrinsic β-catenin signalling prevents anti-tumour immunity. Nature 523, 231–235 (2015). [DOI] [PubMed] [Google Scholar]
- 44.Spranger S & Gajewski TF Impact of oncogenic pathways on evasion of antitumour immune responses. Nat. Rev. Cancer 18, 139–147 (2018). [DOI] [PMC free article] [PubMed] [Google Scholar]
- 45.Galluzzi L, Buque A, Kepp O, Zitvogel L & Kroemer G Immunological effects of conventional chemotherapy and targeted anticancer agents. Cancer Cell 28, 690–714 (2015). [DOI] [PubMed] [Google Scholar]
- 46.Gothert JR et al. In vivo fate-tracing studies using the Scl stem cell enhancer: embryonic hematopoietic stem cells significantly contribute to adult hematopoiesis. Blood 105, 2724–2732 (2005). [DOI] [PubMed] [Google Scholar]
- 47.Ciraolo E, Morello F & Hirsch E Present and future of PI3K pathway inhibition in cancer: perspectives and limitations. Curr. Med. Chem 18, 2674–2685 (2011). [DOI] [PubMed] [Google Scholar]
- 48.Casares N et al. Caspase-dependent immunogenicity of doxorubicin-induced tumor cell death. J. Exp. Med 202, 1691–1701 (2005). [DOI] [PMC free article] [PubMed] [Google Scholar]
- 49.Hsu JM et al. STT3-dependent PD-L1 accumulation on cancer stem cells promotes immune evasion. Nat. Commun 9, 1908 (2018). [DOI] [PMC free article] [PubMed] [Google Scholar]
- 50.Malta TM et al. Machine learning identifies stemness features associated with oncogenic dedifferentiation. Cell 173, 338–354 e315 (2018). [DOI] [PMC free article] [PubMed] [Google Scholar]
- 51.Jinesh GG, Manyam GC, Mmeje CO, Baggerly KA & Kamat AM Surface PD-L1, E-cadherin, CD24, and VEGFR2 as markers of epithelial cancer stem cells associated with rapid tumorigenesis. Sci. Rep 7, 9602 (2017). [DOI] [PMC free article] [PubMed] [Google Scholar]
- 52.Chen GY, Tang J, Zheng P & Liu Y CD24 and Siglec-10 selectively repress tissue damage-induced immune responses. Science 323, 1722–1725 (2009). [DOI] [PMC free article] [PubMed] [Google Scholar]
- 53.Hong D et al. Initiating and cancer-propagating cells in TEL-AML1-associated childhood leukemia. Science 319, 336–339 (2008). [DOI] [PubMed] [Google Scholar]
- 54.Castor A et al. Distinct patterns of hematopoietic stem cell involvement in acute lymphoblastic leukemia. Nat. Med 11, 630–637 (2005). [DOI] [PubMed] [Google Scholar]
- 55.Kong Y et al. CD34+CD38+CD19+ as well as CD34+CD38−CD19+ cells are leukemia-initiating cells with self-renewal capacity in human B-precursor ALL. Leukemia 22, 1207–1213 (2008). [DOI] [PubMed] [Google Scholar]
- 56.Wilson K et al. Flow minimal residual disease monitoring of candidate leukemic stem cells defined by the immunophenotype, CD34+CD38lowCD19+ in B-lineage childhood acute lymphoblastic leukemia. Haematologica 95, 679–683 (2010). [DOI] [PMC free article] [PubMed] [Google Scholar]
- 57.Eguchi M, Eguchi-Ishimae M & Ishii E Recent progress in leukemic stem cell research for childhood leukemia. Rinsho Ketsueki 56, 1871–1881 (2015). [DOI] [PubMed] [Google Scholar]
- 58.Kikushige Y et al. TIM-3 is a promising target to selectively kill acute myeloid leukemia stem cells. Cell Stem Cell 7, 708–717 (2010). [DOI] [PubMed] [Google Scholar]
- 59.Jan M et al. Prospective separation of normal and leukemic stem cells based on differential expression of TIM3, a human acute myeloid leukemia stem cell marker. Proc. Natl Acad. Sci. USA 108, 5009–5014 (2011). [DOI] [PMC free article] [PubMed] [Google Scholar]
- 60.Miao Y et al. Adaptive immune resistance emerges from tumor-initiating stem cells. Cell 177, 1172–1186 (2019). [DOI] [PMC free article] [PubMed] [Google Scholar]
- 61.Lesche R et al. Cre/loxP-mediated inactivation of the murine Pten tumor suppressor gene. Genesis 32, 148–149 (2002). [DOI] [PubMed] [Google Scholar]
- 62.Harada N et al. Intestinal polyposis in mice with a dominant stable mutation of the β-catenin gene. EMBO J. 18, 5931–5942 (1999). [DOI] [PMC free article] [PubMed] [Google Scholar]
- 63.Hu Y & Smyth GK ELDA: extreme limiting dilution analysis for comparing depleted and enriched populations in stem cell and other assays. J. Immunol. Methods 347, 70–78 (2009). [DOI] [PubMed] [Google Scholar]
- 64.Tran TH et al. Long circulating self-assembled nanoparticles from cholesterol-containing brush-like block copolymers for improved drug delivery to tumors. Biomacromolecules 15, 4363–4375 (2014). [DOI] [PubMed] [Google Scholar]
- 65.Freireich EJ, Gehan EA, Rall DP, Schmidt LH & Skipper HE Quantitative comparison of toxicity of anticancer agents in mouse, rat, hamster, dog, monkey, and man. Cancer Chemother. Rep. 50, 219–244 (1966). [PubMed] [Google Scholar]
- 66.Kim D et al. TopHat2: accurate alignment of transcriptomes in the presence of insertions, deletions and gene fusions. Genome Biol. 14, R36 (2013). [DOI] [PMC free article] [PubMed] [Google Scholar]
- 67.Anders S, Pyl PT & Huber W HTSeq—a Python framework to work with high-throughput sequencing data. Bioinformatics 31, 166–169 (2015). [DOI] [PMC free article] [PubMed] [Google Scholar]
- 68.Robinson MD, McCarthy DJ & Smyth GK edgeR: a Bioconductor package for differential expression analysis of digital gene expression data. Bioinformatics. 26, 139–140 (2010). [DOI] [PMC free article] [PubMed] [Google Scholar]
- 69.Buenrostro JD, Wu B, Chang HY & Greenleaf WJ ATAC-seq: A method for assaying chromatin accessibility genome-wide. Curr. Protoc. Mol. Biol 109, 21–29 (2015). [DOI] [PMC free article] [PubMed] [Google Scholar]
Associated Data
This section collects any data citations, data availability statements, or supplementary materials included in this article.
Supplementary Materials
Data Availability Statement
ChIP–seq, RNA-seq and ATAC-seq data that support the findings of this study have been deposited in the Gene Expression Omnibus under accession code GSE105049. Original data underlying this manuscript can be accessed from the Stowers Original Data Repository at http://www.stowers.org/research/publications/LIBPB-791. Source data for Figs. 1-6 and Extended Data Figs. 1, 3 and 5-7 are presented with the paper. All other data supporting the findings of this study are available from the corresponding author on reasonable request.


