

Abstract
Context
Athlete monitoring via wearable technology is often used in soccer athletes. Although researchers have tracked global outcomes across soccer seasons, little information exists on athlete loads during individual practice drills. Understanding these demands is important for athletic trainers in making decisions about return to play.
Objective
To provide descriptive information on total distance, total player load (PL), total distance per minute, and PL per minute for practice drill structures and game play by player position among female soccer athletes across a competitive season.
Design
Retrospective observational study.
Setting
National Collegiate Athletic Association Division I university.
Patients or Other Participants
A total of 32 female collegiate soccer players (age = 20 ± 1 years, height = 168.75 ± 4.28 cm).
Intervention(s)
Athletes wore a single global positioning system and triaxial accelerometer unit during all practices and games in a single soccer season. Individual practice drills were labeled by the team's strength and conditioning coach and binned into physical, technical and tactical skills and large- and small-sided competition drill structures.
Main Outcome Measure(s)
Descriptive analyses were used to assess the median total distance, total PL, total distance per minute, and PL per minute by drill structure and player position (defender, forward or striker, and midfielder) during practices and games.
Results
Large- and small-sided competition drills imposed the greatest percentage of workload across all measures for each position (approximately 20% of total practice), followed by physical drills. When comparing technical and tactical skills drills, we found that technical skills drills required athletes to cover a greater distance (approximately 17% for technical skills and 15% for tactical skills), and tactical skills drills required higher play intensity during practices across all positions (approximately 18% for technical skills and 13% for tactical skills). Defenders had the highest median PL outcomes of all positions during practices.
Conclusions
Different practice drill types imposed various levels of demands, which simulated game play, on female soccer athletes. Athletic trainers and other clinicians may use this information in formulating objective return-to-play guidelines for injured collegiate women's soccer players.
Keywords: global positioning system, load, practice athlete monitoring, rehabilitation
Key Points
Female soccer defenders experienced the highest overall demand during practices and game play.
Across all positions, simulated game play imposed the greatest load on female soccer athletes and was prescribed similarly to game play. Tactical skills drills required greater player load intensity than technical skills drills.
Athletic trainers and other health care professionals may use this information to develop more objective return-to-play guidelines and engage in dialogue with coaches and sport scientists to adjust athlete loads.
Athlete monitoring has become increasingly popular in team sport settings over the past decade. The advent of wearable sensing technology has enabled sports medicine clinicians, sports scientists, and coaches to track external-loading measures, such as total run distance and the number of high-speed movement bouts, to help inform performance outcomes.1,2 Global positioning system (GPS) and accelerometry-based monitoring have been most commonly researched in male field sports, such as rugby,1,3–5 Australian rules football,6,7 and soccer.8–11 However, less information is available regarding female athlete monitoring in team-based sports. Given that soccer is one of the most popular sports worldwide12 and the playing styles and physical demands between male and female soccer athletes are markedly different,13 it is important to gain a better understanding of the external load of female soccer athletes during sport-specific activities, particularly in the context of designing rehabilitation programs and making return-to-play assessments after injury.
Soccer, as a field sport, imposes unique physiological demands on athletes, such as the endurance required to cover ≥10 km in a single game,14 sprint speed to beat opponents to a ball during play,15 and technical and tactical skills to obtain and maintain ball possession.11 Authors16–19 of only a handful of studies have explored external-load measures using wearable technology in women's soccer players across competitive seasons; however, limited information is available on individual player demands during practices that captures the nuances of the workload demands of the sport.
The practice structure often encompasses physical conditioning goals, specific technical skill work that incorporates a soccer ball, tactical achievement-oriented drills, and both large (full-squad) and small (partial-squad) simulated competitions to prepare for game play.18,20 The 3 soccer field player positions (defense, forward or striker, and midfield) also impose different demands, as reported in season-based descriptive studies.8,14–16 Obtaining descriptive information on the external demands of practice drill structures based on position would, therefore, provide important insights into the workload imposed on athletes during specific drills.
Historically, monitoring athlete workloads has been driven by coaching and performance staffs; however, workload data can provide a wealth of information that athletic trainers (ATs) and other sports medicine clinicians can use. Researchers21 have mixed opinions on using workload data to predict injury, whereas clinicians can leverage wearable technology to devise more objective rehabilitation programs. Because of the relatively high rates of lower extremity injuries among female collegiate soccer athletes,22,23 contextualizing external-load demands for each of the common drill structures during soccer training would help inform ATs and other key stakeholders on how to use objective data to develop rehabilitation goals during return-to-play progressions after injury.24 Specifically, measurements of external demands via accelerations and decelerations that encapsulate total distances covered and athlete player loads (PLs) during bouts of activity are robust ways to quantify athlete workloads that could not be assessed without using wearable sensors during play. Although ATs, coaches, and performance specialists frequently make decisions to modify individual players' activity by drill type, no specific data on collegiate women's soccer players support modifications based on athlete demands, particularly by player position. Other sports, such as volleyball and baseball, can use more easily quantifiable workload assessments via jump and pitch counts, respectively; however, the workload demands on field-sport athletes may be more nuanced and warrant further objective assessments. Also, expanding our knowledge of female athlete workload monitoring is clearly needed, as this population has been grossly overlooked.
Athletic trainers often advise coaches and athletes during the functional component of rehabilitation to provide a stepwise progression of activity after injury. As strength improves, demands must be gradually imposed while the injury continues to heal and the connective tissue remodels. Understanding the workload during specific drills and practice components is important for ATs as they progress athletes through end-stage rehabilitation. Given that wearable sensors are capable of providing instantaneous and cumulative external-load metrics, it is possible to collect and measure substantially more data on player demands during activity and for ATs to use these data to make more informed clinical decisions as injured athletes progress toward a return to full sport participation. Therefore, the purpose of our study was to provide descriptive information on total distance, total PL, total distance per minute, and PL per minute for various drill structures by player position among National Collegiate Athletic Association (NCAA) Division I female soccer athletes across a competitive season, with the goal of informing ATs on how these data can be used in a sports medicine context.
METHODS
Design
This was a retrospective, observational study to evaluate biometric load variables in female collegiate soccer players during specific practice activities. The key metrics evaluated were total distance (m), total PL (arbitrary units [AU]), total distance per minute (m/min), and PL per minute (AU/min). Data collection and methods were approved by our institutional review board.
Participants
This study involved 32 female collegiate soccer players (age = 20 ± 1 years, height = 168.75 ± 4.28 cm) from an NCAA Division I university. Participants were classified as defenders, forwards or strikers, or midfielders by the coaching staff at the beginning of the season (Table 1). Positions within these 3 categories can vary, but these categories are consistent with those used by previous researchers8,15 in soccer studies. Goalkeepers were excluded from this study as a result of the unique nature of their position. Practices and games were monitored from preseason (August) through postseason (November). A total of 50 practices and 21 games were recorded. Our university's institutional review board deemed this study exempt due to the retrospective nature of the work and because all data were collected as part of routine athlete monitoring already occurring within the team. Individual player data were deidentified before analysis to protect participant privacy.
Table 1.
Participants' Characteristics
| Characteristic |
Defenders (n = 9) |
Midfielders (n = 17) |
Forwards or Strikers (n = 6) |
Full Squad (N = 32) |
| Age, mean ± SD, y | 20 ± 1 | 20 ± 1 | 19 ± 2 | 20 ± 1 |
| Height mean ± SD, cm | 168.49 ± 4.75 | 168.54 ± 3.70 | 169.76 ± 5.88 | 168.75 ± 4.28 |
| Year in school, No. | ||||
| Freshman | 3 | 6 | 4 | 13 |
| Sophomore | 1 | 2 | 0 | 3 |
| Red-shirt sophomore | 1 | 2 | 0 | 3 |
| Junior | 2 | 1 | 2 | 5 |
| Red-shirt junior | 1 | 2 | 0 | 3 |
| Senior | 1 | 4 | 0 | 5 |
Procedures
All players wore a GPS and triaxial accelerometer unit (OptimEye X4; Catapult Innovations, Melbourne, Australia) with sampling rates of 10 Hz and 100 Hz for games and practices, respectively. The unit was placed between the shoulder blades of each participant in a custom vest and turned on at the start of each practice session.25 Previous researchers found good accuracy and reliability for GPS units when collecting data at a 10-Hz sampling rate26 and for accelerometry when collecting data at a 100-Hz sampling rate.6 Data were extracted using OpenField software (Catapult Innovations). We selected total distance and total PL as the outcomes of interest because they are common volume-based measures of external workload in field-sport athletes. Total distance was defined as the distance covered during the complete session or a specific drill category (m). Total PL was an external-load metric that accounted for the magnitude of athlete movements during activity across all planes of motion, thereby capturing all forward, sideways, and backward movements during practice and game play. This triaxial, vector-magnitude metric is calculated as the sum of the squared instantaneous rate of change in acceleration in each of the 3 vectors (x, y, and z axes), which is then squared and divided by 100 (Equation)6:
 |
where ay is forward acceleration, ax is sideways acceleration, and az is vertical acceleration.
The PL is, therefore, a volume-based metric representative of cumulative workload. Both total distance per minute and PL per minute are intensity metrics for which the accumulated measure completed by the athlete is divided by the number of minutes the athlete participated in the drill or activity. For PL per minute, the metric gives an estimate of how much cumulative acceleration, deceleration, change of direction, and vertical displacement (using the Equation) occurred per unit of time.
We intentionally chose not to analyze the distance covered at specific velocity bands for running activities because the predetermined velocity bands in the proprietary software were derived from normative data from male athletes and were not appropriate for classifying the running velocities of the collegiate women's soccer players in this study.
Practice segments were labeled in real time by the team's strength and conditioning coach using specific drill names. For analysis, these specific drill names were then grouped into physical skills, technical skills, tactical skills, large-sided competitions, small-sided competitions, and miscellaneous categories. These categories were based on the work of earlier investigators20 in soccer. Individual sessions and institution-specific drills that did not fit in specific categories were classified as miscellaneous. Descriptions of these drill structures are presented in Table 2. Game data were captured to use as a reference point for practice volumes and intensities.
Table 2.
Drill Structure Descriptions
| Drill Structure |
Description |
Examples of Drill Names |
| Physical skills | Aerobic conditioning | Warm-up |
| Activation | ||
| Technical skills | Ball-handling work | Angled passing |
| Switch-point passing | ||
| Mannequin passing patterns | ||
| Long balls | ||
| Heading | ||
| Tactical skills | Outcome-oriented ball work | Crossing and finishing |
| Transfer boxes | ||
| Set plays | ||
| Shadow-attacking runs | ||
| Transitions | ||
| Rondos | ||
| Large-sided competitions | Simulated game play with >6 players on 1 team | 12 versus 12 |
| 11 versus 11 | ||
| 10 versus 7 | ||
| 8 versus 7 | ||
| 8 versus 3 | ||
| 7 versus 4 | ||
| Small-sided competitions | Simulated game play with ≤6 players on both teams | 6 versus 6 |
| 6 versus 2 | ||
| 5 versus 5 | ||
| 4 versus 4 | ||
| 2 versus 2 | ||
| 1 versus 1 | ||
| Miscellaneous | Team-specific drills | Individual time |
| Back-channel game | ||
| Play review |
Statistical Analysis
Given that this was a preliminary assessment of women's soccer data, we made a preemptive decision to use descriptive assessments in lieu of inferential statistics. This approach supports our primary purpose of providing ATs and other clinicians with details on practice structures for collegiate women's soccer athletes. Therefore, total distance, total PL, total distance per minute, and PL per minute were assessed by drill group and player position. Descriptive analyses were completed using Jamovi (version 1.2; The Jamovi Project, Sydney, Australia)27 with graphical analysis using both Jamovi and Tableau (version 2019.2.9; Tableau Software, LLC, Mountain View, CA). Descriptive analyses for game data by position were similarly assessed for all outcomes, and practice data were contextualized as a percentage of game-play demands. Both total distance and PL were highly skewed (>1); thus, we reported the median and interquartile range.
RESULTS
The median and interquartile range for each drill group based on position are provided in Table 3; the distribution graphs for Table 3 are presented in Figures 1 through 4. Additionally, stacked bar graphs that represent the percentage contribution of each drill group during an average practice separated by total distance, total distance per minute, total PL, and PL per minute are displayed in Figures 5 through 8, respectively. For all measures, large-sided competitive drills had the greatest percentages (≥19.81%) for each position group. Across the 3 position groups, defenders had the highest medians for all measures during an average practice session. For reference, in this cohort, midfielders had the highest medians for all measures during an average game (Figures 9A through 9D). Total distance and PL were twice as high during practices than during game play (practice total distance = 204% of game play, practice total PL = 193% of game play). Total distances for physical and tactical skills drills accounted for 22% of total game distance, whereas technical skills drills constituted 16% of game volume. Large- and small-sided competition drills were higher-volume practice components, responsible for 42% and 24% of game volume, respectively. Players exhibited PL at approximately 50% of game play for physical, technical skills, and tactical skills drills during practices, and simulated competitions nearly mimicked game play, with 92% volume for large-sided competitions and 70% for small-sided competition drills.
Table 3.
Drill-Group Descriptive Information by Position
| Drill Group and Measure |
Defenders |
Forwards and Strikers |
Midfielders |
|||||||||
| Median |
IQR |
Minimum |
Maximum |
Median |
IQR |
Minimum |
Maximum |
Median |
IQR |
Minimum |
Maximum |
|
| Physical | ||||||||||||
| Total distance, m | 660 | 494–743 | 2 | 1279 | 622 | 474–713 | 6 | 1094 | 640 | 512–707 | 11 | 1213 |
| Total distance/min | 58.5 | 51.9–65.4 | 0.2 | 132.0 | 56.0 | 48.6–62.6 | 0.4 | 136.0 | 57.3 | 50.6–64.7 | 1.0 | 85.4 |
| Player load, AU | 68.1 | 54.9–78.6 | 26.1 | 163.0 | 61.8 | 50.4–76.1 | 26.9 | 126.0 | 62.3 | 52.8–70.7 | 19.5 | 139.0 |
| Player load/min | 6.21 | 5.42–6.89 | 3.53 | 16.60 | 5.78 | 5.06–6.51 | 1.60 | 16.40 | 5.56 | 5.03–6.36 | 3.29 | 9.02 |
| Technical skills | ||||||||||||
| Total distance, m | 492 | 329–615 | 12 | 1272 | 459 | 316–580 | 3 | 1353 | 449 | 300–569 | 6 | 1433 |
| Total distance/min | 48.4 | 40.2–58.4 | 0.6 | 105.0 | 45.0 | 36.9–52.9 | 0.2 | 105.0 | 46.4 | 37.9–56.7 | 0.3 | 95.4 |
| Player load, AU | 62.2 | 40.5–78.6 | 10.8 | 193.0 | 58.4 | 37.1–77.0 | 10.2 | 188.0 | 52.5 | 35.7–73.5 | 10.8 | 159.0 |
| Player load/min | 6.11 | 5.07–6.89 | 2.33 | 16.60 | 5.64 | 4.74–6.69 | 2.07 | 13.10 | 5.41 | 4.47–6.58 | 1.97 | 9.28 |
| Tactical skills | ||||||||||||
| Total distance, m | 527 | 342–752 | 78 | 3260 | 511 | 321–743 | 78 | 3186 | 533 | 350–778 | 71 | 3508 |
| Total distance/min | 40.9 | 30.8–52.0 | 6.7 | 117.0 | 39.5 | 29.7–50.4 | 9.1 | 115.0 | 41.3 | 32.5–52.5 | 7.5 | 122.0 |
| Player load, AU | 74.9 | 37.1–83.9 | 10.1 | 312.0 | 59.0 | 35.2–82.3 | 10.2 | 335.0 | 57.2 | 37.5–80.7 | 10.2 | 310.0 |
| Player load/min | 6.16 | 3.23–6.14 | 0.90 | 10.7 | 4.45 | 3.28–5.94 | 0.95 | 11.80 | 4.48 | 4.47–5.85 | 0.80 | 11.30 |
| Large-sided competitions | ||||||||||||
| Total distance, m | 931 | 524–1418 | 285 | 4794 | 840 | 524–1416 | 242 | 4850 | 898 | 567–1430 | 316 | 5151 |
| Total distance/min | 68.8 | 45.9–78.6 | 13.5 | 104.0 | 61.3 | 45.9–77.0 | 15.9 | 102.0 | 70.6 | 57.1–82.9 | 16.8 | 107.0 |
| Player load, AU | 90.4 | 55.0–140.0 | 21.3 | 430.0 | 82.8 | 55.0–140.0 | 23.5 | 501.0 | 87.9 | 52.5–135.0 | 31.1 | 432.0 |
| Player load/min | 6.93 | 4.54–8.12 | 1.28 | 10.80 | 6.62 | 4.54–8.10 | 1.67 | 10.80 | 6.96 | 5.23–8.20 | 1.66 | 11.20 |
| Small-sided competitions | ||||||||||||
| Total distance, m | 635 | 506–833 | 160 | 2179 | 631 | 498–872 | 140 | 2202 | 606 | 460–782 | 161 | 2286 |
| Total distance/min | 52.7 | 41.3–62.2 | 23.0 | 107.0 | 52.1 | 41.1–64.1 | 22.0 | 107.0 | 50.5 | 36.8–60.8 | 22.1 | 105.0 |
| Player load, AU | 74.9 | 56.5–89.4 | 15.2 | 292.0 | 71.1 | 57.6–96.4 | 12.9 | 286.0 | 67.9 | 55.1–84.7 | 14.3 | 268.0 |
| Player load/min | 6.16 | 4.85–7.74 | 3.24 | 13.20 | 6.19 | 4.70–7.95 | 2.57 | 12.70 | 5.75 | 4.31–7.19 | 2.97 | 11.30 |
Abbreviations: AU, arbitrary unit; IQR, interquartile range.
Figure 1.

Distribution plots of total distance were based on drill type and athlete position. The distribution of total distance in an average practice was categorized by total session, drill type, and athlete position. The horizontal line in the overlaid box plot represents median values, box widths represent the first (25%) and third (75%) quantiles, and whiskers represent box quantiles ±1.5 × interquartile range. The individual dots reflect outliers in the data. The violin plot is a kernel density estimation showing the distribution shape of the data points.
Figure 4.

Distribution plots of player load per minute were based on drill type and athlete position. The distribution of player load per minute in an average practice was categorized by total session, drill type, and athlete position. The horizontal line in the overlaid box plot represents median values, box widths represent the first (25%) and third (75%) quantiles, and whiskers represent box quantiles ±1.5 × interquartile range. The individual dots reflect outliers in the data. The violin plot is a kernel density estimation showing the distribution shape of the data points. Abbreviation: AU, arbitrary units.
Figure 5.

Total distance by position. Stacked bar plots depict median total distance outcomes by drill structure for each women's soccer field position. The percentage of the session total for each drill structure is presented in the bar plot as a tooltip.
Figure 8.

Player load per minute by position. Stacked bar plots depict median player load per minute outcomes by drill structure (shades of gray) for each women's soccer field position. The percentage of the session total for each drill structure is presented in the bar plot as a tooltip. Abbreviation: AU, arbitrary units.
Figure 9.

A, Median total distance. B, total distance per minute. C, total player load. D, total player load per minute in game by position. Abbreviation: AU, arbitrary units.
Figure 2.

Distribution plots of total distance per minute were based on drill type and athlete position. The distribution of total distance per minute in an average practice was categorized by total session, drill type, and athlete position. The horizontal line in the overlaid box plot represents median values, box widths represent the first (25%) and third (75%) quantiles, and whiskers represent box quantiles ±1.5 × interquartile range. The individual dots reflect outliers in the data. The violin plot is a kernel density estimation showing the distribution shape of the data points.
Figure 3.

Distribution plots of total player load were based on drill type and athlete position. The distribution of player load in an average practice was categorized by total session, drill type, and athlete position. The horizontal line in the overlaid box plot represents median values, box widths represent the first (25%) and third (75%) quantiles, and whiskers represent box quantiles ±1.5 × interquartile range. The individual dots reflect outliers in the data. The violin plot is a kernel density estimation showing the distribution shape of the data points. Abbreviation: AU, arbitrary units.
Figure 6.
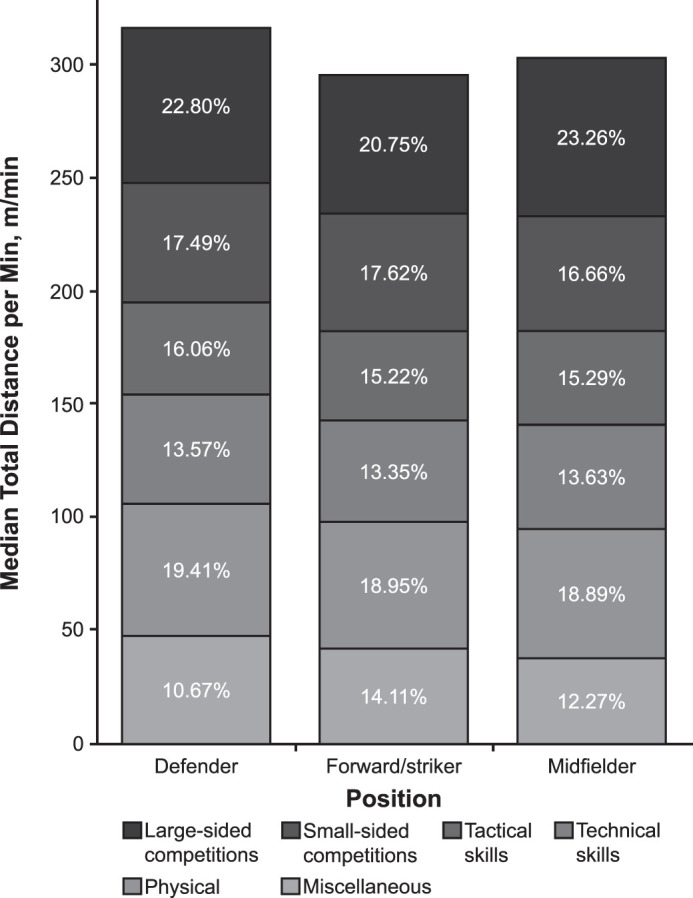
Total distance per minute by position. Stacked bar plots depict median total distance per minute outcomes by drill structure for each women's soccer field position. The percentage of the session total for each drill structure is presented in the bar plot as a tooltip.
Figure 7.

Total player load by position. Stacked bar plots depict median total player load outcomes by drill structure for each women's soccer field position. The percentage of the session total for each drill structure is presented in the bar plot as a tooltip. Abbreviation: AU, arbitrary units.
DISCUSSION
Our results highlighted several important characteristics of the drill structure and female soccer PL that sports medicine clinicians, sports scientists, and coaches may consider in future practice. Given that past athlete-monitoring investigations15–17,20,22 of women's collegiate soccer players have largely focused on cumulative practice and game data, we added valuable insights into practice-specific demands by drill structure. Clinicians may use this information to facilitate rehabilitation and return-to-play decision making, and coaches and sports scientists may consider this information with respect to training demands in female soccer athletes.
Practice and Game Session Data by Position
Descriptive assessments reflected that defenders had high median total distance, total distance per minute, total PL, and PL per minute outcomes. These outcomes were consistent with the relative median workloads during game play and, therefore, reinforce the fact that practices mimicked playing style for this team across the season. Previous assessments of game data for female soccer athletes have been mixed; some researchers observed higher demands on defenders than on players at other positions15 and others noted the highest density of loading on forwards and strikers.16,22 Our findings are likely attributable to player rotation for the team we analyzed, as defenders tended to play more minutes per game than other position players. Furthermore, these mixed results in the literature may have been influenced by the style of game play based on the level of competition and by different teams, highlighting the need to implement athlete monitoring for individual team and player insights.2 The breakdown of training demands by drill type in our study was consistent across player position, regardless of the session totals. Therefore, ATs and other key stakeholders may gain the best insights into activity modifications and return-to-play decision making by assessing the demand by drill structure rather than by assuming that some specific drills are “safer” during the gradual implementation of stress during this time.
Physical Drill Structures
Physical drills, including warm-ups and conditioning for sustained aerobic exercise, constituted approximately 20% of all external-loading metrics during practices. This is important, as physical drill distance accounted for a median of 660 m for defenders, 622 m for forwards and strikers, and 640 m for midfielders per practice (Table 3). Athletic trainers may use these data to inform alternative forms of physical conditioning for athletes recovering from overuse lower extremity injuries in order to reduce the overall load during practices while attaining similar training benefits. For example, athletes recovering from stress fractures may use other cardiovascular training equipment, such as a bicycle or elliptical machine, to warm up or complete conditioning drills. This tactic would reduce the cumulative impact load imposed on the athletes by approximately one-fifth of a regular practice while reserving the allowed total distance for the practice to be used for more soccer-specific or team-specific drills.
Technical and Tactical Skills Drill Structures
Technical and tactical skills drills both require athletes to perform activities with the soccer ball to hone in-play skills; however, the key difference is that technical work focuses more on ball handling and possession and tactical work involves a performance-oriented outcome (ie, corner kick to score or other restart scenarios for either offense or defense).22 The descriptive assessments showed that tactical skills drills had a high associated training intensity during play, as reflected in the total distance per minute and PL per minute (approximately 16%–17%), and players exhibited about 50% volume during practices relative to game play. These results are important to consider given that PL is calculated using triaxial accelerometry loading metrics and takes into account acceleration, deceleration, change of direction, and vertical displacement in the PL metrics. Tactical skills drills required high workload intensity, so these drill structures may be limited or closely monitored using wearable technology during early return to play, particularly for players with lower extremity joint injuries, such as anterior cruciate ligament tears and lateral ankle sprains, with rotational mechanisms of injury.28,29
Competition Drill Structures
Simulated game-play drill structures imposed the greatest demand on the athletes and were similar to game-play demands across all athlete monitoring outcomes, regardless of player position. Also, competition sizes were comparable with one another despite the difference in the number of athletes involved in play. This finding was somewhat surprising because, in previous evaluations of different sizes of game play, researchers30 found that smaller-sided competition drills imposed increased levels of play intensity. However, these outcomes were largely influenced by the area of play rather than the number of players participating; large-sided competition drills enable athletes to rely on teammate support and reduce the workload on individual players.30 Given the retrospective nature of this investigation, the dataset provided no information on the size of the field of play during the simulated game drill structures (ie, full versus half field). It is plausible that the area of play was modified based on the size of the competition, thereby adjusting for distance and intensity across these drill structures. Future authors should delve into simulated game-play structures to elucidate these demands on female athletes. Still, our data can be used to help inform rehabilitation progressions across a spectrum of injuries. Based on an athlete's specific phase of the return-to-sport progression during the recovery from injury, the clinician may have the athlete pursue certain parts of practice that align with the workload volume and intensity goals of the personalized rehabilitation plan. Clinicians can use these objective findings to promote dialogue with coaches and athletes in order to facilitate a safe return to play.
Miscellaneous Drill Structures and Athlete-Monitoring Considerations
As several of the drills recorded during practice were specific to the team studied, we binned a small subset of observations into a miscellaneous category to increase the external applicability of this dataset to other female soccer teams. We should, as previously discussed, incorporate athlete monitoring via wearable technology into competitive sports to make the best team- and athlete-specific decisions.2 Nevertheless, our results can be applied to clinical practice because general drill structures that uphold the principles of soccer play were assessed in these athletes.20
Clinical Implications
Historically, sports medicine clinicians and other performance specialists have largely advanced return-to-play protocols subjectively; however, the ability to measure and analyze objective workload data as injured athletes advance through rehabilitation allows for a more objective approach to designing rehabilitation programs and making return-to-sport decisions. Incorporating wearable sensors in sport activities, particularly for athletes in field-based sports that do not have obviously calculable loading outcomes (eg, pitch counts in baseball pitchers), creates opportunities for more effective workload monitoring and management. Leveraging these data can help clinicians optimize rehabilitation programs and creates the opportunity for data-informed dialogue among the key stakeholders to return athletes safely to activity after injury. Although assessing injury risk was beyond the scope of our study, accumulating more workload data on athletes during practices and games will allow future researchers to prospectively assess the relationships between external-load accumulation and injury risk.
Limitations
This dataset was based on a single season of play by a single NCAA Division I women's soccer team, so the results may not be fully generalizable to all teams or levels of play. All of the athletes studied were injury free, and loading outcomes may differ for injured soccer players. In addition, styles of coaching and play may have factored into these outcomes, and the exact session breakdown may not transfer to other settings. However, our main purpose was to obtain basic descriptive information on drill structures to provide ATs and other stakeholders with a starting point for interpreting the athletic demand on female soccer athletes during specific drills. We only assessed distance and PL metrics because other common sensor-derived outcomes, such as those using running velocity bands, were not appropriate to the female athletes assessed in this investigation. Future iterations of sensor algorithms should be tailored to female populations to increase the applicability of the outcomes to these athletes. Finally, our analyses combined data from all practices, and underlying differences among practices likely depended on when they occurred during the season and in relation to games. Further analysis of such patterns is warranted and can help clinicians design rehabilitation programs and tailor return-to-play progressions of individual athletes.
CONCLUSIONS
Overall, this descriptive analysis of female soccer athletes' workloads based on player position across practice drill structures reflected that defenders had the highest overall demand during practices. Across all positions, simulated game-play data imposed the highest load on athletes and was prescribed similarly to game play, and tactical skills drills had higher PL intensity. Athletic trainers and other health care professionals may use this information to develop more objective return-to-play guidelines and engage coaches and sports scientists in dialogue on athlete-loading adjustments.
REFERENCES
- 1.Coughlan GF, Green BS, Pook PT, Toolan E, O'Connor SP. Physical game demands in elite rugby union: a global positioning system analysis and possible implications for rehabilitation. J Orthop Sports Phys Ther. 2011;41(8):600–605. doi: 10.2519/jospt.2011.3508. [DOI] [PubMed] [Google Scholar]
- 2.Gabbett TJ, Nassis GP, Oetter E, et al. The athlete monitoring cycle: a practical guide to interpreting and applying training monitoring data. Br J Sports Med. 2017;51(20):1451–1452. doi: 10.1136/bjsports-2016-097298. [DOI] [PubMed] [Google Scholar]
- 3.Austin DJ, Kelly SJ. Positional differences in professional rugby league match play through the use of global positioning systems. J Strength Cond Res. 2013;27(1):14–19. doi: 10.1519/JSC.0b013e31824e108c. [DOI] [PubMed] [Google Scholar]
- 4.Austin DJ, Kelly SJ. Professional rugby league positional match-play analysis through the use of global positioning system. J Strength Cond Res. 2014;28(1):187–193. doi: 10.1519/JSC.0b013e318295d324. [DOI] [PubMed] [Google Scholar]
- 5.Delaney JA, Duthie GM, Thornton HR, Scott TJ, Gay D, Dascombe BJ. Acceleration-based running intensities of professional rugby league match play. Int J Sports Physiol Perform. 2016;11(6):802–809. doi: 10.1123/ijspp.2015-0424. [DOI] [PubMed] [Google Scholar]
- 6.Boyd L, Ball K, Aughey R. The reliability of MinimaxX accelerometers for measuring physical activity in Australian football. Int J Sports Physiol Perform. 2011;6(3):311–321. doi: 10.1123/ijspp.6.3.311. [DOI] [PubMed] [Google Scholar]
- 7.Gray AJ, Jenkins DG. Match analysis and the physiological demands of Australian football. Sports Med. 2010;40(4):347–360. doi: 10.2165/11531400-000000000-00000. [DOI] [PubMed] [Google Scholar]
- 8.Slater LV, Baker R, Weltman AL, Hertel J, Saliba SA, Hart JM. Activity monitoring in men's college soccer: a single season longitudinal study. Res Sports Med. 2018;26(2):178–190. doi: 10.1080/15438627.2018.1431535. [DOI] [PubMed] [Google Scholar]
- 9.Anderson L, Orme P, Di Michele R, et al. Quantification of seasonal-long physical load in soccer players with different starting status from the English Premier League: implications for maintaining squad physical fitness. Int J Sports Physiol Perform. 2016;11(8):1038–1046. doi: 10.1123/ijspp.2015-0672. [DOI] [PubMed] [Google Scholar]
- 10.Barrett S. Monitoring elite soccer players' external loads using real-time data. Int J Sports Physiol Perform. 2017;12(10):1285–1287. doi: 10.1123/ijspp.2016-0516. [DOI] [PubMed] [Google Scholar]
- 11.Casamichana D, Castellano J, Castagna C. Comparing the physical demands of friendly matches and small-sided games in semiprofessional soccer players. J Strength Cond Res. 2012;26(3):837–843. doi: 10.1519/JSC.0b013e31822a61cf. [DOI] [PubMed] [Google Scholar]
- 12.Hulteen RM, Smith JJ, Morgan PJ, et al. Global participation in sport and leisure-time physical activities: a systematic review and meta-analysis. Prev Med. 2017;95:14–25. doi: 10.1016/j.ypmed.2016.11.027. [DOI] [PubMed] [Google Scholar]
- 13.Bradley PS, Dellal A, Mohr M, Castellano J, Wilkie A. Gender differences in match performance characteristics of soccer players competing in the UEFA Champions League. Hum Mov Sci. 2014;33:159–171. doi: 10.1016/j.humov.2013.07.024. [DOI] [PubMed] [Google Scholar]
- 14.Krustrup P, Mohr M. Physical demands in competitive Ultimate Frisbee. J Strength Cond Res. 2015;29(12):3386–3391. doi: 10.1519/JSC.0000000000000989. [DOI] [PubMed] [Google Scholar]
- 15.Vescovi JD. Motion characteristics of youth women soccer matches: female athletes in motion (FAiM) study. Int J Sports Med. 2014;35(2):110–117. doi: 10.1055/s-0033-1345134. [DOI] [PubMed] [Google Scholar]
- 16.Gentles J, Coniglio C, Besemer M, Morgan J, Mahnken M. The demands of a women's college soccer season. Sports (Basel) 2018;6(1):16. doi: 10.3390/sports6010016. [DOI] [PMC free article] [PubMed] [Google Scholar]
- 17.Sausaman RW, Sams ML, Mizuguchi S, DeWeese BH, Stone MH. The physical demands of NCAA Division I women's college soccer. J Funct Morphol Kinesiol. 2019;4(4):73. doi: 10.4085/205-20. [DOI] [PMC free article] [PubMed] [Google Scholar]
- 18.Mara JK, Thompson KG, Pumpa KL, Ball NB. Periodization and physical performance in elite female soccer players. Int J Sports Physiol Perform. 2015;10(5):664–669. doi: 10.1123/ijspp.2014-0345. [DOI] [PubMed] [Google Scholar]
- 19.Meylan C, Trewin J, McKean K. Quantifying explosive actions in international women's soccer. Int J Sports Physiol Perform. 2017;12(3):310–315. doi: 10.1123/ijspp.2015-0520. [DOI] [PubMed] [Google Scholar]
- 20.Krustrup P, Mohr M, Ellingsgaard H, Bangsbo J. Physical demands during an elite female soccer game: importance of training status. Med Sci Sports Exerc. 2005;37(7):1242–1248. doi: 10.1249/01.mss.0000170062.73981.94. [DOI] [PubMed] [Google Scholar]
- 21.Kupperman N, Hertel J. Global positioning system–derived workload metrics and injury risk in team-based field sports: a systematic review. J Athl Train. 2020;55(9):931–943. doi: 10.4085/1062-6050-473-19. [DOI] [PMC free article] [PubMed] [Google Scholar]
- 22.Milanović Z, Sporiš G, James N, et al. Physiological demands, morphological characteristics, physical abilities and injuries of female soccer players. J Hum Kinet. 2017;60:77–83. doi: 10.1515/hukin-2017-0091. [DOI] [PMC free article] [PubMed] [Google Scholar]
- 23.DiStefano LJ, Dann CL, Chang CJ, et al. The first decade of web-based sports injury surveillance: descriptive epidemiology of injuries in US high school girls' soccer (2005–2006 through 2013–2014) and National Collegiate Athletic Association women's soccer (2004–2005 through 2013–2014) J Athl Train. 2018;53(9):880–892. doi: 10.4085/1062-6050-156-17. [DOI] [PMC free article] [PubMed] [Google Scholar]
- 24.Taberner M, Allen T, Cohen DD. Progressing rehabilitation after injury: consider the ‘control-chaos continuum.'. Br J Sports Med. 2019;53(18):1132–1136. doi: 10.1136/bjsports-2018-100157. [DOI] [PMC free article] [PubMed] [Google Scholar]
- 25.Harley JA, Barnes CA, Portas M, et al. Motion analysis of match-play in elite U12 to U16 age-group soccer players. J Sports Sci. 2010;28(13):1391–1397. doi: 10.1080/02640414.2010.510142. [DOI] [PubMed] [Google Scholar]
- 26.Johnston RJ, Watsford ML, Pine MJ, Spurrs RW, Murphy AJ, Pruyn EC. The validity and reliability of 5-Hz global positioning system units to measure team sport movement demands. J Strength Cond Res. 2012;26(3):758–765. doi: 10.1519/JSC.0b013e318225f161. [DOI] [PubMed] [Google Scholar]
- 27.Jamovi. Version 1.2. The Jamovi Project. Jamovi Website. 2020 https://www.jamovi.org Accessed November 13, 2020.
- 28.Kaminski TW, Hertel J, Amendola N, et al. National Athletic Trainers' Association position statement: conservative management and prevention of ankle sprains in athletes. J Athl Train. 2013;48(4):528–545. doi: 10.4085/1062-6050-48.4.02. [DOI] [PMC free article] [PubMed] [Google Scholar]
- 29.Weiss K, Whatman C. Biomechanics associated with patellofemoral pain and ACL injuries in sports. Sports Med. 2015;45(9):1325–1337. doi: 10.1007/s40279-015-0353-4. [DOI] [PubMed] [Google Scholar]
- 30.Gimenez JV, Del-Coso J, Leicht AS, Gomez MA. Comparison of the movement patterns between small- and large-sided game training and competition in professional soccer players. J Sports Med Phys Fitness. 2018;58(10):1383–1389. doi: 10.23736/S0022-4707.17.07343-1. [DOI] [PubMed] [Google Scholar]