Abstract
Objective:
To assess accuracy of and interobserver agreement on multiparametric MR findings to distinguish uterine leiomyoma (LM) from uterine leiomyosarcoma (LMS) and soft tissue tumour of unknown malignant potential.
Methods:
Inclusion criteria: All females over 18 years with least one uterine mass measuring 5 cm or more in at least one of the three standard orthogonal dimensions on MR with histopathological confirmation of LM, LMS, or soft tissue tumour of unknown malignant potential (STUMP) in the 3 months following MR. Patients with LMS were drawn from a larger cohort being assessed for MR-guided focussed ultrasound (MRgFUS) suitability. Image evaluation: Assessed variables were: lesion margin, margin definition, T2 signal homogeneity, >50% of lesion with T2 signal brighter than myometrium, haemorrhage, restricted diffusion, contrast enhancement (CE), CE pattern, local lymphadenopathy and ascites.
Results:
32 LM, 10 LMS and 1 STUMP were evaluated. Ill-defined (p-value = 0.0003–0.0004) or irregular (p = 0.003–0.004) lesion margin, T2 hyperintensity >50% (p = 0.001–0.004), and peripheral CE (p = 0.02–0.05) were significantly more common in LMS/STUMP than LM for both radiologists. 10/11 (Reader 2) and 11/11 (Reader 1) LMS/STUMP displayed restricted diffusion but so did 63–80% of LM. Agreement was greatest for margin characteristics (κ = 0.73–0.81).
Conclusion:
Irregular/ill-defined lesion margin best distinguished LMS/STUMP from LM with good interrater reliability.
Advances in knowledge:
Assessment of agreement regarding MR parameters distinguishing LM from LMS and STUMP has not previously been undertaken in a cohort including a large number of patients with LMS. This will help inform evaluation of females considering minimally invasive LM treatment.
Introduction
Uterine leiomyomas (LM) or fibroids are the most common uterine neoplasms and are present in up to 77% of females, with between 1 in 4 and 1 in 5 of these females being symptomatic.1 A recent survey of the clinical impact of LM amongst symptomatic females found that 28% of employed females missed work due to their symptoms, 79% were interested in treatments that did not involve surgery and 51% wanted to avoid hysterectomy with 43% of LM symptomatic females under 40 wanting the possibility of a future pregnancy.2 Although hysterectomy remains the commonest treatment for symptomatic LM, and continues to be the gold-standard against which other treatments are measured, less invasive treatments for symptomatic LM are being increasingly used due in part to patient-driven desire for shorter post-operative recovery, and fertility preservation.
These less-invasive techniques include uterine artery embolisation (UAE), MR-guided laser ablation or MR-guided high frequency focussed ultrasound (MRgFUS), as well as surgical myomectomy with or without power-assisted morcellation.3 In addition, medical concerns about the longer-term morbidity associated with hysterectomy, in particular increased fracture risk, cardiovascular disease, dementia, and pelvic floor prolapse, have also driven exploration of non-hysterectomy treatments for LM.4–7
Non-hysterectomy treatments for LM, including morcellation, require accurate pre-operative diagnosis of LM and in particular, distinction of it from the much rarer malignant and potentially malignant leiomyosarcoma (LMS) and soft tissue tumour of unknown malignant potential (STUMP). In 2014, the U.S. Food and Drug Administration (FDA) issued a warning against the use of morcellation devices due to the potential for dissemination of unrecognised LMS coexisting with, or misdiagnosed as, LM. This warning followed inadvertent upstaging, via peritoneal tumor dissemination, of a patient with LMS misdiagnosed as LM whose treatment included morcellation of the uterine mass, with complications from metastatic LMS ultimately resulting in her demise.8 However, there is ongoing controversy about the precise risk of unrecognised LMS in a patient with presumed LM. Pritts et al,9 through a systematic review of the literature, estimated the risk of “occult” LMS in a patient with presumed LM to be approximately 1 in 8300 surgical procedures, much lower than the FDA estimate of 1 in 498 procedures. The methodology used to derive the FDA estimate was questioned in the report of this study.
LMSs are the most common uterine sarcoma but continue to be rare, especially in relation to the prevalence of LM, accounting for 1–2% of all uterine malignancies with an annual incidence of 0.5 to 7 per 100,000 females.10 The vast majority of LMS develop de novo from myometrium or connective tissue surrounding the uterine vessels; much more rarely do they arise from LM. Suspicion of these neoplasms in females with symptoms compatible with LM (pain, menorrhagia, mass-related symptoms) may arise in the presence of clinically rapid growth and in some patients elevated serum lactate dehydrogenase (LDH). Clinical and biochemical findings alone or combined are, however, insufficiently accurate for pre-operatively discrimination of LM and LMS or STUMP.
Imaging, and in particular MRI, can help distinguish between LM and LMS and thus aid in planning treatment. Due to differences in the MR scanning techniques and parameters assessed by various studies and relative rarity of LMS at single institutions, there is continuing uncertainty regarding how best to prioritise and integrate various MR parameters with clinical and biochemical data to maximise diagnostic accuracy.11–31 There are considerable limitations to the clinical application of current literature describing MR features that distinguish LM from LMS. These include:
Analysis of multiple uterine masses in a single patient where direct pathologic–imaging correlation may be difficult and within-subject variability of the imaging features of LM potentially less than the variability occurring between subjects, leading to potential bias in reported results.27,31
Measurement of absolute values of the lowest apparent diffusion coefficient (ADC) within a heterogeneous mass, when this measure is non-standardised across scanning platforms and MR scanner field strengths.32
Small numbers of LMS and/or lack of blinded comparison of imaging characteristics of LM and LMS cases and/or lack of measurement of interobserver agreement about the imaging features that distinguish LM and LMS.23,24,27,31,33
It has become apparent, particularly in the latest studies, that a multiparametric approach to MR image evaluation, and in particular, a focus on MR correlates of necrosis, haemorrhage, and cellularity displayed on T1, T2, diffusion-weighted (DW) and contrast-enhanced (CE) images, may provide improved accuracy in distinguishing LM from LMS.21,29,30 This may improve further when combined with clinical parameters such as endometrial biopsy and serum LDH.30 Although radiomics, in the form of texture analysis,21 has been explored in one small study which demonstrated only modest accuracy in differentiating LM and LMS, use of data characterisation algorithms to extract quantitative information from MR images needs much further development and external validation.
While it is well recognised that uterine masses that demonstrate smooth sharp margins, homogeneously low T2 signal, no restricted diffusion, and no CE are incompatible with the diagnosis of LMS, and thus potentially suitable for minimally invasive treatments, LM often have atypical features that overlap with LMS, particularly in younger females, and it is these “atypical” LM that create the most difficulty in triaging patients to non-hysterectomy treatments.
At our institution (The Royal Women's Hospital in Melbourne, Australia), MRgFUS is commonly used to treat symptomatic LM in females who wish to avoid surgery and / or preserve fertility. Multiparametric MR assessment of the imaging characteristics of candidate uterine lesions is undertaken in order to assess suitability of uterine lesions for treatment and in particular to triage females with indeterminate or atypical lesions to myomectomy / hysterectomy. While some patients choose not to proceed with MRgFUS due to the nature of their symptoms and other considerations, some are considered unsuitable due to the atypical appearance of their uterine mass on MR, and concerns regarding potential malignancy. We were interested in determining whether the imaging characteristics of LM in females who did not proceed to MRgFUS, after work up with multiparametric MR, differed significantly from those of LMS and STUMP.
Purpose
To compare multiparametric MR findings for uterine LM being evaluated for suitability for MRgFUS with those of LMS and uterine soft tissue tumour or unknown malignant potential (STUMP) and to assess interobserver agreement regarding these MR findings.
Methods
This was a single institution retrospective cohort study. A waiver of the requirement for patient consent and full ethics application was provided by our institutional research ethics committee based on study methodology.
Our study cohort was assembled as follows:
Inclusion criteria
All females aged over 18 years who had
suspected uterine LM and multiparametric MRI for assessment of their suitability for MRgFUS between January 2010 and December 2018 OR a multiparametric MRI study performed for assessment of a uterine mass subsequently diagnosed as LMS or STUMP AND,
identification of at least one uterine mass measuring 5 cm or more in at least one of the three standard orthogonal dimensions on MR,
histopathological confirmation of excised LM, LMS, or STUMP within the 3 months following MR were eligible for inclusion. These patients were identified through a search of our radiology information system (RIS) and institutional pathology database.
Subjects were then excluded if there was
Performance of MRgFUS or UAE prior to surgical excision of the index mass OR
lack of certainty about correlation of a specific mass on MRI with histopathological findings when more than one uterine mass was present on MRI. For example, in a patient with a dominant mass measuring 6 cm in diameter associated with multiple other masses measuring between 1 and 2 cm in diameter on MR, if hysterectomy was performed and the histopathology report referred to the findings within multiple masses, only one of which was clearly described as being approximately 6 cm in diameter, the case was included. On the other hand, in a patient with multiple myometrial masses of similar size approximately 5 cm or more, e.g.measuring 6.5 cm and 4 cm, or where the dimensions of the excised masses were not stated by the pathologist, or the surgical procedure was morcellation and myomectomy of one or more masses so that the size could not be determined, the case was excluded. In other words, if we were not certain for any reason that the mass we asked the radiologists to evaluate corresponded with specific histopathological findings, the case was excluded from the study data set.
Regardless of the number of uterine masses in any given patient, only one eligible mass per patient was chosen for evaluation. This was done to reduce bias. Mass size of at least 5 cm as an inclusion criterion was a pragmatic decision based on LMS typically being large at the time of diagnosis, making it unlikely that LMS would be a common radiological consideration in a female with a 2–3 cm mass presenting clinically as probable LM. We reasoned that if all masses the radiologists were asked to evaluate were relatively large, i.e. >5 cm, they would be less likely to be unconsciously biased towards suspecting LMS, regardless of the other imaging characteristics of the mass, simply because the mass was large.
MR imaging technique
All subjects were scanned on a 3T GE HDX Twinspeed scanner (GE Medical Systems, Milwaukee WI) using T1, T2, DW, and pre- and post-contrast fat-suppressed T1 weighted sequences acquired in multiple planes. Detailed protocol parameters are provided in Table 1.
Table 1.
MR hardware and sequence parameters
| Field Strength | 3.0T | ||
| Equipment | 3.0T HDX Twinspeed | ||
| Manufacturer | GE | ||
| Gradient trength | 50mT/m | ||
| Slew rate | 150 T/m/s | ||
| Coil type | 8 Channel Cardiac Array | ||
| Approximate examination time | 20–30 min | ||
| Sequence name | FRFSE | EPI DWI | FSPGR |
| Fast Recovery Fast Spin Echo | Echoplanar Imaging | Fast Spoiled Gradient Echo | |
| Diffusion-Weighted Imaging | |||
| Imaging mode | 2D | 2D | 2D |
| Weighting | T2 | DWI | T1 |
| Scan planes | Axial, Sagittal and Coronal | Axial, Sagittal and Coronal | Axial |
| TR (ms) | 5240 | 5000 | 120 |
| TE (ms) | 106 | 56.9 | 2.1 (In Phase) |
| Flip angle | 90 | 90 | |
| Number of excitations | 1 | 8 | 1 |
| Receive bandwidth (kHz) | 250 | 41.67 | |
| Frequency matrix | 384 | 100 | 288 |
| Phase matrix | 224 | 152 | 192 |
| Slice thickness | 4.5 | 5 | 6 |
| Slice spacing | 1 | 1.5 | 2 |
| Voxel size (mm) | 1.6 × 0.93 × 4.5 | 3.6 × 2.36 × 5 | 1.25 × 1.875 × 6 |
| Field of view (mm) | 360 | 360 | 360 |
| Echo train length | 20 | ||
| b value | 500 | ||
| Diffusion direction | All | ||
| Approx acquisition time (min:s) | 02:21 | 02:45 | 00:48 |
| Frequency voxel size | 0.9375 | 3.6 | 1.25 |
| Phase voxel size | 1.607142857 | 2.368421053 | 1.875 |
TE, echo time; TR, repetition time.
Case compilation
All patients with pathologically confirmed LMS, STUMP and LM meeting all of our inclusion criteria and having no exclusion criteria comprised our study subjects. Each case was assigned a unique study number. An online random number generator was used to determine the order in which the cases were presented to the readers. This order of presentation was consistent for both readers.
Image analysis
Two radiologists with 15 and 8 years, respectively, of clinical experience with interpretation of oncologic pelvic MRI studies in a tertiary referral hospital with a large gynaecologic oncology service scored all studies independently and under the supervision of a research assistant. Scores for each of the evaluated imaging parameters were recorded separately for each radiologist. The assistant recorded their responses in an Excel (Microsoft, Seattle, WA) database. Studies were viewed on a Synapse PACS workstation (Fujifilm Medical Systems, Tokyo, Japan). Image window and level and magnification could be altered by the user and no time limitation was placed on the readers. The readers were aware of the study aims but were blinded to histological diagnosis as well as to the number of cases that were LMS or STUMP.
One LMS and two LM (not included in the main analysis) were used for training in the assessment criteria and scoring system. Due to the rarity of LMS we were unable to “sacrifice” more of the study dataset for training purposes.
T1 and T2 weighted images were viewed and scored prior to CE and DW images. The following qualitative/quantitative image attributes and categorical scoring systems were used:
Lesion margin: irregular = 1 smooth = 0
Margin definition: ill-defined = 1 well-defined = 0
Internal T2 signal: inhomogeneous = 1 homogeneous = 0
Proportion of mass with T2 signal brighter than myometrium:≥50%=1<50%=0
Intralesional haemorrhage – defined as focal areas of T1 hyperintensity brighter than bone marrow signal and not suppressing on fat suppressed T1 weighted images: Yes = 1 No=0
Diffusion restriction in any portion of the mass defined as lower signal than myometrium on ADC map and higher signal on DWI: Yes = 1 No=0
CE greater than normal myometrium: Yes = 1 No=0
CE pattern:
Mainly or exclusively peripheral = 3
Diffuse, heterogeneous = 2
Diffuse, homogeneous = 1
Lymphadenopathy: Yes = 1 No=0
Ascites: Yes = 1 No=0
Statistical analysis
Descriptive statistics for Reader 1 and Reader 2 were calculated for each of the parameters assessed. Differences between LM and LMS for each parameter were calculated using the Wilcoxon rank-sum test for ordinal variables and χ2 test for equal proportion or Fisher’s exact test, as appropriate, for binomial variables, with results reported as medians, interquartile ranges (IQRs) or percentages, respectively. Interobserver agreement was assessed for each image parameter using Cohen’s κ statistic. A two-sided p-value of 0.05 was chosen to indicate statistical significance.
Results
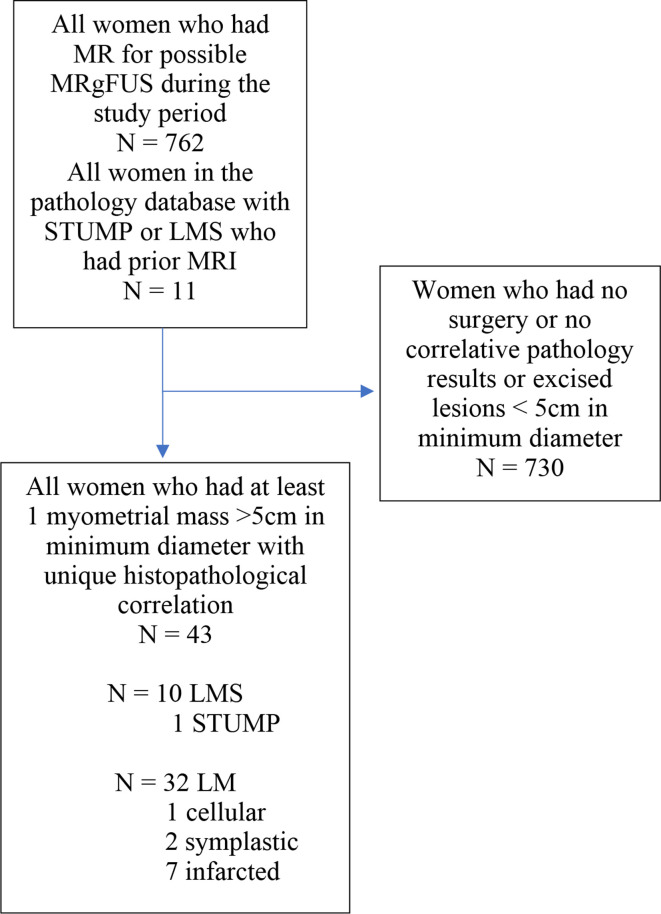
43 study subjects were evaluated, comprising 32 cases of LM, 10 LMS and 1 STUMP (Figure 1). Of the 32 LM, 3 were atypical [cellular (1) or symplastic (2)] and 7 showed pathological evidence of infarction. The median age of the subjects with LM was 41 years (IQR 37.5–46.5) with the median age of the 11 patients with LMS or STUMP 40 years (IQR: 31–50 years).
Figure 1.
Assembly of study cohort flowchart
The single STUMP was grouped with the LMS cases for the purpose of statistical analysis concordant with the approach taken in a previous study comparing MR characeteristics of LM with STUMP and LMS.28 Aggregated analysis of the imaging data for this single case with the LMS cases was performed for the following practical reasons:
Lack of agreed pathological diagnostic criteria for STUMPs, which are thought potentially to represent a rare transitional form of neoplasm between LM and LMS, make reproducible pathologic distinction of LMS and STUMP potentially challenging
Treatment of STUMP is far more consistent with LMS than LM; minimally invasive therapies such as embolisation, morcellation, and high frequency ultrasound are not appropriate for STUMP.
Questionable clinical applicability of data on the MRI features of a single case of STUMP
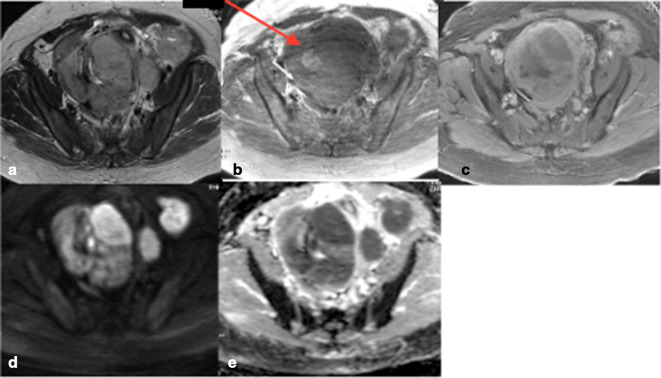
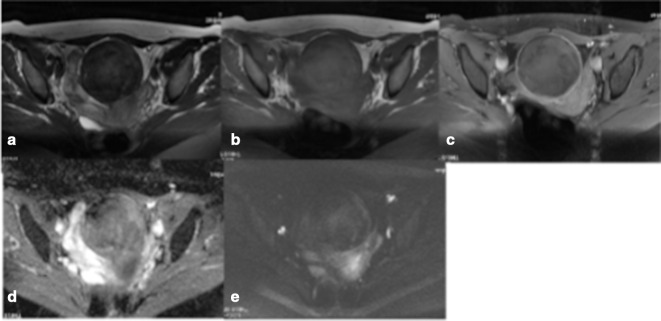
For both readers an ill-defined or irregular margin, T2 hyperintensity in more than 50% of the mass, predominantly peripheral contrast enhancement, ascites, and lymphadenopathy were observed significantly more frequently in LMS and STUMP (Figure 2) than in LM (Figure 3). Diffusion restriction and intralesional haemorrhage were significantly more commonly observed in LMS/STUMP by Reader 1 but not by Reader 2. T2 heterogeneity and any CE were not different for LMS and LM/STUMP for either reader (Table 2).
Figure 2.
(a–e) Typical LMS a. non-contrast T2 weighted image b. non-contrast T1WI. (c) Post contrast T1 weighted image with fat suppression. (d) ADC map. (e) DWI showing irregular lesion borders, intrinsic T2 hyperintensity in more than 50% of the lesion, intralesional haemorrhage (arrow 2b), peripheral “necrotic” pattern of contrast enhancement and marked restricted diffusion with corresponding high signal on DWI. ADC, apparentdiffusion coefficient; DWI, diffusion-weightedimaging; LMS, leiomyosarcoma; T1WI, T1weighted image.
Figure 3.
(a–e) Typical LM (demonstrating histological evidence of infarction). The mass has a smooth margin on T2WI (a), homogeneous internal signal on T2 (a) and T1WI (b), no contrast enhancement on fat-suppressed T1WI (c) and DWI (d) /ADC (e) “blackout” appearance consistent with absence of restricted diffusion. ADC, apparentdiffusion coefficient; DWI, diffusion-weightedimaging; LM, leiomyoma; T1WI, T1 weightedimage.
Table 2.
Associations between image characteristics and LMS/STUMP histology for two independent readers
| Variable | LM (n = 32) | LMS (n = 11) | p-value |
| Ascites 1 | 6.3% | 63.6% | 0.0003 |
| Ascites 2 | 0% | 45.5% | 0.0005 |
| Ill-defined margin 1 | 12.5% | 72.7% | 0.0004 |
| Ill-defined margin 2 | 18.8% | 81.8% | 0.0003 |
| Irregular margin 1 | 28.1% | 90.9% | 0.0004 |
| Irregular margin 2 | 25% | 81.8% | 0.003 |
| Lymphadenopathy 1 | 0% | 36.4% | 0.003 |
| Lymphadenopathy 2 | 0% | 27.3% | 0.014 |
| T2 hyperintensity greater than 50% of lesion 1 | 34.4% | 90.9% | 0.001 |
| T2 hyperintensity greater than 50% of lesion 2 | 28.1% | 81.8% | 0.004 |
| Peripheral contrast enhancement 1, median (IQR) | 2 (1–2) | 2 (2–3) | 0.046 |
| Peripheral contrast enhancement 2, median (IQR) | 1 (1–2) | 2 (2–3) | 0.002 |
|
Haemorrhage present on T1 pre-contrast sequence 1 |
12.5% | 45.5% | 0.034 |
| Haemorrhage present on T1 pre-contrast sequence 2 | 21.9% | 36.4% | 0.43 |
| Diffusion restriction 1 | 63.3% | 100% | 0.038 |
| Diffusion restriction 2 | 80% | 90.9% | 0.65 |
| Heterogeneous signal 1 | 81.3% | 100% | 0.31 |
| Heterogeneous signal 2 | 78.1% | 100% | 0.16 |
| Contrast enhancement 1 | 84.4% | 100% | 0.31 |
| Contrast enhancement 2 | 87.5% | 100% | 0.56 |
LMS, leiomyosarcoma; STUMP, soft tissue tumour of unknown malignant potential.
Although CE was present in all LMS as interpreted by both readers, it was poorly specific in our cohort with nearly 90% of LM also demonstrating this for both readers.
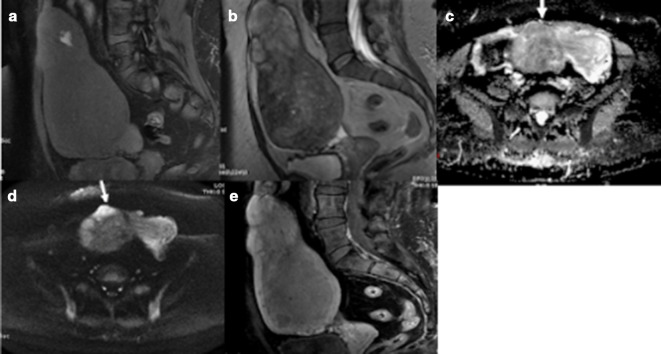
Of the imaging findings significantly associated with a diagnosis of STUMP or LMS, interobserver agreement was highest for lesion marginal irregularity/nodularity (Figures 1 and 4–7.) and ill-definition as well as lymphadenopathy and ascites but only fair for lesional T2 hyperintensity greater than 50% (Table 3) (Figure 6).
Figure 4.
(a–e) LM with histopathological evidence of haemorrhagic infarction. Intrinsic hyperintensity on fat-suppressed T1WI (a) indicative of haemorrhage; an irregular margin with areas of intrinsic hyperintensity on T2WI (b); restricted diffusion on ADC (c) and DWI (d) and predominantly peripheral enhancement on T1W fat-suppressed post-contrast images (e). ADC, apparentdiffusion coefficient; DWI, diffusion-weighted imaging; LM, leiomyoma; T1WI,T1 weighted image.
Figure 5.
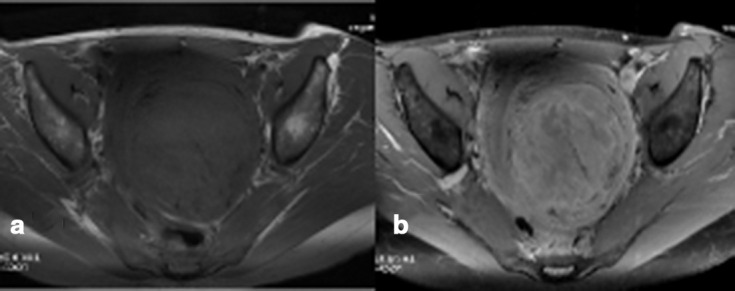
(a, b) Non-infarcted symplastic LM showing predominantly peripheral pattern of contrast enhancement on fat-suppressed T1WI, pre- (a) and post- (b) contrast images, with multiple areas of hypoenhancement in the centre of the lesion. Both radiologists interpreted this as a predominantly peripheral pattern of contrast enhancement but no marginal irregularity/nodularity. LM, leiomyoma;T1WI, T1 weighted image.
Figure 6.
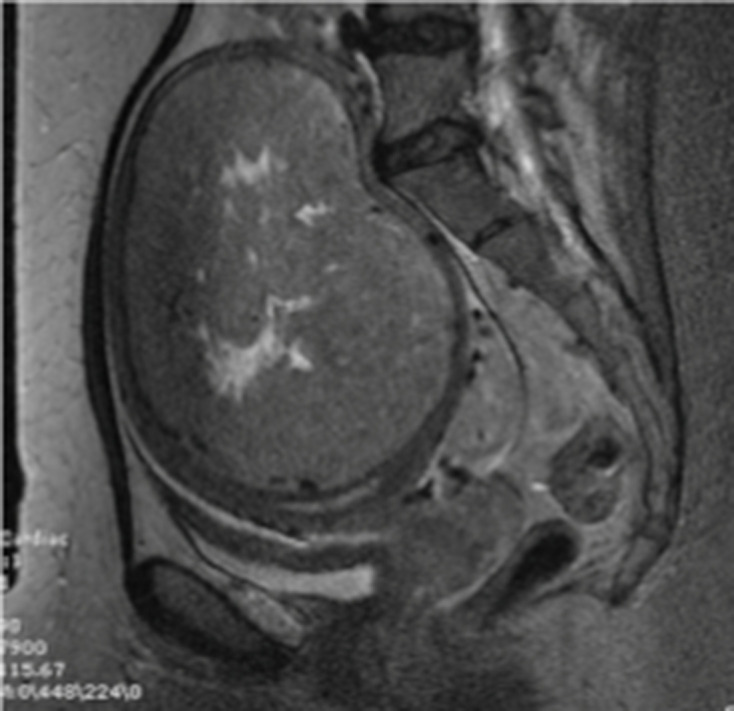
Infarcted LM demonstrating heterogeneous internal signal hyperintensity occupying less than 50% of the mass and a smooth well-defined margin on T2WI. LM, leiomyoma;T2WI, T2 weighted image.
Figure 7.
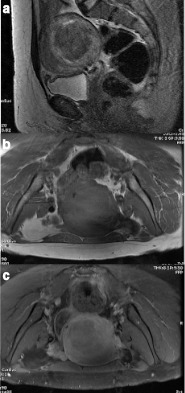
(a–c) LM with no necrosis mentioned in the histopathology report, demonstrating a smooth margin with <50% T2 hyperintensity on T2WI (a), but a predominantly peripheral, “necrotic” pattern of contrast enhancement (7b non-contrast fat suppression T1WI, and 7c post-contrast fat suppression T1WI). LM, leiomyoma;T1WI, T1 weighted image
Table 3.
Interobserver agreement
| Margin irreg | Margin def | T2 homog | T2 hyper ≥50 |
T1 focal hyper | DWI/ ADC |
CE + | CE + rim | LN | Ascites |
| 0.81 | 0.73 | 0.19 | 0.58 | 0.61 | 0.49 | 0.88 | 0.35 | 0.84 | 0.66 |
ADC, apparent diffusion coefficient; DWI, diffusion-weighted imaging; LN = lymphadenopathy.
Margin irreg = irregular/nodular (non - smooth) margin
Margin def = margin definition (ill- or well – defined)
T2 homog = homogeneity or uniformity of signal within the mass on T2 weighted images
T2 hyper ≥50 = increased signal greater than that of normal myometrium in more than 50% of the total volume of the mass
T1 focal hyper = focal (single or multiple) T1 hyperintensity(ies) within the mass
DWI/ADC = diffusion trace - weighted image and ADC map
CE+=contrast enhancement
CE rim = predominantly or exclusively peripheral contrast enhancement
Based on image characteristics (other than extralesional characteristics, i.e. lymphadenopathy and ascites) that were significantly different for both readers for LM compared with LMS/STUMP, we explored the diagnostic performance of various combinations of these characteristics that had previously been described as helpful discriminators of LM and LMS. Recursive partitioning and regression analyses were not feasible due to the small number of cases and relatively large number of predictor variables.
For both readers, ill-defined lesion margins were never seen in LM but were present in only one case of LMS making this a highly specific but very insensitive sign although reader agreement on this sign (κ = 0.73) was high.
For Reader 1, 10 of 11 LMS/STUMP had irregular margins, 9 of these 10 also demonstrated diffusion restriction. However, this combination of findings was also seen in 7 of 32 LM, giving it a sensitivity of 81% and specificity of 78%. Only 3 of these 9 LMS/STUMP lesions also demonstrated a predominantly peripheral, “necrotic” pattern of enhancement (Figure 1) and this pattern of enhancement was not seen in combination with the other two features (marginal irregularity and DWI) in any LM (Figures 5 and 7) and so the combination was 100% specific for LMS/STUMP, albeit insensitive.
For Reader 2, 9 of 11 LMS/STUMPs had irregular margins, and all nine were also thought to demonstrate restricted diffusion but this combination of findings was also seen, as for Reader 1, in 7 of 32 LM. Four of these nine also showed a predominantly peripheral, “necrotic” enhancement pattern, but so did one of the LM cases that had an irregular border and restricted diffusion.
Discussion
Our study has demonstrated that marginal irregularity and/or ill-definition of lesion borders were highly reproducible observations for two independent, blinded observers reviewing a series of cases of LM and LMS. Marginal irregularity as well as DWI hyper/ADC hypointensity consistent with restricted diffusion was associated with 81% sensitivity and 78% specificity for LMS/STUMP.
Our cohort of LM cases is unusual in that 11 of the 32 LM cases were complicated by infarction or had atypical histology (cellular or symplastic). This may account at least in part for the relatively high proportion of LM demonstrating intralesional high DWI/low ADC signal (63–80%) as well as intralesional T1 hyperintense foci consistent with hemorrhage (22–46%). The prevalence of LM with atypical histology or infarction in our series may be a manifestation of the way that we selected our study cohort; patients who underwent MRI as a screening test for their suitability for MRgFUS, and who were deemed unsuitable for any reason (including “atypical” imaging findings), would be expected to have mass lesions with more atypical features than a cohort of females simply presenting with symptoms and an ultrasound abnormality suggestive of LM.
Patients with masses “atypical” for LM would routinely be rejected from consideration for MRgFUS due to the possibility that the myometrial mass lesion was a malignant lesion. Those who proceeded to MRgFUS were not eligible for inclusion in our study due to lack of histopathological correlation, because they did not have surgical treatment. Both radiologists observed peripheral “necrotic” type enhancement in two of seven LM shown histopathologically to be infarcted, reducing the specificity of a “necrotic” type enhancement pattern for LMS in our cohort. Thus, the special characteristics of our “control” population with LM and the way that they were identified may limit the generalisability of our findings in regard to imaging features that best distinguish LM from LMS and STUMP.
As has been demonstrated in other studies, restricted diffusion is routinely seen in LMS.21,29,30 Multiple studies have attempted to quantify this with the development of ADC cut-off values that distinguish between LM and LMS, typically between 1.05 and 1.23, but due to overlap between the ADC of LMS and LM, ADC is used in combination with another parameter in these studies, either hyperintense signal on DWI or T2 weighted images, relative to normal myometrium.24,26,33 Thomassin-Naggara24 et al found that increased signal intensity on high-b-value DWI, increased SI on T2 weighted images, and an ADC value of less than 1.23 were the best combination of criteria to distinguish between LM and uterine malignancy with a positive predictive value of 92.4%. However, their study included only three cases of LMS. Tong et al30 similarly found lower ADC in 10 LMS (0.8 × 10 −3 mm2/s) as opposed to a mean of 1.16 × 10⁻³ mm2/s for LM but noted that ADC values overlapped between LM and LMS (with cases of cellular LM having ADC values as low as 0.68 × 10 −3 mm2/s). In addition, as has been highlighted by Kivrak et al,32 ADC values vary with field strength, the scanning parameters used for DW- MRI, and system and vendor-specific issues such as field inhomogeneities, eddy currents, and sequence designs. This limits clinical applicability of ADC cut-off values.
In our study, diffusion restriction was seen by Reader 1 in 4 of 7 and Reader 2 in 5 of 7 cases of infarcted LM and by both readers in 2 of 3 cellular/symplastic LM. Hence, infarcted and specific histological subtypes of LM were associated with restricted diffusion no more frequently than were LM overall. This finding is in contrast to the narrative review of DeMulder et al29 indicating that infarcted and typical LM does not demonstrate diffusion restriction. We found only fair agreement between readers (κ = 0.49) for assessment of DWI/ADC map abnormality, potentially limiting generalisability of qualitative assessment of DWI and ADC maps. In addition, between 63 and 80% of LM in our series demonstrated the combination of increased DWI and low ADC, indicating the lack of specificity of this finding for LMS even though it was present in 91–100% of LMS cases. However, consistent with other studies, we found that absence of visibly reduced lesion signal on ADC maps, relative to normal myometrium, almost eliminated the possibility of the lesion being LMS/STUMP.
Between 22 and 46% of our cases of LM demonstrated one or more foci of T1 hyperintensity that were thought to represent intratumoral haemorrhage. Therefore, this finding was non-specific for LMS; for Reader 1, LMS cases were significantly more likely to be associated with foci of T1 hyperintensity (p = 0.034) but for Reader 2, there was no difference between LMS and LM cases for this observation.
Recent studies of multiparametric evaluation of presumed LM have demonstrated the importance of integrating multiple imaging features such as margin characteristics, haemorrhage, necrotic/peripheral contrast enhancement pattern and reduced diffusion. Lakhamann et al21 found not surprisingly that the presence of more “atypical” features increases the likelihood of malignancy.
Tong et al30 have suggested a clinicoradiological pathway for screening patients with probable LM for LMS using multiparametric imaging, selective endometrial biopsy and serum LDH, resulting in dichotomisation of patients into high risk (>25% risk of LMS) and low risk (<5% risk). They calculated an incremental cost-effectiveness ratio of $9,326 per year of life gained for combined clinicoradiologic evaluation of 1960 patients with uterine mass lesions, only 10 of which were LMS. In this study, multiparametric MRI was used to triage patients into higher or lower risk groups in order to determine surgical approach and patient counselling. Due to the small number of LMS cases, the sensitivity of the multiparametric imaging assessment (which evaluated lesion marginal irregularity, intrinsic T2 hyperintensity, intralesional hemorrhage, diffusion restriction, ADC measurement and necrotic enhancement pattern) was between 66 and 100% but specificity was 97–98%. The use of LDH in only 5 of the 10 LMS patients, with only 3 of 5 having a positive result, made it difficult to assess the added benefit of this test with regard to screening for LMS or the optimal integration of serum LDH assessment into risk prediction models.
The strengths of our study included measurement of interobserver agreement, a relatively large number of LMS compared to previously published studies, selection of cases from a cohort with relatively high number of atypical and infarcted LM which are the most problematic to distinguish from LMS using MR, analysis of only one lesion per patient and histopathological correlation in every case. The blinded, random admixture of LMS, STUMP, and LM cases read by the radiologists, based on our study design, attempted to simulate clinical practice.
Our study confirms the need to combine multiple MR parameters to improve specificity in the diagnosis of LMS, and we found that a combination of lesion margin irregularity with low ADC/increased DWI signal was the most sensitive and reader-independent combination of findings. However, incorporation of the information from multiparametric MRI with other clinical and biochemical data and newer techniques such as radiomics using texture analysis21 and 18F-FLT PET29 may help to further improve specificity in order to enable more patients to have less invasive and fertility-preserving treatments for symptomatic LM.
Prospective multicentre evaluation of multiparametric MRI risk-stratification protocols, such as that proposed by Tong et al,30 and development of a standardised lexicon and scoring system, like PIRADS, for uterine masses would improve our ability to implement and measure the clinical impact of such clinicoradiologic risk stratification strategies.
Footnotes
Acknowledgements: The authors wish to thank Ms. Jennifer Clark for manuscript preparation and proofreading.
Disclosure: The authors have no conflicts of interest to declare.
Contributor Information
Parisa Aminzadeh, Email: parisaamin@yahoo.com.
Ekaterina Alibrahim, Email: ekat6@hotmail.com.
Andrew Dobrotwir, Email: doba@fmig.com.au.
Eldho Paul, Email: eldho.paul@monash.edu.
Stacy Goergen, Email: Stacy.Goergen@monashhealth.org.
REFERENCES
- 1.Sparic R, Mirkovic L, Malvasi A, Tinelli A. Epidemiology of uterine Myomas: a review. Int J Fertil Steril 2016; 9: 424–35. doi: 10.22074/ijfs.2015.4599 [DOI] [PMC free article] [PubMed] [Google Scholar]
- 2.Borah BJ, Nicholson WK, Bradley L, Stewart EA. The impact of uterine leiomyomas: a national survey of affected women. Am J Obstet Gynecol 2013; 209: 319.e1–319.e20. doi: 10.1016/j.ajog.2013.07.017 [DOI] [PMC free article] [PubMed] [Google Scholar]
- 3.Borah BJ, Yao X, Laughlin-Tommaso SK, Heien HC, Stewart EA. Comparative effectiveness of uterine leiomyoma procedures using a large insurance claims database. Obstet Gynecol 2017; 130: 1047–56. doi: 10.1097/AOG.0000000000002331 [DOI] [PMC free article] [PubMed] [Google Scholar]
- 4.Melton LJ, Achenbach SJ, Gebhart JB, Babalola EO, Atkinson EJ, Bharucha AE. Influence of hysterectomy on long-term fracture risk. Fertil Steril 2007; 88: 156–62. doi: 10.1016/j.fertnstert.2006.11.080 [DOI] [PMC free article] [PubMed] [Google Scholar]
- 5.Blandon RE, Bharucha AE, Melton LJ, Schleck CD, Babalola EO, Zinsmeister AR, et al. Incidence of pelvic floor repair after hysterectomy: a population-based cohort study. Am J Obstet Gynecol 2007; 197: 664.e1–664.e7. doi: 10.1016/j.ajog.2007.08.064 [DOI] [PMC free article] [PubMed] [Google Scholar]
- 6.Howard BV, Kuller L, Langer R, Manson JE, Allen C, Assaf A, et al. Risk of cardiovascular disease by hysterectomy status, with and without oophorectomy: the women's health Initiative observational study. Circulation 2005; 111: 1462–70. doi: 10.1161/01.CIR.0000159344.21672.FD [DOI] [PubMed] [Google Scholar]
- 7.Phung TKT, Waltoft BL, Laursen TM, Settnes A, Kessing LV, Mortensen PB, et al. Hysterectomy, oophorectomy and risk of dementia: a nationwide historical cohort study. Dement Geriatr Cogn Disord 2010; 30: 43–50. doi: 10.1159/000314681 [DOI] [PubMed] [Google Scholar]
- 8. Quantitative assessment of the prevalence of unsuspected uterine sarcoma in women undergoing treatment of uterine fibroids-summary and key findings.. Accessed December 2 2019.
- 9.Pritts EA, Vanness DJ, Berek JS, Parker W, Feinberg R, Feinberg J, et al. The prevalence of occult leiomyosarcoma at surgery for presumed uterine fibroids: a meta-analysis. Gynecol Surg 2015; 12: 165–77. doi: 10.1007/s10397-015-0894-4 [DOI] [PMC free article] [PubMed] [Google Scholar]
- 10.del Carmen MG. Uterine Leiomyosarcoma. : Uncommon Gynecologic Cancers. Chichester, UK: John Wiley & Sons, Ltd; 2014. . 167–77. [Google Scholar]
- 11.Barral M, Placé V, Dautry R, Bendavid S, Cornelis F, Foucher R, et al. Magnetic resonance imaging features of uterine sarcoma and mimickers. Abdom Radiol 2017; 42: 1762–72. doi: 10.1007/s00261-017-1076-9 [DOI] [PubMed] [Google Scholar]
- 12.Bolan C, Caserta MP. Mr imaging of atypical fibroids. Abdom Radiol 2016; 41: 2332–49. doi: 10.1007/s00261-016-0935-0 [DOI] [PubMed] [Google Scholar]
- 13.Goto A, Takeuchi S, Sugimura K, Maruo T. Usefulness of Gd-DTPA contrast-enhanced dynamic MRI and serum determination of LDH and its isozymes in the differential diagnosis of leiomyosarcoma from degenerated leiomyoma of the uterus. Int J Gynecol Cancer 2002; ; 12: 354–61Jul-Aug. doi: 10.1046/j.1525-1438.2002.01086.x [DOI] [PubMed] [Google Scholar]
- 14.Shah SH, Jagannathan JP, Krajewski K, O'Regan KN, George S, Ramaiya NH. Uterine sarcomas: then and now. AJR Am J Roentgenol 2012; 199: 213–23. doi: 10.2214/AJR.11.7287 [DOI] [PubMed] [Google Scholar]
- 15.Skorstad M, Kent A, Lieng M. Preoperative evaluation in women with uterine leiomyosarcoma. A nationwide cohort study. Acta Obstet Gynecol Scand 2016; 95: 1228–34. doi: 10.1111/aogs.13008 [DOI] [PubMed] [Google Scholar]
- 16.Suzuki Y, Wada S, Nakajima A, Fukushi Y, Hayashi M, Matsuda T, et al. Magnetic resonance imaging grading system for preoperative diagnosis of leiomyomas and uterine smooth muscle tumors. J Minim Invasive Gynecol 2018; ; 25: 507–13Mar-Apr. doi: 10.1016/j.jmig.2017.08.660 [DOI] [PubMed] [Google Scholar]
- 17.Tirumani SH, Ojili V, Shanbhogue AKP, Fasih N, Ryan JG, Reinhold C. Current concepts in the imaging of uterine sarcoma. Abdom Imaging 2013; 38: 397–411. doi: 10.1007/s00261-012-9919-x [DOI] [PubMed] [Google Scholar]
- 18.Santos P, Cunha TM. Uterine sarcomas: clinical presentation and MRI features. Diagn Interv Radiol 2015; ; 21: 4–9Jan-Feb. doi: 10.5152/dir.2014.14053 [DOI] [PMC free article] [PubMed] [Google Scholar]
- 19.Lin G, Yang L-Y, Huang Y-T, Ng K-K, Ng S-H, Ueng S-H, et al. Comparison of the diagnostic accuracy of contrast-enhanced MRI and diffusion-weighted MRI in the differentiation between uterine leiomyosarcoma / smooth muscle tumor with uncertain malignant potential and benign leiomyoma. J Magn Reson Imaging 2016; 43: 333–42. doi: 10.1002/jmri.24998 [DOI] [PubMed] [Google Scholar]
- 20.Kubik-Huch RA, Weston M, Nougaret S, Leonhardt H, Thomassin-Naggara I, Horta M, et al. European Society of urogenital radiology (ESUR) guidelines: MR imaging of leiomyomas. Eur Radiol 2018; 28: 3125–37. doi: 10.1007/s00330-017-5157-5 [DOI] [PMC free article] [PubMed] [Google Scholar]
- 21.Lakhman Y, Veeraraghavan H, Chaim J, Feier D, Goldman DA, Moskowitz CS, et al. Differentiation of uterine leiomyosarcoma from atypical leiomyoma: diagnostic accuracy of qualitative MR imaging features and feasibility of texture analysis. Eur Radiol 2017; 27: 2903–15. doi: 10.1007/s00330-016-4623-9 [DOI] [PMC free article] [PubMed] [Google Scholar]
- 22.Fukunishi H, Funaki K, Ikuma K, Kaji Y, Sugimura K, Kitazawa R, et al. Unsuspected uterine leiomyosarcoma: magnetic resonance imaging findings before and after focused ultrasound surgery. Int J Gynecol Cancer 2007; ; 17: 724–8May-Jun. doi: 10.1111/j.1525-1438.2007.00818.x [DOI] [PubMed] [Google Scholar]
- 23.Kim TH, Kim JW, Kim SY, Kim SH, Cho JY. What MRI features suspect malignant pure mesenchymal uterine tumors rather than uterine leiomyoma with cystic degeneration? J Gynecol Oncol 2018; 29: e26. doi: 10.3802/jgo.2018.29.e26 [DOI] [PMC free article] [PubMed] [Google Scholar]
- 24.Thomassin-Naggara I, Dechoux S, Bonneau C, Morel A, Rouzier R, Carette M-F, et al. How to differentiate benign from malignant myometrial tumours using MR imaging. Eur Radiol 2013; 23: 2306–14. doi: 10.1007/s00330-013-2819-9 [DOI] [PubMed] [Google Scholar]
- 25.Kido A, Fujimoto K, Okada T, Togashi K. Advanced MRI in malignant neoplasms of the uterus. J Magn Reson Imaging 2013; 37: 249–64. doi: 10.1002/jmri.23716 [DOI] [PubMed] [Google Scholar]
- 26.Sato K, Yuasa N, Fujita M, Fukushima Y. Clinical application of diffusion-weighted imaging for preoperative differentiation between uterine leiomyoma and leiomyosarcoma. Am J Obstet Gynecol 2014; 210: 368.e1–368.e8. doi: 10.1016/j.ajog.2013.12.028 [DOI] [PubMed] [Google Scholar]
- 27.Tamai K, Koyama T, Saga T, Morisawa N, Fujimoto K, Mikami Y, et al. The utility of diffusion-weighted MR imaging for differentiating uterine sarcomas from benign leiomyomas. Eur Radiol 2008; 18: 723–30. doi: 10.1007/s00330-007-0787-7 [DOI] [PubMed] [Google Scholar]
- 28.Tanaka YO, Nishida M, Tsunoda H, Okamoto Y, Yoshikawa H. Smooth muscle tumors of uncertain malignant potential and leiomyosarcomas of the uterus: Mr findings. J Magn Reson Imaging 2004; 20: 998–1007. doi: 10.1002/jmri.20207 [DOI] [PubMed] [Google Scholar]
- 29.DeMulder D, Ascher SM. Uterine leiomyosarcoma: can MRI differentiate leiomyosarcoma from benign leiomyoma before treatment? AJR Am J Roentgenol 2018; 211: 1405–15. doi: 10.2214/AJR.17.19234 [DOI] [PubMed] [Google Scholar]
- 30.Tong A, Kang SK, Huang C, Huang K, Slevin A, Hindman N. Mri screening for uterine leiomyosarcoma. J Magn Reson Imaging 2019; 49: e282–94. doi: 10.1002/jmri.26630 [DOI] [PubMed] [Google Scholar]
- 31.Malek M, Rahmani M, Seyyed Ebrahimi SM, Tabibian E, Alidoosti A, Rahimifar P, et al. Investigating the diagnostic value of quantitative parameters based on T2-weighted and contrast-enhanced MRI with psoas muscle and outer myometrium as internal references for differentiating uterine sarcomas from leiomyomas at 3T MRI. Cancer Imaging 2019; 19: 20. doi: 10.1186/s40644-019-0206-8 [DOI] [PMC free article] [PubMed] [Google Scholar]
- 32.Kıvrak AS, Paksoy Y, Erol C, Koplay M, Özbek S, Kara F. Comparison of apparent diffusion coefficient values among different MRI platforms: a multicenter phantom study. Diagn Interv Radiol 2013; 19: 433–7. doi: 10.5152/dir.2013.13034 [DOI] [PubMed] [Google Scholar]
- 33.Namimoto T, Yamashita Y, Awai K, Nakaura T, Yanaga Y, Hirai T, et al. Combined use of T2-weighted and diffusion-weighted 3-T MR imaging for differentiating uterine sarcomas from benign leiomyomas. Eur Radiol 2009; 19: 2756–64. doi: 10.1007/s00330-009-1471-x [DOI] [PubMed] [Google Scholar]


