Abstract
Purpose
To evaluate the prognostic utility of apparent diffusion coefficient (ADC) changes at whole-body diffusion-weighted (WB-DW) MRI after one treatment cycle for aggressive non-Hodgkin lymphoma (NHL) compared with response assessment at interim and end-of-treatment fluorine 18 (18F) fluorodeoxyglucose (FDG) PET/CT.
Materials and Methods
This was a secondary analysis of a prospective study (ClinicalTrials.gov identifier: NCT01231269) in which participants with aggressive NHL were recruited between March 2011 and April 2015 and underwent WB-DW MRI before and after one cycle of immunochemotherapy. Volunteers were recruited for test-retest WB-DW MRI (ClinicalTrials.gov identifier: NCT01231282) to assess ADC measurement repeatability. Response assessment was based on ADC change after one treatment cycle at WB-DW MRI and Deauville criteria at 18F-FDG PET/CT. To evaluate prognostic factors of disease-free survival (DFS), Kaplan-Meier survival analysis and univariable and multivariable Cox regression were performed; intraclass correlation coefficient (ICC) and mean difference with limits of agreement were calculated to determine inter- and intraobserver repeatability of ADC measurements.
Results
Forty-five patients (mean age, 58 years ± 17 [standard deviation]; 31 men) and nine volunteers (mean age, 22 years ± 3; seven men) were enrolled. Median DFS was 48 months (range, 2–48 months). Outcome prediction accuracy was 86.7% (39 of 45), 71.4% (30 of 42), and 73.8% (31 of 42) for WB-DW MRI and interim and end-of-treatment 18F-FDG PET/CT, respectively. WB-DW MRI (hazard ratio [HR], 17.8; P < .001) and interim (HR, 5; P = .008) and end-of-treatment (HR, 4.3; P = .017) 18F-FDG PET/CT were prognostic of DFS. After multivariable analysis, WB-DW MRI remained an independent predictor of outcome (HR, 26.8; P = .002). Intra- and interobserver agreement for ADC measurements were excellent (ICC = 0.85–0.99).
Conclusion
Quantitative WB-DW MRI after only one cycle of immunochemotherapy predicts DFS in aggressive NHL and is noninferior to routinely performed interim and end-of-treatment 18F-FDG PET/CT.
Keywords: MR-Diffusion Weighted Imaging, Lymphoma, Oncology, Tumor Response, Whole-Body Imaging
Supplemental material is available for this article.
© RSNA, 2021
Keywords: MR-Diffusion Weighted Imaging, Lymphoma, Oncology, Tumor Response, Whole-Body Imaging
Summary
Quantitative whole-body diffusion-weighted MRI performed before and after one cycle of immunochemotherapy using apparent diffusion coefficient change was the single independent predictor of outcome in patients with aggressive non-Hodgkin lymphoma compared with interim and end-of-treatment 18F fluorodeoxyglucose PET/CT.
Key Points
■ Quantitative whole-body diffusion-weighted (WB-DW) MRI after one cycle of treatment (P < .001) and interim (P = .008) and end-of-treatment fluorine 18 (18F) fluorodeoxyglucose (FDG) PET/CT (P = .02) were prognostic of outcome in contrast to prognostic clinical and histopathologic factors.
■ Quantitative WB-DW MRI using mean apparent diffusion coefficient change between baseline and one cycle of immunochemotherapy for aggressive non-Hodgkin lymphoma attained a prognostic accuracy of 86.7% (39 of 45), while interim 18F-FDG PET/CT yielded 71.4% (30 of 42), and end-of-treatment 18F-FDG PET/CT yielded 73.8% (31 of 42).
■ Quantitative WB-DW MRI was the only independent predictor of disease-free progression (P < .002; hazard ratio 26.8).
Introduction
Advances in treatment for aggressive non-Hodgkin lymphoma (NHL), in particular the addition of rituximab, have increased survival (1), although overall 5-year mortality still remains around 30% (2). Early identification of patients not responding to therapy may enable treatment adaptation, potentially improving clinical outcome and reducing toxic effects from ineffective and costly drugs (3). End-of-treatment fluorine 18 (18F) fluorodeoxyglucose (FDG) PET/CT is the established imaging method for response assessment in aggressive NHL and is regarded as a good predictor of treatment outcome (4,5). However, meta-analyses have indicated that end-of-treatment 18F-FDG PET/CT and particularly interim 18F-FDG PET/CT (after two to four cycles of treatment) may be unsatisfactory for predicting outcome in various lymphoma types (6,7). A substantial portion of patients with a negative end-of-treatment 18F-FDG PET/CT finding will eventually develop tumor relapse during follow-up (8), and during treatment the rituximab-induced inflammatory response will render a substantial number of false-positive results at interim 18F-FDG PET/CT (9).
Diffusion-weighted (DW) MRI is routinely used in oncologic imaging to detect malignant processes and monitor treatment response on the basis of high b value appearance and apparent diffusion coefficient (ADC) changes. In lymphoma, previous preclinical and smaller clinical studies have shown that treatment-induced tumor cell death results in a detectable ADC increase after only 2 weeks of treatment (10,11). The immunotherapy-related inflammatory cell influx is not a confounding factor for DW imaging, as ADC values in the context of inflammation demonstrate higher ADC values than tumor (12).
Although whole-body (WB)–DW MRI for staging malignant lymphoma has been the focus of intense research, very few studies (10,11,13–17) have reported on its role for early response assessment to treatment. The prespecified hypothesis of this study is that early treatment quantitative WB-DW MRI correlates with patient outcome and has a prognostic performance noninferior to existing prognostic parameters. Therefore, the aim of the study is to evaluate the prognostic utility of ADC changes at WB-DW MRI after one treatment cycle for aggressive NHL compared with response assessment at interim and end-of-treatment 18F-FDG PET/CT.
Materials and Methods
Study Participants
This study was a secondary analysis of a single-center prospective study. Participants were enrolled from November 2011 to April 2015. Approval from the institutional review board was obtained, and written informed consent was given by all participants prior to inclusion (ClinicalTrials.gov: NCT01231269). There is partial study participant overlap with a previously published study (18) as described in Appendix E1 (supplement). Follow-up of patients was closed in January 2018.
All patients who were referred to our hospital with a new histopathologically proven diagnosis of aggressive NHL (at excisional and/or bone marrow biopsy) and scheduled for upfront immunochemotherapy were eligible. Exclusion criteria were general contraindications for MRI (eg, claustrophobia or pacemaker) or the presence of a concurrent malignancy other than lymphoma. Patients underwent routine clinical examination, histopathologic work-up including the determination of prognostic tissue markers (19,20), and 18F-FDG PET/CT, allowing for Ann Arbor staging and calculation of the International Prognostic Index (IPI) score (21) to determine the final management plan. Enrolled patients were scheduled for a WB-DW MRI before treatment and after one cycle of immunochemotherapy (after 2 to 3 weeks, depending on the treatment regimen). Interim 18F-FDG PET/CT was performed after two to four cycles of treatment depending on treatment regimen, and end-of-treatment 18F-FDG PET/CT was performed 6–8 weeks after the last cycle of immunochemotherapy.
An additional institutional review board–approved volunteer study (ClinicalTrials.gov: NCT01231282) was conducted to assess the repeatability of ADC measurements. Between March and May 2011, any participant with no hematologic disease and/or malignancy in their medical history or at the time of scanning and no contraindications to MRI was eligible to undergo two WB-DW MRI scans performed within a 10-week interval after written informed consent was obtained. Volunteers were recruited from among research team members, hospital staff, and university students.
Imaging Techniques
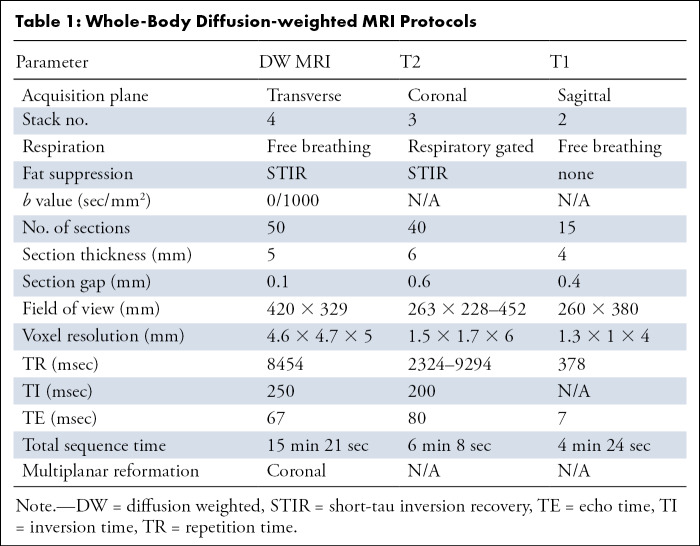
WB-DW MRI.— WB imaging covering the brain down to the proximal third of the upper legs was performed with a 3-T MRI system (Ingenia; Philips) with parallel radiofrequency transmission and phased-array head-neck and body coils. Scanning parameters are summarized in Table 1. Free-breathing short-tau inversion recovery WB-DW MRI was performed using two b values (b0 and b1000) in the axial plane, and multiplanar reformatted coronal WB images were generated automatically by the scanner software for each of the native b values and the ADC map with a section thickness of 5 mm. For anatomic reference, a coronal WB short-tau inversion recovery fat-suppressed T2-weighted turbo spin-echo sequence was performed, as well as a sagittal T1-weighted turbo spin-echo sequence covering the thoracolumbar spine. No intravenous contrast material was administered.
Table 1:
Whole-Body Diffusion-weighted MRI Protocols
18F-FDG PET/CT.— Patients fasted for 6 hours prior to the 18F-FDG PET/CT examination (Biograph 40 TruePoint with TrueV; Siemens Medical Solutions). Single-section, WB, spiral CT (40-section Siemens Sensation, 85 mAs, 120 kV, section thickness 5 mm, collimation 24 × 1.2 mm, table feed 23 mm/rotation) was performed after intravenous injection of 120 mL of a contrast agent containing 300 mg iodine/mL (Omnipaque, Visipaque; GE Healthcare). PET/CT images were acquired with free breathing 60 minutes after intravenous administration of 18F-FDG at an average dose of 302.6 MBq (range, 220–388 MBq). PET images were corrected for attenuation using the CT data.
Image Analysis
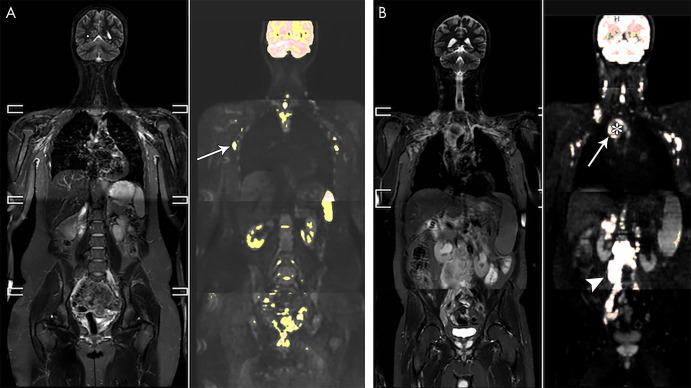
Treatment response assessment.— In all patients, observer 1 (K.N.D.P., senior radiology resident) segmented whole lesions on the baseline and interim scan in correlation with baseline 18F-FDG PET/CT, blinded to all clinical data. Delineations were made on the DW images with b value of 1000 sec/mm2 (b1000 images) using an in-house manufactured segmentation tool in MeVisLab (MeVis Medical Solutions). The application of a color-coded scale on the basis of b1000 signal intensity and an adaptable threshold allowed for accurate node or lesion delineation excluding surrounding fat tissue or abutting structures. To detect tumor components refractory to treatment, thresholding was set to exclusively select the most b1000-hyperintense (and presumed most hypercellular [22]) part of the tumor (Fig 1, A), excluding necrosis if present (Fig 1, B). Every lesion observed on the baseline scan was correlated on the follow-up scan. Lesions no longer identifiable on the interim scan were regarded as complete responders, and these lesions were excluded from further analysis. In addition, only lesions were included that could be reliably delineated on both scans depending on size and signal hyperintensity, as lesions that are too small or only faintly visible are at risk for (false-positive) low ADC values due to background noise measurement. The most hyperintense portion of a lesion would be selected on both scans, rendering automatic three-dimensional delineations. No preset maximum number of lesions eligible for delineation was defined. For every delineation, the mean ADC was automatically calculated. The change of mean ADC after one cycle of immunochemotherapy (ADCratio1cycle) was calculated as follows: ADCratio1cycle = [(ADCI−ADCB)/ADCB] * 100, where ADCB represents the mean ADC on the baseline and ADCI its value on the interim scan. All patients had at least one lesion that could still be evaluated after one cycle of treatment. Therefore, no patients had to be excluded from disease-free survival (DFS) analysis.
Figure 1:
A, Whole-body short-tau inversion-recovery (STIR) image in a 21-year-old female volunteer and overlay of a color-scaled diffusion-weighted image. A region-growing segmentation tool with adaptable threshold allows for the identification of lymph nodes, such as the axillary nodes in this patient (arrow). B, Whole-body STIR image and color-scaled diffusion-weighted image overlay in a 50-year-old man with stage IV mantle cell lymphoma. The large mediastinal mass (arrow) was segmented using a high threshold to include only the most hyperintense component of the mass, excluding the central necrotic portion of the tumor (*). Also shown is a large solid retroperitoneal mass (arrowhead).
18F-FDG PET/CT images were assessed qualitatively without standard uptake value measurement and read in consensus by two nuclear medicine physicians, a senior resident (C.A.V.K.) and a board-certified physician with 10 years of experience (O.G.), who were aware of the diagnosis but blinded for clinical or other imaging data. All 18F-FDG–avid lesions were assessed using the five-point scale Deauville criteria (Appendix E2 [supplement]).
Repeatability.— For the patient cohort, lesion delineations were repeated by observer 2 (G.M.A., junior radiology resident) on the baseline scan of five randomly chosen participants. Regarding the volunteer cohort, observer 1 delineated up to three whole lymph nodes per nodal region (Fig 1, B) (inguinal, iliac, retroperitoneal, mesenteric, mediastinal, axillary, cervical, and tonsils) on both baseline and repeat scan to assess intra-observer repeatability. In five randomly selected volunteers, observer 2 repeated the measurements on the baseline scan.
Patient outcome.— Complete remission was defined as the absence of disease clinically and at imaging after treatment until the end of follow-up. Unequivocal persistent posttreatment disease at imaging or pathologic examination was considered primary progressive disease. Recurrent disease was consistent with the development of any new lesion after initial posttreatment complete response. Median follow-up time was 48 months (range, 2–48 months).
Statistical Analysis
Statistical analysis was performed by K.N.D.P., senior radiology resident, and F.D.K., senior computer science engineer, using SPSS 13.0 for Windows (SPSS). A P value less than .05 was considered statistically significant.
Treatment response assessment.— Per-lesion analysis was performed to assess the behavior of nodal, bone, and extranodal lesions in patients with good (complete remission) and poor outcome (progressive disease or recurrent disease) for the purpose of per-patient thresholding and treatment response analysis and is summarized in Table E1 (supplement). Being a highly chemosensitive tumor type, it is expected that most lymphoma lesions show some treatment response. However, especially in poor responders, this response is heterogeneous, and it is key to identify the lesion that is most likely to be refractory to treatment, as this will determine final patient outcome. Therefore, for the per-patient analysis, the least-responding lesion was selected for the three different tissue types, and receiver operator characteristic analysis was performed with optimal (highest Youden index) cutoff for outcome stratification. Similarly, patients were stratified on the basis of the Deauville score at interim and end 18F-FDG PET/CT (1–3 [complete remission = good outcome] vs 4–5 [partial response or stable disease or progressive disease = poor outcome]); clinical IPI score (low–intermediate low [good] vs intermediate high–high [poor]); low vs high Ki-67 (cutoff based on literature for different NHL types [23]); and absence (good) versus presence (poor) of Bcl-2 or non-germinative B-cell center (GBC)–histologic subtype. The primary outcome measure was DFS defined as the time between the start of therapy and the time of progressive disease and/or recurrent disease or the end of follow-up in case of complete remission. Overall survival analysis was not performed due to the small number of deaths not related to progressive disease. Kaplan-Meier survival analysis was performed with univariable and multivariable Cox proportional hazards regression for WB-DW MRI, interim and end 18F-FDG PET/CT, IPI score, and prognostic histopathologic factors.
Repeatability.— Mean difference with limits of agreement and intraclass correlation coefficient (ICC) was calculated to determine intra- and interobserver repeatability and significant differences between ADC measurements.
Results
Study Participants
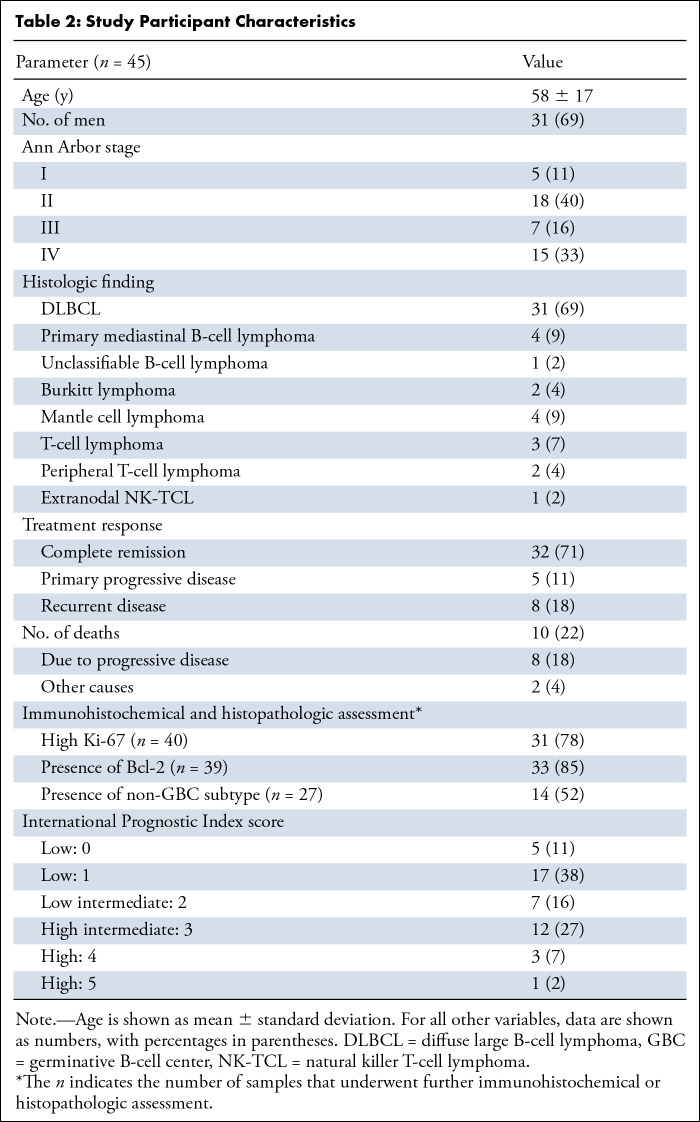
Of 69 initially enrolled patients, data of 45 patients (mean age, 58 years ± 17; 31 men) were available for analysis. A total of 24 patients were excluded because they either did not meet the eligibility criteria (n = 3), withdrew informed consent (n = 8), were lost on follow-up (n = 10), or cause of death was not due to progression (n = 3). Figure 2 shows the flowchart of participant inclusion. Patient characteristics are summarized in Table 2, including the results of routinely determined clinical scores (IPI, n = 45) and histopathologic prognostic markers (Ki-67 [n = 40]; GBC vs non-GBC [n = 27]; and presence of Bcl-2 expression in B-cell lymphomas [n = 39]). Interim 18F-FDG PET/CT was performed in 42 of 45 patients. No end-of-treatment 18F-FDG PET/CT was performed in three other participants due to severe deterioration of their clinical condition. Participants were treated with different immunochemotherapy regimens depending on their tumor type (Appendix E3 [supplement]). Thirty-two patients attained complete remission, five demonstrated progressive disease, and eight presented with disease recurrence. Second-line treatment (with palliative intent) was initiated in five patients, and one patient received additional radiation therapy on the affected nodal region; seven patients had salvage treatment. Ultimately, eight patients died due to disease progression. Nineteen volunteers were included (mean age, 22 years ± 3; seven men) for the repeatability study.
Figure 2:
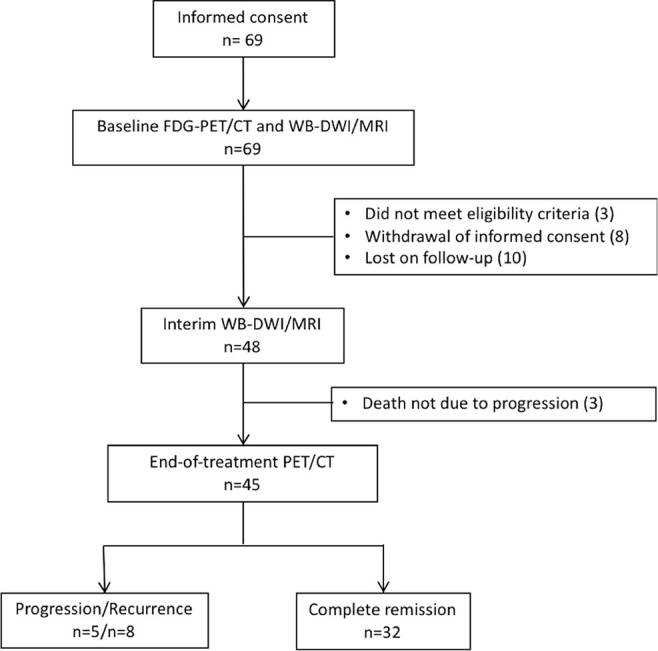
Consolidated Standards of Reporting Trials diagram of patient inclusion. FDG = fluorodeoxyglucose, WB-DWI = whole-body diffusion-weighted imaging.
Table 2:
Study Participant Characteristics
Per-Patient Analysis for Treatment Response Assessment
The least-responding lesion was selected per tissue type, and participants with a poor outcome were identified using the following tissue-specific cutoffs: an ADCratio1cycle increase of less than −0.23% (area under the receiver operating characteristic curve [AUC], 0.77 [95% CI: 0.61, 0.92]) for nodal disease, an ADCratio1cycle increase of more than 67.8% (AUC, 1.00 [95% CI: 1.00, 1.00]) for bone disease, and an ADCratio1cycle increase of less than 36.1% for extranodal disease (AUC, 0.75 [95% CI: 0.46, 1.00]). A patient showing a too low (nodal and extranodal) or too high (bone) ADCratio1cycle increase would be categorized as poor outcome on the basis of these cutoffs.
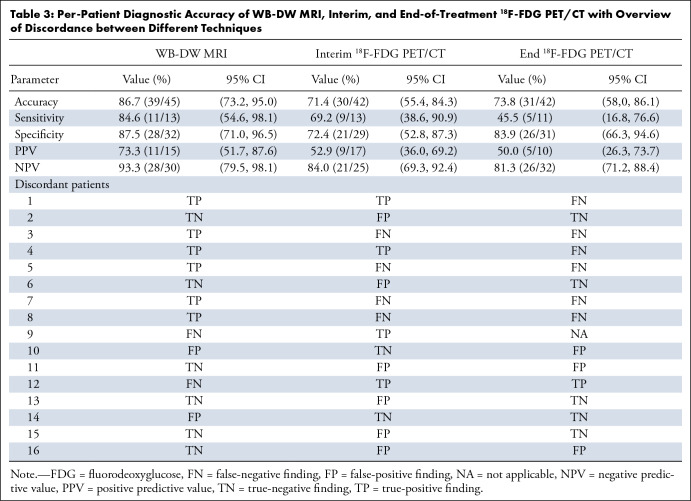
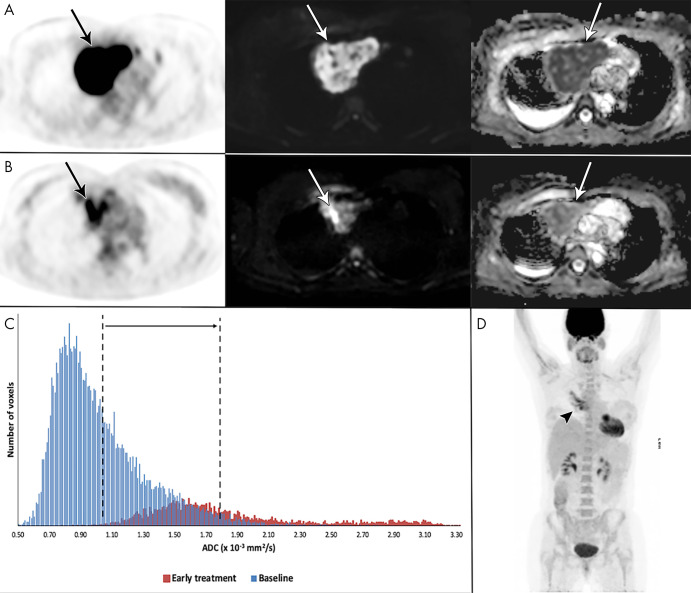
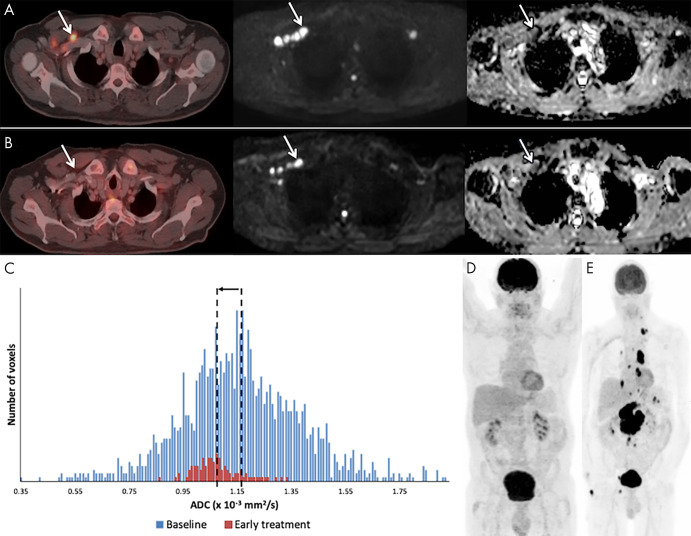
Using this approach, WB-DW MRI outcome stratification was based on nodal disease in 32 patients, on nodal in combination with bone (n = 3) or extranodal (n = 3) disease in six patients, on bone (n = 1) or extranodal (n = 4) disease only in five patients, and on all three tissue types in two patients. WB-DW MRI predicted treatment outcome at 48 months correctly in 86.7% (39 of 45 participants), compared with 71.4% (30 of 42) on the basis of interim 18F-FDG PET/CT assessment and 73.8% (31 of 42) on the basis of end-of-treatment 18F-FDG PET/CT. Agreement between WB-DW MRI and interim 18F-FDG PET/CT was 66.7% (28 of 42), while WB-DW MRI agreed with end-of-treatment 18F-FDG PET/CT in 76.2% (32 of 42). Diagnostic accuracy per imaging technique and an overview of discrepancies are given in Table 3; patient examples of agreement and disagreement are shown in Figures 3 and 4.
Table 3:
Per-Patient Diagnostic Accuracy of WB-DW MRI, Interim, and End-of-Treatment 18F-FDG PET/CT with Overview of Discordance between Different Techniques
Figure 3:
Example of a 41-year-old woman with stage I primary mediastinal B-cell lymphoma. A, Mediastinal mass (arrow) with high fluorine 18 (18F) fluorodeoxyglucose (FDG) uptake at 18F-FDG PET/CT (left), high b1000 signal at diffusion-weighted (DW) imaging (middle), and low signal on apparent diffusion coefficient (ADC) map (right). B, After 2 weeks, 18F-FDG uptake of the mass (arrow) was in keeping with good partial response. DW imaging shows decreased signal on the b1000 images and marked increase of ADC (from 1.02 to 1.80 × 10⁻³ mm2/sec), confirmed on, C, the ADC histogram, indicating good outcome. D, End-of-treatment 18F-FDG PET/CT shows inflammatory changes (arrowhead), yet complete remission, which was maintained until the end of follow-up.
Figure 4:
Example of a 59-year-old male patient with stage IV diffuse large B-cell lymphoma with recurrent disease. A, At baseline, fluorine 18 (18F) fluorodeoxyglucose (FDG) PET/CT (left), b1000 diffusion-weighted (DW) imaging (middle), and corresponding apparent diffusion coefficient (ADC) map (right) demonstrate involvement of right cervical lymph nodes (arrow). B, After 3 weeks of therapy, the 18F-FDG PET/CT scan was negative to disease, but at DW imaging the nodes (arrow) still show high b1000 signal intensity and low ADC. C, Although the ADC-derived histogram shows a marked volume decrease, there is also a decrease in ADCmean (from 1.16 to 1.07 × 10⁻³ mm2/sec), rendering this a poor outcome. D, End 18F-FDG PET/CT still shows complete remission. E, After 20 months, a follow-up 18F-FDG PET/CT shows recurrent disease in multiple lymph node regions above and below the diaphragm.
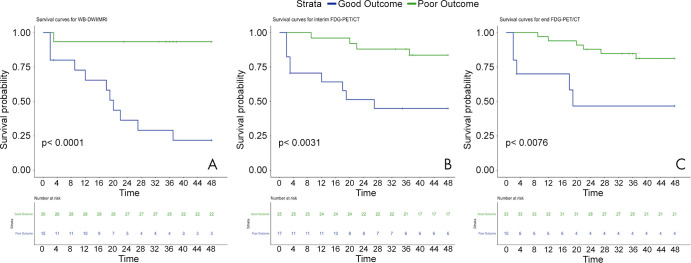
Cox univariable analysis (Table 4) showed that WB-DW MRI (P < .001) and interim (P = .008) and end 18F-FDG PET/CT (P = .017) were correlated with outcome, while IPI score trended toward significance (P = .05). Subsequent multivariable analysis demonstrated WB-DW MRI as the only prognostic parameter (P = .002). Kaplan-Meier survival analysis curves of DFS for WB-DW MRI and interim and end 18F-FDG PET/CT are demonstrated in Figure 5.
Table 4:
Cox Regression Univariable and Multivariable Analysis for Disease-free Survival
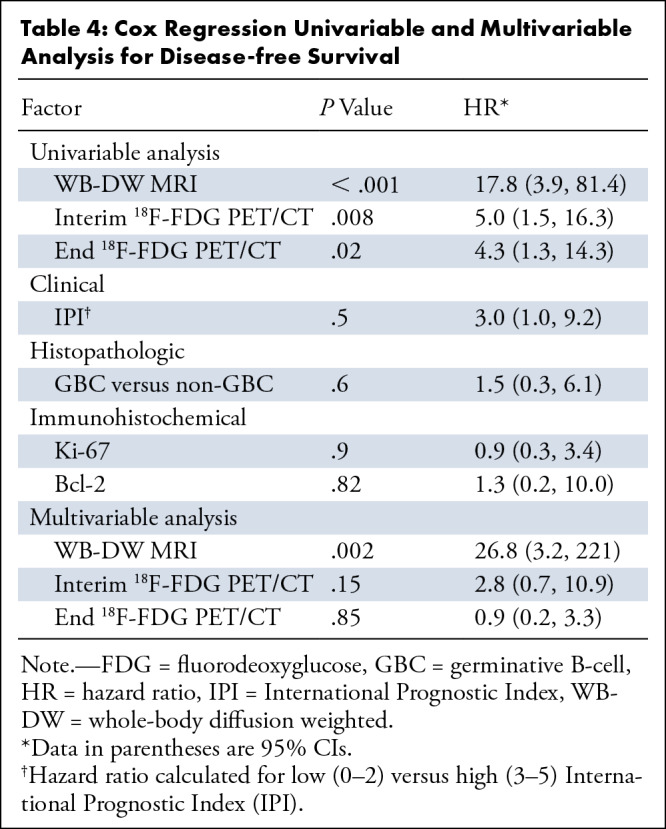
Figure 5:
Kaplan-Meier survival curves of disease-free survival on the basis of whole-body diffusion-weighted (WB-DWI) MRI and interim and end-of treatment fluorine 18 (18F) fluorodeoxyglucose (FDG) PET/CT assessment of treatment response.
Repeatability
For the volunteer cohort, an excellent intra- and interobserver ICC of 0.86 (95% CI: 0.81, 0.90) and 0.92 (95% CI: 0.89, 0.94), respectively, was found for ADC measurements. The mean difference between measurements was 2.46 × 10⁻⁵ mm2/sec (limits of agreement: −35.4–40.3) for the intraobserver repeatability and 0.050 × 10⁻⁵ mm2/sec (limits of agreement: −2.92–3.02) for the interobserver repeatability. Similarly, an excellent ICC of 0.99 (95% CI: 0.98, 0.99) was demonstrated for the interobserver repeatability in the patient cohort; the mean difference was −0.771 × 10⁻⁵ mm2/sec (limits of agreement: −2.40–0.86).
Discussion
The purpose of this study was to assess whether quantitative analysis of WB-DW MRI might serve as an early prognostic imaging feature in aggressive NHL. Our results showed that the ADCratio1cycle of malignant lesions after only one cycle of treatment allowed for good prediction of patient outcome. Prognostic accuracy of quantitative WB-DW MRI proved noninferior to interim and end-of-treatment 18F-FDG PET/CT, attaining an accuracy of 86.7% (39 of 45 patients) compared with 71.4% (30 of 42) for interim 18F-FDG PET/CT and 73.8% (31 of 42) for end-of-treatment 18F-FDG PET/CT, which is currently the clinical standard.
Only a few small-sized studies have reported on the use of WB-DW MRI for early treatment assessment in lymphoma (10,11,13–17,24,25). Similar to the current study, quantitative WB-DW MRI was used to assess treatment response by means of mean ADC changes after 1 to 2 weeks of therapy. In concurrence with our results, all but one group found that nodal mean ADC increased in responding tumor lesions. A xenograft study of Huang et al (10) correlated this increase of mean ADC with a significant decrease in proliferating cell density and a higher fraction of apoptotic cells. Our results are also in line with a pilot study (11) that showed that WB-DW MRI performed 2 weeks after therapy initiation was predictive of outcome, with responding lesions exhibiting a significantly higher ADC increase than nonresponding lesions. The vast majority of malignant lesions in our population were nodal, compared with a small number of bone lesions. Counterintuitively, bone lesions in patients with a poor outcome demonstrated a higher ADC increase than in those with a good outcome. However, it is known that ADC in bone marrow disease does not follow a linear pattern. Instead, ADC initially increases to reach a plateau, after which ADC decreases inversely proportional to cellularity (26). This pattern is caused by changes in the fat to tumor cellularity ratio of bone marrow. We hypothesize that in lesions with a good outcome, the normal fatty marrow has (partially) returned, reducing the ADC values, while in lesions with poor outcome, the bone marrow is still predominantly populated with tumor cells with no considerable normalization of the bone marrow. Therefore, in response to treatment, good and poor outcome lesions could be on different positions along this curve, with the former attaining ADC values similar to the ADC of less cellular bone marrow, while the poor outcome lesions are possibly still within the hypercellular spectrum.
Several studies on NHL (15) and other tumor types (27,28) reported on the inverse correlation between ADC as a measure for cellularity in WB-DW MRI and the standard uptake value as a measure of metabolic activity in 18F-FDG PET/CT, indicating an association between both imaging techniques. Corresponding with these findings, we found that quantitative WB-DW MRI agreed with interim and end-of-treatment 18F-FDG PET/CT in 66.7% and 72.1% of participants, respectively. Furthermore, the current study showed that WB-DW MRI was a better predictor of outcome than both interim and end-of-treatment 18F-FDG PET/CT. As expected, a considerably higher number of false-positives results were found at the interim 18F-FDG PET/CT compared with quantitative WB-DW MRI, indicated by a positive predictive value of 52.9% versus 73.3%, respectively. The role of interim 18F-FDG PET/CT in aggressive NHL is controversial (29), as the inflammatory response induced by immunotherapy causes nonspecific tracer uptake of 18F-FDG, resulting in a lower positive predictive value reportedly between 33% and 100% (4,9,30–37). In contrast, previous studies, mostly in head and neck tumors (38,39), have demonstrated the ability of DW MRI to accurately differentiate treatment-induced inflammatory changes from residual or recurrent tumor. Currently, end-of-treatment 18F-FDG PET/CT is the standard imaging tool to assess treatment response in aggressive NHL. In our cohort, end 18F-FDG PET/CT attained lower accuracy to predict outcome on a per-patient basis compared with WB-DW MRI. This might have been due to metabolic depletion in small remnant lesions at the resolution limit of 18F-FDG PET/CT (40). Additionally, WB-DW MRI performed early during treatment has the advantage that most lesions are still visible, allowing for the identification of more resistant sites of disease, which may be no longer identifiable at the end of treatment.
The IPI score is a routinely used clinical tool for risk stratification and prognosis prediction in aggressive NHL (41). Additionally, a non-GBC histopathologic subtype and the presence of immunohistochemical parameters such as Bcl-2 or a high Ki-67 index have also shown to correlate with a worse outcome (17,18,38,39,42,43). Although IPI trended toward significance, histopathologic factors were not useful to predict patient outcome. This is probably due to the sample size being too small to reveal any significant results. Nevertheless, our findings suggest that imaging features assessed at quantitative WB-DW MRI could be a more sensitive tool to predict patient prognosis.
This study had several limitations. First, quantitative WB-DW MRI was highly predictive of outcome on the basis of assessment of nodal and bone lesion. However, early treatment response assessment of extranodal disease was less accurate and may be challenging in a small number of patients presenting with extranodal disease only. Second, analysis was secondary after prospective participant inclusion, and calculated ADCratio1cycle cutoff values are optimal thresholds for this data set and likely to be overfitted. As such, accuracy might therefore be higher than in subsequent larger scale studies. In addition, the quantitative analysis is time-consuming, with segmentations and calculations taking up approximately 20 minutes per patient, and more intuitive and ideally automated measurements are needed to allow for its use in clinical practice. Future studies should also aim to find means of standardizing ADC measurements, potentially in combination with qualitative criteria, similar to standard uptake value in 18F-FDG PET/CT, to allow for reliable and faster assessments. Finally, our study population was quite small, inherently related to the single-center study design, and larger—preferably multicenter—studies are needed to confirm our results. However, we believe that our results provide a firm base to initiate future prospective validation studies of this kind.
In conclusion, assessment of ADC changes at quantitative WB-DW MRI performed after one treatment cycle in aggressive NHL was the only independent predictor of patient outcome, with a prognostic performance demonstrated to be noninferior to interim or end-of-treatment 18F-FDG PET/CT. Pending further validation in larger-scaled multicenter studies, WB-DW MRI may be a promising radiation-free imaging feature allowing for early outcome stratification in patients with aggressive NHL.
APPENDIX
Authors declared no funding for this work.
Disclosures of Conflicts of Interest: K.N.D.P. disclosed no relevant relationships. C.A.V.K. disclosed no relevant relationships. G.M.A. disclosed no relevant relationships. F.D.K. disclosed no relevant relationships. O.G. Activities related to the present article: disclosed no relevant relationships. Activities not related to the present article: author received consultancy fees from IBA and payment for lectures including service on speakers bureaus from Pfizer. Other relationships: disclosed no relevant relationships. O.B. disclosed no relevant relationships. P.W. disclosed no relevant relationships. D.D. disclosed no relevant relationships. A.J. disclosed no relevant relationships. G.V. disclosed no relevant relationships. R.O. disclosed no relevant relationships. M.K. disclosed no relevant relationships. V.V. disclosed no relevant relationships.
Abbreviations:
- ADC
- apparent diffusion coefficient
- DFS
- disease-free survival
- FDG
- fluorodeoxyglucose
- GBC
- germinative B cell
- ICC
- intraclass correlation coefficient
- IPI
- International Prognostic Index
- NHL
- non-Hodgkin lymphoma
- WB-DW
- whole-body diffusion weighted
References
- 1.Dotan E, Aggarwal C, Smith MR. Impact of Rituximab (Rituxan) on the Treatment of B-Cell Non-Hodgkin’s Lymphoma. P&T 2010;35(3):148–157. [PMC free article] [PubMed] [Google Scholar]
- 2.Siegel RL, Miller KD, Jemal A. Cancer statistics, 2019. CA Cancer J Clin 2019;69(1):7–34. [DOI] [PubMed] [Google Scholar]
- 3.Johnson P, Federico M, Kirkwood A, et al. Adapted Treatment Guided by Interim PET-CT Scan in Advanced Hodgkin’s Lymphoma. N Engl J Med 2016;374(25):2419–2429. [DOI] [PMC free article] [PubMed] [Google Scholar]
- 4.Kostakoglu L, Cheson BD. Current role of FDG PET/CT in lymphoma. Eur J Nucl Med Mol Imaging 2014;41(5):1004–1027. [DOI] [PubMed] [Google Scholar]
- 5.Valls L, Badve C, Avril S, et al. FDG-PET imaging in hematological malignancies. Blood Rev 2016;30(4):317–331. [DOI] [PMC free article] [PubMed] [Google Scholar]
- 6.Adams HJA, Nievelstein RAJ, Kwee TC. Prognostic value of interim FDG-PET in Hodgkin lymphoma: systematic review and meta-analysis. Br J Haematol 2015;170(3):356–366. [DOI] [PubMed] [Google Scholar]
- 7.Albano D, Laudicella R, Ferro P, et al. The Role of 18F-FDG PET/CT in Staging and Prognostication of Mantle Cell Lymphoma: An Italian Multicentric Study. Cancers (Basel) 2019;11(12):1831. [DOI] [PMC free article] [PubMed] [Google Scholar]
- 8.Adams HJA, Nievelstein RAJ, Kwee TC. Prognostic value of complete remission status at end-of-treatment FDG-PET in R-CHOP-treated diffuse large B-cell lymphoma: systematic review and meta-analysis. Br J Haematol 2015;170(2):185–191. [DOI] [PubMed] [Google Scholar]
- 9.Pregno P, Chiappella A, Bellò M, et al. Interim 18-FDG-PET/CT failed to predict the outcome in diffuse large B-cell lymphoma patients treated at the diagnosis with rituximab-CHOP. Blood 2012;119(9):2066–2073. [DOI] [PubMed] [Google Scholar]
- 10.Huang MQ, Pickup S, Nelson DS, et al. Monitoring response to chemotherapy of non-Hodgkin’s lymphoma xenografts by T(2)-weighted and diffusion-weighted MRI. NMR Biomed 2008;21(10):1021–1029. [DOI] [PMC free article] [PubMed] [Google Scholar]
- 11.De Paepe K, Bevernage C, De Keyzer F, et al. Whole-body diffusion-weighted magnetic resonance imaging at 3 Tesla for early assessment of treatment response in non-Hodgkin lymphoma: a pilot study. Cancer Imaging 2013;13(1):53–62. [DOI] [PMC free article] [PubMed] [Google Scholar]
- 12.Holzapfel K, Duetsch S, Fauser C, Eiber M, Rummeny EJ, Gaa J. Value of diffusion-weighted MR imaging in the differentiation between benign and malignant cervical lymph nodes. Eur J Radiol 2009;72(3):381–387. [DOI] [PubMed] [Google Scholar]
- 13.Horger M, Claussen C, Kramer U, Fenchel M, Lichy M, Kaufmann S. Very early indicators of response to systemic therapy in lymphoma patients based on alterations in water diffusivity--a preliminary experience in 20 patients undergoing whole-body diffusion-weighted imaging. Eur J Radiol 2014;83(9):1655–1664. [DOI] [PubMed] [Google Scholar]
- 14.Hagtvedt T, Seierstad T, Lund KV, et al. Diffusion-weighted MRI compared to FDG PET/CT for assessment of early treatment response in lymphoma. Acta Radiol 2015;56(2):152–158. [DOI] [PubMed] [Google Scholar]
- 15.Wu X, Kellokumpu-Lehtinen PL, Pertovaara H, et al. Diffusion-weighted MRI in early chemotherapy response evaluation of patients with diffuse large B-cell lymphoma--a pilot study: comparison with 2-deoxy-2-fluoro- D-glucose-positron emission tomography/computed tomography. NMR Biomed 2011;24(10):1181–1190. [DOI] [PubMed] [Google Scholar]
- 16.Wu X, Nerisho S, Dastidar P, et al. Comparison of different MRI sequences in lesion detection and early response evaluation of diffuse large B-cell lymphoma--a whole-body MRI and diffusion-weighted imaging study. NMR Biomed 2013;26(9):1186–1194. [DOI] [PubMed] [Google Scholar]
- 17.Chen Y, Zhong J, Wu H, Chen N. The clinical application of whole-body diffusion-weighted imaging in the early assessment of chemotherapeutic effects in lymphoma: the initial experience. Magn Reson Imaging 2012;30(2):165–170. [DOI] [PubMed] [Google Scholar]
- 18.De Paepe KN, De Keyzer F, Wolter P, et al. Improving lymph node characterization in staging malignant lymphoma using first-order ADC texture analysis from whole-body diffusion-weighted MRI. J Magn Reson Imaging 2018;48(4):897–906. [DOI] [PubMed] [Google Scholar]
- 19.Broyde A, Boycov O, Strenov Y, Okon E, Shpilberg O, Bairey O. Role and prognostic significance of the Ki-67 index in non-Hodgkin’s lymphoma. Am J Hematol 2009;84(6):338–343. [DOI] [PubMed] [Google Scholar]
- 20.Batlle-López A, González de Villambrosía S, Francisco M, et al. Stratifying diffuse large B-cell lymphoma patients treated with chemoimmunotherapy: GCB/non-GCB by immunohistochemistry is still a robust and feasible marker. Oncotarget 2016;7(14):18036–18049. [DOI] [PMC free article] [PubMed] [Google Scholar]
- 21.Sehn LH, Berry B, Chhanabhai M, et al. The revised International Prognostic Index (R-IPI) is a better predictor of outcome than the standard IPI for patients with diffuse large B-cell lymphoma treated with R-CHOP. Blood 2007;109(5):1857–1861. [DOI] [PubMed] [Google Scholar]
- 22.Malayeri AA, El Khouli RH, Zaheer A, et al. Principles and applications of diffusion-weighted imaging in cancer detection, staging, and treatment follow-up. RadioGraphics 2011;31(6):1773–1791. [DOI] [PMC free article] [PubMed] [Google Scholar]
- 23.Li ZM, Huang JJ, Xia Y, et al. High Ki-67 expression in diffuse large B-cell lymphoma patients with non-germinal center subtype indicates limited survival benefit from R-CHOP therapy. Eur J Haematol 2012;88(6):510–517. [DOI] [PubMed] [Google Scholar]
- 24.Albano D, Patti C, Matranga D, Lagalla R, Midiri M, Galia M. Whole-body diffusion-weighted MR and FDG-PET/CT in Hodgkin Lymphoma: Predictive role before treatment and early assessment after two courses of ABVD. Eur J Radiol 2018;103:90–98. [DOI] [PubMed] [Google Scholar]
- 25.Sun M, Cheng J, Zhang Y, Wang F, Meng Y, Fu X. Application value of diffusion weighted whole body imaging with background body signal suppression in monitoring the response to treatment of bone marrow involvement in lymphoma. J Magn Reson Imaging 2016;44(6):1522–1529. [DOI] [PubMed] [Google Scholar]
- 26.Padhani AR, Koh DM. Diffusion MR imaging for monitoring of treatment response. Magn Reson Imaging Clin N Am 2011;19(1):181–209. [DOI] [PubMed] [Google Scholar]
- 27.Ho KC, Lin G, Wang JJ, Lai CH, Chang CJ, Yen TC. Correlation of apparent diffusion coefficients measured by 3T diffusion-weighted MRI and SUV from FDG PET/CT in primary cervical cancer. Eur J Nucl Med Mol Imaging 2009;36(2):200–208. [DOI] [PubMed] [Google Scholar]
- 28.Baba S, Isoda T, Maruoka Y, et al. Diagnostic and prognostic value of pretreatment SUV in 18F-FDG/PET in breast cancer: comparison with apparent diffusion coefficient from diffusion-weighted MR imaging. J Nucl Med 2014;55(5):736–742. [DOI] [PubMed] [Google Scholar]
- 29.Terasawa T, Lau J, Bardet S, et al. Fluorine-18-fluorodeoxyglucose positron emission tomography for interim response assessment of advanced-stage Hodgkin’s lymphoma and diffuse large B-cell lymphoma: a systematic review. J Clin Oncol 2009;27(11):1906–1914. [DOI] [PubMed] [Google Scholar]
- 30.Horning SJ, Juweid ME, Schöder H, et al. Interim positron emission tomography scans in diffuse large B-cell lymphoma: an independent expert nuclear medicine evaluation of the Eastern Cooperative Oncology Group E3404 study. Blood 2010;115(4):775–777; quiz 918. [DOI] [PMC free article] [PubMed] [Google Scholar]
- 31.Cashen AF, Dehdashti F, Luo J, Homb A, Siegel BA, Bartlett NL. 18F-FDG PET/CT for early response assessment in diffuse large B-cell lymphoma: poor predictive value of international harmonization project interpretation. J Nucl Med 2011;52(3):386–392. [DOI] [PMC free article] [PubMed] [Google Scholar]
- 32.Itti E, Lin C, Dupuis J, et al. Prognostic value of interim 18F-FDG PET in patients with diffuse large B-Cell lymphoma: SUV-based assessment at 4 cycles of chemotherapy. J Nucl Med 2009;50(4):527–533. [DOI] [PubMed] [Google Scholar]
- 33.Spaepen K, Stroobants S, Dupont P, et al. Early restaging positron emission tomography with (18)F-fluorodeoxyglucose predicts outcome in patients with aggressive non-Hodgkin’s lymphoma. Ann Oncol 2002;13(9):1356–1363. [DOI] [PubMed] [Google Scholar]
- 34.Mikhaeel NG, Hutchings M, Fields PA, O’Doherty MJ, Timothy AR. FDG-PET after two to three cycles of chemotherapy predicts progression-free and overall survival in high-grade non-Hodgkin lymphoma. Ann Oncol 2005;16(9):1514–1523. [DOI] [PubMed] [Google Scholar]
- 35.Haioun C, Itti E, Rahmouni A, et al. [18F]fluoro-2-deoxy-D-glucose positron emission tomography (FDG-PET) in aggressive lymphoma: an early prognostic tool for predicting patient outcome. Blood 2005;106(4):1376–1381. [DOI] [PubMed] [Google Scholar]
- 36.Zhao J, Qiao W, Wang C, Wang T, Xing Y. Therapeutic evaluation and prognostic value of interim hybrid PET/CT with (18)F-FDG after three to four cycles of chemotherapy in non-Hodgkin’s lymphoma. Hematology 2007;12(5):423–430. [DOI] [PubMed] [Google Scholar]
- 37.Han HS, Escalón MP, Hsiao B, Serafini A, Lossos IS. High incidence of false-positive PET scans in patients with aggressive non-Hodgkin’s lymphoma treated with rituximab-containing regimens. Ann Oncol 2009;20(2):309–318. [DOI] [PMC free article] [PubMed] [Google Scholar]
- 38.Abdel Razek AA, Kandeel AY, Soliman N, et al. Role of diffusion-weighted echo-planar MR imaging in differentiation of residual or recurrent head and neck tumors and posttreatment changes. AJNR Am J Neuroradiol 2007;28(6):1146–1152. [DOI] [PMC free article] [PubMed] [Google Scholar]
- 39.Vandecaveye V, De Keyzer F, Nuyts S, et al. Detection of head and neck squamous cell carcinoma with diffusion weighted MRI after (chemo)radiotherapy: correlation between radiologic and histopathologic findings. Int J Radiat Oncol Biol Phys 2007;67(4):960–971. [DOI] [PubMed] [Google Scholar]
- 40.Adams HJA, Kwee TC. Prognostic value of interim FDG-PET in R-CHOP-treated diffuse large B-cell lymphoma: Systematic review and meta-analysis. Crit Rev Oncol Hematol 2016;106:55–63. [DOI] [PubMed] [Google Scholar]
- 41.International Non-Hodgkin’s Lymphoma Prognostic Factors Project. A predictive model for aggressive non-Hodgkin’s lymphoma. N Engl J Med 1993;329(14):987–994. [DOI] [PubMed] [Google Scholar]
- 42.He X, Chen Z, Fu T, et al. Ki-67 is a valuable prognostic predictor of lymphoma but its utility varies in lymphoma subtypes: evidence from a systematic meta-analysis. BMC Cancer 2014;14(1):153. [DOI] [PMC free article] [PubMed] [Google Scholar]
- 43.Kawamoto K, Miyoshi H, Yoshida N, et al. MYC translocation and/or BCL 2 protein expression are associated with poor prognosis in diffuse large B-cell lymphoma. Cancer Sci 2016;107(6):853–861. [DOI] [PMC free article] [PubMed] [Google Scholar]
Associated Data
This section collects any data citations, data availability statements, or supplementary materials included in this article.


