Summary
Perisynaptic astrocyte processes are an integral part of central nervous system synapses1,2; however, the molecular mechanisms governing astrocyte-synapse adhesions and how astrocyte contacts control synapse formation and function are largely unknown. Here we develop an in vivo chemico-genetic approach, Split-TurboID, that uses a cell surface fragment complementation strategy. We thus identify a proteome enriched at astrocyte-neuron junctions in vivo, including Neuronal Cell Adhesion Molecule (NrCAM). We find that NrCAM is expressed in cortical astrocytes, localized to perisynaptic contacts and is required to restrict neuropil infiltration by astrocytic processes. Furthermore, we show that astrocytic NrCAM transcellularly interacts with neuronal NrCAM that is coupled to gephyrin at inhibitory postsynapses. Depletion of astrocytic NrCAM significantly reduces inhibitory synapse numbers without altering glutamatergic synaptic density. Moreover, loss of astrocytic NrCAM dramatically reduces inhibitory synaptic function with minor effects on excitation. Thus, our results present a proteomic framework for how astrocytes interface with neurons, and reveal how astrocytes control GABAergic synapse formation and function.
The majority of central nervous system (CNS) synapses are ensheathed by tiny astrocytic processes1,2. These astrocytic contacts are an integral functional compartment of the tripartite synapse, which is defined as the combination of pre and postsynaptic neuronal and perisynaptic astrocytic processes3. At the synapse, astrocytes control basal synaptic transmission, neuromodulation, ionic balance and neurotransmitter clearance4–8. Furthermore, astrocyte and synapse development are interdependent processes that are regulated by dynamic bi-directional intercellular communication via secreted factors and cell adhesion molecules (CAMs)9–12. Historically, however, gaining molecular insights into perisynaptic astrocyte-neuron signaling has been hampered due to the lack of biochemical methods to isolate this astrocytic compartment.
To discover novel proteins at the extracellular clefts between astrocytes and neurons, we developed a new chemico-genetic in vivo BioID (iBioID) approach, based on reconstituting the enzymatic activity of a proximity biotinylating enzyme, TurboID13, at astrocyte-neuron junctions (Fig 1a). Recent studies showed that split biotinylation constructs could recover enzymatic activity when they are in close proximity within the cell cytoplasm14,15. Here, we utilized our glycosylphosphatidylinositol anchored reconstitution-activated proteins highlight intercellular connections (GRAPHIC) strategy to direct N- and C-terminal TurboID fragments to the extracellular surface of neurons and astrocytes (Fig. 1a and Extended Data Fig. 1a)16. Among the two Split-TurboID construct pairs we tested in HEK293T cells (Extended Data Fig. 1a), the biotinylation activity of Split 1-TurboID was higher than that of Split 2-TurboID (Extended Data Fig. 1b, lane 8). Therefore, we used Split 1-TurboID for the remainder of this study, which we named N-TurboID and C-TurboID. A GRAPHIC-tagged full-length TurboID construct was also used to biotinylate astrocyte surface proteins, referred to as TurboID-surface (Extended Data Fig. 1a, bottom).
Figure 1. Astrocyte-neuron synaptic cleft proteome using in vivo Split-TurboID.
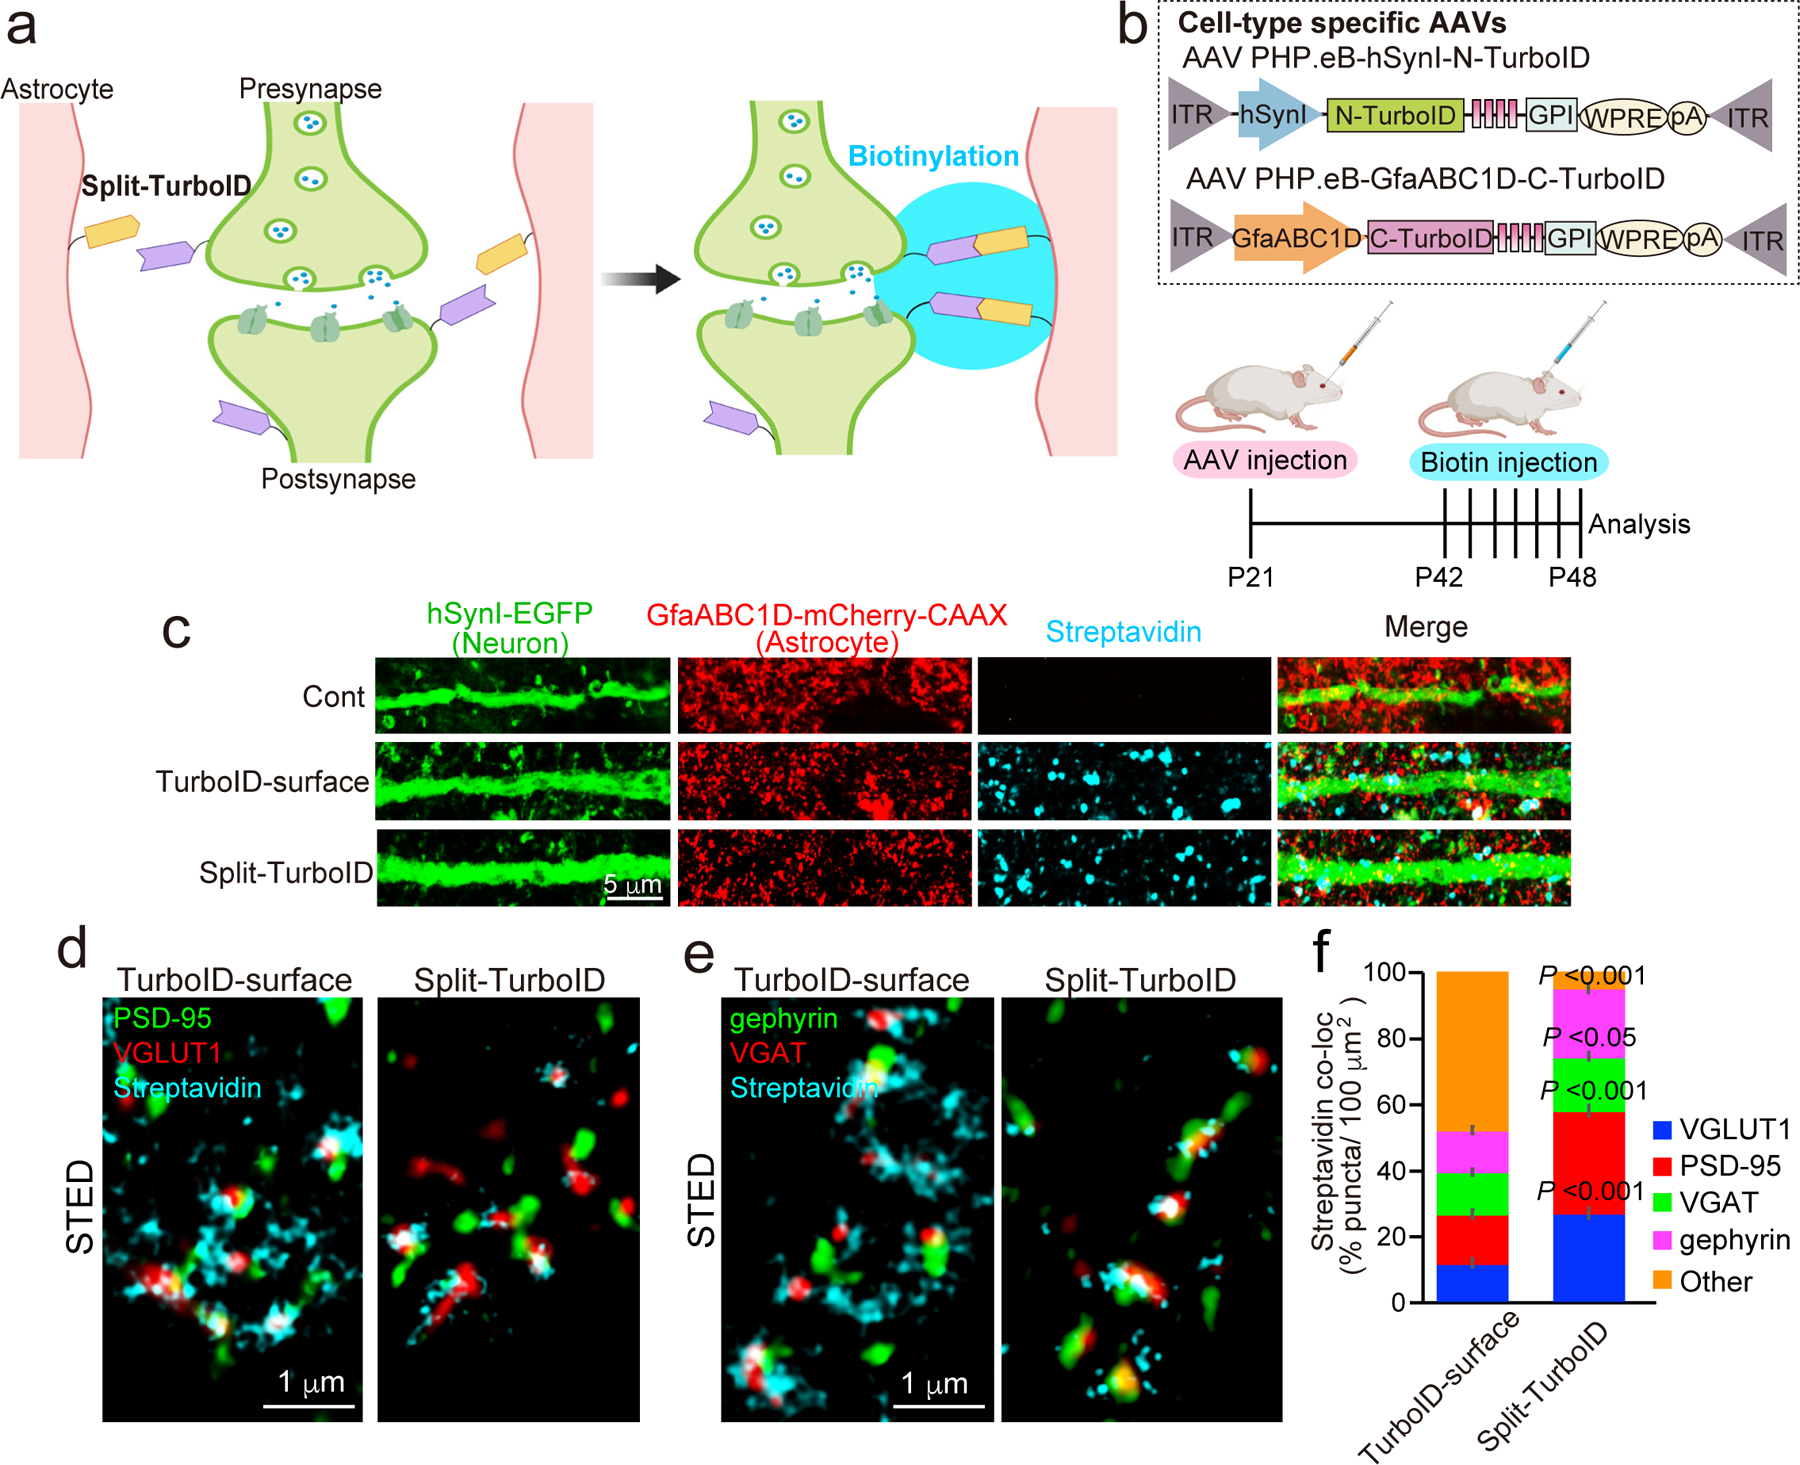
a, Schematic of the Split-surface iBioID approach. b, Outline of Split-TurboID method using cell-type specific AAVs. c, Confocal images of cortical expression of Split-TurboID or TurboID-surface co-expressed with neuronal-EGFP and astrocyte-mCherry-CAAX. d and e, Three-color STED images showing biotinylated proteins adjacent to d) excitatory synaptic markers PSD-95 and VGLUT1, and e) inhibitory synaptic markers gephyrin and VGAT. f, The ratio of biotinylated proteins that was co-localized with VGLUT1, PSD-95, VGAT or gephyrin. n= 15 cells per each condition from 3 mice. n= 3 biological repeats. Student’s t-test (paired, p<0.001, 0.05). Data represent means ± s.e.m.
In astrocyte-neuron co-cultures, astrocytes expressing TurboID-surface under the control of the GfaABC1D promoter17 (Extended Data Fig. 1c) exhibited biotinylation activity along their membranes (Extended Data Fig. 1d). Moreover, the reconstituted activity of Split-TurboID was found only at contacting sites between neurons and astrocytes (Extended Data Fig. 1c), but not when either of the halves were expressed alone (Extended Data Fig. 1d). To examine whether TurboID-surface or Split-TurboID biotinylates tripartite synapses in these cultures, astrocytes were co-transduced with GfaABC1D-mCherry-CAAX to mark astrocyte membranes, and synapses were labeled using immunostaining with pre and postsynaptic makers (excitatory: VGLUT1/Homer 1; inhibitory: VGAT/gephyrin). Both constructs mediated biotinylation that overlapped with astrocytic membranes and closely associated with excitatory and inhibitory synaptic markers (Extended Data Fig. 2a–d), demonstrating the functional reconstitution of TurboID transcellularly at perisynaptic astrocyte-neuron junctions in vitro.
To test their activity in vivo, the constructs were introduced into mouse brain astrocytes and/or neurons via retro-orbital injections of adeno-associated viruses (AAV) 18 at P21 (Fig. 1b, Extended Data Fig. 3a–c) and the mice were given subcutaneous biotin injections starting at P42 for 7 days (Fig. 1b)19. Biotinylated proteins were detected by immunoblotting and immunohistochemistry (Extended Data Fig. 4a–d) both for astrocyte-specific TurboID-surface and reconstituted Split-TurboID constructs. However, when Split-TurboID fragments were expressed alone, no biotinylation was observed (Extended Data Fig. 4a–c). These results show that extracellular biotinylation is achieved by TurboID-surface and the Split-TurboID constructs in vivo.
To confirm that biotinylated proteins localize to neuron-astrocyte contacts, we labeled neurons with EGFP (AAV PHP.eB-hSynI-EGFP) and astrocyte membranes with mCherry-CAAX (AAV PHP.eB-GfaBC1D-mCherry-CAAX) and co-injected either astrocyte-specific TurboID-surface or Split-TurboID-expressing viruses. Biotinylated proteins in both conditions were located at the contacts between astrocytic and neuronal processes (Fig. 1c). Using super resolution stimulated emission depletion (STED) microscopy, we found that biotinylated proteins surround excitatory and inhibitory synapses (Fig. 1d–e). More than 50% of TurboID-surface-induced biotinylation and over 90% of Split-TurboID-induced biotinylation closely associated with synaptic markers (Fig. 1f). The densities of synapses were not affected by either labeling approach (Extended Data Fig. 4e–f). Taken together, these results show that the TurboID-surface and Split-TurboID constructs effectively biotin-label perisynaptic contacts between astrocytes and neurons in vivo.
Perisynaptic cleft proteome discovery
To identify the tripartite synaptic proteins proteomically, proteins biotinylated by Split-TurboID or astrocyte-specific TurboID-surface constructs were purified and subjected to quantitative high-resolution liquid chromatography-tandem mass spectrometry (Fig. 2a). When combined, the Split-TurboID and astrocyte-specific TurboID-surface datasets identified 776,376 peptides corresponding to 3,171 unique proteins (Extended Data Fig.4g). From three independent experiments and after removal of known contaminants19, 173 or 178 proteins were found to be significantly enriched (1.5. fold) in Split-TurboID or astrocyte-specific TurboID-surface fractions, respectively, compared to soluble TurboID control (Extended Data Fig. 4g–i, Supplementary Table 1–2). This enrichment approach is stringent, and thus may not identify all astrocytic proteins that are present at perisynaptic processes as it will only pick those that are overrepresented at synapses compared to other compartments.
Figure 2. Astrocyte-neuron synaptic cleft proteome.
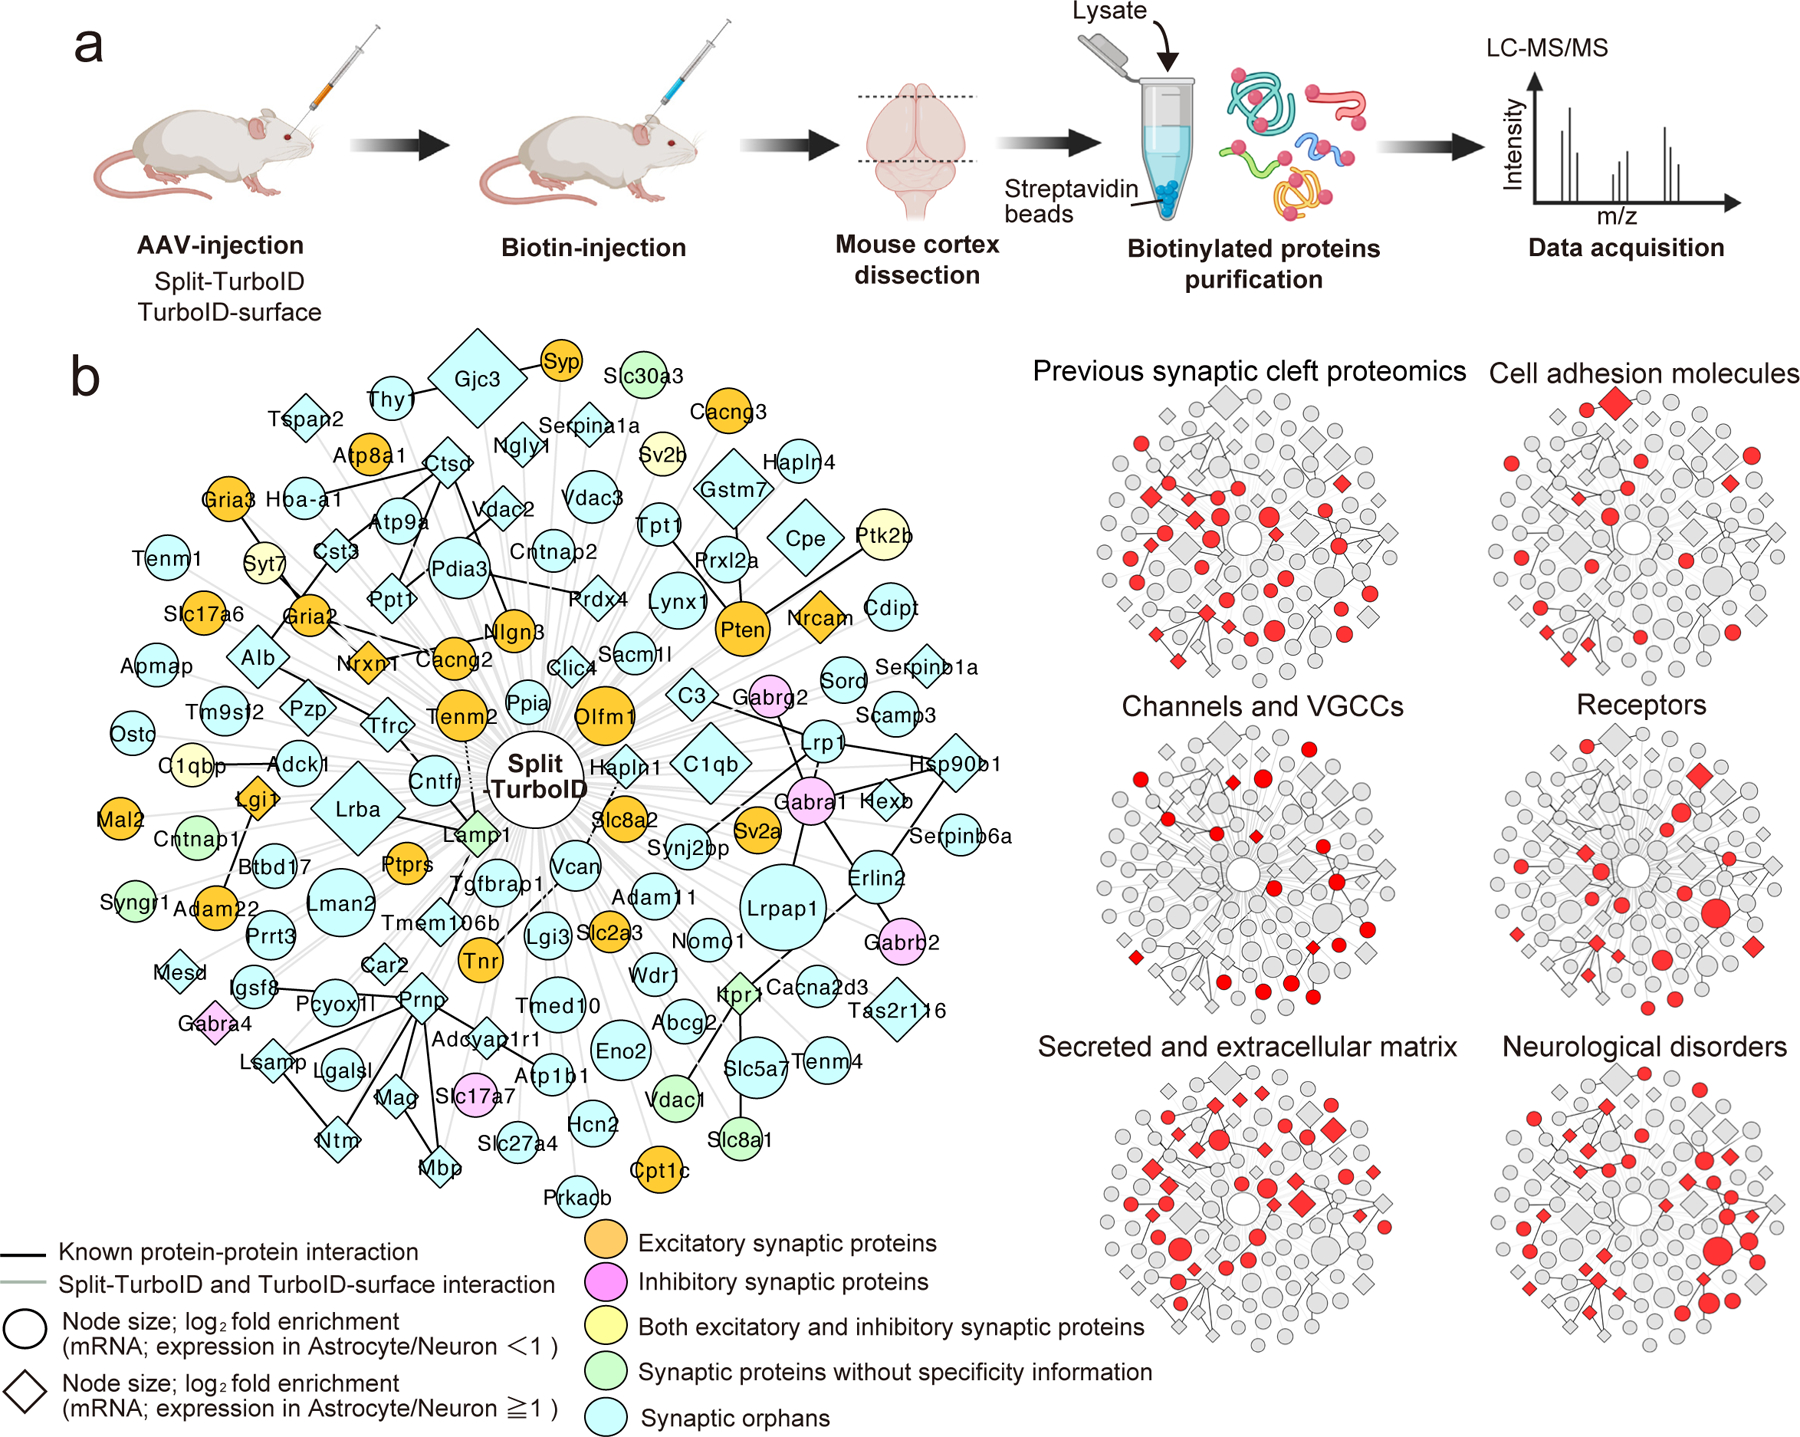
a, Outline of proteomic approach. b, Left, Overlapping high-confidence proteins shared between the Split-TurboID and TurboID-surface enriched fractions. Right, Clustergram topology of proteins in selected functional categories. Note: node titles are gene name; size represents fold-enrichment over negative control. Neuronal enriched proteins (RNAseq expression ratio<1) and astrocyte enriched proteins (RNAseq expression ratio≧1.0) are represented as circle or diamond, respectively. Edges are shaded according to types of interactions (gray, iBioIDs; black, protein-protein interactions previously reported).
118 proteins were shared in both data sets, yielding a high-confidence tri-partite synapse proteome (Fig. 2b, Extended Data Fig. 4g–i, Supplementary Table 3). This list includes known tripartite synapse proteins such as Neuroligin-3 and Neurexin I9, calcium channel auxiliary subunits that also regulate glutamate receptor trafficking (Cacna2d3, Cacng2–3), excitatory synaptic proteins such as AMPA receptors (Gria2–3), and inhibitory synaptic proteins such as GABAA receptors (Gabra1, Gabra4, Gabrb2, Gabrg2) (Fig. 2b). By referencing our proteomics dataset with cell type-specific gene expression databases20,21, we found that mRNA for 33 of these proteins were astrocyte-enriched (RNAseq expression ratio >1.0, diamonds in Fig. 2b), 76 were neuron-enriched (circles in Fig. 2b) and 5 proteins had equal or unknown distribution (Fig. 2b). Bioinformatic analysis showed that our high confidence tripartite proteome contained known synaptic cleft proteins (29 proteins, 25%), cell adhesion proteins (18 proteins, 15%), channels (18 proteins, 15%), G protein-coupled receptors and associated proteins (4 proteins, 3%), other receptors and associated proteins (16 proteins, 14%), secreted or extracellular matrix components (34 proteins, 29%) and those encoded by genes implicated in disorders, including autism spectrum disorder, and schizophrenia (34 proteins, 29%) (Fig. 2b).
Adhesions between astrocytes and neurons play critical roles in orchestrating the concurrent development of synapses and morphogenesis of astrocytes9,22. To identify novel regulators of this process, we selected Teneurin-2 (Tenm2), Teneurin-4 (Tenm4) and Neuronal Cell Adhesion Molecule (NrCAM) as candidate bridging molecules between astrocytes and neurons. To deplete target proteins in astrocytes, we used a Clustered Regularly Interspaced Short Palindromic Repeats (CRISPR)-based approach. We confirmed depletion of astrocytic NrCAM via this approach, using an available antibody for quantitative western blot analysis (Extended Data Fig. 5a). NrCAM sgRNA in combination with astrocyte-specific Cas9 significantly diminished the level of NrCAM protein in mixed neuron-astrocyte cultures, which could be rescued by re-expression of sgRNA-resistant human NrCAM in astrocytes (Extended Data Fig. 5b,c). Next, we used this astrocyte-specific CRISPR-based approach in vivo to rapidly gain preliminary, albeit not conclusive, data on candidate proteins (Extended Data Fig. 5d,e)23. We retro-orbitally injected AAVs containing sgRNA for each candidate gene together with Cre under the control of an astrocyte-specific promoter (AAV PHP.eB-U6-sgRNA-GfaABC1D-Cre) into conditional Cas9 knock-in (KI) mice. Astrocyte-specific Cre expression was confirmed in vivo using a tdTomato Cre-reporter line (Extended Data Fig. 5f,g). We utilized either a negative control virus (AAV-empty sgRNA-GfaABC1D-Cre) or sgRNA virus against each target gene along with astrocyte-specific mCherry-CAAX to quantify astrocyte morphology.
Compared to controls, loss of Tenm4 but not Tenm2 in P42 mouse cortical astrocytes significantly decreased astrocyte territory volume and the infiltration of fine astrocyte processes into the neuropil (neuropil infiltration volume, NIV) (Extended Data Fig. 5h–k). On the contrary, the deletion of NrCAM significantly increased NIV (Extended Data Fig. 5j,k), indicating that NrCAM is a negative regulator of astrocytic elaboration into the neuropil. Because of this unique and previously unreported function of NrCAM, we focused on NrCAM for further analysis.
NrCAM regulates astrocyte morphogenesis
To confirm that endogenous NrCAM is labeled by Split-TurboID in vivo, we used STED imaging, which showed that NrCAM co-localizes with biotinylated proteins in vivo (Extended Data Fig. 6a). NrCAM has previously been identified at axon-myelinating glia contacts24,25, and also studied as a neuronal protein regulating dendritic spine pruning26,27, but not studied in astrocytes. Interestingly, cell type-specific transcriptome analysis shows that the mRNA for NrCAM is higher in astrocytes than neurons or oligodendrocytes20,21. We confirmed NrCAM protein expression in cultured astrocytes by Western blot analysis (Extended Data Fig. 6b). Next, we analyzed NrCAM localization in astrocytes in vivo by STED microscopy, showing endogenous NrCAM puncta co-localizing with astrocytic membranes (Extended Data Fig. 6c,d).
NrCAM is known to function in part through a homophilic transcellular interaction28. In agreement, when we injected neuron-specific and astrocyte-specific NrCAM-expressing viruses into P21 mice (Extended Data Fig. 6e), we observed co-localization of sparsely expressed astrocytic-NrCAM-HA with neuronal-NrCAM-V5 (Extended Data Fig. 6f) by STED imaging at P42.
NrCAM is also expressed during early postnatal development26,27, thus we next deleted NrCAM from astrocytes during the first two weeks of development which both significantly increased astrocytic territory size and enhanced NIV when compared with controls (Extended Data Fig.7a–g). These phenotypes were rescued by co-expression of sgRNA-resistant HA-tagged human NrCAM (hNrCAM) in astrocytes (Extended Data Fig. 7b–g). NrCAM is a Type I membrane protein with a modular extracellular domain architecture that is composed of repeated immunoglobulin (Ig) and fibronectin (FN) domains (Extended Data Fig. 7b). To determine if extracellular interactions of NrCAM are required for astrocytic morphogenesis in vivo, we created two deletion mutants of hNrCAM; hNrCAM-ΔIG (620–1193 aa) and hNrCAM-ΔECD (1030–1193 aa) (Extended Data Fig. 7b–c). Neither mutant rescued the morphology of NrCAM-deleted astrocytes (Extended Data Fig. 7d–g), indicating that the extracellular interactions via Ig domains of NrCAM are necessary. To test whether the transcellular homophilic binding between astrocytic and neuronal NrCAMs are required for astrocyte morphogenesis, we targeted neuronal NrCAM by the same sgRNA virally (AAV-NrCAM sgRNA-hSynI-Cre). Indeed, depletion of NrCAM from only neurons or both from astrocytes and neurons enhanced astrocytic territory (only at P14) and NIV (both at P14 and P42) to a similar degree caused by astrocyte-only NrCAM deletion (Extended Data Fig. 7d–k). Taken together, these results indicate that homophilic binding between neuronal and astrocytic NrCAM restricts astrocyte process growth into the neuropil. This function of astrocytic NrCAM might be similar to NrCAM’s known role in neurons to promote retraction of dendritic spines via semaphorin/plexin signaling26. Interestingly, both Sema7a and Plxna4 were also detected by our proteomic analysis (Fig. 2b).
Astrocyte NrCAM modulates GABA synapses
Previously, we showed that proper astrocyte morphogenesis is required for synaptic development through direct synaptic contact9. To determine whether astrocytic NrCAM is also important for astrocyte-synapse contacts, we used STED microscopy to analyze astrocyte-expressed NrCAM-HA with respect to excitatory and inhibitory synapses (Fig. 3a). We found that astrocytic NrCAM-HA closely associated with both synapse types (Fig. 3b). Secondly, to determine if endogenous astrocytic NrCAM is localized at tripartite synaptic sites in vivo, we measured the distance from mCherry-CAAX-positive NrCAM puncta to excitatory (VGLUT1+) and inhibitory (VGAT+) presynapses (Fig. 3c) and compared it to Ezrin localization, a protein known to be at perisynaptic astrocyte processes. The distances of NrCAM and Ezrin puncta to presynapses were similar (Fig. 3d–f)29,30, demonstrating that astrocytic NrCAM is localized at astrocyte-synapse contacts in vivo.
Figure 3. NrCAM controls astrocyte-neuron contacts in vivo.
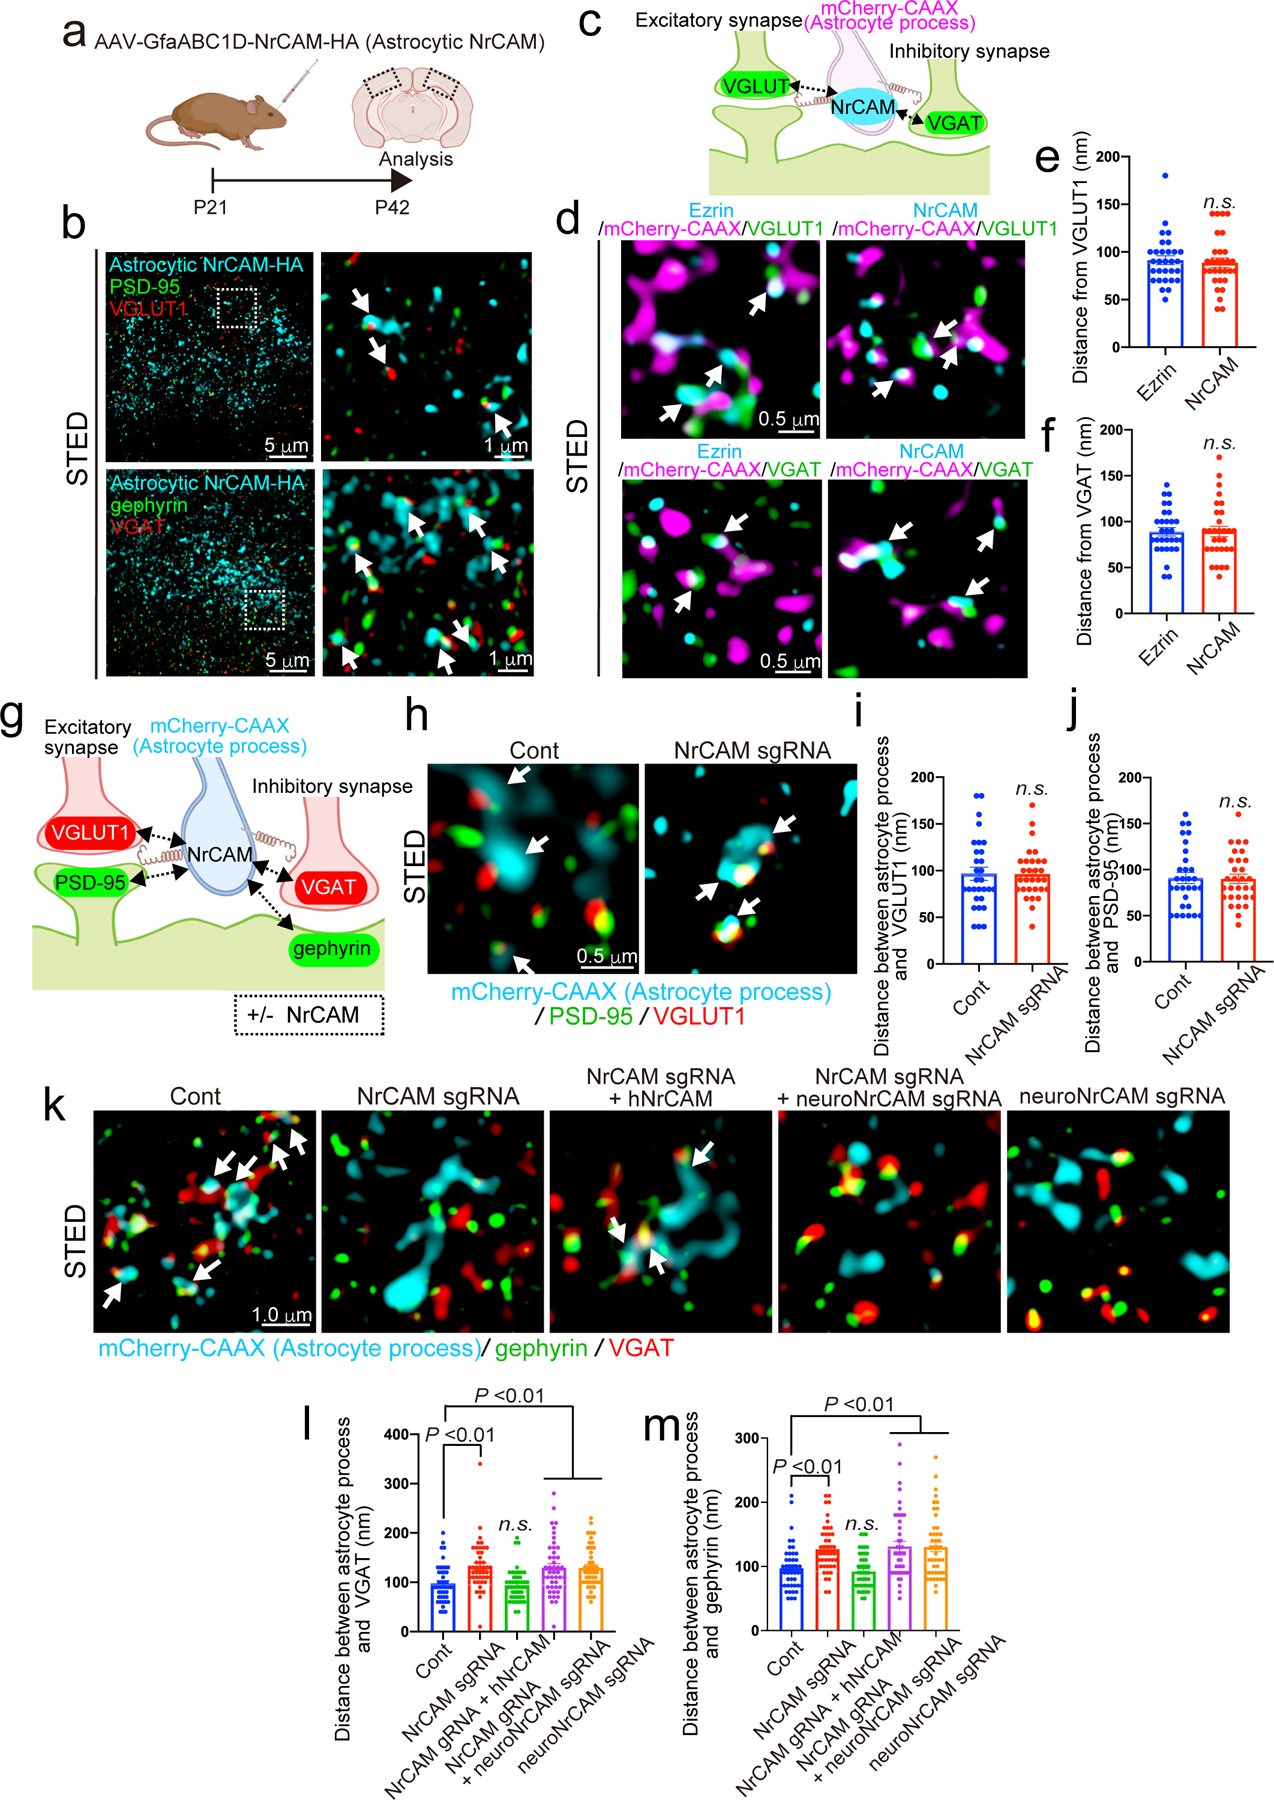
a, Schematic of the visualization of astrocytic NrCAM in vivo. b, Three-color STED images demonstrating that astrocytic NrCAM are adjacent to excitatory synapses or inhibitory synapses. c, Schematic of astrocytic NrCAM distribution assay in vivo. d, Three-color STED images showing mCherry-CAAX-positive NrCAM or Ezrin adjacent to excitatory presynapses and inhibitory presynapses. e and f) Quantification of average distance between astrocytic NrCAM and VGLUT1 or VGAT (n= 30 puncta per each condition from 3 brains). g, Schematic of astrocytic process and neuronal synapses contact assay in vivo. h-m, Three-color STED images of astrocytic process following deletion of astrocyte NrCAM adjacent to excitatory synapses (h) or inhibitory synapses (k). i-j and l-m, Quantification of average distance between astrocytic process and excitatory synapses (i-j) or inhibitory synapses (l-m) (n= 30 puncta per each condition from 3 brains). n= 3 biological repeats. Student’s t-test (paired, p<0.001) (e, f, i, j). One-way ANOVA (Dunnett’s multiple comparison, p<0.01) (l, m). Data represent means ± s.e.m.
To determine the effect of NrCAM loss on astrocyte-neuron contacts in vivo, we measured the distance between mCherry-CAAX-labeled astrocytic process and excitatory or inhibitory synapses (Fig. 3g). The deletion of astrocytic NrCAM did not alter the distance between astrocytic processes and excitatory pre or postsynapses (Fig. 3h–j). However, the astrocytic process distance from inhibitory pre and postsynapses were significantly increased (Fig. 3k–m). We also found that the deletion of both astrocytic and neuronal NrCAM at the same time, or of neuronal NrCAM alone, likewise disrupted contacts between astrocytes and inhibitory synapses (Fig. 3k–m).
The impairment of astrocyte-inhibitory synapse contacts due to loss of astrocytic NrCAM was rescued by expression of hNrCAM (Fig. 3k–m). This effect appeared to be directly related to NrCAM depletion as the levels of other proteins implicated in astrocyte-neuron interactions were unaffected (Extended Data Fig. 8a–b). Taken together these results strongly support a model in which homophilic NrCAM interactions between astrocytes and neurons mediate astrocyte-inhibitory synapse adhesions.
Previously, we identified neuronal NrCAM within the proteome of GABAergic postsynapses using iBioID with the inhibitory synapse organizer gephyrin as the bait19. Indeed, NrCAM co-immunoprecipitated with GFP-gephyrin when co-expressed in HEK293T cells (Extended Data Fig. 8c), and endogenous NrCAM co-immunoprecipitated with gephyrin from brain lysate (Fig. 4a). Positive controls, PSD-95 and Neuropilin-2 (Npn-2)26, were also detected in these co-immunoprecipitations, whereas negative control IgG did not precipitate gephyrin or positive control proteins (Fig. 4a). These results indicate that NrCAM forms a physical complex with the neuronal GABAergic synaptic scaffolding protein, gephyrin, and thus it may play a critical role in inhibitory synapse development in vivo.
Figure 4. Astrocytic NrCAM controls inhibitory synaptic organization and function.
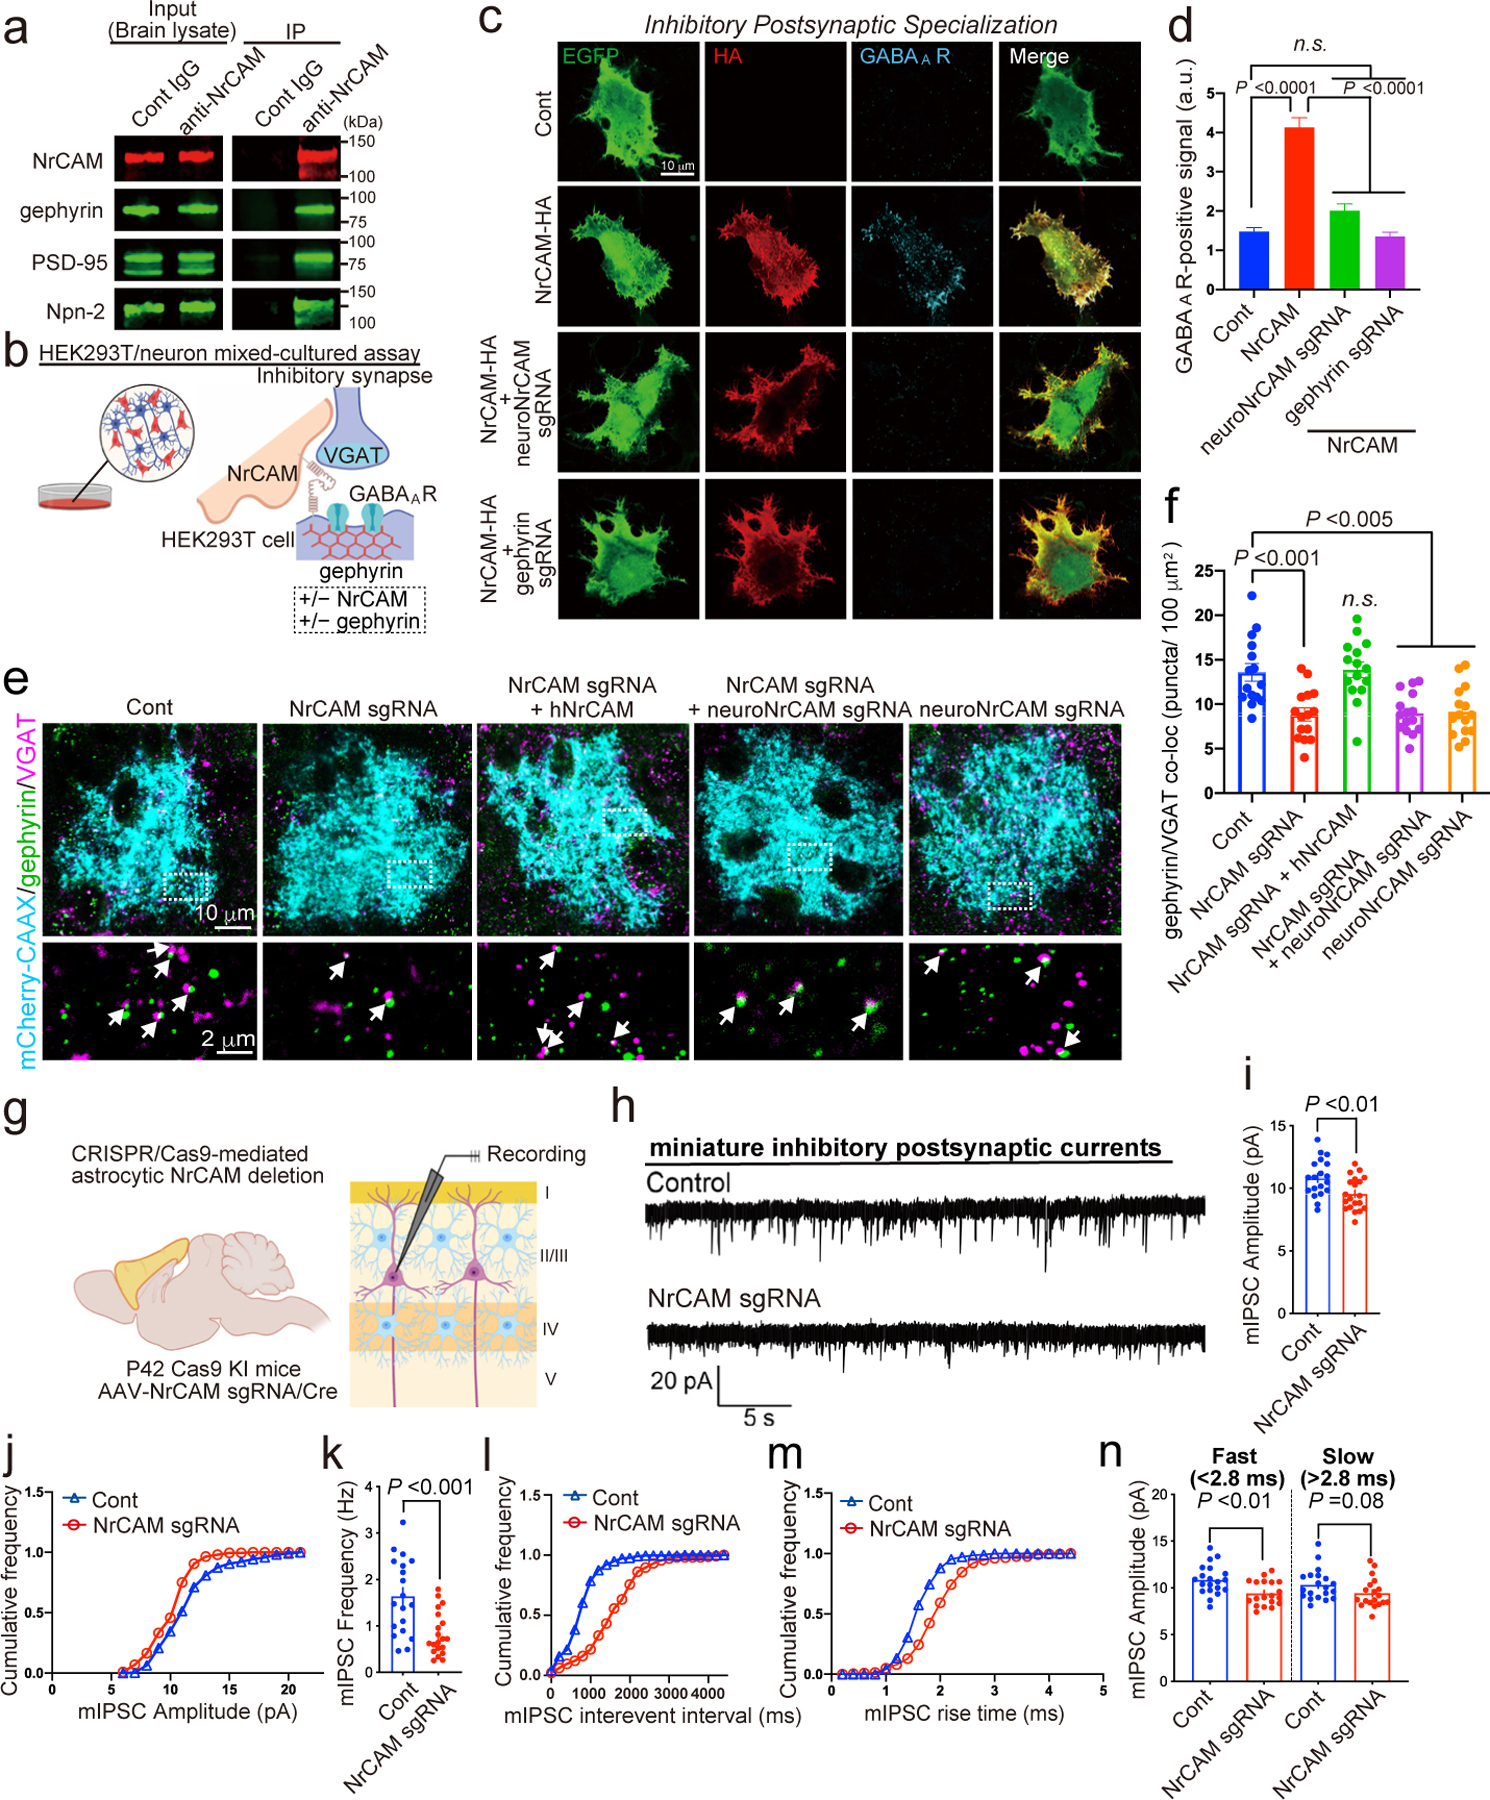
a, Co-immunoprecipitation from cortical lysates of NrCAM with gephyrin, PSD-95 and Npn-2. b, Schematic of co-culture assay of mechanisms of non-neuronal NrCAM-HA on inhibitory synaptic specializations. c, Images of NrCAM-HA co-expressed with EGFP in HEK293T cells co-cultured with NrCAM or gephyrin-depleted neurons. d, Graphs of average total integrated intensity of GABAA receptor contacting transfected HEK293T cells (Cont = 418, NrCAM = 416, neuroNrCAM sgRNA + NrCAM= 297, Gephyrin sgRNA + NrCAM = 356 cells). e, Images of inhibitory synapses within NrCAM-deletion astrocytes. High magnification images (bottom) correspond to boxes (above). f, Quantification of average number of inhibitory synaptic co-localized puncta within astrocyte territories. n= 15 cells per each condition from 3 mice. g, Schematic of electrophysiology in L2/3 of pyramidal neurons of V1 cortex. h, mIPSC traces from L2/3 pyramidal neurons following astrocyte control empty sgRNA or NrCAM sgRNA expression. i-m, Quantification of mIPSC amplitude (i-j), frequency (k-l), and rise time (m) (n=20 cells per each condition from 4 mice). n, mIPSC amplitudes sorted by fast and slow rise times. One-way ANOVA (Dunnett’s multiple comparison, p<0.001, 0.005) (d, f). n= 3–6 biological repeats. Student’s t-test (paired, p<0.001, 0.01) (i, k, n). Data represent means ± s.e.m.
To test if NrCAM functions as an organizer for inhibitory synaptic specializations, we used an in vitro HEK293T/neuron co-culture assay31–33. In this assay, consistent with previous studies, expression of NL2 in HEK293T cells induced ectopic formation of excitatory (VGLUT1+) and inhibitory (VGAT+) presynapses (Extended data Fig. 8e–l)32,33. Likewise, expression of presynaptic neurexin-1β (NRX1β), induced excitatory (Homer1+) and inhibitory (GABAA receptor-positive) postsynapses around the HEK293T cells (Extended data Fig. 8e–l)31,33. When NrCAM, NrCAM-ΔIG or NrCAM-ΔECD were expressed in HEK293T cells co-cultured with neurons (Extended data Fig. 8b–l)31–33, the expression of NrCAM, but not mutant NrCAMs, significantly induced ectopic formation of inhibitory pre- and postsynaptic contacts (Extended data Fig. 8e–h). NrCAM did not recruit excitatory synaptic specializations onto HEK293T cells (Extended data Fig. 8i–l). Interestingly, when NrCAM or gephyrin were deleted from neurons via specific sgRNAs (Fig. 4b), the ability of NrCAM-expressing HEK293T cells to promote clustering of inhibitory post-synapses was abolished (Fig. 4c,d). Taken together these data indicate that transcellular homophilic NrCAM interactions control the organization of inhibitory synaptic specializations via neuronal gephyrin.
NrCAM controls inhibition in vivo
Next, we examined the necessity of astrocytic NrCAM for excitatory or inhibitory synaptic structure and function in the mouse visual cortex. When we quantified the intracortical synapses of layer 2/3 neurons that are abundant in layer 1, we found that deletion of astrocytic NrCAM did not alter excitatory synapse number (Extended Data Fig. 9a,b). In contrast, deletion of astrocytic NrCAM significantly decreased inhibitory synapses in layer 2/3 of the mouse visual cortex (Fig. 4e,f). The effect of astrocytic NrCAM deletion on inhibitory synapse number was rescued by the expression of hNrCAM (Fig. 4e,f). The deletion of NrCAM from neurons alone or both from neurons and astrocytes, significantly decreased inhibitory synapse numbers (Fig. 4e,f). This result further supports that NrCAM bridges astrocytes and neurons via homophilic interactions to control inhibitory synapses.
To determine the functional consequences of deleting NrCAM from astrocytes, we performed whole-cell patch-clamp recordings of miniature excitatory postsynaptic currents (mEPSCs) and inhibitory postsynaptic currents (mIPSCs) of pyramidal neurons in layer 2/3 (Fig. 4g). mEPSCs amplitude was slightly decreased by the deletion of astrocytic NrCAM, but the frequency was not altered (Extended Fig. 9c–g). On the other hand, both the amplitude and the frequency of mIPSCs were significantly decreased compared to that of controls (Fig. 4h–l). Inhibitory synapses that are made onto pyramidal neurons are established by a heterologous population of interneurons, targeting either perisomatic or distal dendritic regions34. Due to their juxtaposition to the recording electrode, somatic mIPSC events have much steeper rise kinetics than distal dendritic events and thus can distinguish these two populations35,36. Interestingly, we saw an increase in the rise time of mIPSCs (Fig. 4m), which when separated by fast and slow events (fast <2.8 ms and slow >2.8 ms36), showed a significant decrease of mIPSC amplitudes for the fast (somatic) (Fig. 4n) compared to slower (dendritic) rise time events. Thus, astrocytic NrCAM is most likely important for proper somatic inhibitory synaptic development and function in vivo. In the future, it will be interesting to analyze how these effects modulate GABAergic networks such as those during visual cortical critical periods.
In vivo chemo-affinity codes that organize the wiring of the brain have been difficult to dissect in a cell-type specific manner from tissue. Here we developed a new in vivo BioID approach for discovery of extracellular cell-cell contact proteomes (Extended Data Fig. 10, top). How does the Split-TurboID approach here compare to other analogous methods? First, Split- TurboID can specify labeling of junctions between two genetically-defined cell types. Secondly, it is applied in vivo. Previously, synaptic cleft proteomics have been done in vitro with split horseradish peroxidase (sHRP)-conjugated with neurexin (NRX) and neuroligin (NLG)37,38 or to the synaptic adhesion molecule SynCAM139. Both approaches were highly successful, identifying excitatory and inhibitory synaptic cleft proteins in cultured cortical neurons. HRP-based labeling has the advantage of labeling synaptic clefts on a minute timescale in cultured cells or ex vivo37,38,40. However, one concern is that the labeling requires H2O2, which is cytotoxic and difficult to utilize in living brain tissue while maintaining complex multicellular interactions of the neuropil. We designed TurboID-surface and Split-TurboID to overcome this issue. While in revision, a different version of split-TurboID was also described for intracellular labeling between ER and mitochondria41. It will be interesting to test how this version performs when displayed extracellularly between cell types.
Previously, astrocytes were proposed to control inhibitory synapse formation via secreted proteins42,43; however, the presence of adhesion-based mechanisms through which astrocyte contacts control inhibitory synaptogenesis are largely unknown. Here we show that astrocytic and neuronal NrCAMs bridge these two cells to foster inhibitory postsynaptic specializations via gephyrin. We propose that these postsynaptic specializations then recruit presynaptic neuronal partners, to direct the formation of tripartite inhibitory synapses (Extended Data Fig. 10, bottom). Loss of perisynaptic NrCAM interactions results in significant deficits of GABAergic transmission, with slight reductions in the amplitudes of glutamatergic responses. The latter may well be a documented homeostatic response to reduced inhibition44,45, given the lack of effects of NrCAM on excitatory synapse formation in co-culture and depletion assays. Thus, our proteomic analysis reveals both a previously unknown mechanism for how astrocytes modulate inhibitory synapses, as well as a new protein map to catalyze many future studies of astrocyte-neuron signaling at synapses.
Methods
Animals
All mice were housed (2–5 mice per cage) in the Duke University’s Division of Laboratory Animal Resources facilities. All procedures were conducted with a protocol approved by the Duke University Institutional Animal Care and Use Committee in accordance with US National Institutes of Health guidelines. All mice were kept under typical day/night conditions of 12-hours cycles. CD1 (022, Charles River), Cas9 (028239) and Ai14 (007914) mice were purchased from Jackson laboratory. Both males and females were used, ages ranged from P0 to P42.
Plasmid construction
pZac2.1-GfaABC1D-Lck-GCaMP6f was a gift from Dr. Baljit Khakh (Addgene plasmid #52924). pcDNA3-V5-TurboID-NES was a gift from Dr. Alice Ting (Addgene plasmid #107169). GRAPHIC was obtained as previously described16. TurboID was subcloned into pZac2.1-GfaABC1D vector. The split sites of Split 1-TurboID and Split 2-TurboID were 256/257 and 140/141 amino acid position, respectively. The N-TurboID and C-TurboID fragments were subcloned into AAV-hSynI and pZac2.1-GfaABC1D vector, respectively. AAV-hSynI-EGFP and pZac2.1-GfaABC1D-mCherry-CAAX were previously described9,19. GfaABC1D was amplified and subcloned into AAV-U6-sg-Cre vectors. The sgRNA sequences used were as follows: Tenm2, 5’- ATCTGGAATAATGGATGTAAAGG-3’; Tenm4, 5’- GCCAGAGGCCATGGACGTGAAGG-3’; NrCAM, 5’- GTGCCAGATGATCAGCGCGCTGG-3’. The gephyrin sgRNA was obtained as previously described19. The cDNA encoding human NrCAM (Gene ID4897, Dharmacon) was amplified and subcloned into AAV-Ef1α, AAV-hSynI, pZac2.1-GfaABC1D vector. The fragments encoding hNrCAM mutants (hNrCAM-ΔIg and hNrCAM-ΔECD) were subcloned into AAV-Ef1α and pZac2.1-GfaABC1D vector. pCAG-HA-Nrxn1beta AS4(−) and pNICE-NL2(−) were gifts from Dr. Peter Scheiffele (Addgene plasmid #59409 and #15246, respectively). pEGFP-gephyrin and pcDNA-PSD95-GFP were previously described19. All constructs were confirmed by DNA sequencing. All primers are shown in Supplementary Table 4.
Antibodies
The following antibodies were used: monoclonal anti-V5 (ThermoFisher, R960–25, IB 1:1000, IF 1:500, IHC 1:500), rat anti-HA (Sigma, 12158167001, IB 1:1000, IF 1:500, IHC 1:200), mouse anti-HA (Biolegend, MMS-101P, IB 1:1000), chicken anti-GFP (Abcam, ab13970, IB 1:1000, IF 1:1000, IHC 1:1000), rabbit anti-mCherry (Abcam, ab167453, IF 1:500, IHC 1:500), rabbit anti-PSD95 (Life Techonologies, 51–6900, IHC 1:200), mouse anti-PSD-95 (ThermoFisher, 7E3, IB 1:1000), guinea pig anti-VGLUT1 (Synaptic Systems, 135–304, IF 1:1000, IHC 1:1000), rabbit anti-gephyrin (Synaptic Systems, 147–002, IF 1:1000, IHC 1:500), mouse anti-gephyrin (Synaptic Systems, 147–011, IB 1:1000, IF 1:300), guinea pig anti-VGAT (Synaptic System, 131–004, IF 1:1000, IHC 1:500), rabbit anti-NL2 (Synaptic System, 129–202, IB 1:500), rabbit anti-NrCAM (Abcam, ab24344, IB 1:1000, IHC 1:200), rabbit anti-Homer1 (Synaptic Systems, 160002, IF 1:2000), rabbit anti-GABA-A receptor β2 (Synaptic Systems, 224–803, IF 1:1000), goat anti-Neuropilin-2 (R & D Systems, AF567, IB 1:500), rat anti-tdTomato (Kerafast, EST203, IHC 1:1000), rat anti-Tubulin (Santa Cruz, sc-53029, IB 1:1000), rabbit anti-Ezrin (Cell Signaling, #3142, IHC 1:200), rabbit anti-EAAT2 (GLT1) (Alamone, AGC-022, IB 1:1000), rabbit anti-Kir4.1 (Alamone, APC-035, IB 1:500), rabbit anti-NL3 (Novus, NBP1–90080, IB 1:500), Alexa Fluor 488 Goat anti-Mouse (ThermoFisher, A32723), Alexa Fluor 488 Goat anti-Rabbit (ThermoFisher, A-11034), Alexa Fluor 488 Goat anti-Guinea pig (ThermoFisher, A11073), Alexa Fluor 488 Goat anti-Chicken (ThermoFisher, A-11006), Oregon Green 488 Goat anti-Rabbit (ThermoFisher, O-11038), Alexa Fluor 555 Goat anti-Rabbit (ThermoFisher, A21428), Alexa Fluor 568 Goat anti-Rat (ThermoFisher, A-11077), Alexa Fluor 594 Streptavidin (ThermoFisher, S11227), Alexa Fluor 647 Donkey anti-rabbit (ThermoFisher, A31573), Alexa Fluor 647 Goat anti-Chicken (ThermoFisher, A-21449), Alexa Fluor 647 Donkey anti-Guinea pig (Jackson ImmunoResearch, 706-605-148), Alexa Fluor 647 Streptavidin (ThermoFisher, S21374), Atto647N anti-Mouse (Sigma, 50185), Atto647N anti-rabbit (Sigma, 40839), Donkey anti-Goat IRDye 800CW (LI-COR, 926–32214), Goat anti-rat IRDye 800CW (LI-COR, 925–32219), Goat anti-Mouse IRDye 680RD (LI-COR, 925–6818).
AAV production
AAVs were produced as previously described19,46. Briefly, HEK293T cells were transfected with pAd-DELTA F6, serotype plasmid AAV PHP.eB and AAV plasmid. After 72 h, the cells were lysed in 15mM NaCl, 5mM Tris-HCl, pH 8.5, and incubated with 50U/ml Benzonase for 30 min at 37°C. The cell lysate was then centrifuged at 4500rpm for 30 minutes at 4°C, and the supernatant containing AAV was added to the top of an iodixanol gradient (15%, 25%, 40% and 60% iodixanol solution, top to bottom) and centrifuged using a Beckman Ti-70 rotor, spun at 67,000 rpm for 1h. The viral solution extracted from the virus layer (between the 40% and 60% iodixanol layers) with a 24-gauge needle and 5 ml syringe, and concentrated with a 100 kDa filter. Viral titers were measured by qPCR using a linearized genome plasmid as a standard47. For small-scale AAV supernatant, HEK293T cells were transfected pAd-DELTA F6, serotype plasmid AAV PHP.eB or AAV2/1 and AAV plasmid. After 72 h, the AAV-containing supernatant medium was collected and filtered with a 0.45 μm cellulose acetate Spin-X centrifuge tube filter (Costar 8162).
Primary neuronal, astrocytic, and HEK 293T cell cultures
Cortical neurons and astrocytes were prepared from P1 mouse pups. These cells were seeded on coverslips or dishes coated with poly-L-lysine (Sigma) and cultured in neurobasal medium A (Invitrogen) supplemented with B-27 (Invitrogen) and 1 mM GlutaMAX (Invitrogen). Mouse cortical astrocytes were prepared as previously described9. P0–3 mouse cortices were microdissected and papain digested followed by trituration in low and high ovomucoid solutions. Cells were passed through a 20 µm mesh filter, resuspended in astrocyte growth media (AGM; DMEM (Gibco 11960), 10% FBS, 10 µM, hydrocortisone, 100 U/mL Pen/Strep, 2 mM L-Glutamine, 5 µg/ml Insulin, 1 mM NaPyruvate, 5 µg/ml N-Acetyl-L-cysteine) and 30 million cells were plated on 75 mm2 flasks (non-ventilated cap) coated with poly-D-lysine. Flasks containing cells were incubated at 37°C in 10% CO2. On DIV3, AGM was removed and replaced with DPBS. Flasks were then shaken vigorously by hand for 10–15 seconds until only the adherent monolayer of astroglia remained. DPBS was then replaced with fresh AGM. On DIV 4, AraC was supplemented to the media for 3 days to eliminate fast dividing cells, and astrocytes were treated with AAVs. On DIV 7, astrocytes were passaged into 6-well dishes (400,000 cells/well) and half the media was replaced every 2–3 days. On DIV14, astrocytes were collected for immunoblotting analysis. HEK293T (obtained from ATCC #CRL-11268; STR confirmed and mycoplasma negative) cells were maintained in DMEM (Gibco) supplemented with 10% FBS (Gibco) and 100 U/mL penicillin/streptomycin. Cell lines were incubated at 37 °C in 5% CO2. Cells were regularly passaged every three days.
Immunostaining and imaging analysis
Cultured neurons and astrocytes were infected with small-scale AAVs at DIV14. After 3 days, these cells were treated with 500 μM biotin for 6h. Neurons and astrocytes were fixed at indicated time points in 4% PFA/ 4% sucrose for 20 min at room temperature. They were permeabilized with 0.1 % Triton-X 100 and 10% normal goat serum (NGS) for 30 min at room temperature. Samples were then incubated for overnight at 4 °C with primary antibodies followed by Alexa Fluor 488-, Alexa Fluor 555 or Alexa 647-conjugated secondary antibodies diluted in PBS containing 0.01% Triton X-100 and 10% NGS for 2 h at room temperature. The neuron and HEK293T cells mixed-culture assay was performed as previously described32,33. Briefly, HEK293T cells were transfected using Lipofectamine 2000 according to the manufacturer’s instructions. After 20 h, transfected HEK cells were seeded on cultured neuron at DIV14. Fluorescence images were acquired with Zeiss Imager M2 upright microscope equipped with an Apotome module, Zeiss 710, Zeiss 780, Zeiss 880 confocal microscopes using the Zen Software or a stimulated emission depletion (STED) super resolution microscope (TCS SP8 STED, Lecia Microsystems) using the Leica Application Suite (LAS) software. The individual acquiring the images was always blinded to the experiment. Images were quantified and post-processed using FIJI.
Immunohistochemistry and imaging analysis
Immunohistochemistry was performed as previously described48,49. Briefly, brains were fixed in 4% PFA/ 4% sucrose, and coronally or sagittally sectioned with a cryostat (Leica Microsystems) at a thickness of 40 μm or 100 μm. The slices were incubated with primary antibodies diluted in PBS containing 0.1% Triton X-100 and 10 % NGS at 4°C for 2 days followed by Alexa Fluor 488- or Alexa Fluor 555-, or Alexa 647-conjugated secondary antibodies diluted in PBS containing 0. 1% Triton X-100 and 10% NGS for 2h at room temperature. The nuclei were visualized by staining with DAPI.
Astrocyte morphology was analyzed as previously described9. For the astrocyte territory volume analysis, entire astrocytes expressing mCherry-CAAX in 100 μm-thick floating sections were imaged using a 63x-objective with 1x optical zoom images on the Zeiss 780 upright confocal microscope (Zen Software) and processed with Imaris software. The fluorescence signal from each astrocyte was reconstructed using the surface tool. The intersecting nodes of the surface render (vertices) were identified using the Matlab extension “Visualize Surface Spots”. The Matlab Xtension “Convex Hull” identified the most terminal vertices (outside edges of the 3D surface render) and created an additional surface render to connect these terminal vertices by the shortest distance possible. Thus, a surface render of the outer-rim (i.e. territory) of each astrocyte was formed. The volume of each territory was measured in Imaris and recorded. Astrocyte territory sizes between experimental conditions were statistically analyzed using a one-way ANOVA followed by Fisher’s LSD post-hoc test when necessary. The individual analyzing the images was always blinded to the experimental conditions. For the neuropil infiltration volume (NIV) analysis, astrocytes expressing mCherry-CAAX were imaged by 63x plus 2x optical zoom high magnification on Zeiss 710 confocal microscope. The images were uploaded into Imaris Bitplane software for 3D reconstructions. We chose at least three regions of interest (ROIs) measuring 200 pixels × 200 pixels × 20 pixels from each astrocyte that were devoid of the soma and large branches. ROIs were reconstructed using the surface tool in Imaris. NIV was calculated in Imaris and statistically analyzed using a one-way ANOVA followed by a Fisher’s LSD post-hoc test. Images were analyzed blinded to the experimental conditions.
Analysis of synaptic number
Synaptic number was analyzed as previously described9. Briefly, P42 control and experimental tissue sections were stained with an antibody against mCherry, biotinylated proteins and the following antibodies against pre- and postsynaptic protein pairs: VGLUT1 and PSD95 (makers of excitatory synapses) and VGAT and gephyrin (markers of inhibitory synapses). 5μm-thick Z-stacks of 15 optical sections of astrocytes expressing mCherry-CAAX were imaged by 63x plus 1x optical zoom high magnification on Zeiss 780 confocal microscope (Zen Software). Synapse number quantification by co-localization takes advantage of the fact that pre- and postsynaptic proteins appear co-localized at synaptic junctions due to their close proximity. Each Z-stack was converted into 5 maximum projection images (MPI) by condensing three consecutive optical sections using ImageJ. The number of co-localized synaptic puncta of excitatory intracortical (VGLUT1/PSD-95), and inhibitory (VGAT/gephyrin) were obtained using the ImageJ plugin Puncta Analyzer (written by Bary Wark, available upon request, cagla.eroglu@dm.duke.edu as previously described Stogsdill et al., 2017). For each image, co-localized synaptic puncta were quantified within astrocytes from ROIs of 100 μm2 area that were focused away from regions with neuronal cell bodies (areas lacking synaptic puncta). Statistical analysis of the synaptic staining was performed with a one-way ANOVA followed by a post-hoc Fisher’s LSD test when necessary. Images were analyzed blinded to the experimental conditions.
Analysis of synaptic distance
Synaptic distance was analyzed with super-resolution imaging as previously described50. Briefly, P42 control and experimental tissue sections were stained with an antibody against mCherry, NrCAM, Ezrin, and synaptic makers (VGLUT1, PSD-95, VGAT and gephyrin). Optical sections of astrocytes expressing mCherry-CAAX were imaged by 93x plus 5x optical zoom high magnification on stimulated emission depletion (STED) super resolution microscope (TCS SP8 STED, Lecia Microsystems). The distance was measured as the distance between the peak positions of the two distributions of localization points using the Leica Application Suite (LAS) software. Statistical analysis was performed with a Student’s t-test or one-way ANOVA followed by a post-hoc Fisher’s LSD test when necessary. Images were analyzed blinded to the experimental conditions.
In vivo TurboID protein purification
In vivo TurboID experiments were performed as previously described19,46 with some modifications. Each AAV-TurboID probe virus was retro-orbitally injected into CD1 juvenile mouse brain (P21). After 3 weeks post-viral injection, biotin was subcutaneously injected at 24 mg/kg for 7 consecutive days to increase the biotinylation efficiency. For each TurboID probe, 4–10 mice were used for biotinylated protein purification/ Each purification was performed independently at least 3 times. Each cortex was lysed in 50 mM Tris/HCl, pH 7.5; 150 mM NaCl; 1 mM EDTA; protease inhibitor mixture (cOmplete Mini EDTA-free, Roche); and phosphatase inhibitor mixture (PhosSTOP, Roche). The lysed samples were added to an equal volume of 50 mM Tris/HCl, pH 7.5; 150 mM NaCl; 1 mM EDTA; 0.4 % SDS; 2 % TritonX-100; 2 % deocycholate; protease inhibitor mixture; and phosphatase inhibitor mixture, and then sonicated and centrifuged at 15,000 g for 10 min. Supernatant was further ultracentrifuged at 100,000g for 30min at 4° C (Beckman TLA-100 ultracentrifuge, TLA-55 rotor). SDS was added to the cleared supernatant to a final concentration of 1% and heated at 45 ° C for 45 min. The sample was cooled on ice and incubated with Pierce High Capacity NeutrAvidin™ Agarose (ThermoFisher) at 4° C overnight. Beads were washed twice with 2% SDS; twice with 1% TritonX-100, 1% deoxycholate, 25 mM LiCl; twice with 1M NaCl and 5 times with 50 mM ammonium bicarbonate. Biotinylated proteins were eluted in 125 mM Tris/HCl, pH6.8; 4 % SDS; 0.2 % β-mercaptoethanol; 20 % glycerol; 3 mM biotin at 60°C for 15min.
Quantitative LC/MS/MS analysis
Samples were spiked with either a total of 120 or 240 fmol of casein and reduced with 10 mM dithiolthreitol for 30 min at 80° C and alkylated with 20 mM iodoacetamide for 45 min at room temperature, then supplemented with a final concentration of 1.2% phosphoric acid and 328 μl of S-Trap (Protifi) binding buffer (90% MeOH/100mM TEAB). Proteins were trapped on the S-Trap, digested using 20 ng/μl sequencing grade trypsin (Promega) for 1 hr at 47° C, and eluted using 50 mM TEAB, followed by 0.2% FA, and lastly using 50% ACN/0.2% FA. All samples were then lyophilized to dryness and resuspended in 12 μL 1%TFA/2% acetonitrile containing 12.5 fmol/μL yeast alcohol dehydrogenase (ADH_YEAST). From each sample, 3 μL was removed to create a QC Pool sample which was run periodically throughout the acquisition period.
Quantitative LC/MS/MS was performed on 2 μL of each sample, using a nanoAcquity UPLC system (Waters Corp) coupled to a Thermo Orbitrap Fusion Lumos high resolution accurate mass tandem mass spectrometer (Thermo) via a nanoelectrospray ionization source. Briefly, the sample was first trapped on a Symmetry C18 20 mm × 180 μm trapping column (5 μl/min at 99.9/0.1 v/v water/acetonitrile), after which the analytical separation was performed using a 1.8 μm Acquity HSS T3 C18 75 μm × 250 mm column (Waters Corp.) with a 90-min linear gradient of 5 to 30% acetonitrile with 0.1% formic acid at a flow rate of 400 nanoliters/minute (nL/min) with a column temperature of 55° C. Data collection on the Fusion Lumos mass spectrometer was performed in a data-dependent acquisition (DDA) mode of acquisition with a r=120,000 (@ m/z 200) full MS scan from m/z 375 – 1500 with a target AGC value of 2e5 ions. MS/MS scans were acquired at rapid scan rate in the linear ion trap with an AGC target of 5e3 ions and a max injection time of 100 ms. The total cycle time for MS and MS/MS scans was 2 sec. A 20s dynamic exclusion was employed to increase depth of coverage.
Following data collection, data was imported into Proteome Discoverer 2.2 (Thermo Scientific Inc.), and individual LC-MS .raw files were aligned based on the accurate mass and retention time of detected ions (“features”) using Minora Feature Detector algorithm in Proteome Discoverer. Relative peptide abundance was calculated based on peak intensities following integration of selected ion chromatograms of the aligned features across all runs. The MS/MS data was searched against a SwissProt M. musculus database (downloaded in Apr 2018) containing an equal number of reversed-sequence “decoys” for false discovery rate determination. Mascot Distiller and Mascot Server (v 2.5, Matrix Sciences) were utilized to produce fragment ion spectra and to perform the database searches using full trypsin enzyme rules with 5ppm precursor and 0.8Da product ion match tolerances. Database search parameters included fixed modification on Cys (carbamidomethyl) and variable modifications on Meth (oxidation) and Asn and Gln (deamidation). Peptide Validator and Protein FDR Validator nodes in Proteome Discoverer were used to annotate the data at a maximum 1% protein false discovery rate.
Split-TurboID Protein network
Split-TuboID and TurboID-surface protein networks were performed as previously described19,46 with modifications. Network figures were created using Cytoscape (v3.7), with nodes corresponding to the gene name (multiple isoforms of proteins were collapsed into one node based on gene nomenclature) for proteins identified in the proteomic analysis. The known protein-protein interaction networks were provided by Strings, HitPredict, HPRD, BioGrid, and APID database. A non-redundant list of protein-protein interactions was assembled using MGI-Mouse Genome Informatics-The international database, GeneCard and UniProt (Supplementary Table 5–6). In all networks, node size is proportional to fold enrichment over soluble TurboID alone. However, the bait (Split-TurboID and TurboID-surface) node sizes were set manually. Clustergrams were created by manual inspection based on Uniprot and GeneCard database annotation as previously described19,46.
Immunoprecipitation and immunoblotting
HEK293T cells were transfected with Lipofectamine 2000 according to the manufacturer’s instructions. After 20 h, transfected HEK cells were lysed in 25 mM HEPES, pH 7.5; 150 mM NaCl; 1 mM EDTA; 1 % NP-40; protease inhibitor mixture; and phosphatase inhibitor mixture. The cell lysate, which was obtained by centrifugation at 15,000 g for 15 min at 4°C, was incubated with GFP-Trap Agarose beads (Chromotek) at 4°C for overnight. For the protein expression assay from cultured astrocytes, the cell was lysed in 25 mM Tris, pH 7.4; 150 mM NaCl; 1 mM CaCl2; 1 mM MgCl2; 0.5% NP-40; protease inhibitor mixture. The lysed samples were centrifuged at 15,000 g for 5 min at 4°C. For the endogenous NrCAM binding assay, juvenile mouse cortex (P42) was lysed in 25 mM HEPES, pH 7.5; 150 mM NaCl; 1 mM EDTA; 1 % NP-40; protease inhibitor mixture; and phosphatase inhibitor mixture. The lysed samples were centrifuged at 15,000 g for 10 min at 4°C. Supernatant was pre-cleared with at 4° C for 30 min with Protein G Sepharose beads (Millipore). NrCAM was immunoprecipitated with anti-NrCAM antibody followed by Protein G Sepharose beads overnight at 4°C. SDS-PAGE and immunoblotting were performed as previously described48,49. The Data was obtained with Odyssey Software (Ver.4). Full gel images are shown in Supplementary Figure 1.
Electrophysiological analysis
For whole-cell patch clamp recordings, mice P42–48 were decapitated under deep isoflurane anesthesia. Brains were removed and 300 μm sagittal slices were prepared in ice cold, oxygenated cutting solution (containing in mM: 85 NaCl, 3 KCl, 1.3 MgSO4-7H2O, 1.25 NaH2PO4-H2O, 26 NaHCO3, 25 dextrose, 2.5 CaCl2, and 75 sucrose at ~320 mOsm/L) with a vibratome (Leica VT 1000S). Slices were recovered for 30 minutes at 31.5 °C in 95% O2/5% CO2 bubbled ACSF (containing in mM: 124 NaCl, 3 KCl, 1.3 MgSO4-7H2O, 1.25 NaH2PO4-H2O, 26 NaHCO3, 10 dextrose, 2.5 CaCl2 at ~310 mOsm/L) and then at room temperature for at least 1 hour. Slices were superfused with oxygenated ACSF at room temperature. To isolate mIPSCs, 0.5 μm picrotoxin and 0.5 μm TTX was added to ACSF. To isolate mEPSCs, 50 μm D-APV, 10 μm NBQX, and 0.5 μm TTX was added to ACSF. V1 cells were visually identified under Zeiss Axio Examiner.D1 microscope with 20x dipping objective and IR-1000 camera (DAGE-MTI) using an IR bandpass filter. Cortical cells in layer 2/3 were patched using glass pipettes (4–7 MΩ resistance) made from borosilicate glass capillaries (Sutter Instrument) using a P-97 puller (Sutter Instrument). Pipettes were filled with internal solution containing: (in mM) 135 CsMeSO3, 8 NaCl, 10 HEPES, 0.3 EGTA, 10 Na2-phosphocreatine, 4 MgATP, 0.3 Na2GTP, 5 TEA-Cl, 5 QX-314 at ~290 mOsm/L. Miniature post-synaptic currents were measured at −70 mV. Series resistance was monitored throughout all recordings and only recordings that remained stable over the recording period (≤30 MΩ resistance and < 20% change in resistance) were included. Data were recorded using a Multiclamp 700B amplified (Molecular Devices), digitized at 50 kHz using a Digidata 1550 digitizer (Molecular Devices), and low-pass filtered at 1kHz. All data were acquired using pClamp software and analyzed in Clampfit (Molecular Devices) including only events larger than 5 pA. Events were initially identified using a custom-made template and manually assessed for inclusion with the template search function. Rise time was defined as the time from 10–90% of the peak. All chemicals were purchased from Sigma-Aldrich or Tocris. Experiments were performed blinded to the condition.
Statistical analysis
Data are expressed as the mean ± SEM. Statistical analyses were performed with GraphPad Prism version 6 (GraphPad Software). We compared independent sample means using t-tests and one-way ANOVAs as appropriate. Statistically significant F-values detected in the ANOVAs were followed by alpha- adjusted post-hoc tests (Tukey’s HSD). We confirmed necessary parametric test assumptions using the Shapiro–Wilk test (normality) and Levene’s test (error variance homogeneity). P < 0.001, P < 0.01, and P < 0.05 were considered to indicate statistical significance. Sample size for each experiment is indicated in the figure legend for each experiment. Sample sizes were determined based on previous experience for each experiment to yield high power to detect specific effects. No statistical methods were used to predetermine sample size. All results of the statistical analysis are shown in Supplementary Table 7.
Extended Data
Extended Data Figure 1. The reconstituted activity of Split-TurboID in neurons and astrocytes in vitro.
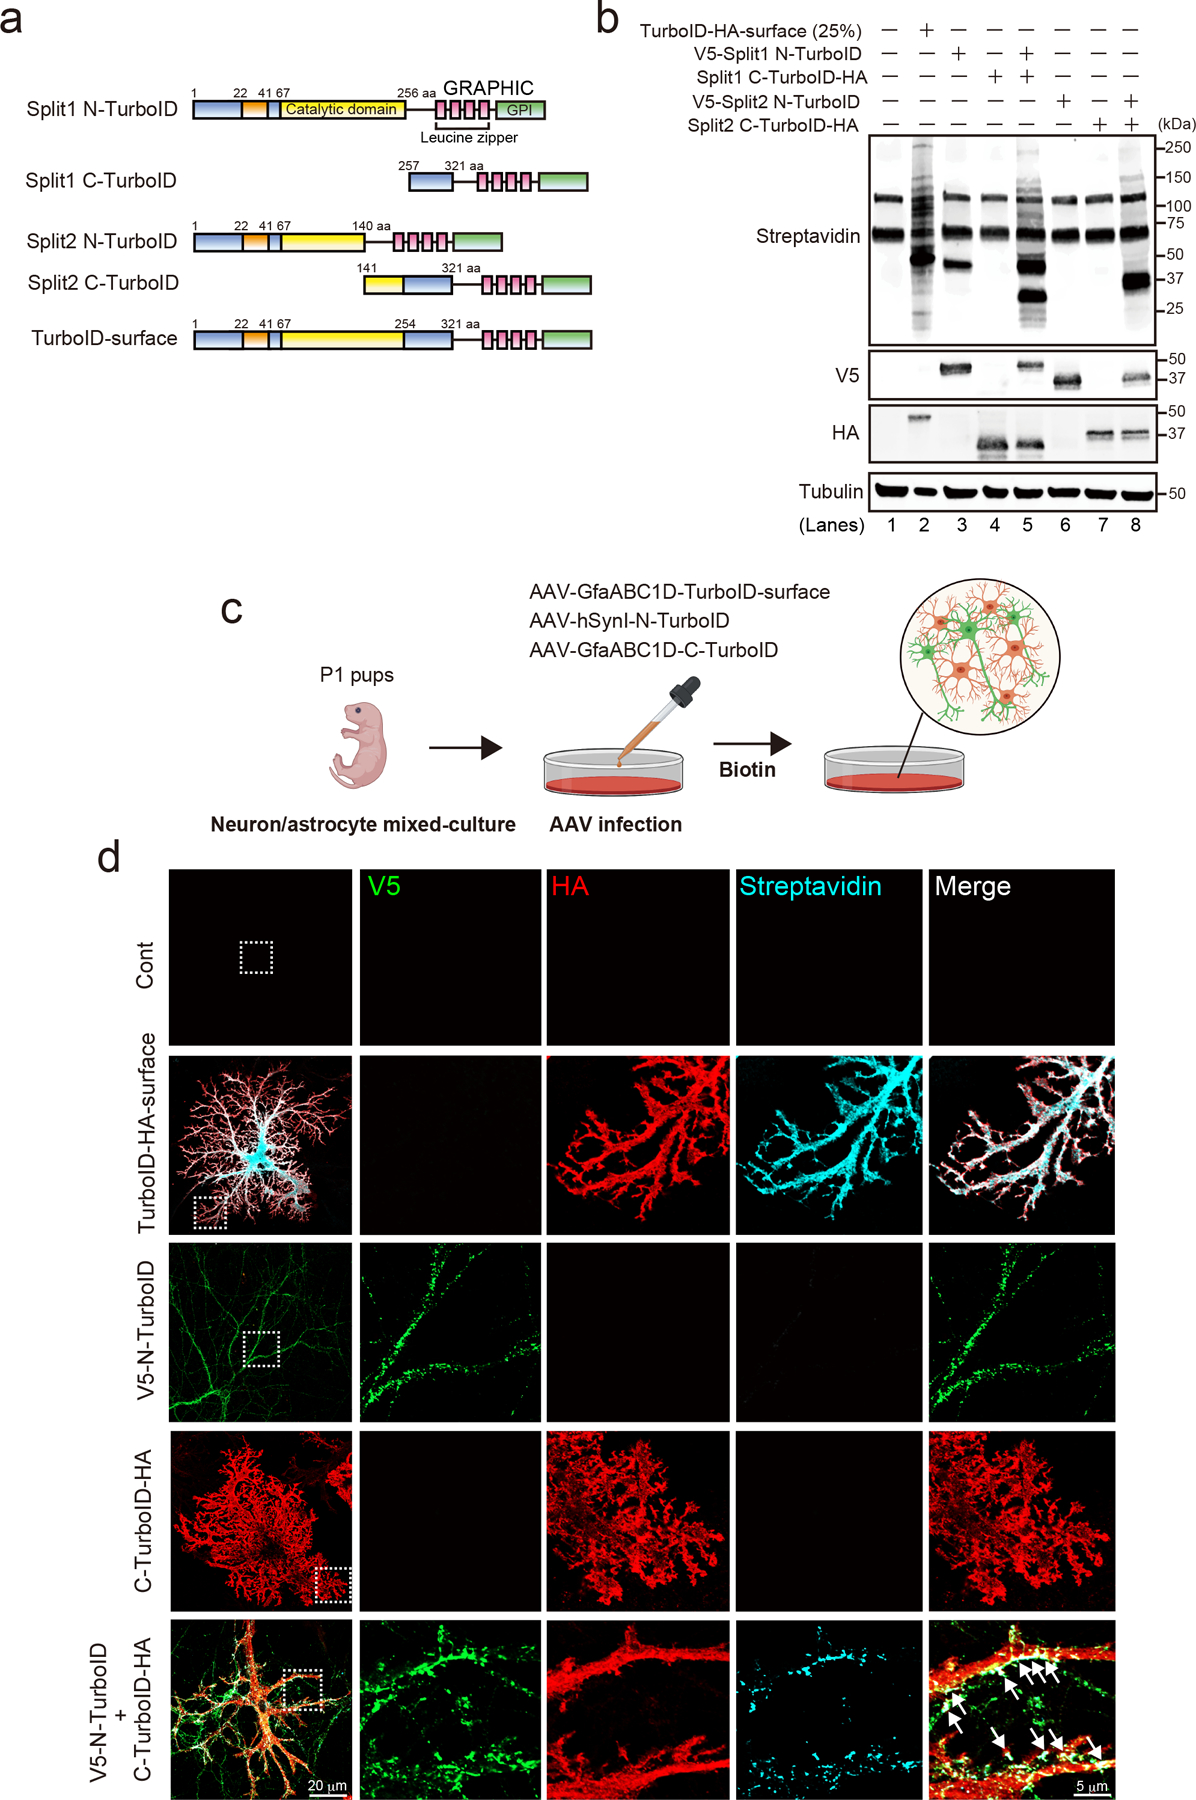
a, Schematics of constructs tested. b, Immunoblot analysis of construct expression and biotinylation activity. c, Schematic of neuron-astrocyte mixed-culture assay for Split-TurboID with cell-type specific AAVs in vitro. d, Cultured neurons and astrocytes were infected with AAV1/2-GfaABC1D-TurboID-HA-surface, AAV1/2-hSynI-V5-N-TurboID and/or AAV1/2-GfaABC1D-C-TurboID-HA at DIV14. Representative images of neuron and astrocyte at DIV14 after the treatment of 500 μM biotin for 6h are shown. n= 3 biological repeats.
Extended Data Figure 2. Split-TurboID maps excitatory and inhibitory perisynaptic proteins.
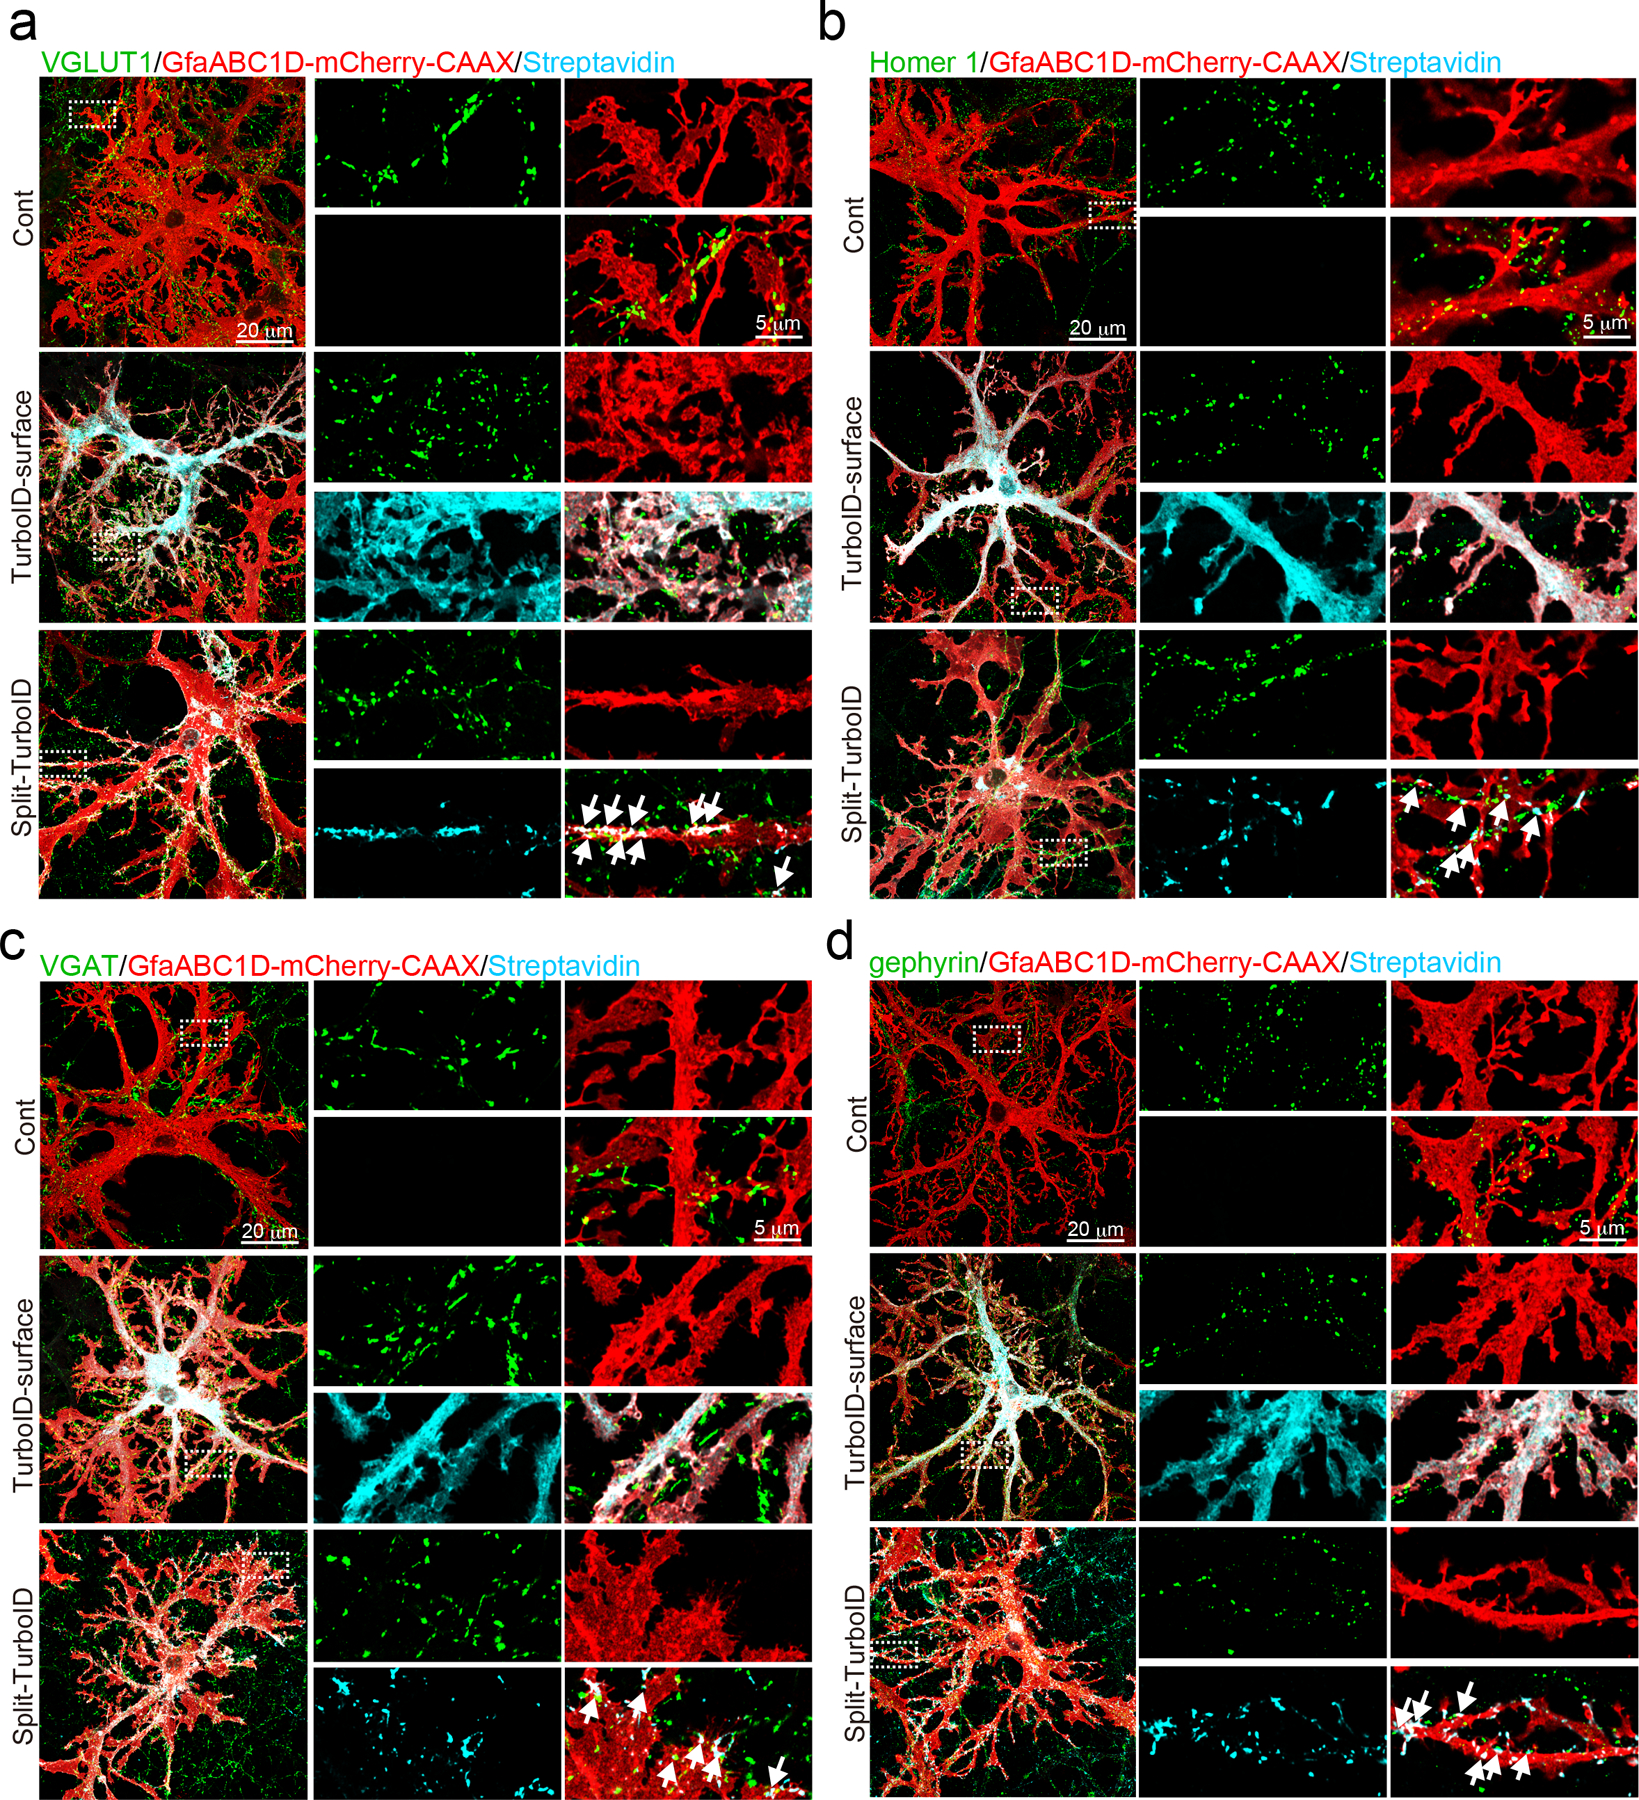
a-d, Representative images demonstrating that proteins biotinylated by astrocytic TurboID-surface or Split-TurboID (cyan) are adjacent to a) excitatory presynaptic marker VGLUT1, b) postsynaptic marker Homer 1, c) inhibitory presynaptic marker VGAT, and d) postsynaptic marker gephyrin. Astrocytes were visualized with GfaABC1D-mCherry-CAAX. n= 3 biological repeats.
Extended Data Figure 3. Brain-wide transduction of astrocytes and neurons.
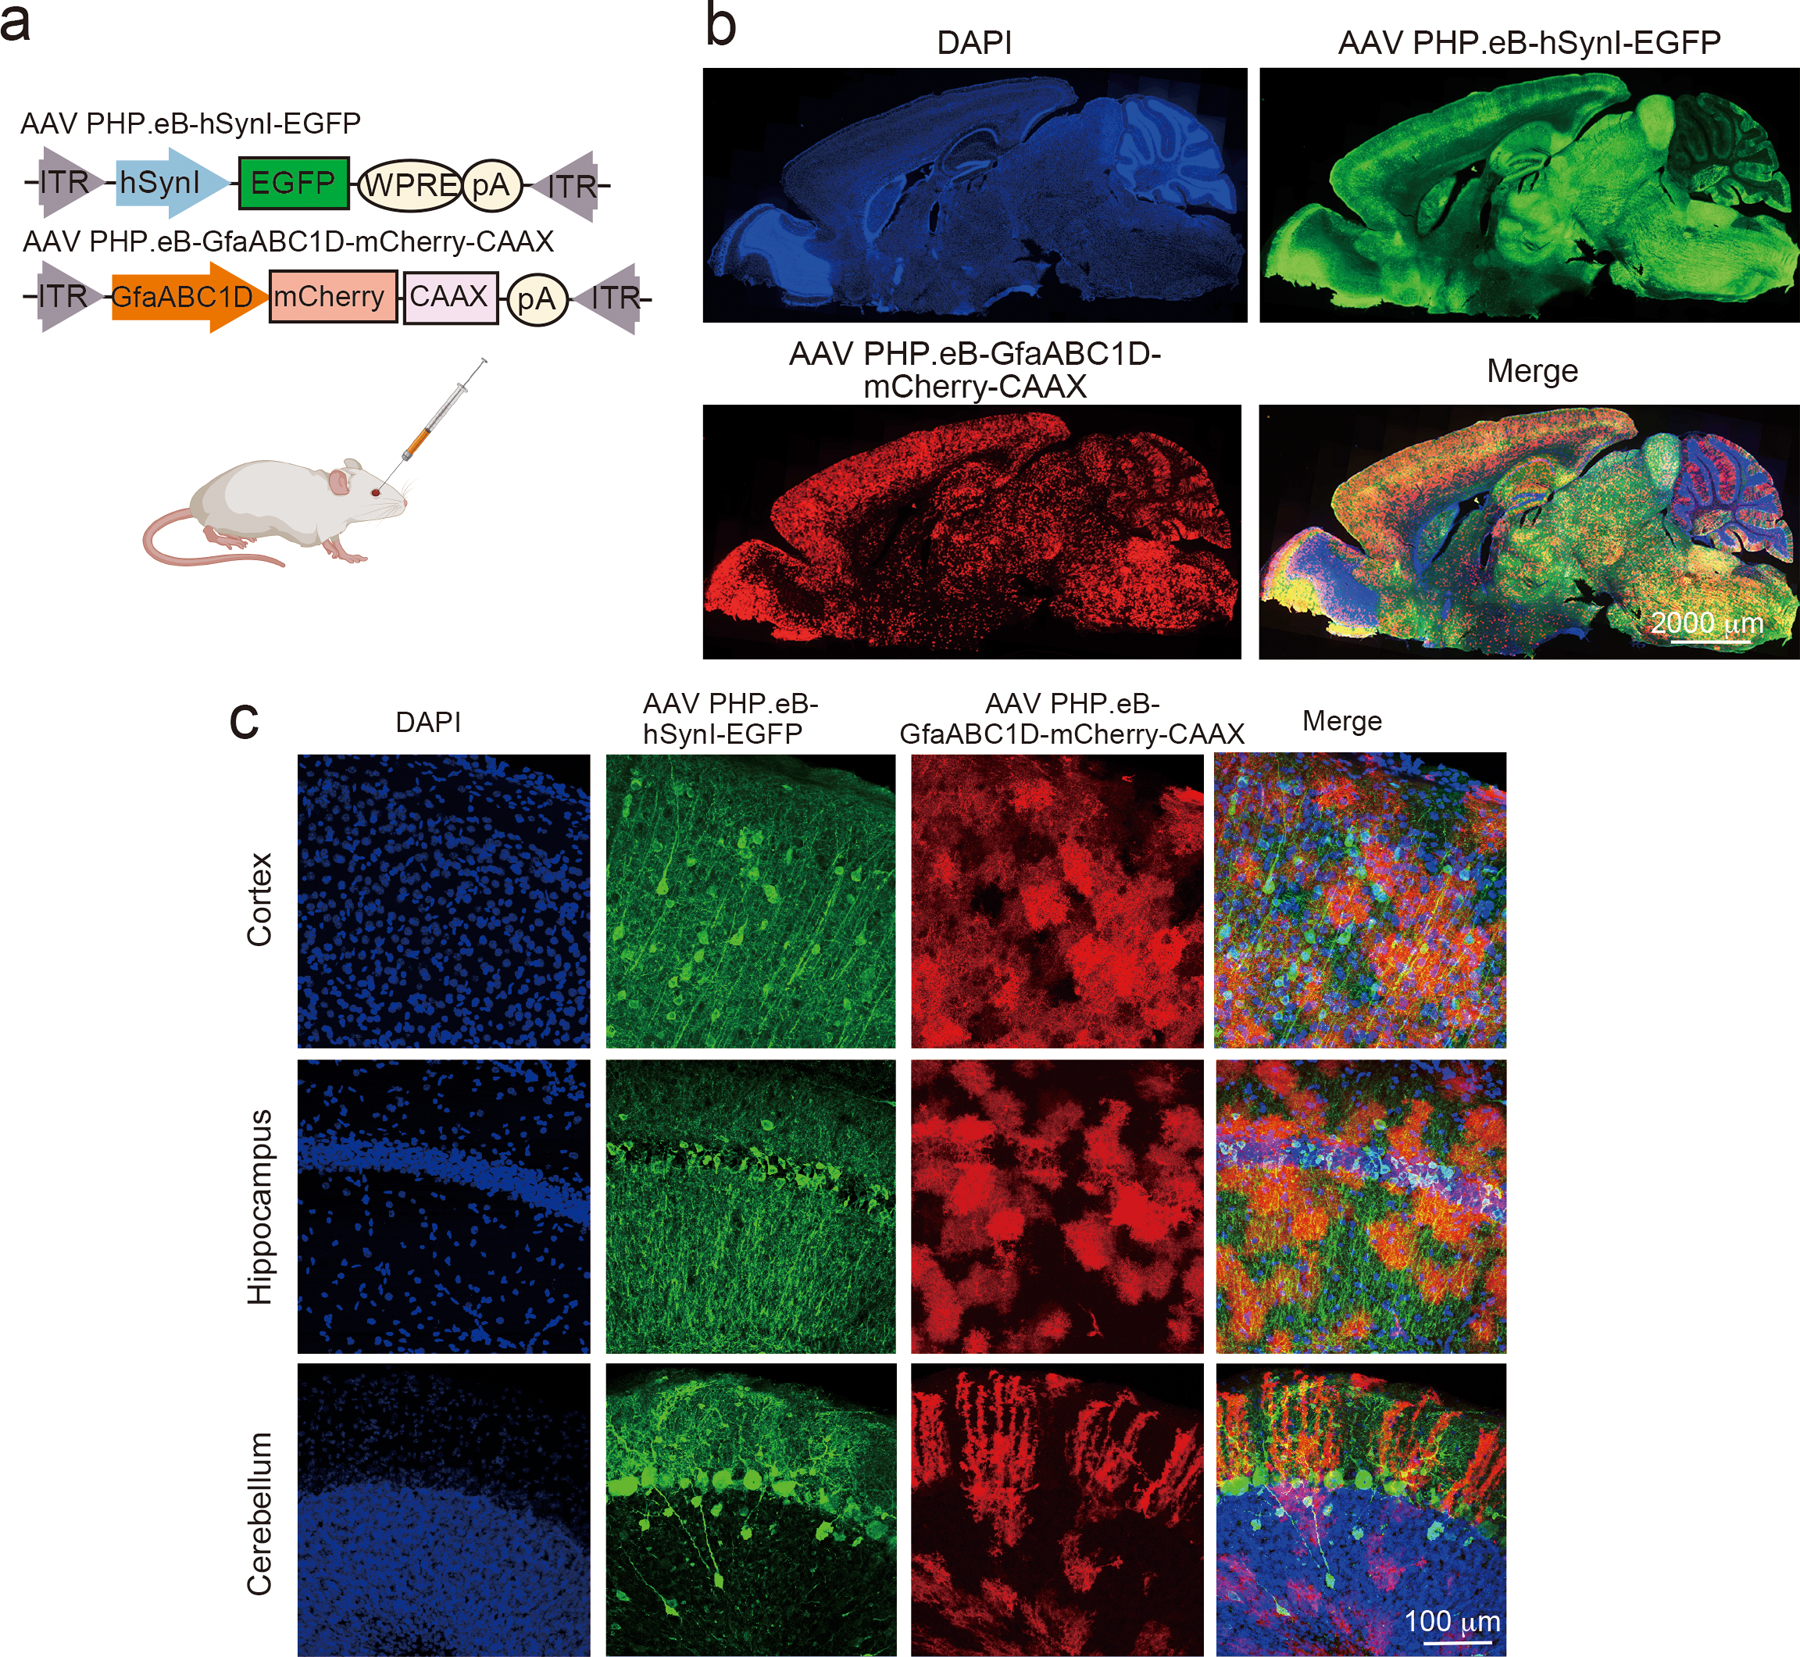
a, Schematic of AAV PHP.eB viruses for neuronal-EGFP or astrocyte-mCherry-CAAX and retro-orbital injection. b, Sagittal section of mouse brain showing expression throughout the cortex and other structures. c, Representative image from cortex, hippocampus or cerebellum showing high coverage of neuronal and astrocytic expression.
Extended Data Figure 4. Mapping and identification of tripartite synaptic cleft proteins by Split-TurboID in vivo.
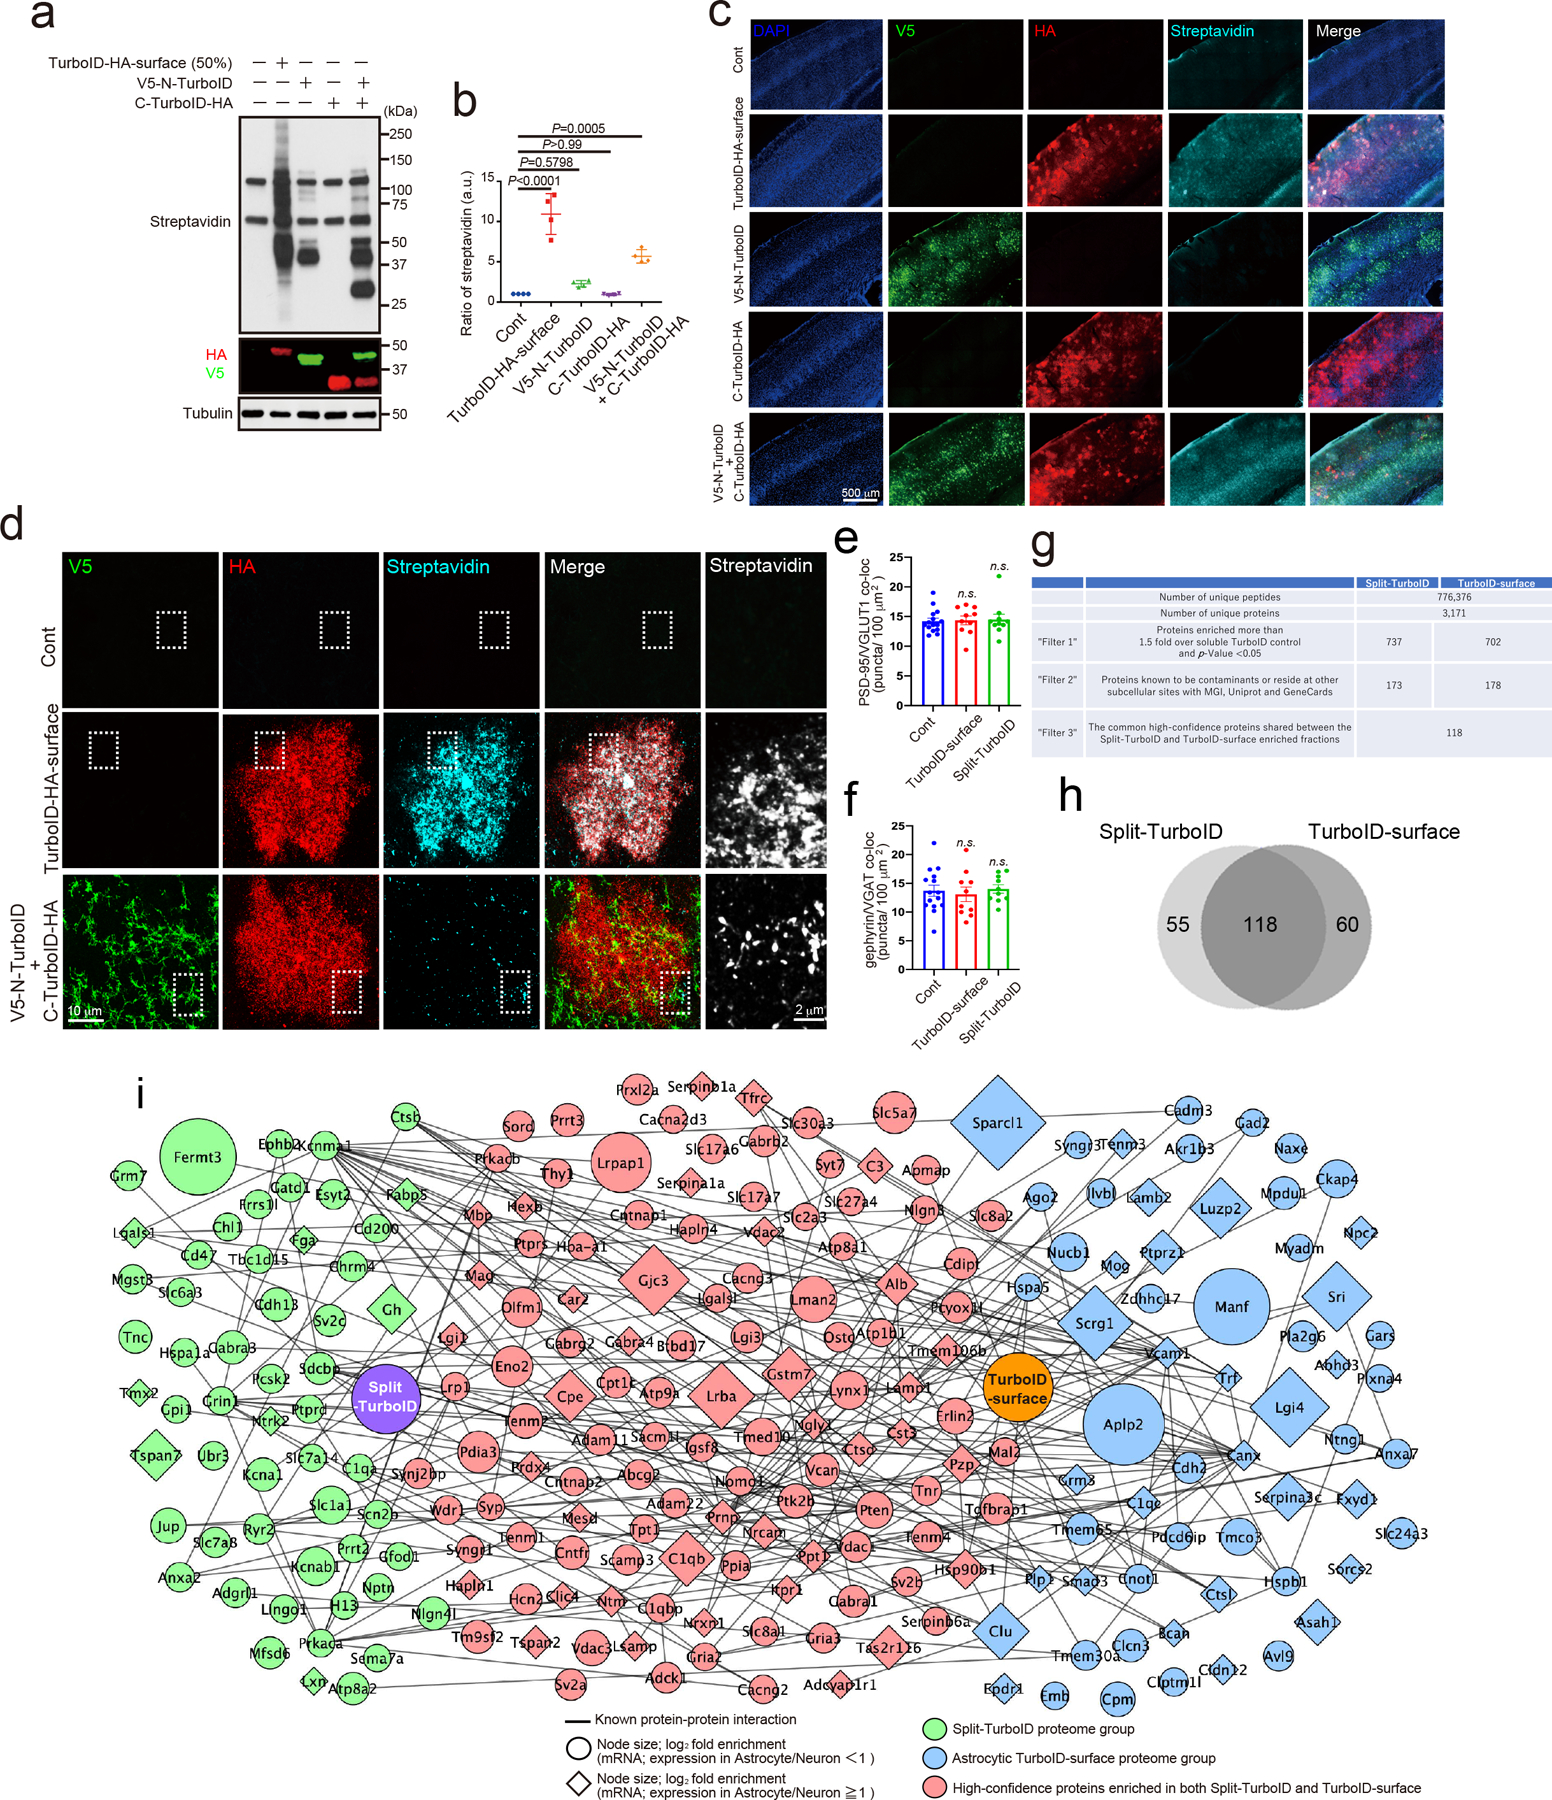
a, Biotinylation activity of Split-TurboID in vivo. Lysates of mouse brain infected with cell-type specific TurboID-surface-HA, V5-N-TurboID and/or C-TurboID-HA. Brain lysates were analyzed by immunoblotting with anti-Streptavidin, anti-V5, anti-HA and anti-Tubulin antibodies. b, The graph indicates the ratio of botinylation activity in vivo (n= 4 brains per each condition). c-d, The biotinylation of Split-TurboID in mouse cortex. e-f, Quantification of average number of excitatory or inhibitory synaptic co-localized puncta in layer 2/3 of the visual cortex. n= 15 slices per each condition from 3 mice. g, Chart summarizing proteomic dataset identified by mass spectrometry and filters used to identify top candidates. h, Venn diagram comparing proteome list of Split-TurboID and TurboID-surface. i, Scale-free network of Split-TurboID (green) and TurboID-surface (blue) identified proteins. High-confidence proteins enriched in both Split-TurboID and TurboID-surface fractions are shown in red. Neuronal enriched proteins (RNAseq expression ratio<1) and astrocyte enriched proteins (RNAseq expression ratio≧1.0) are represented as circle or diamond, respectively. At least n= 4 biological repeats. One-way ANOVA (Dunnett’s multiple comparison, p<0.0001, 0.001). Data are means ± s.e.m.
Extended Data Figure 5. The validation of candidate proteins with CRISPR-based astrocytic candidate gene depletion strategy.
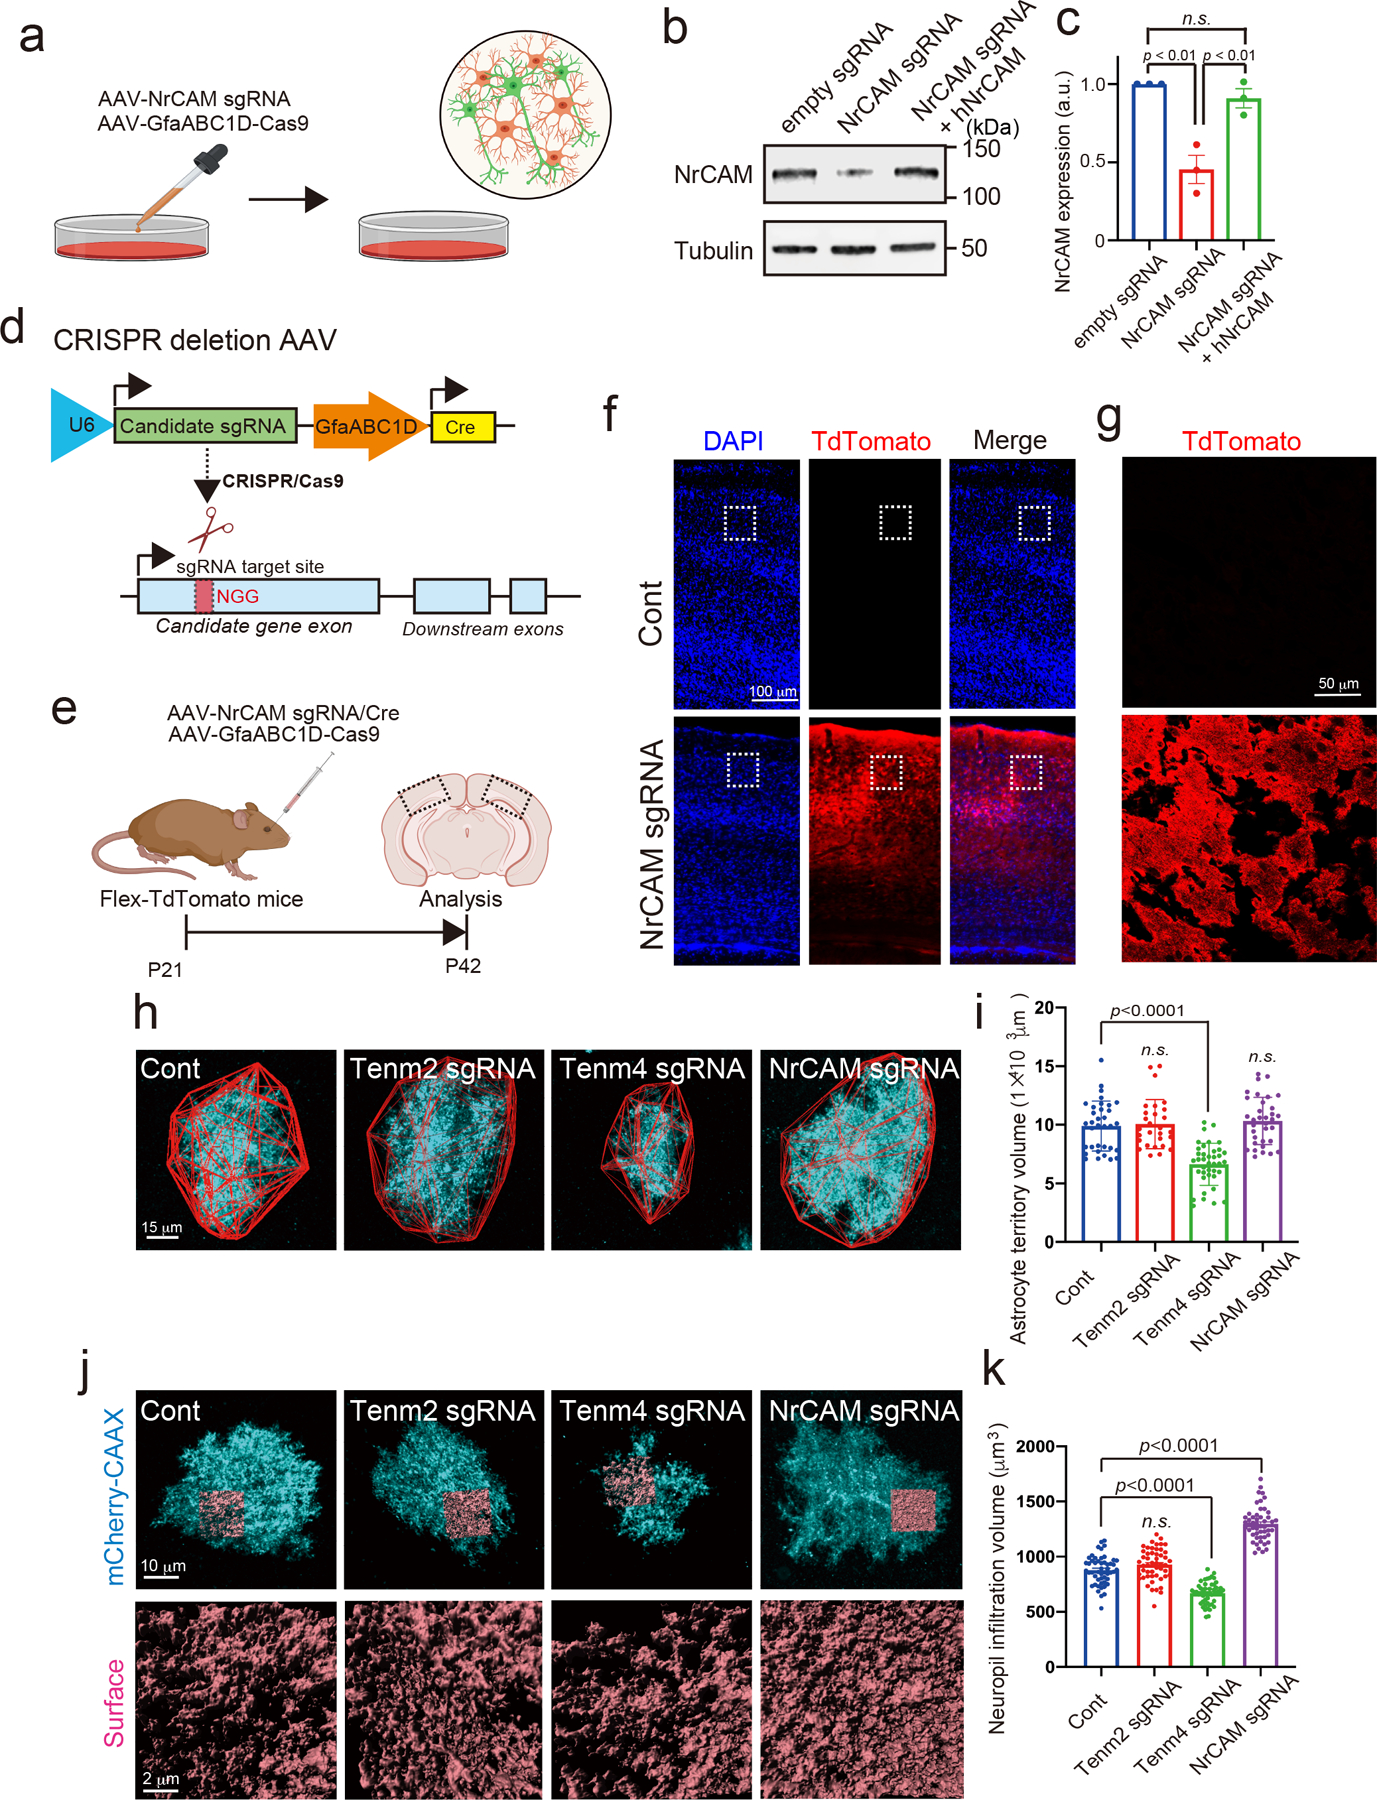
a, Schematic of CRISPR-based deletion of astrocytic NrCAM in vitro. b, Immunoblots showing loss of NrCAM with sgRNA. AAV1/2-U6-empty sgRNA or AAV1/2-U6-NrCAM sgRNA was co-infected with AAV1/2- GfaABC1D-Cas9 to cultured neurons and astrocytes at DIV14. The cells were subjected to immunoblot analysis with an anti-NrCAM antibody. Tubulin was used as a loading control. c, The bar graph indicates the expression level of NrCAM from 3 independent experiments. d, Schematic of CRISPR-based deletion strategy of candidate gene. e, Experimental timeline of AAV-mediated CRISPR-based astrocytic gene deletion strategy in Flex-TdTomato mice. f, AAV PHP.eB-U6-NrCAM sgRNA was co-infected with AAV PHP.eB-GfaABC1D-Cas9 in Flex-TdTomato mice at P21. Coronal sections were prepared and immunostained with an anti-TdTomato antibody. g, A High-magnification image is shown. h, Images of Tenm2-, Tenm4- or NrCAM-deleted astrocytes (cyan) and their territories (red outlines) in visual cortexes of juvenile mice. i, Average territory volumes at P42 of Tenm2-, Tenm4- or NrCAM-deleted astrocytes. Between 20–25 cells per condition from 3 mice. j, Images of Tenm2-, Tenm4- or NrCAM-deleted astrocytes (cyan) and their NIV reconstructions (orange) in visual cortexes of juvenile mice. k, Average NIV at P42 of Tenm2-, Tenm4- or NrCAM-deleted astrocytes. 51 cells per each condition from 3 mice. n= 3 biological repeats. One-way ANOVA (Dunnett’s multiple comparison, p<0.0001, 0.01). Data are means ± s.e.m.
Extended Data Figure 6. NrCAM is a novel tripartite synaptic protein.
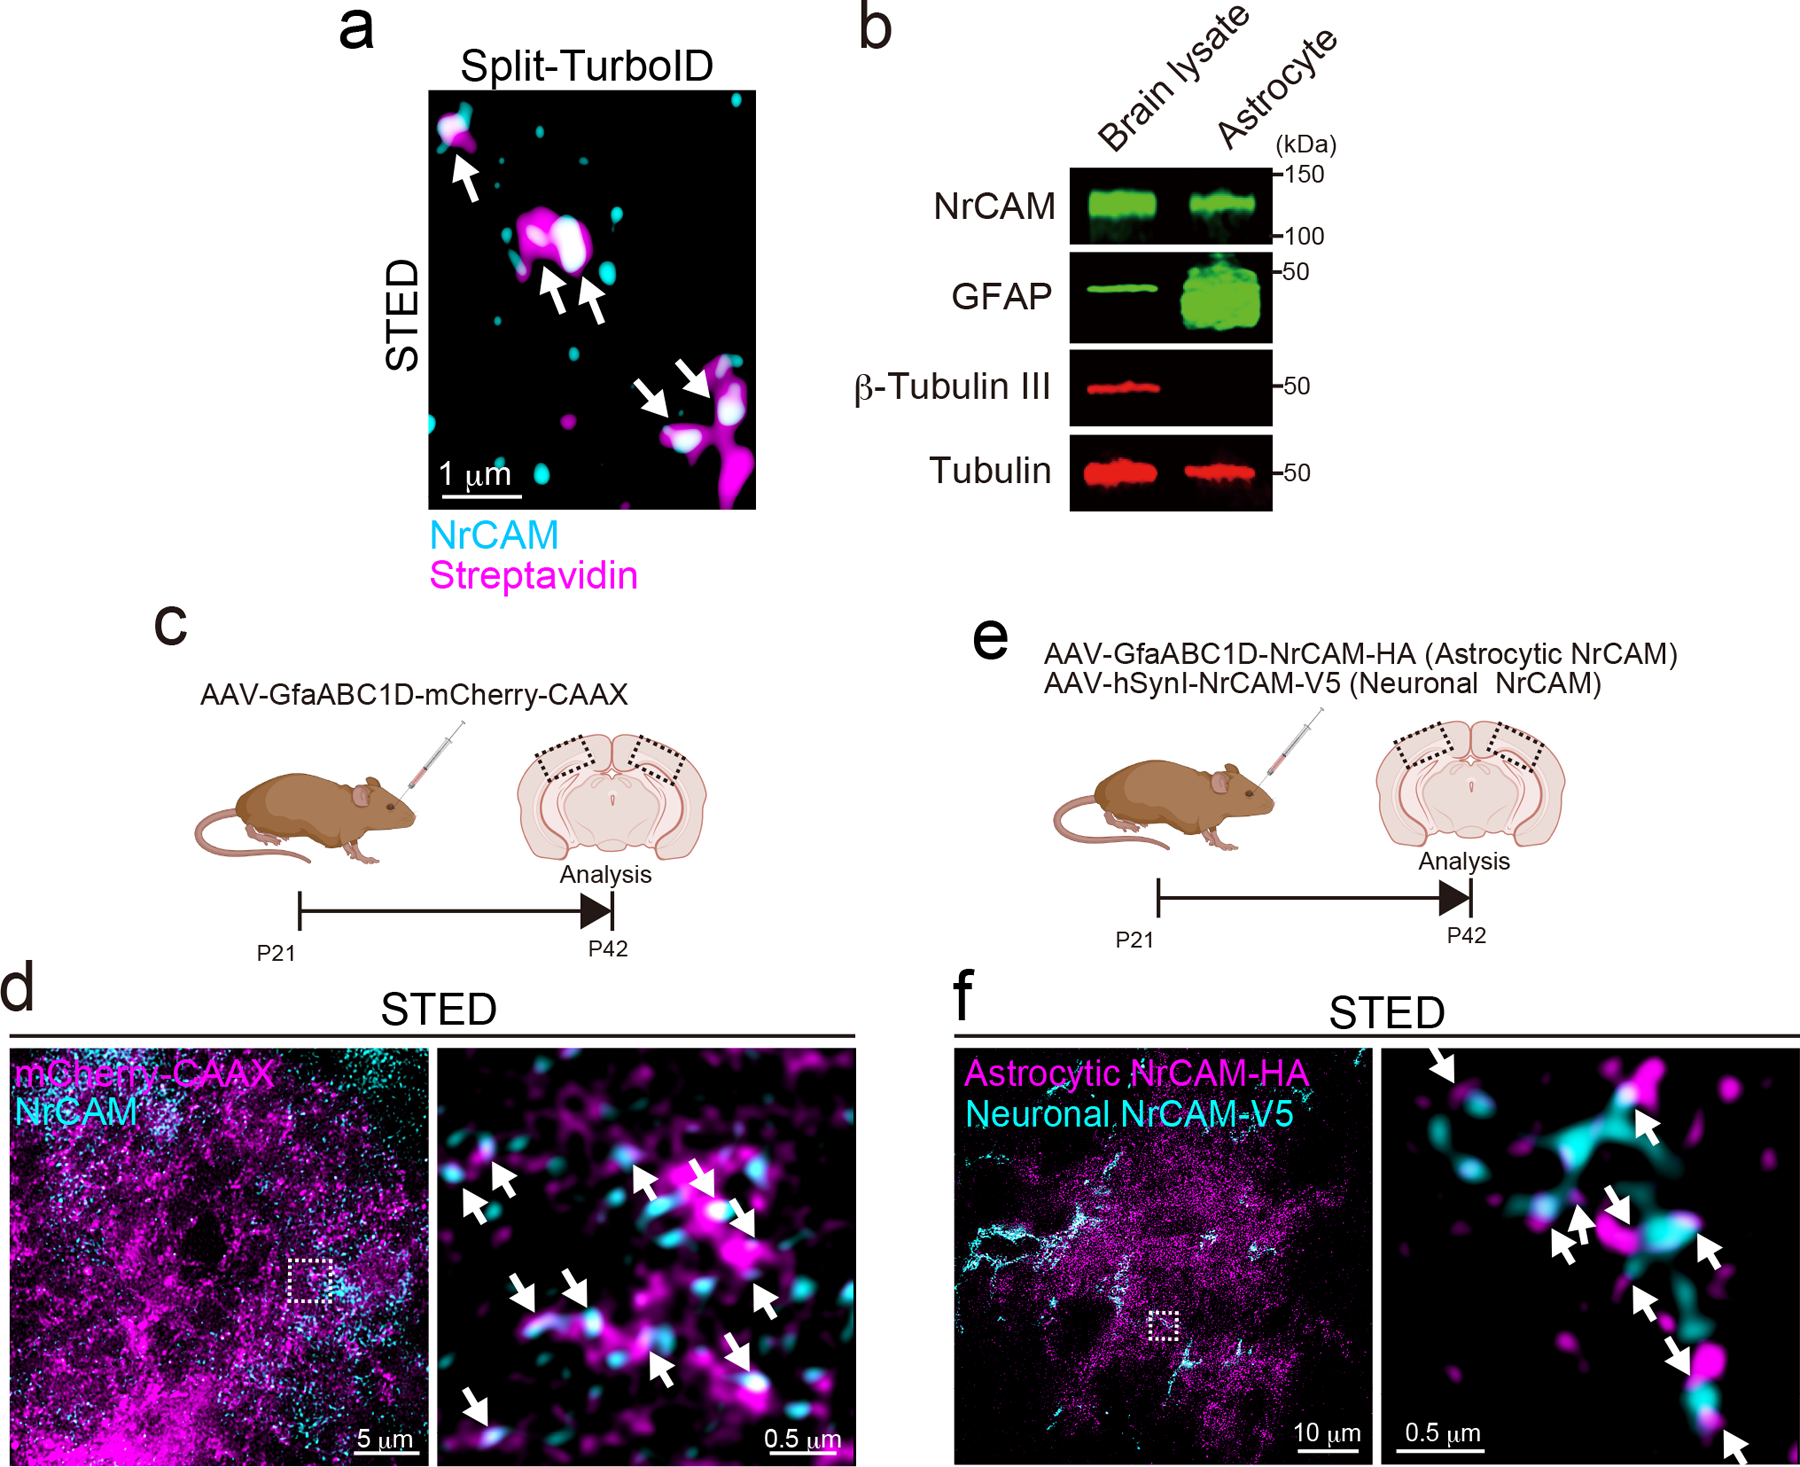
a, A high magnification STED image showing that endogenous NrCAM was enriched at biotinylated proteins in vivo. b, Immunoblot analysis of endogenous NrCAM, astrocyte marker GFAP, neuronal marker b-Tubulin III or loading control α-Tubulin from mouse brain or purified astrocyte lysate. c, Schematic of the visualization of astrocytic membrane and endogenous NrCAM in vivo. d, STED images demonstrating the localization of endogenous NrCAM in vivo. Coronal sections were immunostained with anti-NrCAM antibody (cyan). High magnification image was shown (right panel). e, Schematic of the visualization of both astrocytic and neuronal NrCAM in vivo. f, STED images demonstrating that the colocalization of astrocytic NrCAM with neuronal NrCAM in vivo. Coronal sections were prepared and co-immunostained with an anti-V5 (cyan) and anti-HA (magenta) antibody. A high-magnification image is shown in the right. n= 3 biological repeats. Data represent means ± s.e.m.
Extended Data Figure 7. The role of astrocytic NrCAM in astrocytic morphogenesis in vivo.
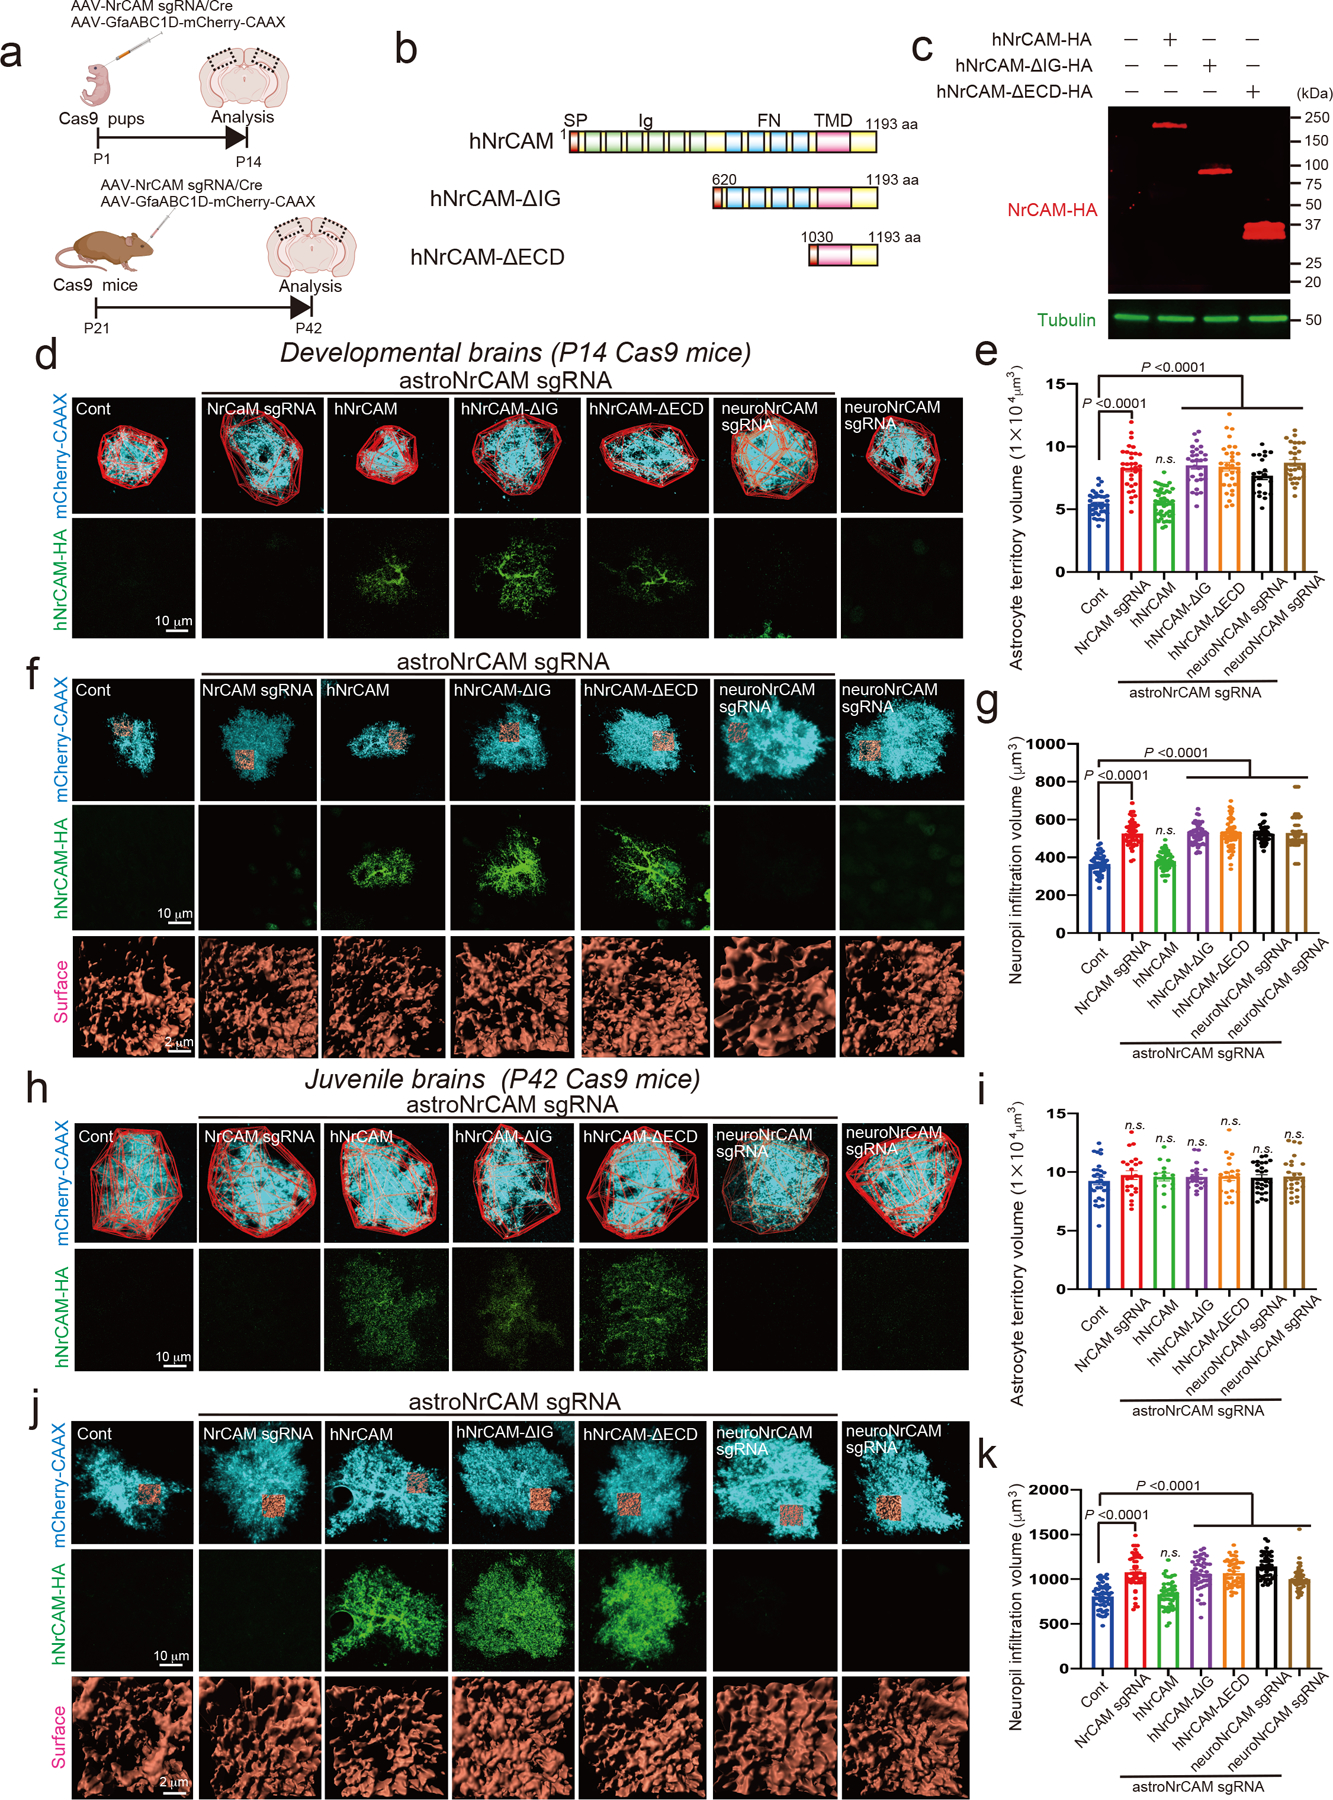
a, Schematic of CRISPR-based NrCAM deletion in vivo. b, Schematic of hNrCAM domains and fragments. SP, signal peptide; IG, immunoglobulin; FN, fibronectin; TMD, transmembrane domain; ECD, extracellular domains. c, Immunoblots showing the expression of each NrCAM fragments in HEK293T cells. d, f, h, j: Images of astrocytes following deletion of astrocyte NrCAM alone (NrCAM sgRNA), with co-expression with indicated constructs of sgRNA-resistant human NrCAM, neuronal NrCAM deletion (neuroNrCAM sgRNA), or following neuronal NrCAM deletion alone. Images at indicated ages represent. e and i; Analysis of astrocyte territory, 15 – 29 cells per each condition from 3 mice; g and k; Analysis of neuropil infiltration volume. 50 – 51 cells per each condition from 3 mice. n= 3 biological repeats. One-way ANOVA (Dunnett’s multiple comparison, p<0.0001). Data represent means ± s.e.m.
Extended Data Figure 8. NrCAM controls inhibitory synaptic specializations through binding the gephyrin.
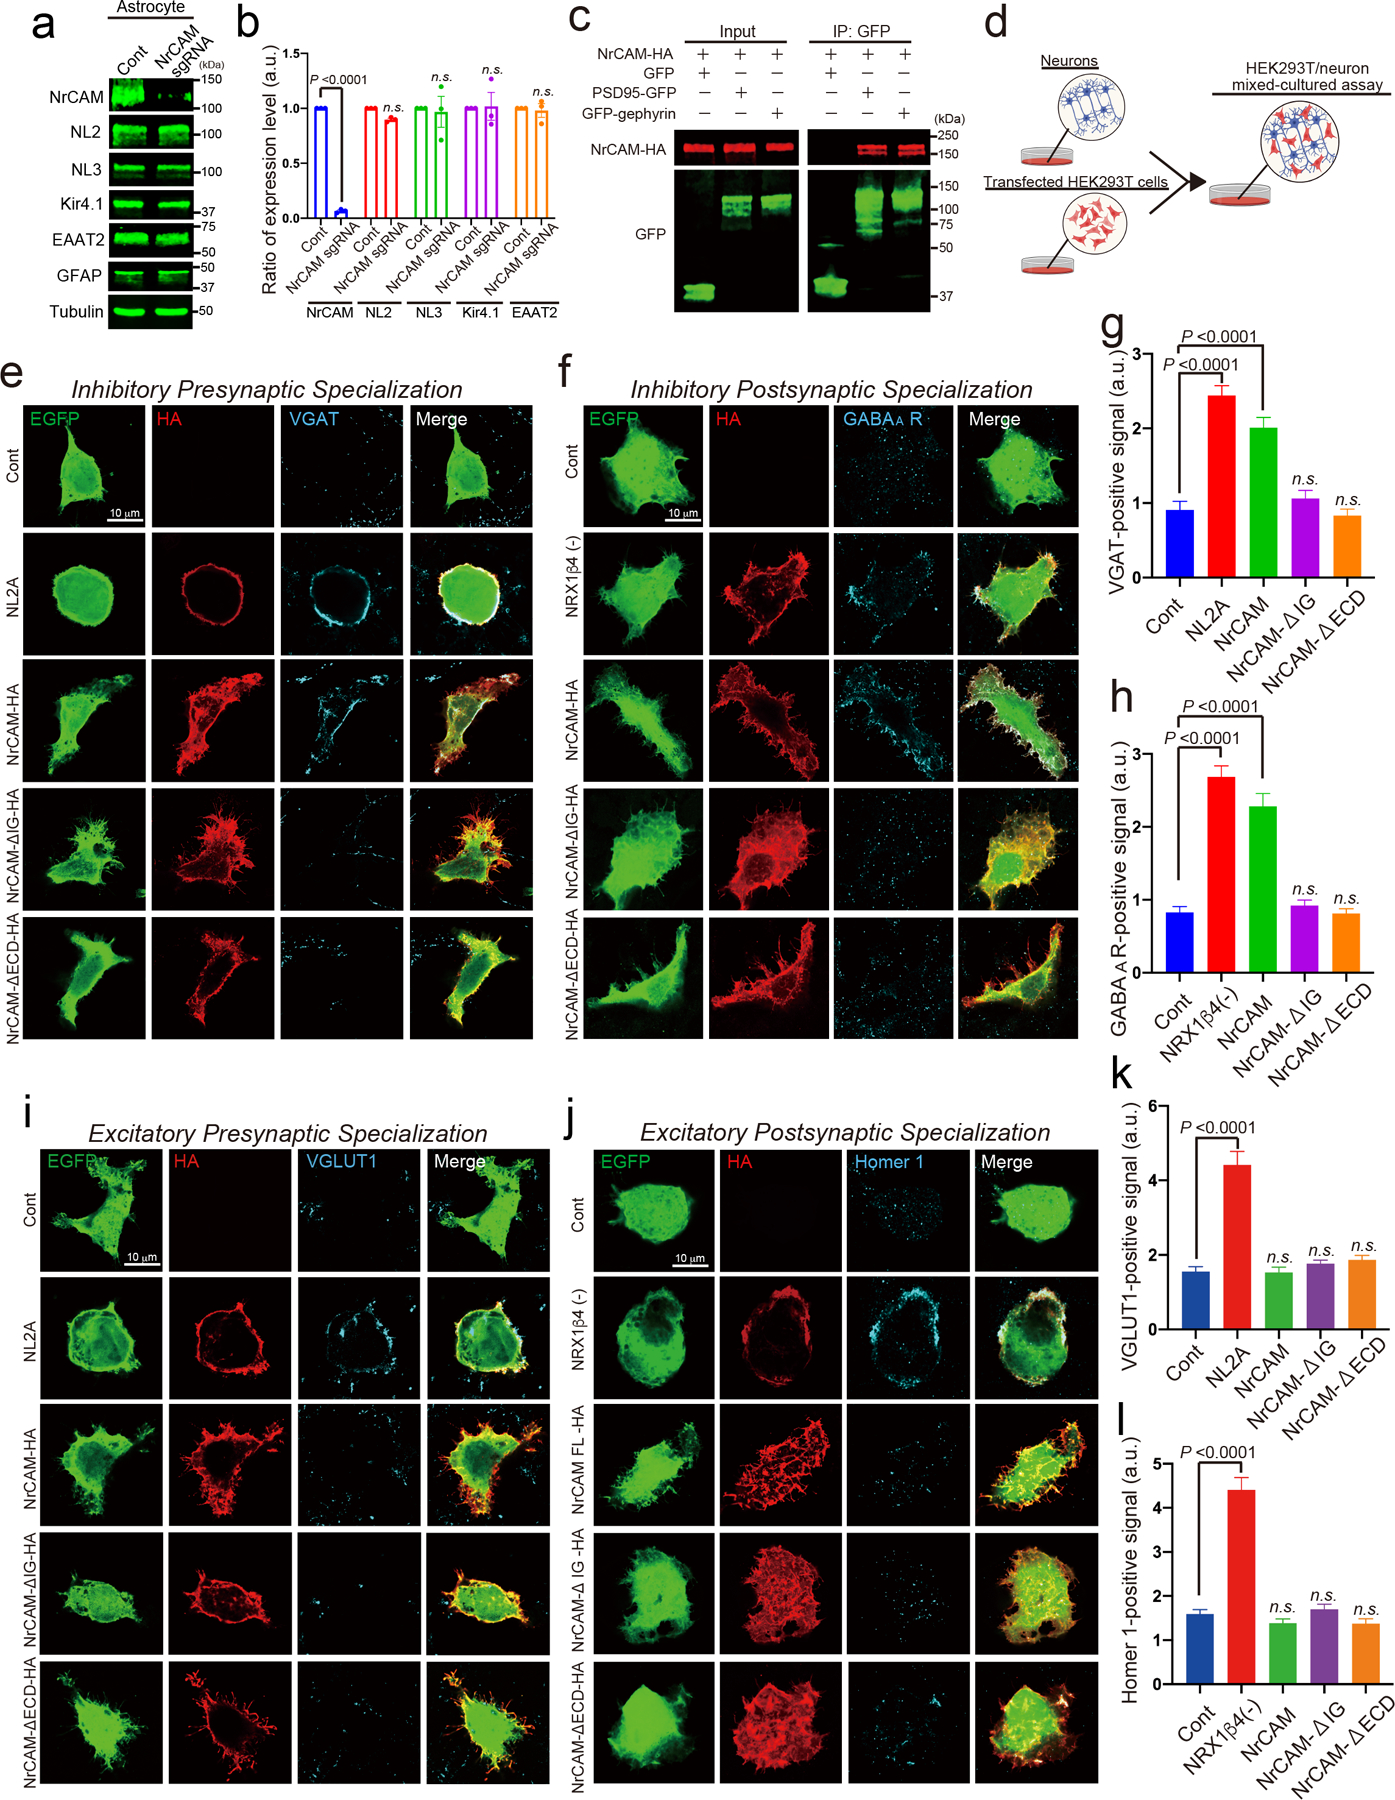
a, Immunoblot analysis of endogenous NrCAM, astrocyte marker GFAP, Neuroligin 2, Neuroligin 3, Kir4.1 or EAAT2 (GLT1) from purified astrocyte lysate. b, The bar graph indicates the expression level. c, The interaction of NrCAM with PSD95 and gephyrin in HEK293T cells. Cell lysates co-expressing NrCAM-HA with GFP, PSD95-GFP or GFP-gephyrin were incubated with anti-GFP-bound beads. Immunoprecipitated (right) or total (left) NrCAM, GFP, PSD95-GFP or GFP-gephyrin were detected by immunoblotting with anti-HA and anti-GFP antibodies. d, Schematic of HEK293T/neuronal mixed-cultured assay in vitro. e-h, Images of in vitro inhibitory synapse formation assays. The graph shows average of the total integrated intensity of VGAT (Cont= 258, NL2= 222, NrCAM= 242, NrCAM-ΔIG= 288, NrCAM-ΔECD= 303 cells) or GABAA receptor (Cont= 313, NRX1β4(−)= 310, NrCAM= 300, NrCAM-ΔIG= 278, NrCAM-ΔECD= 278 cells) clusters that contact transfected HEK293T cells. i-l, Images of in vitro excitatory synapse formation assay. The graph shows average of the total integrated intensity of VGLUT1 (Cont= 259, NL2= 306, NrCAM= 286, NrCAM-ΔIG= 321, NrCAM-ΔECD= 196 cells) or Homer1 (Cont= 471, NRX1β4(−)= 214, NrCAM= 247, NrCAM-ΔIG= 387, NrCAM-ΔECD= 251 cells) clusters that contact transfected HEK293T cells. n= 3 biological repeats. One-way ANOVA (Dunnett’s multiple comparison, p<0.0001). Data are means ± s.e.m.
Extended Data Figure 9. The effect of NrCAM on excitatory synapse formation and function in vivo.
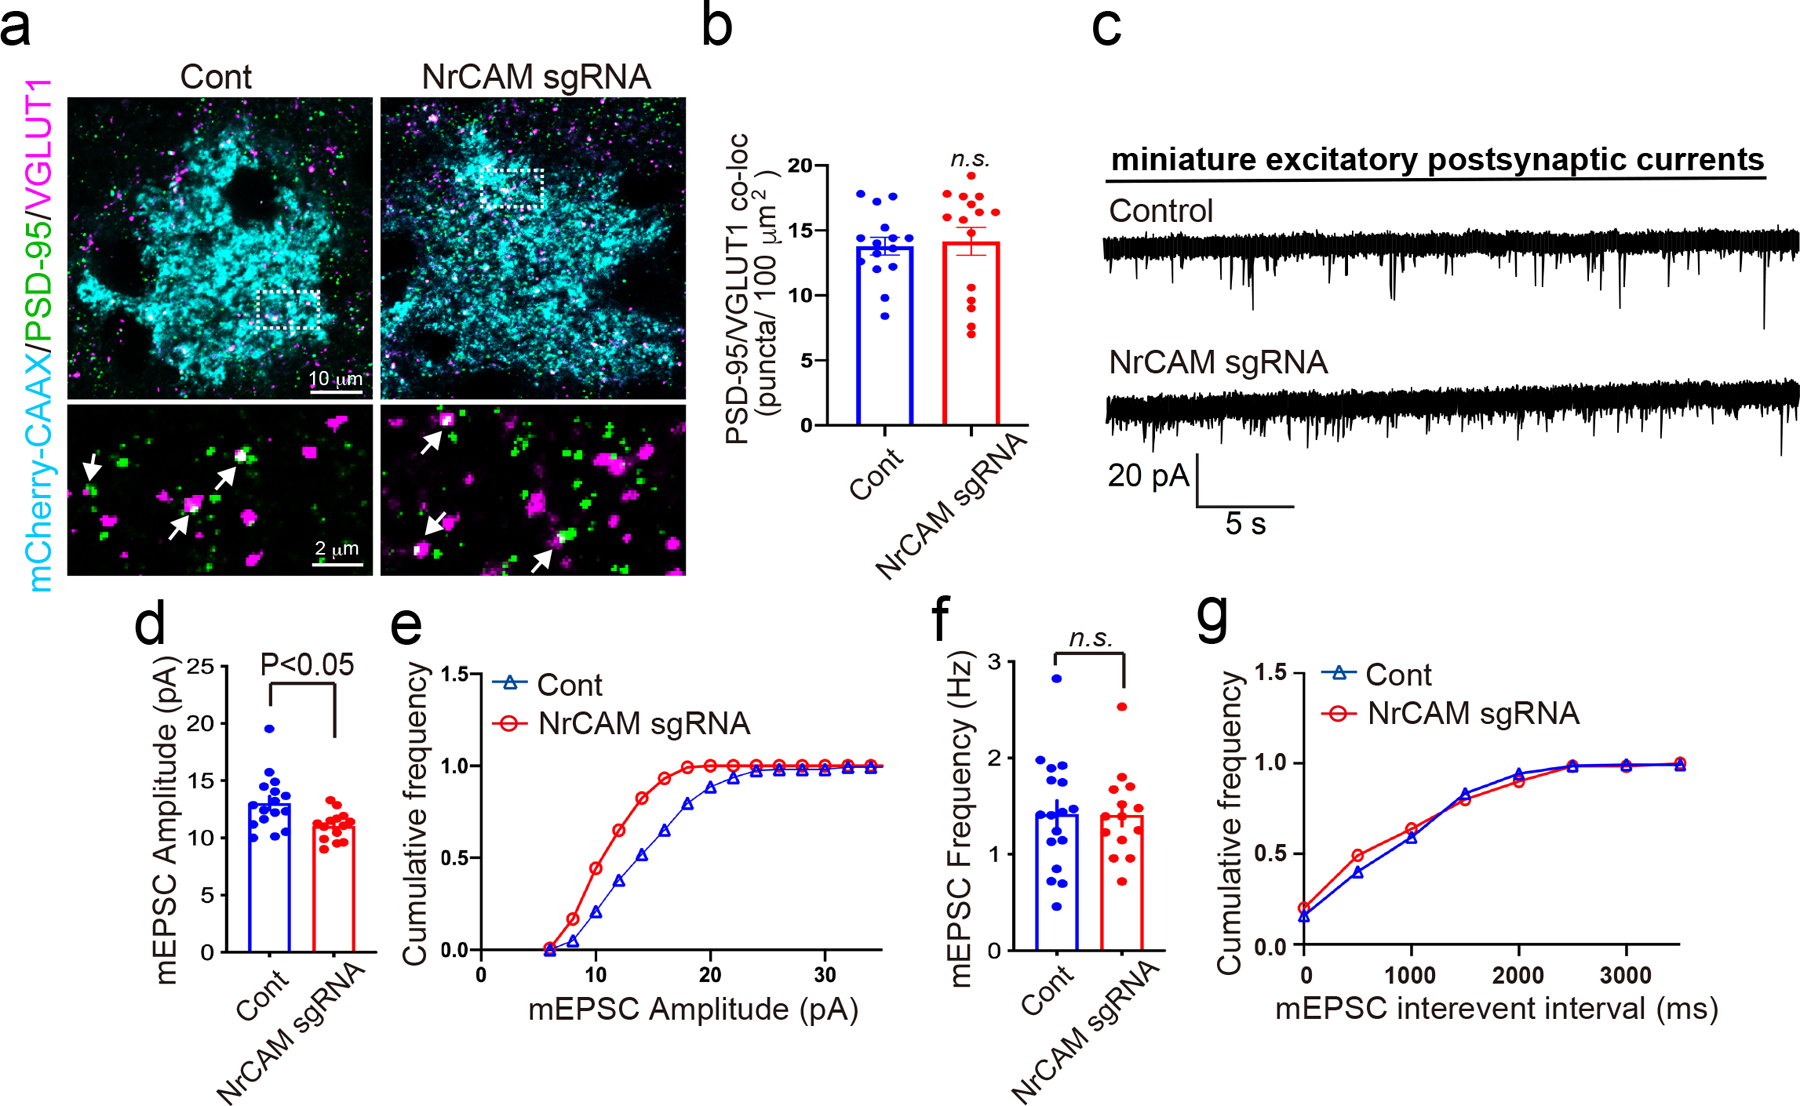
a, Images of postsynapse PSD-95 and presynapse VGLUT1 within NrCAM-deletion astrocytes in L1 of the visual cortex. High magnification images (bottom) correspond to boxes (above). b, Quantification of average number of excitatory synaptic co-localized puncta within astrocyte territories. n= 15 cells per each condition from 3 mice. c, mEPSC traces from L2/3 pyramidal neurons following astrocyte control empty sgRNA or NrCAM sgRNA expression. d-g, Quantification of mEPSC amplitude (d-e; Cont= 16, NrCAM sgRNA= 14 cells from 4 mice) and frequency (f-g; Cont= 14, NrCAM sgRNA= 17 cells from each of 4 mice). At least n= 3 biological repeats. Student’s t-test (paired, p<0.05). Data represent means ± s.e.m.
Extended Data Figure 10. In vivo chemogenetics method, Split-TurboID, reveals a novel astrocytic cell adhesion molecule, NrCAM, that controls inhibitory synaptic organization.
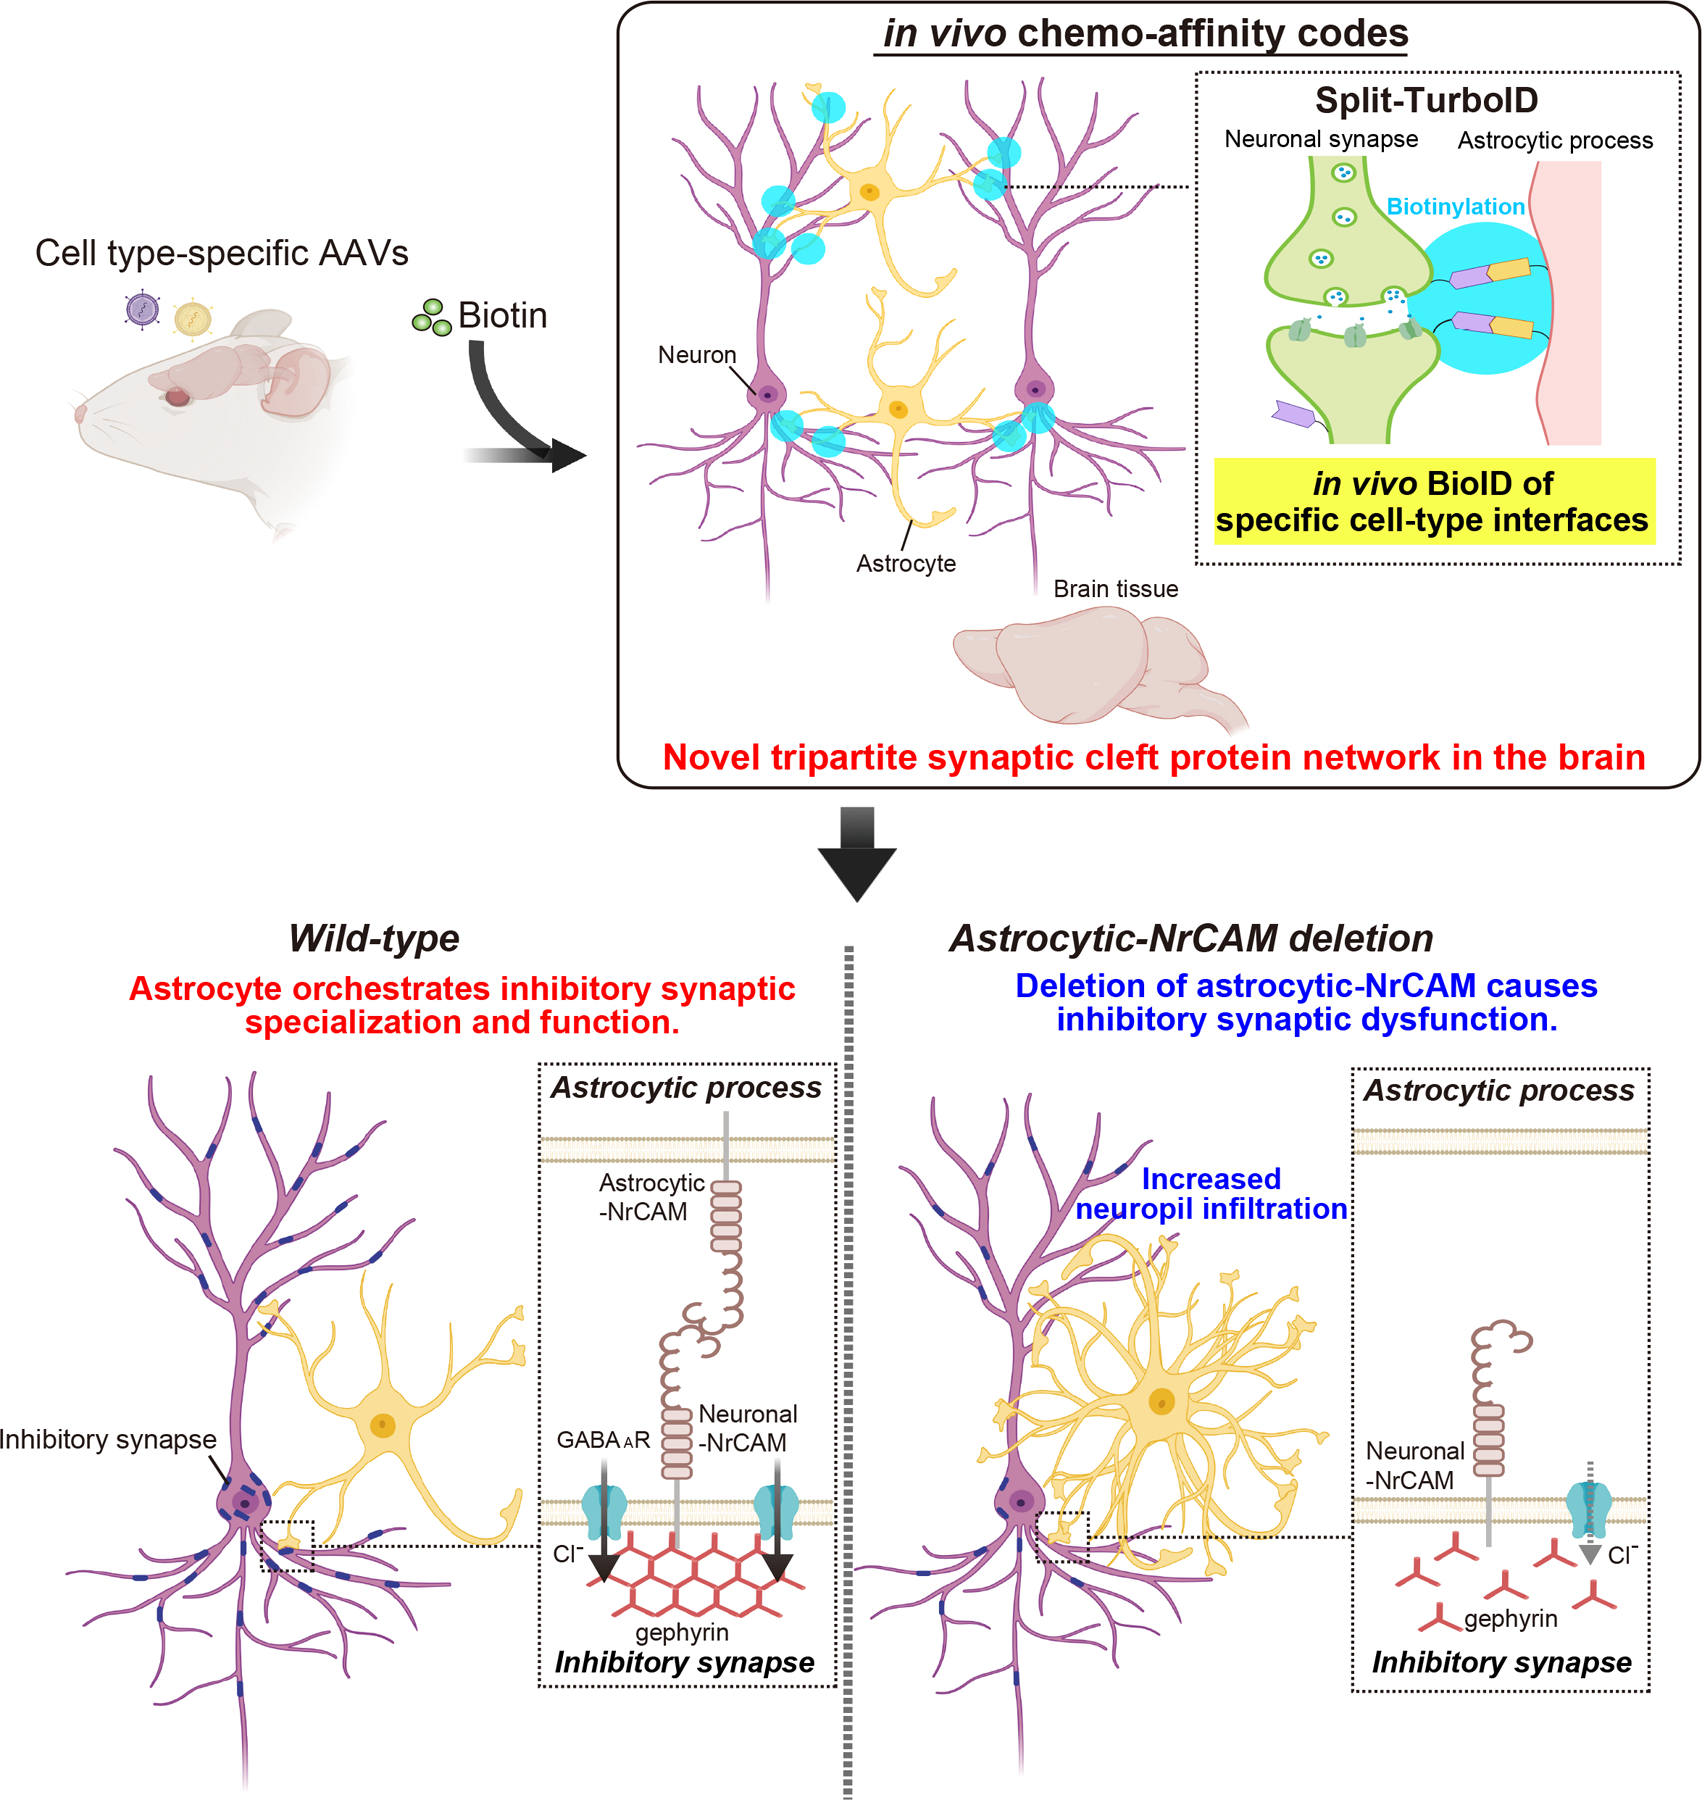
Development of in vivo chemo-affinity codes, Split-TurboID, and a working model of astrocytic NrCAM influencing inhibitory synaptic function. Split-TurboID can map the molecular composition of such intercellular contacts, even within the highly complex structure of the tripartite synapse in vivo. Mapping this interface, we discovered a new molecular mechanism by which astrocytes influence inhibitory synapses within the tripartite synaptic cleft via NrCAM. NrCAM is expressed in cortical astrocytes where it interacts with neuronal NrCAM that is coupled to gephyrin at inhibitory postsynapses. Loss of astrocytic NrCAM dramatically alters inhibitory synaptic organization and function in vivo.
Supplementary Material
Acknowledgements
We thank Dr. H. Katsura for modifying the promoter of the surface and split TurboID plasmids for HEK293T cell expression (Duke University), and Dr. B. Duncan for technical support (University of North Carolina School of Medicine, Chapel Hill). This work was supported by Brain initiative RO1DA047258 from NIH (S.H.S and C.E), R01MH113280 from NIH (P.F.M), Kahn Neurotechnology Award (S.H.S and C.E), a Grant-in-Aid for JSPS Fellows (PD) 20153173 from the Japan Society for the Promotion of Science (T.T), The Uehara memorial Foundation (T.T), and National Institute of Mental Health Fellowship F30MH117851 (J.L.C).
Footnotes
Competing financial interests
The authors declare no competing financial interests.
Data availability
Proteomics data are available in the MassIVE database. The data that support the findings of this study are available from the corresponding author upon reasonable request.
References
- 1.Yu X, Nagai J & Khakh BS Improved tools to study astrocytes. Nature reviews. Neuroscience 21, 121–138, 10.1038/s41583-020-0264-8 (2020). [DOI] [PubMed] [Google Scholar]
- 2.Lanjakornsiripan D et al. Layer-specific morphological and molecular differences in neocortical astrocytes and their dependence on neuronal layers. Nature communications 9, 1623, 10.1038/s41467-018-03940-3 (2018). [DOI] [PMC free article] [PubMed] [Google Scholar]
- 3.Araque A, Parpura V, Sanzgiri RP & Haydon PG Tripartite synapses: glia, the unacknowledged partner. Trends in neurosciences 22, 208–215, 10.1016/s0166-2236(98)01349-6 (1999). [DOI] [PubMed] [Google Scholar]
- 4.Khakh BS & Sofroniew MV Diversity of astrocyte functions and phenotypes in neural circuits. Nature neuroscience 18, 942–952, 10.1038/nn.4043 (2015). [DOI] [PMC free article] [PubMed] [Google Scholar]
- 5.Ma Z, Stork T, Bergles DE & Freeman MR Neuromodulators signal through astrocytes to alter neural circuit activity and behaviour. Nature 539, 428–432, 10.1038/nature20145 (2016). [DOI] [PMC free article] [PubMed] [Google Scholar]
- 6.Papouin T, Dunphy J, Tolman M, Foley JC & Haydon PG Astrocytic control of synaptic function. Philosophical transactions of the Royal Society of London. Series B, Biological sciences 372, 10.1098/rstb.2016.0154 (2017). [DOI] [PMC free article] [PubMed] [Google Scholar]
- 7.Panatier A et al. Astrocytes are endogenous regulators of basal transmission at central synapses. Cell 146, 785–798, 10.1016/j.cell.2011.07.022 (2011). [DOI] [PubMed] [Google Scholar]
- 8.Araque A et al. Gliotransmitters travel in time and space. Neuron 81, 728–739, 10.1016/j.neuron.2014.02.007 (2014). [DOI] [PMC free article] [PubMed] [Google Scholar]
- 9.Stogsdill JA et al. Astrocytic neuroligins control astrocyte morphogenesis and synaptogenesis. Nature 551, 192–197, 10.1038/nature24638 (2017). [DOI] [PMC free article] [PubMed] [Google Scholar]
- 10.Stork T, Sheehan A, Tasdemir-Yilmaz OE & Freeman MR Neuron-glia interactions through the Heartless FGF receptor signaling pathway mediate morphogenesis of Drosophila astrocytes. Neuron 83, 388–403, 10.1016/j.neuron.2014.06.026 (2014). [DOI] [PMC free article] [PubMed] [Google Scholar]
- 11.Sloan SA & Barres BA Mechanisms of astrocyte development and their contributions to neurodevelopmental disorders. Current opinion in neurobiology 27, 75–81, 10.1016/j.conb.2014.03.005 (2014). [DOI] [PMC free article] [PubMed] [Google Scholar]
- 12.Allen NJ & Lyons DA Glia as architects of central nervous system formation and function. Science (New York, N.Y.) 362, 181–185, 10.1126/science.aat0473 (2018). [DOI] [PMC free article] [PubMed] [Google Scholar]
- 13.Branon TC et al. Efficient proximity labeling in living cells and organisms with TurboID. Nat Biotechnol 36, 880–887, 10.1038/nbt.4201 (2018). [DOI] [PMC free article] [PubMed] [Google Scholar]
- 14.Schopp IM et al. Split-BioID a conditional proteomics approach to monitor the composition of spatiotemporally defined protein complexes. Nature communications 8, 15690, 10.1038/ncomms15690 (2017). [DOI] [PMC free article] [PubMed] [Google Scholar]
- 15.De Munter S et al. Split-BioID: a proximity biotinylation assay for dimerization-dependent protein interactions. FEBS Lett 591, 415–424, 10.1002/1873-3468.12548 (2017). [DOI] [PubMed] [Google Scholar]
- 16.Kinoshita N et al. Genetically Encoded Fluorescent Indicator GRAPHIC Delineates Intercellular Connections. iScience 15, 28–38, 10.1016/j.isci.2019.04.013 (2019). [DOI] [PMC free article] [PubMed] [Google Scholar]
- 17.Lee Y, Messing A, Su M & Brenner M GFAP promoter elements required for region-specific and astrocyte-specific expression. Glia 56, 481–493, 10.1002/glia.20622 (2008). [DOI] [PubMed] [Google Scholar]
- 18.Chan KY et al. Engineered AAVs for efficient noninvasive gene delivery to the central and peripheral nervous systems. Nature neuroscience 20, 1172–1179, 10.1038/nn.4593 (2017). [DOI] [PMC free article] [PubMed] [Google Scholar]
- 19.Uezu A et al. Identification of an elaborate complex mediating postsynaptic inhibition. Science (New York, N.Y.) 353, 1123–1129, 10.1126/science.aag0821 (2016). [DOI] [PMC free article] [PubMed] [Google Scholar]
- 20.Zhang Y et al. An RNA-sequencing transcriptome and splicing database of glia, neurons, and vascular cells of the cerebral cortex. The Journal of neuroscience : the official journal of the Society for Neuroscience 34, 11929–11947, 10.1523/JNEUROSCI.1860-14.2014 (2014). [DOI] [PMC free article] [PubMed] [Google Scholar]
- 21.Zhang Y et al. Purification and Characterization of Progenitor and Mature Human Astrocytes Reveals Transcriptional and Functional Differences with Mouse. Neuron 89, 37–53, 10.1016/j.neuron.2015.11.013 (2016). [DOI] [PMC free article] [PubMed] [Google Scholar]
- 22.Sakers K & Eroglu C Control of neural development and function by glial neuroligins. Current opinion in neurobiology 57, 163–170, 10.1016/j.conb.2019.03.007 (2019). [DOI] [PMC free article] [PubMed] [Google Scholar]
- 23.Incontro S, Asensio CS, Edwards RH & Nicoll RA Efficient, complete deletion of synaptic proteins using CRISPR. Neuron 83, 1051–1057, 10.1016/j.neuron.2014.07.043 (2014). [DOI] [PMC free article] [PubMed] [Google Scholar]
- 24.Custer AW et al. The role of the ankyrin-binding protein NrCAM in node of Ranvier formation. The Journal of neuroscience : the official journal of the Society for Neuroscience 23, 10032–10039 (2003). [DOI] [PMC free article] [PubMed] [Google Scholar]
- 25.Feinberg K et al. A glial signal consisting of gliomedin and NrCAM clusters axonal Na+ channels during the formation of nodes of Ranvier. Neuron 65, 490–502, 10.1016/j.neuron.2010.02.004 (2010). [DOI] [PMC free article] [PubMed] [Google Scholar]
- 26.Demyanenko GP et al. Neural cell adhesion molecule NrCAM regulates Semaphorin 3F-induced dendritic spine remodeling. The Journal of neuroscience : the official journal of the Society for Neuroscience 34, 11274–11287, 10.1523/JNEUROSCI.1774-14.2014 (2014). [DOI] [PMC free article] [PubMed] [Google Scholar]
- 27.Mohan V et al. Temporal Regulation of Dendritic Spines Through NrCAM-Semaphorin3F Receptor Signaling in Developing Cortical Pyramidal Neurons. Cerebral cortex (New York, N.Y. : 1991) 29, 963–977, 10.1093/cercor/bhy004 (2019). [DOI] [PMC free article] [PubMed] [Google Scholar]
- 28.Mauro VP, Krushel LA, Cunningham BA & Edelman GM Homophilic and heterophilic binding activities of Nr-CAM, a nervous system cell adhesion molecule. The Journal of cell biology 119, 191–202, 10.1083/jcb.119.1.191 (1992). [DOI] [PMC free article] [PubMed] [Google Scholar]
- 29.Derouiche A, Anlauf E, Aumann G, Muhlstadt B & Lavialle M Anatomical aspects of glia-synapse interaction: the perisynaptic glial sheath consists of a specialized astrocyte compartment. J Physiol Paris 96, 177–182, 10.1016/s0928-4257(02)00004-9 (2002). [DOI] [PubMed] [Google Scholar]
- 30.Lavialle M et al. Structural plasticity of perisynaptic astrocyte processes involves ezrin and metabotropic glutamate receptors. Proceedings of the National Academy of Sciences of the United States of America 108, 12915–12919, 10.1073/pnas.1100957108 (2011). [DOI] [PMC free article] [PubMed] [Google Scholar]
- 31.Scheiffele P, Fan J, Choih J, Fetter R & Serafini T Neuroligin expressed in nonneuronal cells triggers presynaptic development in contacting axons. Cell 101, 657–669, 10.1016/s0092-8674(00)80877-6 (2000). [DOI] [PubMed] [Google Scholar]
- 32.Graf ER, Zhang X, Jin SX, Linhoff MW & Craig AM Neurexins induce differentiation of GABA and glutamate postsynaptic specializations via neuroligins. Cell 119, 1013–1026, 10.1016/j.cell.2004.11.035 (2004). [DOI] [PMC free article] [PubMed] [Google Scholar]
- 33.Chih B, Gollan L & Scheiffele P Alternative splicing controls selective trans-synaptic interactions of the neuroligin-neurexin complex. Neuron 51, 171–178, 10.1016/j.neuron.2006.06.005 (2006). [DOI] [PubMed] [Google Scholar]
- 34.Tremblay R, Lee S & Rudy B GABAergic Interneurons in the Neocortex: From Cellular Properties to Circuits. Neuron 91, 260–292, 10.1016/j.neuron.2016.06.033 (2016). [DOI] [PMC free article] [PubMed] [Google Scholar]
- 35.Miles R, Toth K, Gulyas AI, Hajos N & Freund TF Differences between somatic and dendritic inhibition in the hippocampus. Neuron 16, 815–823, 10.1016/s0896-6273(00)80101-4 (1996). [DOI] [PubMed] [Google Scholar]
- 36.Wierenga CJ & Wadman WJ Miniature inhibitory postsynaptic currents in CA1 pyramidal neurons after kindling epileptogenesis. J Neurophysiol 82, 1352–1362, 10.1152/jn.1999.82.3.1352 (1999). [DOI] [PubMed] [Google Scholar]
- 37.Martell JD et al. A split horseradish peroxidase for the detection of intercellular protein-protein interactions and sensitive visualization of synapses. Nat Biotechnol 34, 774–780, 10.1038/nbt.3563 (2016). [DOI] [PMC free article] [PubMed] [Google Scholar]
- 38.Loh KH et al. Proteomic Analysis of Unbounded Cellular Compartments: Synaptic Clefts. Cell 166, 1295–1307 e1221, 10.1016/j.cell.2016.07.041 (2016). [DOI] [PMC free article] [PubMed] [Google Scholar]
- 39.Cijsouw T et al. Mapping the Proteome of the Synaptic Cleft through Proximity Labeling Reveals New Cleft Proteins. Proteomes 6, 10.3390/proteomes6040048 (2018). [DOI] [PMC free article] [PubMed] [Google Scholar]
- 40.Li J et al. Cell-Surface Proteomic Profiling in the Fly Brain Uncovers Wiring Regulators. Cell, 10.1016/j.cell.2019.12.029 (2020). [DOI] [PMC free article] [PubMed] [Google Scholar]
- 41.Cho KF et al. Split-TurboID enables contact-dependent proximity labeling in cells. Proceedings of the National Academy of Sciences of the United States of America 117, 12143–12154, 10.1073/pnas.1919528117 (2020). [DOI] [PMC free article] [PubMed] [Google Scholar]
- 42.Elmariah SB, Oh EJ, Hughes EG & Balice-Gordon RJ Astrocytes regulate inhibitory synapse formation via Trk-mediated modulation of postsynaptic GABAA receptors. The Journal of neuroscience : the official journal of the Society for Neuroscience 25, 3638–3650, 10.1523/JNEUROSCI.3980-04.2005 (2005). [DOI] [PMC free article] [PubMed] [Google Scholar]
- 43.Hughes EG, Elmariah SB & Balice-Gordon RJ Astrocyte secreted proteins selectively increase hippocampal GABAergic axon length, branching, and synaptogenesis. Mol Cell Neurosci 43, 136–145, 10.1016/j.mcn.2009.10.004 (2010). [DOI] [PMC free article] [PubMed] [Google Scholar]
- 44.Turrigiano GG, Leslie KR, Desai NS, Rutherford LC & Nelson SB Activity-dependent scaling of quantal amplitude in neocortical neurons. Nature 391, 892–896, 10.1038/36103 (1998). [DOI] [PubMed] [Google Scholar]
- 45.O’Brien RJ et al. Activity-dependent modulation of synaptic AMPA receptor accumulation. Neuron 21, 1067–1078, 10.1016/s0896-6273(00)80624-8 (1998). [DOI] [PubMed] [Google Scholar]
- 46.Spence EF et al. In vivo proximity proteomics of nascent synapses reveals a novel regulator of cytoskeleton-mediated synaptic maturation. Nature communications 10, 386, 10.1038/s41467-019-08288-w (2019). [DOI] [PMC free article] [PubMed] [Google Scholar]
- 47.Shin JH, Yue Y & Duan D Recombinant adeno-associated viral vector production and purification. Methods Mol Biol 798, 267–284, 10.1007/978-1-61779-343-1_15 (2012). [DOI] [PMC free article] [PubMed] [Google Scholar]
- 48.Takano T et al. LMTK1 regulates dendritic formation by regulating movement of Rab11A-positive endosomes. Molecular biology of the cell 25, 1755–1768, 10.1091/mbc.E14-01-0675 (2014). [DOI] [PMC free article] [PubMed] [Google Scholar]
- 49.Takano T et al. Discovery of long-range inhibitory signaling to ensure single axon formation. Nature communications 8, 33, 10.1038/s41467-017-00044-2 (2017). [DOI] [PMC free article] [PubMed] [Google Scholar]
- 50.Dani A, Huang B, Bergan J, Dulac C & Zhuang X Superresolution imaging of chemical synapses in the brain. Neuron 68, 843–856, 10.1016/j.neuron.2010.11.021 (2010). [DOI] [PMC free article] [PubMed] [Google Scholar]
Associated Data
This section collects any data citations, data availability statements, or supplementary materials included in this article.
Supplementary Materials
Data Availability Statement
Proteomics data are available in the MassIVE database. The data that support the findings of this study are available from the corresponding author upon reasonable request.


