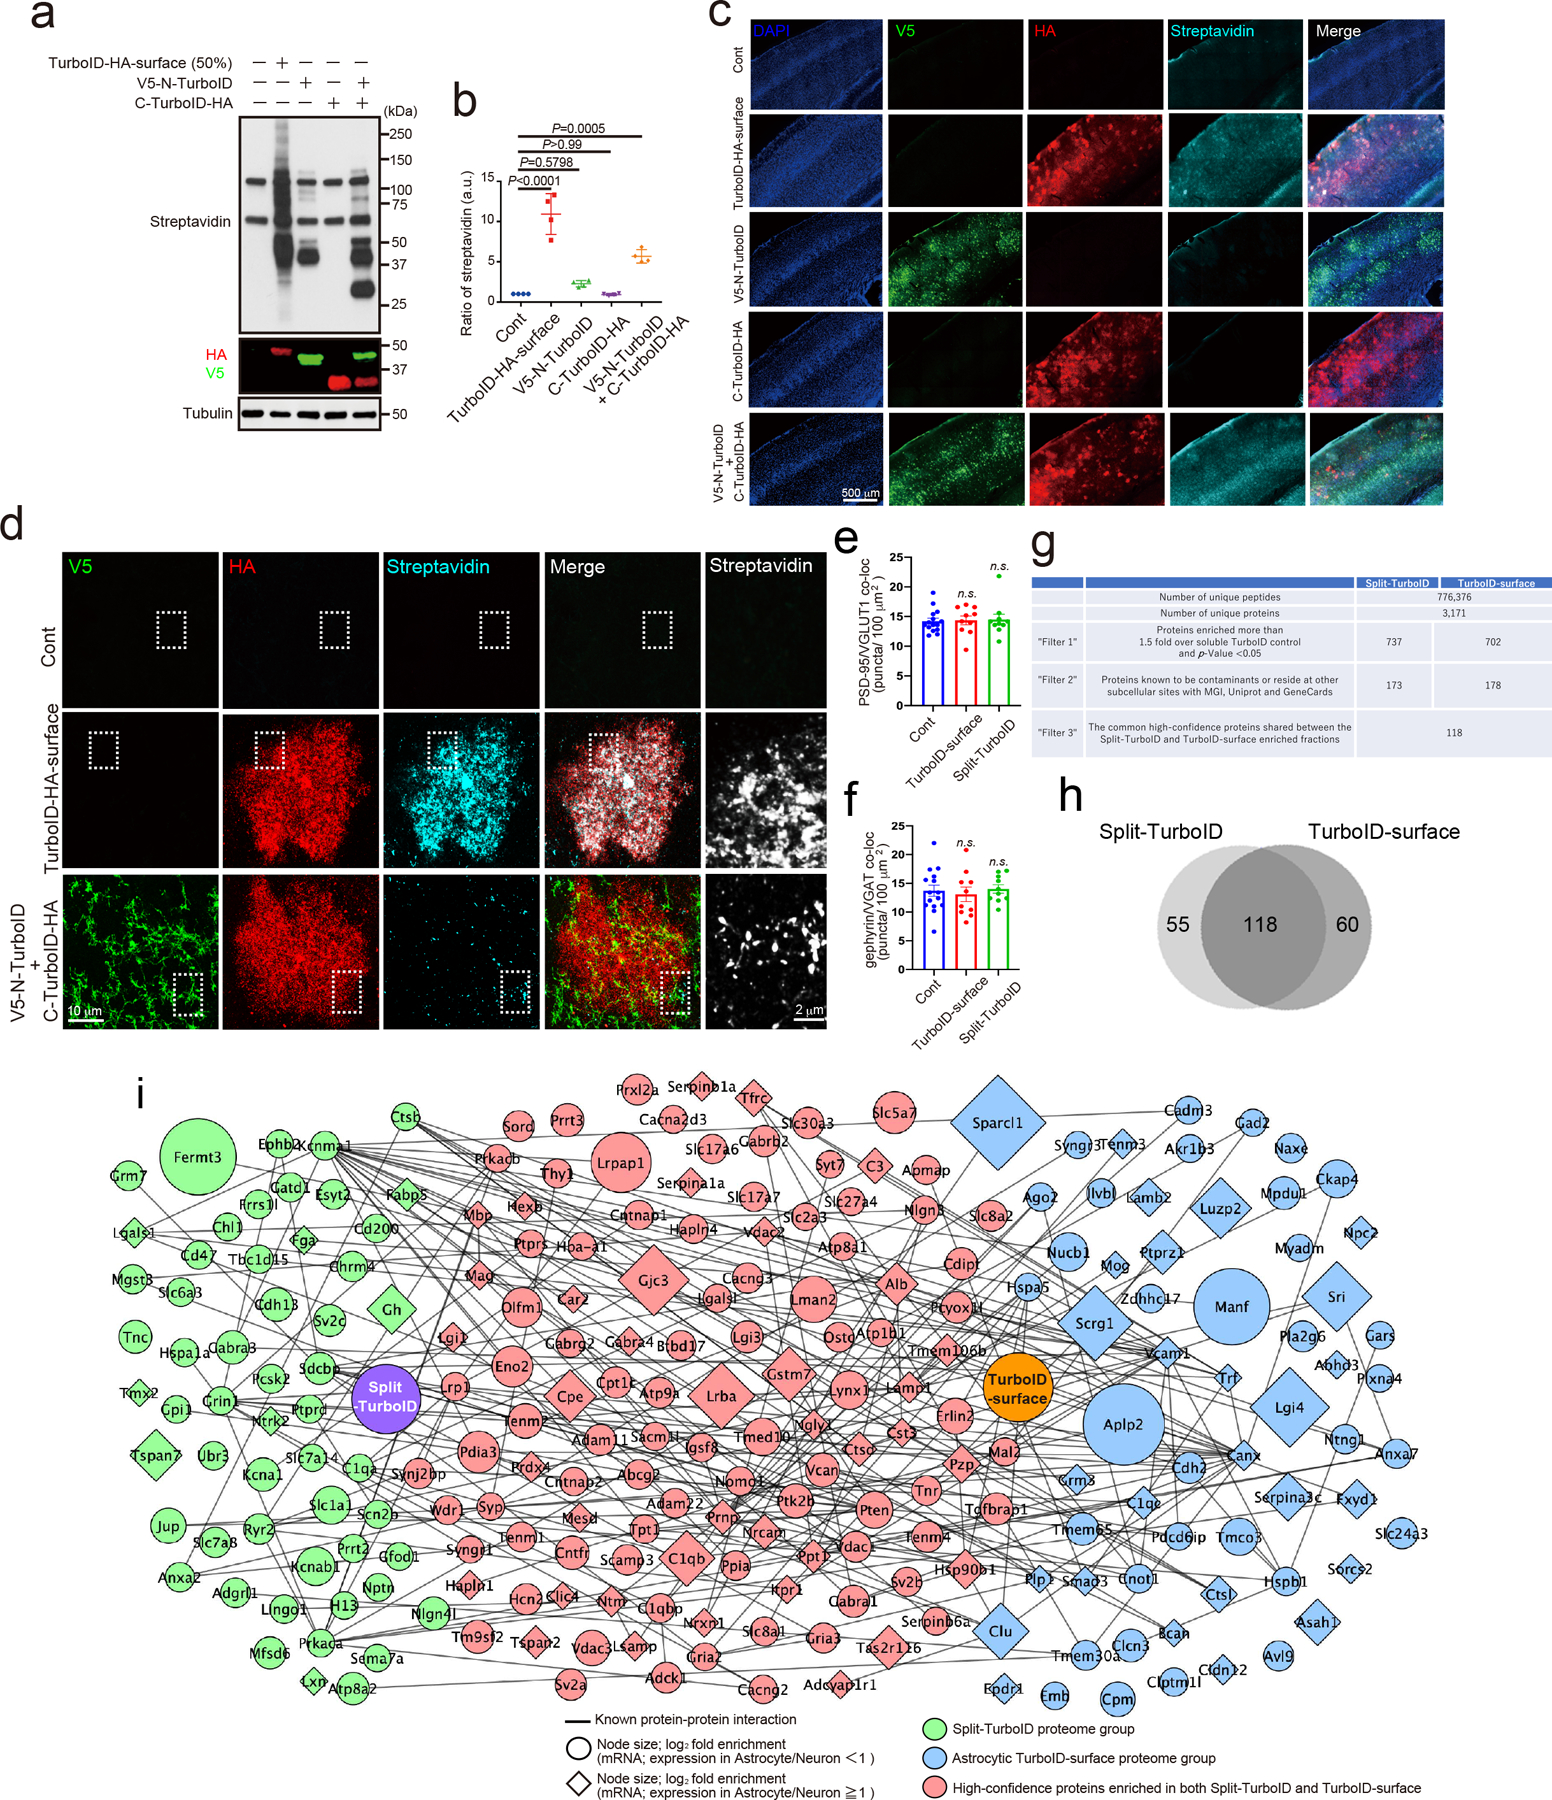
Extended Data Figure 4. Mapping and identification of tripartite synaptic cleft proteins by Split-TurboID in vivo.

a, Biotinylation activity of Split-TurboID in vivo. Lysates of mouse brain infected with cell-type specific TurboID-surface-HA, V5-N-TurboID and/or C-TurboID-HA. Brain lysates were analyzed by immunoblotting with anti-Streptavidin, anti-V5, anti-HA and anti-Tubulin antibodies. b, The graph indicates the ratio of botinylation activity in vivo (n= 4 brains per each condition). c-d, The biotinylation of Split-TurboID in mouse cortex. e-f, Quantification of average number of excitatory or inhibitory synaptic co-localized puncta in layer 2/3 of the visual cortex. n= 15 slices per each condition from 3 mice. g, Chart summarizing proteomic dataset identified by mass spectrometry and filters used to identify top candidates. h, Venn diagram comparing proteome list of Split-TurboID and TurboID-surface. i, Scale-free network of Split-TurboID (green) and TurboID-surface (blue) identified proteins. High-confidence proteins enriched in both Split-TurboID and TurboID-surface fractions are shown in red. Neuronal enriched proteins (RNAseq expression ratio<1) and astrocyte enriched proteins (RNAseq expression ratio≧1.0) are represented as circle or diamond, respectively. At least n= 4 biological repeats. One-way ANOVA (Dunnett’s multiple comparison, p<0.0001, 0.001). Data are means ± s.e.m.
