Abstract
Self-discrimination, a critical but ill-defined molecular process programmed during thymocyte development, requires myriad pre–T cell receptors (preTCRs) and αβTCRs. Using x-ray crystallography, we show how a preTCR applies the concave β-sheet surface of its single variable domain (Vβ) to “horizontally” grab the protruding MHC α2-helix. By contrast, αβTCRs purpose all six complementarity-determining region (CDR) loops of their paired VαVβ module to recognize peptides bound to major histocompatibility complex molecules (pMHCs) in “vertical” head-to-head binding. The preTCR topological fit ensures that CDR3β reaches the peptide’s featured C-terminal segment for pMHC sampling, establishing the subsequent αβTCR canonical docking mode. “Horizontal” docking precludes germline CDR1β- and CDR2β-MHC binding to broaden β-chain repertoire diversification before αβTCR-mediated selection refinement. Thus, one subunit successively attunes the recognition logic of related multicomponent receptors.
Pluripotent progenitors seed the thymus and undergo massive expansion in a precisely orchestrated manner (1). Proliferation at the early CD4−CD8− double-negative (DN) thymocyte stages (DN1, DN2, and DN3a) is driven by stem cell factor, interleukin-7, and Notch (2, 3). Productive T cell receptor (TCR)–β-chain rearrangement and surface pre–T cell receptor (preTCR) expression begins a second stage of proliferation at DN3b with transitioning to DN4, immature single-positive thymocytes, and early CD4+CD8+ double-positive (DP) thymocyte blasts. This second stage, referred to as β-selection, is required for αβ T-lineage commitment, allelic exclusion to restrict β-chain clonotypes to one per cell, and the development of thymocytes expressing αβTCRs (4, 5).
PreTCRs each comprise a unique somatically rearranged TCRβ gene product disulfide-linked to an invariant transmembrane glycoprotein, pTα, which is thymocyte-specific. pTα lacks a ligand-binding variable domain, but has one membrane-proximal constant domain, which pairs with the β-chain constant domain (6). Although early studies suggested that preTCRs do not require ligands (7–10), instead signaling autonomously through site-specific self-oligomerization (11, 12), sequence analysis across mammalian species has refuted this model (13, 14). Notch signaling, in part, mimics preTCR signaling to explain this paradox (15). More recently, it has been shown that peptides bound to major histocompatibility complex molecules (pMHCs) are preTCR ligands, promoting thymocyte development through interactions with Vβ (16–20). After preTCR triggering, pTα transcription is shut off, Notch signaling is blunted, and TCRα transcription is initiated such that each pTαβ heterodimer can be replaced by a TCRαβ heterodimer (21). Consequently, the same β-chain is paired with an α-chain at the major DP thymocyte stage. Each TCRαβ clonotype creates a cognate pMHC ligand specificity with its VαVβ module. Desirable TCRs foster thymocyte survival, whereas autoreactive TCRs induce thymocyte apoptosis consequent to self-pMHC interaction (22).
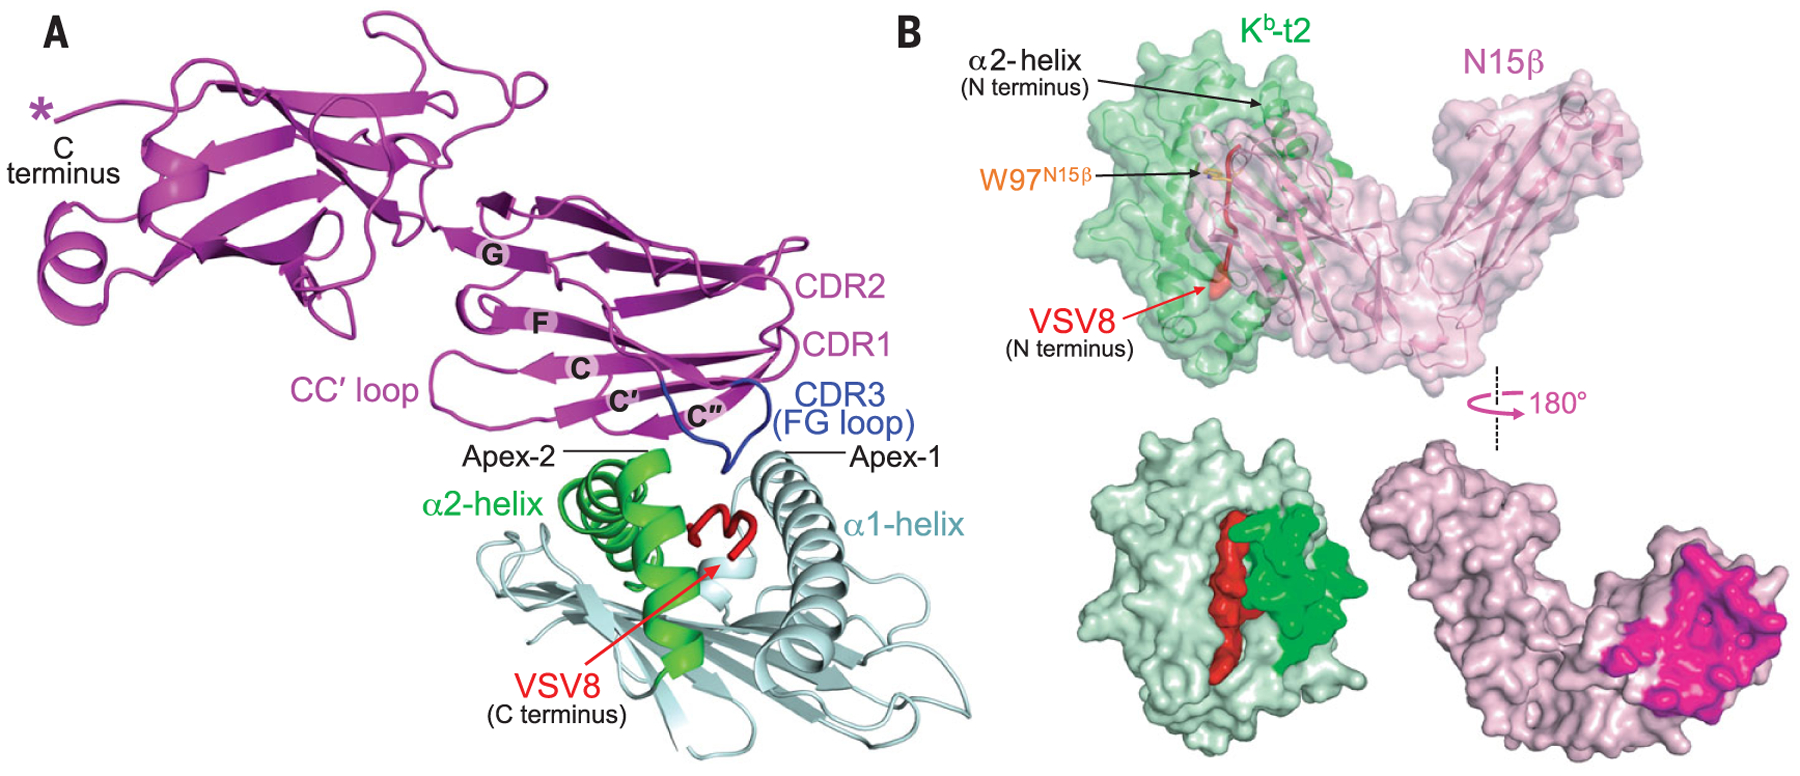
Both the recognition logic for the obligate preTCR to αβTCR transition and the impact of the preTCR–self-pMHC interaction on T-lineage repertoire formation have been elusive. In this report, we present crystal structures of a preTCRβ chain, the sole ligand-binding subunit of the preTCR, in complex with pMHC ligands, and accompanying functional data. The β chain used was N15β and its ligand vesicular stomatitis virus octapeptide (VSV8) or variant bound to a truncated version of a class I MHC (MHC-I) Kb molecule (called Kb-t2) comprising the peptide-binding α1α2 domains. To facilitate N15β-pMHC cocrystallization, we covalently linked N15β with Kb-t2 (figs. S1 and S2). The representative structure of N15β–VSV8–Kb-t2 revealed the topological fitting by which the concave C″C′CFG β-sheet face of the Ig-like N15Vβ domain grabs the apex of the convex α2 helical region of Kb-t2 (Fig. 1A). Closed- and open-book surface views (Fig. 1B) as well as detailed sample-related analyses (figs. S2 to S5 and tables S1 to S3) further delineated this fitting.
Fig. 1. The structure of N15β–VSV8–Kb-t2.

(A) Ribbon drawing of one representative structure of N15β–VSV8–Kb-t2. The twisted concave C″C′CFG β sheet of the N15β V-domain topologically fits the protruding α2-helix of Kb-t2, with the N15β CDR3 loop reaching the C-terminal VSV8 segment. Note that CDR1 and CDR2 point away from pMHC. (B) Surface representation of the “closed-book” view (top panel) and “open-book” view (bottom panel) of N15β–VSV8–Kb-t2.
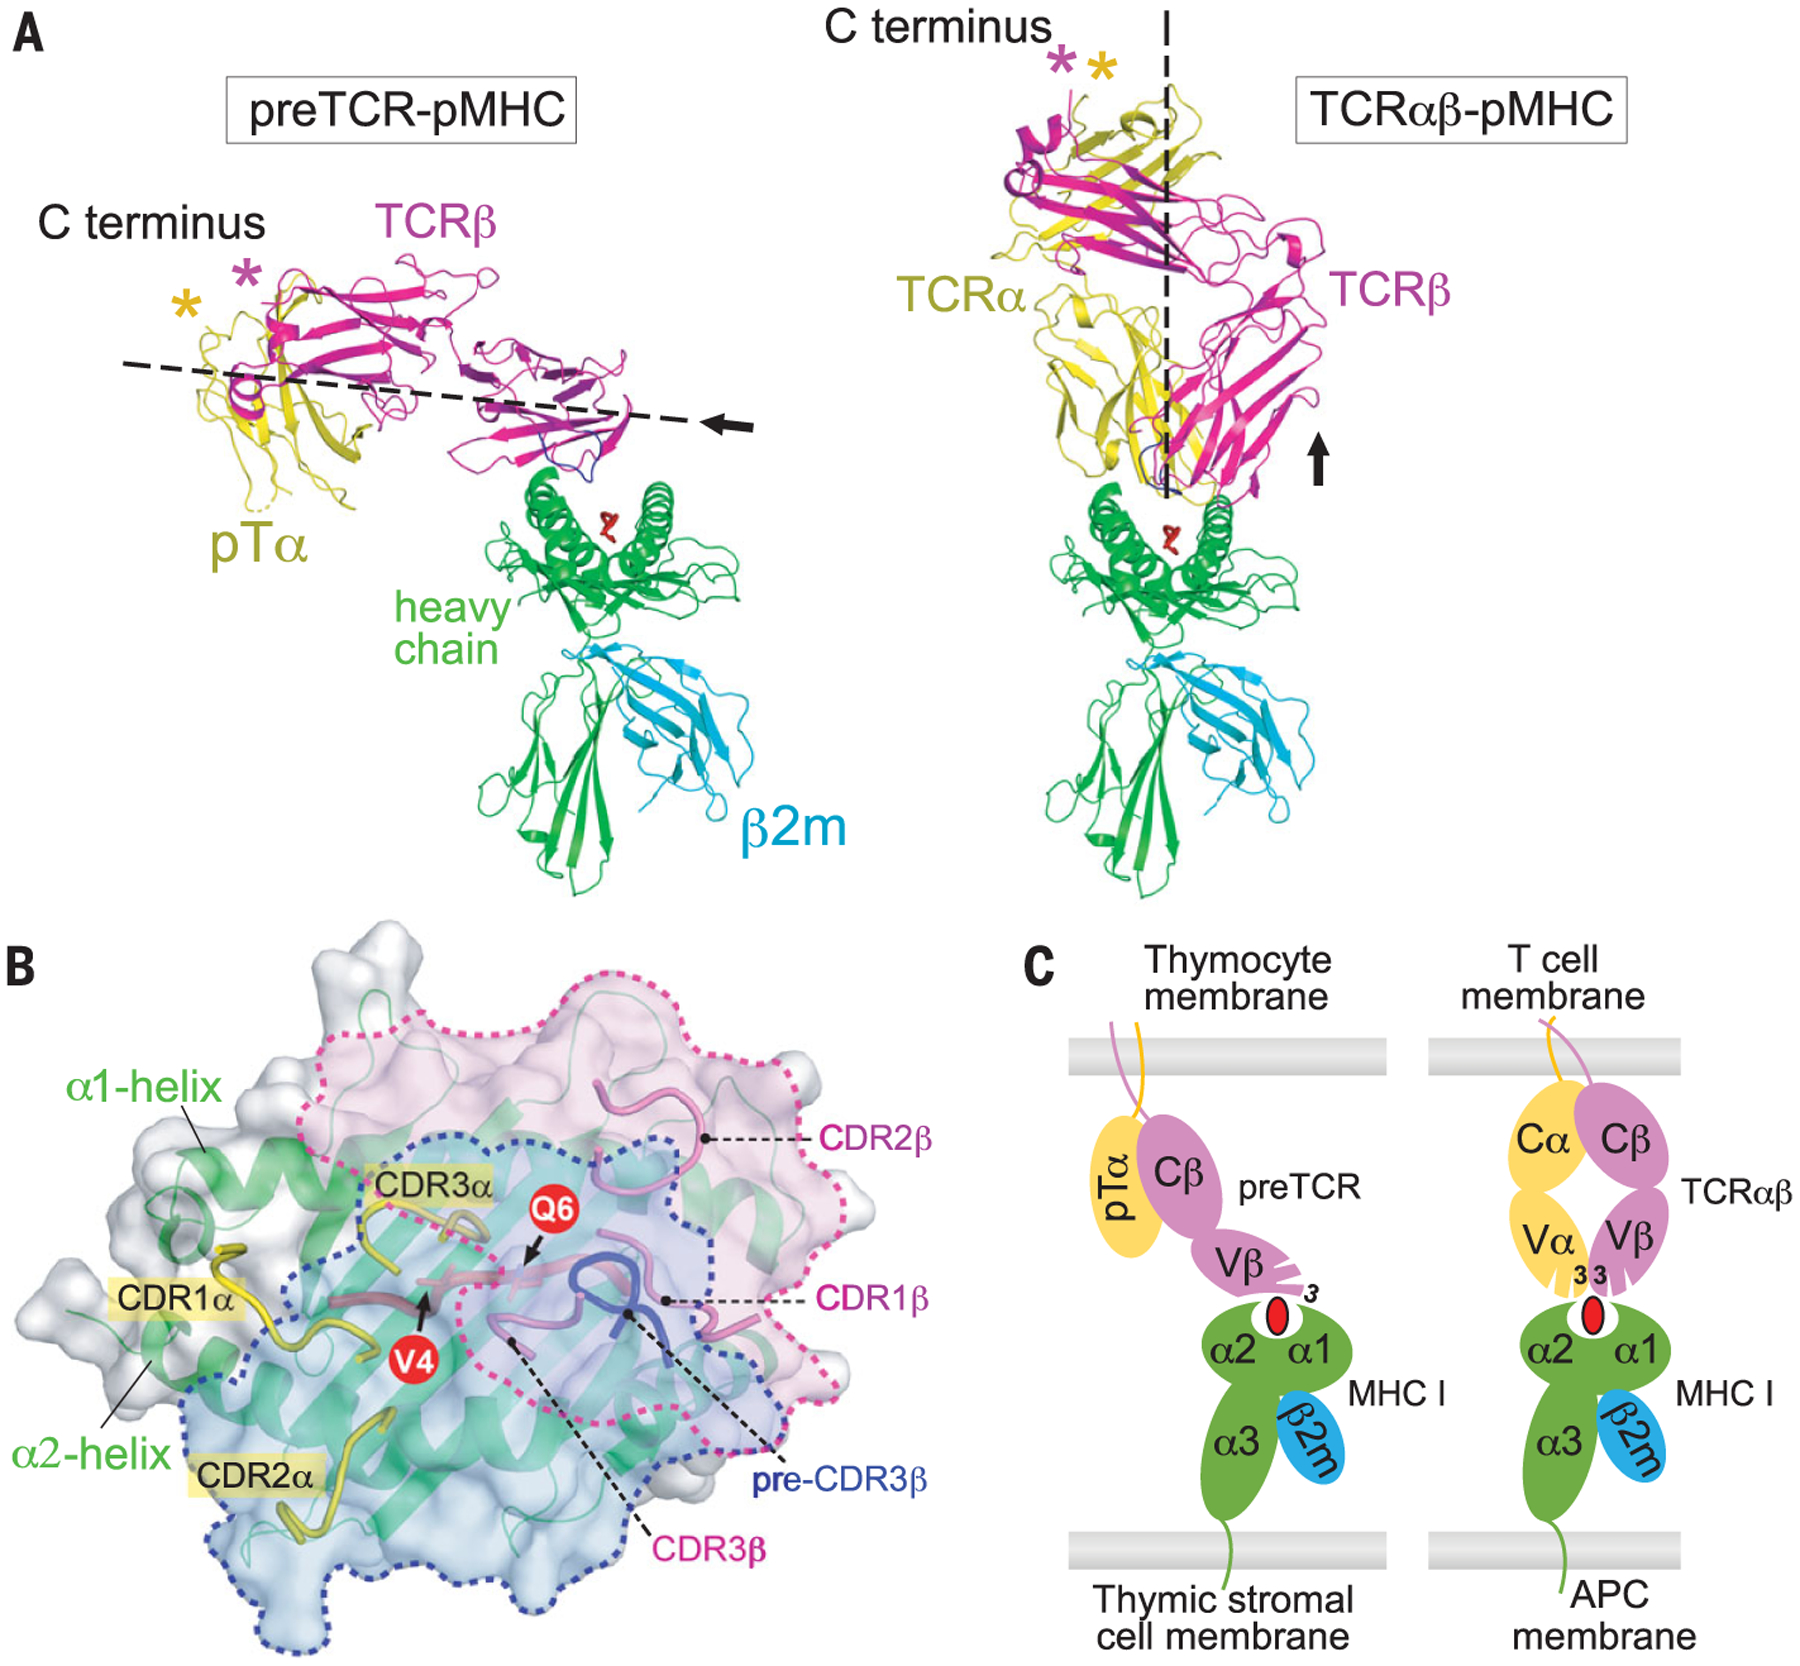
TCRαβ heterodimers “vertically” bind a pMHC molecule in a canonical mode, with Vα and Vβ domains contacting N- and C-terminal segments of a peptide, respectively (23, 24). By contrast, in the structure of the N15β–VSV8–Kb-t2 complex, N15β bound to pMHC in a “horizontal” docking mode (Fig. 2A) with the CDR3β loop contacting the C terminus of the peptide. In the vertical N15αβ–VSV8–Kb binding, all six complementarity-determining region (CDR) loops from both α and β subunits made contact in a head-on fashion (Fig. 2A). The TCRαβ-pMHC interface is generally flat with an ~1240- to 2020-Å2 buried surface area (BSA) (23). Had a single TCRβ subunit assumed the same vertical binding to pMHC using its three CDR loops, the BSA would be only around 900–1000 Å2, considerably less than the average protein–protein interaction (PPI) value of 1600 ± 400 Å2 (25). Horizontal topological fitting offered a BSA of 1379 Å2 (table S4). A composite view of the distribution of CDR loops and footprints of a preTCRβ versus TCRαβ binding on the same Kb molecule was then generated (Fig. 2B). Despite different approaches to pMHC (Fig. 2C), both preTCR and TCRαβ were capable of associating with the same CD3 signaling subunits (fig. S6).
Fig. 2. Distinct pMHC-binding mode of preTCR versus TCRαβ.

(A) Side-by-side ribbon drawings of the “horizontal” N15preTCR–VSV8–Kb complex model (left) and “vertical” N15TCRαβ–VSV8–Kb complex structure (right) (31). The former was constructed by overlaying structures of human preTCR (PDB: 3OF6) and mouse VSV8-Kb (PDB: 1KPU) onto the current structure of N15β–VSV8–Kb-t2. (B) Composite view of the footprints of a TCRαβ (PDB: 2CKB) and the preTCR on the same Kb (gray surface and green ribbon). The β-chain footprints of TCRαβ and preTCR are delineated by magenta and blue dashed lines, respectively. All CDR loops are displayed. The VSV8 is in red ribbon representation with its exposed residues V4 and Q6 shown. (C) Simplified illustration of pMHC binding of preTCR versus TCRαβ.
An atomistic model comparison is provided in fig. S6. Only CDR3 is labeled. APC, antigen-presenting cell.
The inherent left-handed twist of the β-sheet platform of an MHC-I molecule caused the α1 and α2 helices on top of the sheet to form a convex point on the peptide-binding groove, most prominently for the α2-helix (Fig. 1A) (24). The twisted C″C′CFG β sheet of the N15β V-domain contoured as a concavity (Fig. 1A). Convex/concave topological fitting should be a feature of all preTCRs binding to pMHC. The binding-geometry positions CDR3β to contact the pMHC while orienting CDR1β and CDR2β loops away from the interface (Figs. 1A, 2C, and 3A and table S5). Only after TCRβ pairs with TCRα at the DP thymocyte stage does the resultant TCRαβ heterodimer mediate potential CDR1 and CDR2 interactions with pMHC. The topological fitting skews N15β binding toward the peptide C-terminal segment in the MHC groove (Fig. 3B), suggesting that TCRαβ canonical docking polarity onto pMHC (23, 24) is preset at the β-selection stage.
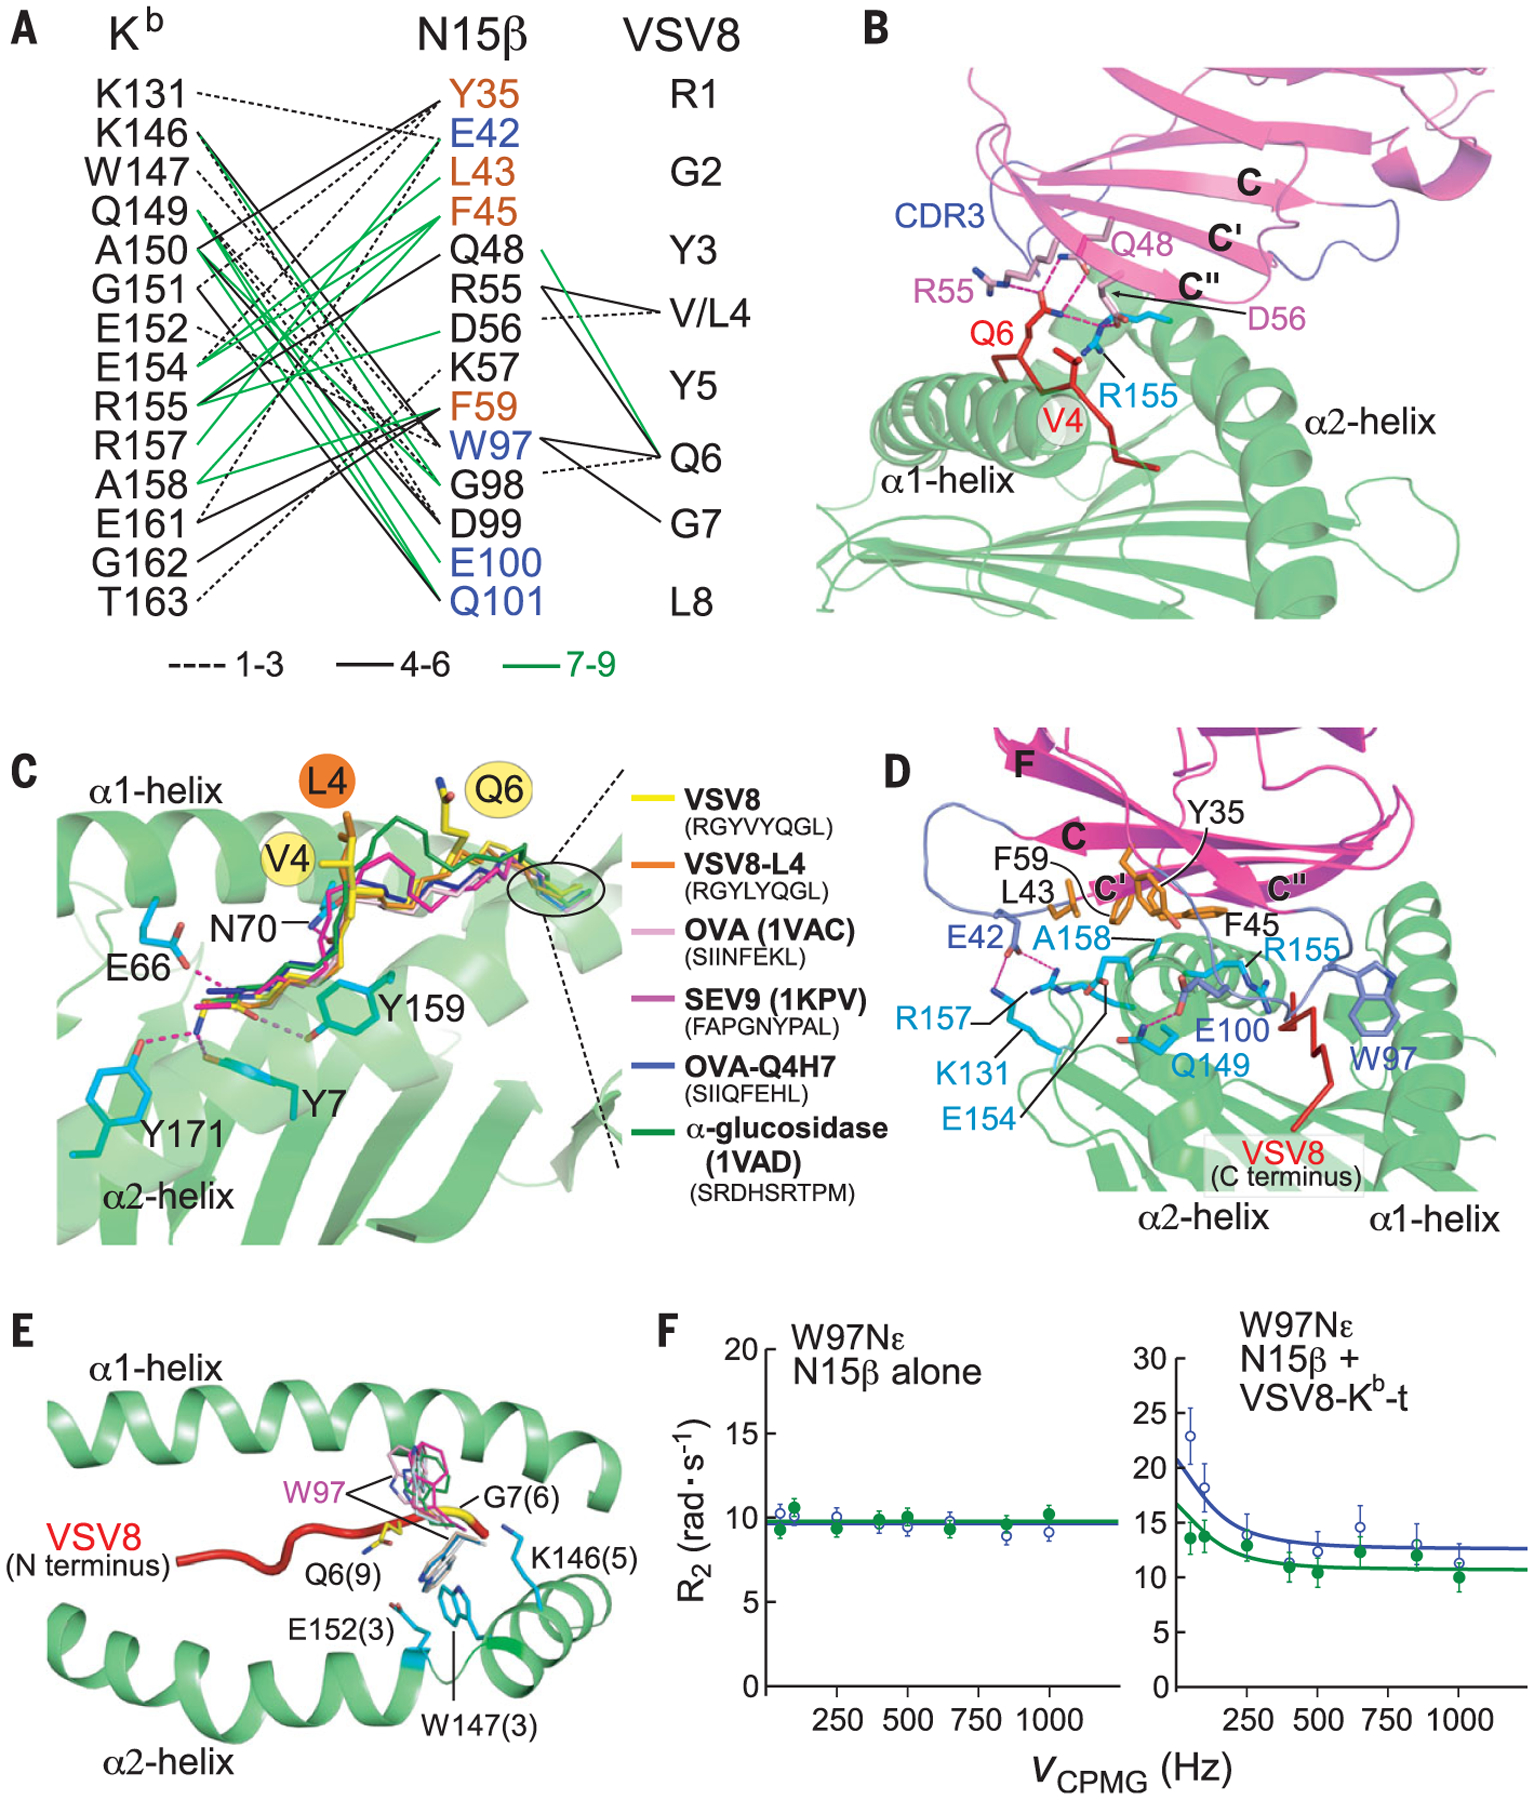
Fig. 3. The interactions of N15β with VSV8-Kb-t2.

(A) Interaction network of N15β with Kb-t2 and VSV8 (4-Å cutoff). Black dashed lines, black solid lines, and green lines denote those interactions observed in 1 to 3, 4 to 6, or 7 to 9 complexes in three crystals, respectively. N15β residues in orange and blue are located in two distinct Kb-t2–contacting regions, respectively [see (D)]. (B) N15β binding to the VSV8 peptide. Only the C-terminal part of VSV8, particularly V4 and Q6, are involved in the N15β contact. Dashed lines represent hydrogen bonds. (C) Two Kb-binding octapeptides (OVA and OVA variant Q4H7) and nonapeptides (SEV9 and α-glucosidase) are superimposed on VSV8–Kb-t2. The backbone of N-terminal p1-p3 peptide residues is held in the binding-groove by hydrogen bonds to conserved MHC residues, whereas their protruding C-terminal residues diverge in backbone conformation. (D) Two distinct VSV8–Kb-t2–binding areas on N15β are the “palm” in orange and the “thumb and fingers” in blue. Their interacting residues on Kb-t2 are colored in cyan. (E) Conformational variability of W97 on the N15β CDR3β loop. Numbers in parentheses represent the frequency of each contact among the nine complexes. Note that the W97 side chain can position on either side of the VSV8 peptide. (F) 15N relaxation dispersion profiles of W97 showing changes consistent with chemical exchange on ligand binding with addition of VSV8–Kb-t. Blue circles and green points represent measured transverse relaxation (R2) at 700 and 600 MHz, respectively, at a given Carr-Purcell-Meiboom-Gill pulse frequency (VCPMG).
The C-terminal half of the bound peptide is the most structurally featured segment of pMHC-I ligands, as exemplified by overlaying four Kb bound peptides on the VSV8–Kb-t2 structure (Fig. 3C). When loaded in an MHC-I molecule, a peptide’s two termini are fixed in the groove by mainchain hydrogen bonds to conserved MHC residues (26). Beginning at the p4 residue, the peptides bulge out and diverge in backbone conformations (Fig. 3C). Topological fit enabled preTCRs to recognize this featured C-terminal backbone display, complementing the limited number of exposed peptide side chains to shape the αβTCR repertoire as described below. A featured peptide conformation applied to MHC-II (fig. S7 and table S6) suggested analogous preTCR recognition. By contrast, certain nonclassical MHCs lack a regular peptide-binding groove (fig. S7).
The N15β–VSV8–Kb-t2 interface had two distinct areas (Fig. 3, A and D): (i) a large hydrophobic patch on the N15β C″C′C-face like the “palm” of a hand to contact the Kb-t2 α2-helix and (ii) N15β CC′ and FG (CDR3β) loops like the “thumb” and “fingers,” respectively. The thumb residue E42 on the N15β CC′ loop formed a specific electrostatic interaction with Kb-t2 residues R157 and K131 as a binding register. Finger residues W97, E100, and Q101 on the CDR3β loop made extensive interactions with Kb-t2 at the α2 apex to facilitate CDR3β loop sampling of the VSV8 C-terminal segment. These two contact areas are likely a general feature for the preTCR-pMHC interaction.
The N15β–VSV8–Kb-t2 interaction was somewhat degenerate (Fig. 3A and tables S3 and S5). Hydrophobic interactions in the palm area were promiscuous. Although N15β–VSV8–Kb-t2 potentially had seven maximal interfacial hydrogen bonds, only a few were conserved (Fig. 3A). On average, there should be 9 ± 5 hydrogen bonds in a PPI to afford sufficient specificity (25), whereas the number in N15β–VSV8–Kb-t2 is rather low, implying plasticity in the fit. W97 on the CDR3β loop tip had its large side chain distributing on either side of VSV8 (Fig. 3E and fig. S5), indicative of conformational variability. Transience may enable the CDR3β loop to sample myriad self-peptides. To investigate sampling directly, the N15β subunit was examined alone or with VSV8-Kb-t in solution by NMR relaxation dispersion (Rex). The N15β W97 side-chain atom (W97Nε) showed a Rex effect only upon addition of VSV8–Kb-t (Fig. 3F and fig. S8), indicative of dynamic changes in the microsecond to millisecond time scale and consistent with ligand-dependent chemical exchange.
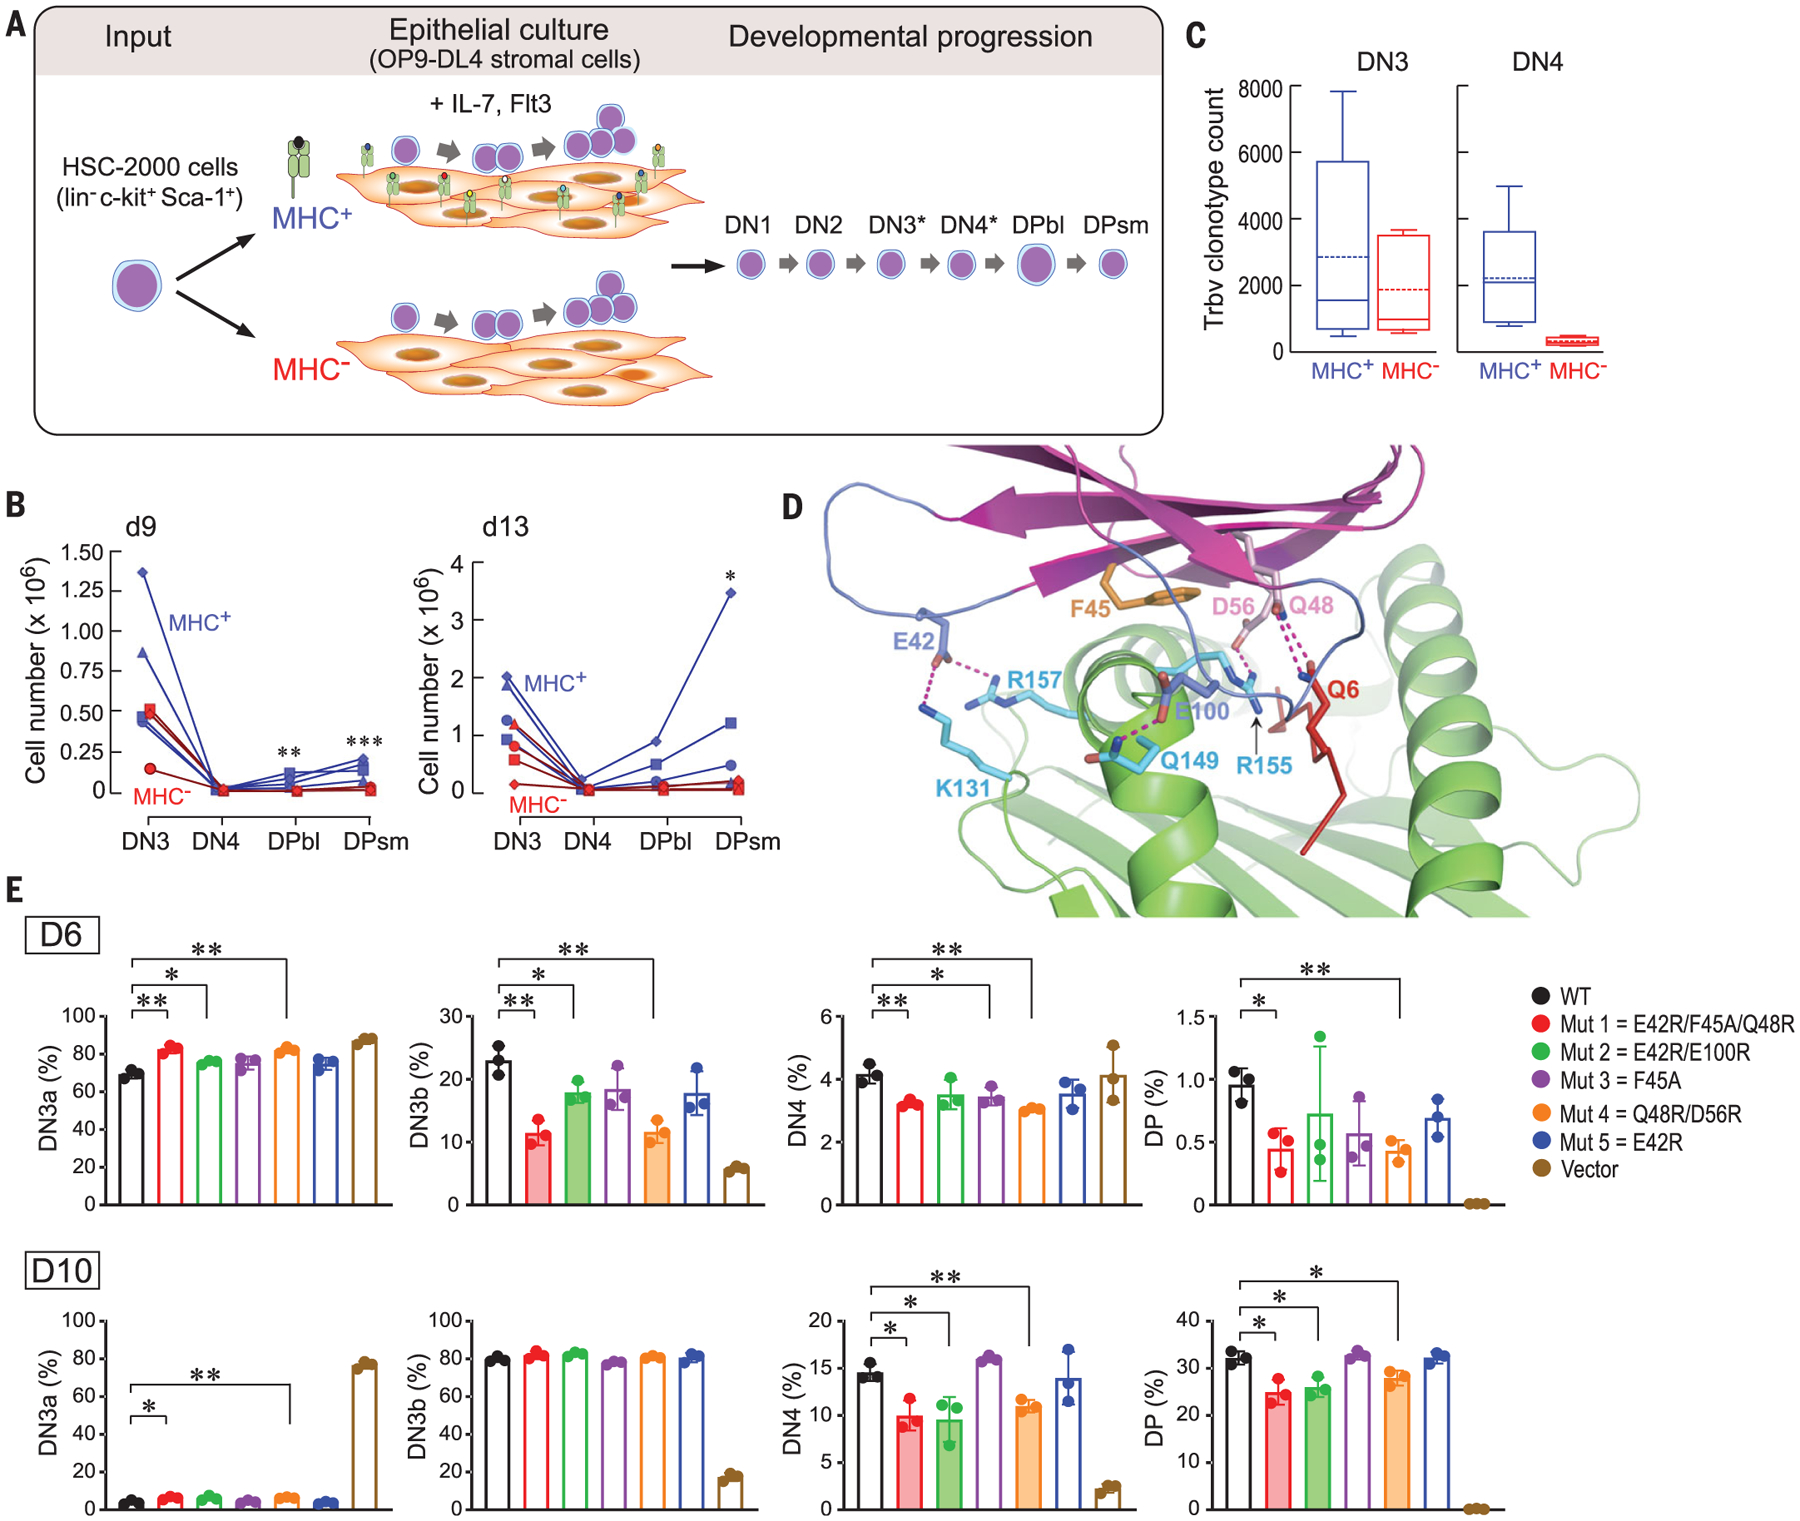
To examine the functional consequences of the observed preTCR interaction with pMHC, we seeded wild-type hematopoietic stem cells onto stroma expressing or lacking surface MHC (16) and followed thymocyte development (Fig. 4A). At DN3, both preTCR-independent (Notch-related) and preTCR-dependent cellular expansion occurs, whereas at DN4, signaling is dominated by the preTCR (27). Proliferation at the DN3 stage was observed at d9 independently of MHC expression, whereas progression to the DPsm stage only occurred robustly on the MHC+ stroma (Fig. 4B and fig. S9). By d13, progression to the DPsm stage was maintained on the MHC+ but strongly diminished on MHC− stroma. DN4 cell numbers were low across all experiments because of their short-lived but essential transitional nature (28).
Fig. 4. Impact of preTCR-pMHC interactions on β-chain repertoire expansion.

(A) Schematic for thymocyte development. B6 hematopoietic stem cells (HSCs) (light blue and magenta) were cultured on OP9-DL4 cells (light brown) expressing or lacking MHC. For simplicity, the numerically minor immature single-positive thymocytes before DP blast (DPbl) are omitted, with subpopulations expressing preTCRs starting at DN3 and persisting through DN4 denoted by asterisks. (B) Thymocyte cell number per stage [DN3 to DPsmall (DPsm)] at d9 and d13 after HSC seeding (2000 cells) on MHC+ or MHC− OP9-DL4 stromal cells. Each symbol represents an independent experiment (n = 4). *P < 0.05; **P < 0.02; ***P < 0.01, two-tailed Student’s t test. (C) PreTCR β-chain unique clonotype representation in 104 DN3 and DN4 cells after 9 days of growth on MHC+ or MHC− stromal cells. For each condition, the box bounds the 25th and 75th percentile with the internal 50th percentile (solid line) and mean (dotted line). Whiskers with bars define upper and lower values for each condition (n = 5). For DN4, P < 0.05 for the comparison of MHC+ and MHC− conditions. (D) Key interface contacts in the N15β–VSV8–Kb-t2 structure used for mutagenesis studies in (E). (E) Top row highlights the DN3a-DN3b transition and the bottom row shows later DN4 and DP changes (n = 3). *P < 0.05; **P < 0.01, two-tailed Student’s t test. DN3a, DN3b, and DN4 percentages were derived by gating on the CD4−CD8−CD44− population (fig. S12). Shading indicates interface mutants that significantly inhibited thymocyte developmental progression.
Because the preTCR is expressed on a substantial fraction of DN3 and DN4 thymocytes, we investigated whether the presence or absence of pMHC recognition by the preTCR affected functional preTCRβ clonotype representation (Fig. 4C). The DN3 subset expansion was essentially independent of pMHC presence on stroma with similar clonotype representations. By contrast, at the DN4 stage, when cells also expressed functional β chains without TCRα chains, β-chain clonotype diversity was 10-fold higher in the presence of MHC (Fig. 4C). Clonotype expansion on the MHC+ stroma was caused by the inclusion of many distinct single-copy β chains absent from the MHC−stromal cultures (table S7). DN3 and DN4 thymocyte β chains harvested from both types of stroma showed comparable CDR3 length and hydrophobicity (fig. S10).
Finally, we studied stromal cells selectively expressing VSV8-Kb (16) and stem cells from B6 Rag2−/− mice (lacking endogenous TCR α and β chains) as retroviral transduction recipients. Either wild-type N15β (wtN15β) or one of five N15β chains mutated at interface residues in the N15β–VSV8–Kb-t2 structure (Fig. 4D) were transduced, purified by fluorescence-activated cell sorting, and cultured (figs. S11 to S13). All mutant constructs expressed surface preTCRs at levels comparable to wild-type (fig. S14). On day 6, capturing the DN3a to DN3b transition, or day 10, highlighting DN4 and DP development, mutants 1, 2, and 4 significantly blocked developmental progression (Fig. 4E and fig. S15), confirming the crystallographically defined interaction site.
Like the αβTCR, the preTCR is a mechanosensor in which bioforces load and enhance receptor–ligand bond lifetimes through the β subunit (16, 29). Linked preTCR structural transitions exhibit greater reversibility compared with those of TCRαβ, reflecting unpaired Vβ domain compliance. Facile preTCR signaling (30) fosters β-chain repertoire formation, and T-lineage repertoire logic is programmed through alterations in pMHC-binding receptor structures. PreTCRs exploit a topological fit that only permits CDR3β to interact with pMHC, supporting self-pMHC reactivity and reduced ligand specificity to favor β-clonotype inclusiveness. Subsequently, beginning in DP thymocytes, when TCRα replaces pTα, the same C″C′ CFG β-sheet face of the Vβ domain combines with that of the Vα domain to form the Vα-Vβ module in the αβTCR, which prevents horizontal pMHC binding. Instead, a vertical geometry is mandated to foster greater specificity among pMHC interface interactions, testing all six CDRs through positive and negative selection. Laxity of pMHC binding permitted at the β-selection stage is eliminated, thereby augmenting self-versus-nonself discrimination. Successful passage through this gauntlet allows a diverse set of matured T-lineage cells to move into the periphery to discern and confront in their vertical αβTCR mode abnormal cells altered by pathogens or cancerous transformations.
Supplementary Material
ACKNOWLEDGMENTS
We thank E. Dodson for helpful discussions on crystallography.
Funding: This work was supported by NIH grants PO1AI143565, AI136960, AI136301, GM047467, AI0037581, and EB002026; a Rosztoczy Foundation Scholarship; NIH grant 5T32HL066987; and a Claudia Adams Barr award. The use of SBC 19-ID at Argonne National Laboratory was supported by DOE contract no. DE-AC02-06CH11357.
Footnotes
Competing interests: G.W. is a cofounder and has equity in the following companies: Enanta Pharmaceuticals, PIC therapeutics, Cellmig Biolabs, Skinap Therapeutics, Virtual Discovery, and Olaris Therapeutics. None of these companies is related to the topic of this manuscript. The remaining authors declare no competing interests.
Data and materials availability: All structural data have been deposited in the Protein Data Bank (https://www.rcsb.org) with PDB codes: 6WL2, 6WL3, 6WL4, 7JI2. All other data associated with this study are in the main text or supplementary materials.
SUPPLEMENTARY MATERIALS
science.sciencemag.org/content/371/6525/181/suppl/DC1
Materials and Methods
Figs. S1 to S16
Tables S1 to S8
References (32–52)
MDAR Reproducibility Checklist
REFERENCES AND NOTES
- 1.Shortman K, Egerton M, Spangrude GJ, Scollay R, Semin. Immunol 2, 3–12 (1990). [PubMed] [Google Scholar]
- 2.Koch U et al. , J. Exp. Med 205, 2515–2523 (2008). [DOI] [PMC free article] [PubMed] [Google Scholar]
- 3.Rodewald HR, Ogawa M, Haller C, Waskow C, DiSanto JP, Immunity 6, 265–272 (1997). [DOI] [PubMed] [Google Scholar]
- 4.Kreslavsky T et al. , Immunity 37, 840–853 (2012). [DOI] [PMC free article] [PubMed] [Google Scholar]
- 5.von Boehmer H, Cancer Immunol. Res 2, 592–597 (2014). [DOI] [PubMed] [Google Scholar]
- 6.Saint-Ruf C et al. , Science 266, 1208–1212 (1994).7973703 [Google Scholar]
- 7.Koller BH, Marrack P, Kappler JW, Smithies O, Science 248, 1227–1230 (1990). [DOI] [PubMed] [Google Scholar]
- 8.Grusby MJ et al. , Proc. Natl. Acad. Sci. U.S.A 90, 3913–3917 (1993). [DOI] [PMC free article] [PubMed] [Google Scholar]
- 9.Fehling HJ, Krotkova A, Saint-Ruf C, von Boehmer H, Nature 375, 795–798 (1995). [DOI] [PubMed] [Google Scholar]
- 10.Irving BA, Alt FW, Killeen N, Science 280, 905–908 (1998). [DOI] [PubMed] [Google Scholar]
- 11.Pang SS et al. , Nature 467, 844–848 (2010). [DOI] [PubMed] [Google Scholar]
- 12.Yamasaki S et al. , Nat. Immunol 7, 67–75 (2006). [DOI] [PubMed] [Google Scholar]
- 13.Smelty P et al. , Proc. Natl. Acad. Sci. U.S.A 107, 19991–19996 (2010). [DOI] [PMC free article] [PubMed] [Google Scholar]
- 14.Zhou B et al. , Front. Immunol 2, 5 (2011). [DOI] [PMC free article] [PubMed] [Google Scholar]
- 15.Michie AM et al. , Int. Immunol 19, 1421–1430 (2007). [DOI] [PubMed] [Google Scholar]
- 16.Das DK et al. , J. Biol. Chem 291, 25292–25305 (2016). [DOI] [PMC free article] [PubMed] [Google Scholar]
- 17.Mallis RJ, Arthanari H, Lang MJ, Reinherz EL, Wagner G, J. Biol. Chem 293, 754–766 (2018). [DOI] [PMC free article] [PubMed] [Google Scholar]
- 18.Mallis RJ et al. , Proc. Natl. Acad. Sci. U.S.A 112, 8373–8378 (2015). [DOI] [PMC free article] [PubMed] [Google Scholar]
- 19.Mallis RJ et al. , J. Biomol. NMR 73, 319–332 (2019). [DOI] [PMC free article] [PubMed] [Google Scholar]
- 20.Yang X, Mariuzza RA, Proc. Natl. Acad. Sci. U.S.A 112, 8166–8167 (2015). [DOI] [PMC free article] [PubMed] [Google Scholar]
- 21.López-Rodríguez C, Aramburu J, Berga-Bolaños R, Cell. Mol. Life Sci 72, 2305–2321 (2015). [DOI] [PMC free article] [PubMed] [Google Scholar]
- 22.Klein L, Kyewski B, Allen PM, Hogquist KA, Nat. Rev. Immunol 14, 377–391 (2014). [DOI] [PMC free article] [PubMed] [Google Scholar]
- 23.Rudolph MG, Stanfield RL, Wilson IA, Annu. Rev. Immunol 24, 419–466 (2006). [DOI] [PubMed] [Google Scholar]
- 24.Wang JH, Reinherz EL, Immunol. Rev 250, 102–119 (2012). [DOI] [PMC free article] [PubMed] [Google Scholar]
- 25.Lo Conte L, Chothia C, Janin J, J. Mol. Biol 285, 2177–2198 (1999). [DOI] [PubMed] [Google Scholar]
- 26.Zhang C, Anderson A, DeLisi C, J. Mol. Biol 281, 929–947 (1998). [DOI] [PubMed] [Google Scholar]
- 27.Hosokawa H, Rothenberg EV, Cold Spring Harb. Perspect. Biol 10, a028621 (2018). [DOI] [PMC free article] [PubMed] [Google Scholar]
- 28.Vasseur F, Le Campion A, Pénit C, Eur. J. Immunol 31, 3038–3047 (2001). [DOI] [PubMed] [Google Scholar]
- 29.Das DK et al. , Proc. Natl. Acad. Sci. U.S.A 112, 1517–1522 (2015). [DOI] [PMC free article] [PubMed] [Google Scholar]
- 30.Feng Y, Reinherz EL, Lang MJ, Trends Immunol. 39, 596–609 (2018). [DOI] [PMC free article] [PubMed] [Google Scholar]
- 31.Teng MK et al. , Curr. Biol 8, 409–414 (1998). [DOI] [PubMed] [Google Scholar]
Associated Data
This section collects any data citations, data availability statements, or supplementary materials included in this article.


