Abstract
The expression of inhibitory immune checkpoint molecules such as PD-L1 is frequently observed in human cancers and can lead to the suppression of T cell-mediated immune responses. Here, we apply ECCITE-seq, a technology which combines pooled CRISPR screens with single-cell mRNA and surface protein measurements, to explore the molecular networks that regulate PD-L1 expression. We also develop a computational framework, mixscape, that substantially improves the signal-to-noise ratio in single-cell perturbation screens by identifying and removing confounding sources of variation. Applying these tools, we identify and validate regulators of PD-L1, and leverage our multi-modal data to identify both transcriptional and post-transcriptional modes of regulation. Specifically, we discover that the kelch-like protein KEAP1 and the transcriptional activator NRF2, mediate levels of PD-L1 upregulation after IFNγ stimulation. Our results identify a novel mechanism for the regulation of immune checkpoints and present a powerful analytical framework for the analysis of multi-modal single-cell perturbation screens.
INTRODUCTION
Immune checkpoint molecules regulate the critical balance between activation and inhibition during immune responses. Under normal physiological conditions, inhibitory immune checkpoint molecules are essential to maintain self-tolerance and prevent autoimmunity [1,2], but their expression is often mis-regulated in human cancers in order to escape immune surveillance [3,4]. For example, the inhibitory immune checkpoint CD274 (also known as PD-L1), which interacts with the PD-1 receptor on T cells to inhibit T-cell activation [5], is overexpressed in many cancers and is a prognostic factor for patient survival and response to immunotherapy [6]. There is therefore substantial interest not only in identifying therapeutic avenues to block these interactions, but also in understanding the molecular networks utilized by cancer cells to up-regulate molecules like PD-L1.
Previous efforts have established an initial set of molecular regulators that influence both mRNA and surface protein levels for PD-L1. Numerous studies have observed that exposure to interferon gamma (IFNγ) rapidly induces PD-L1 expression both in cancer cell lines and in the tumor microenvironment [7–10]. Core components of the IFNγ response therefore represent upstream regulators of PD-L1 expression, including the transcription factor IRF1 [11], the JAK-STAT signal transduction pathway, and the IFNγ receptors themselves. Additional modulators of IFNγ signaling [12], PD-L1 promoter chromatin state [13], or response to UV-mediated stress [14] have also been identified. In addition, there has been particular recent interest in the characterization of putative post-transcriptional regulators of PD-L1 stability and degradation. For example, the Cullin 3-SPOP E3-ligase complex can directly ubiquitinate PD-L1 in a cell-cycle dependent manner, leading to its degradation [15]. In addition, a genome-wide CRISPR screen identified two previously uncharacterized regulators, CMTM6 and CMTM4, which stabilize PD-L1 surface expression by preventing lysosome-mediated degradation [16,17]. In each of these cases, perturbation of PD-L1 regulators was shown to modulate the activity of anti-tumor T cells, highlighting the therapeutic interest in understanding the regulation of immune checkpoint molecules.
We recently introduced expanded CRISPR-compatible CITE-seq (ECCITE-seq), which simultaneously measures transcriptomes, surface protein levels, and perturbations at single-cell resolution [18]. ECCITE-seq builds upon the experimental design of pooled CRISPR screens, where multiple perturbations are multiplexed together in a single experiment, but offers distinct advantages. First, the single-cell sequencing readout (i.e. Perturb-seq, CROP-seq, CRISP-seq) [19–21], enables the measurement of detailed molecular phenotypes, instead of one phenotype (expression of a single protein or cell viability). Second, by simultaneously coupling measurements of mRNA, surface protein, and direct detection of guide RNAs (gRNAs) within the same cell [22], ECCITE-seq allows for multimodal characterization of each perturbation. We therefore reasoned that ECCITE-seq would enable us to simultaneously test and identify new regulators of immune checkpoint molecules, and in particular, to distinguish between transcriptional and post-transcriptional modes. Moreover, the rich and high-dimensional readouts readily facilitate network and pathway-based analyses, which could go beyond the identification of individual genes and yield insights into their regulatory mechanism.
Here, we apply ECCITE-seq to simultaneously perturb and characterize putative regulators of PD-L1 in response to IFNγ stimulation. When analyzing our single-cell data, we identified confounding sources of heterogeneity, including the presence of cells that received a targeting gRNA but exhibited no perturbation effects, introducing substantial noise into downstream analyses. We developed and validated computational methods to control for these factors, and substantially increased our statistical power to characterize multi-modal perturbations.
Leveraging these tools, we identify a set of genes whose perturbation affects PD-L1 transcript levels, surface protein levels, or both, and characterize the underlying molecular pathways utilized by each regulator. In particular, we find that the kelch-like protein KEAP1 and the transcriptional activator NFE2L2 (also known as NRF2), both of which are frequently mutated in human cancers [23], can modify PD-L1 levels. We link these findings to a novel regulatory mechanism for CUL3 and show that this protein acts as an indirect transcriptional activator of PD-L1 mRNA via stabilization of the NRF2 pathway. Taken together, our findings identify an important pathway for immune checkpoint regulation and present a powerful and broadly applicable analytical framework for analyzing ECCITE-seq data.
RESULTS
Human cancer cells routinely up-regulate immune checkpoint molecules, such as PD-L1, to escape immune surveillance. The blockade of these checkpoints can significantly enhance the efficacy of the anti-tumor immune response, particularly during immunotherapy [24]. We were therefore motivated to gain deeper understanding of the molecular pathways and regulators that affect inhibitory immune checkpoint expression, with a particular focus on PD-L1. Aiming to develop an experimental system to study multiple immune checkpoints simultaneously, we screened four cancer cell lines (THP-1, K562, KG-1 and U937, Supplementary Figures 1, 2) and tested their ability to up-regulate immune checkpoint molecules in response to cytokines by flow cytometry (Supplementary Note). We found that stimulating THP-1 cells with a combination of IFNγ, Decitabine (DAC), and transforming growth-factor beta 1 (TGFβ1) resulted in robust induction of three immune checkpoints: PD-L1, PD-L2, and CD86 (Supplementary Figure 1a). We also created a modified THP-1 cell line with inducible expression of Cas9 under doxycycline treatment, representing an in-vitro model system amenable to environmental and genomic perturbations (Supplementary Note).
In order to identify and characterize new regulators, we pursued a two-step experimental strategy (Figure 1a). First, we performed CITE-seq [22] on both unstimulated and stimulated THP-1 cells. CITE-seq enables the simultaneous measurement of cellular transcriptomes alongside surface protein levels of PD-L1, PD-L2, and CD86. We reasoned that these data would enable us to identify gene modules whose transcriptional levels mirrored the surface expression of each immune checkpoint. Within these modules, we could identify a ‘target set’ of putative regulators representing genes known to affect transcription, chromatin, signaling, or protein stability. In a second step, we performed multiplexed perturbation and functional characterization of our target set. To accomplish this, we applied our recently developed ECCITE-seq technology, which extends CRISPR-compatibility to the CITE-seq protocol and enables simultaneous gRNA capture. ECCITE-seq allowed us to multiplex >100 individual perturbations together, and to simultaneously test the effect of each in a single experiment. Moreover, the rich and multi-modal nature of these data allowed us to distinguish both transcriptional and post-transcriptional effects, and to explore mechanistic hypotheses for each gene.
Figure 1. CITE-seq and ECCITE-seq identify regulators of PD-L1 protein expression.
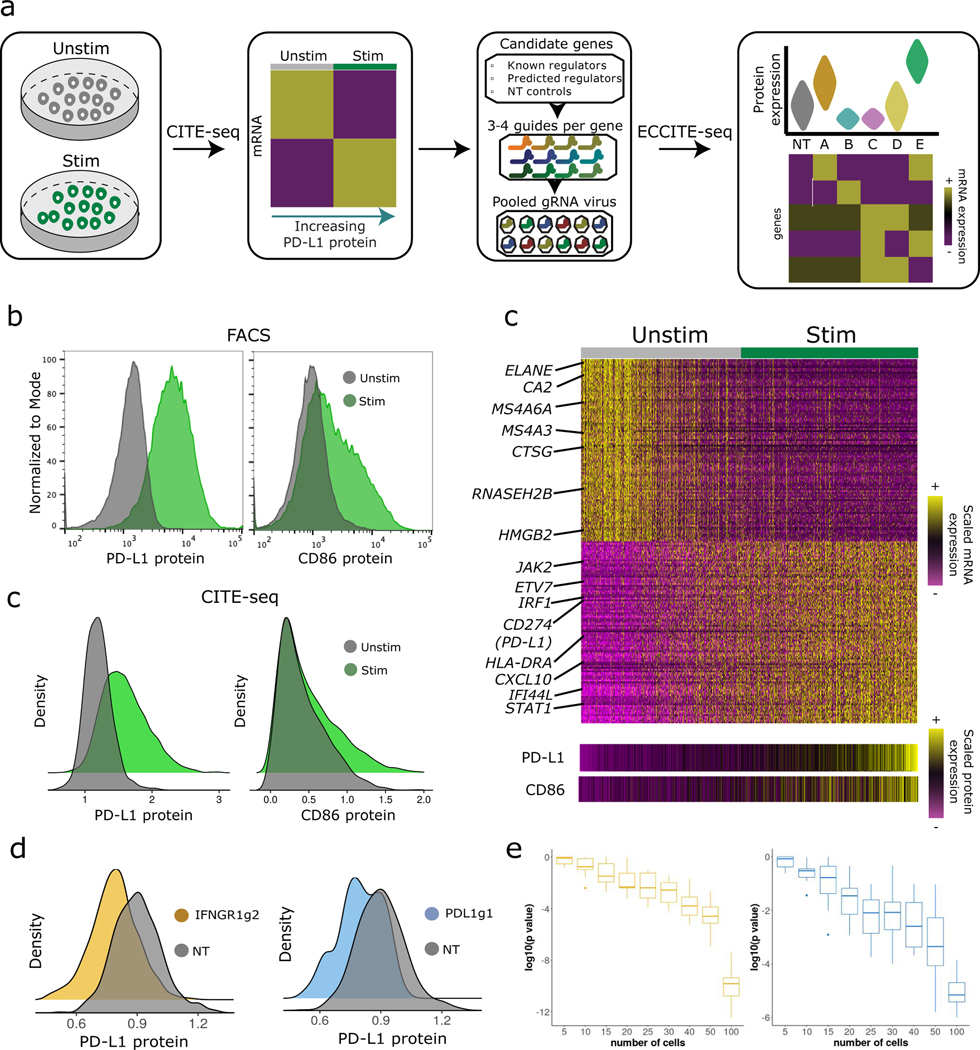
a) Experimental design schematic. NT, non-targeting. b) Expression of PD-L1 (left) and CD86 (right) protein in stimulated (green, n=20,000 cells) and control (grey, n=20,000 cells) THP-1 cells, as measured by flow cytometry and (c) CITE-seq. d) Single-cell heatmap showing the z-scored expression of 200 genes whose expression correlates with CD86 and PD-L1 protein expression (Supplementary Note). e) ECCITE-seq measurements of PD-L1 protein expression in cells that received gRNAs targeting PD-L1 and IFNGR1, and non-targeting controls. f) Power analysis to estimate the number of cells necessary to detect statistically significant shifts in protein expression across two different gRNAs (IFNGR1g2 and PDL1g1). A one-sided Wilcox Rank sum test was used. Each boxplot summarizes ten random sampling draws of the indicated number of cells and the log-transformed p-values generated through differential protein expression (DE) analysis using Wilcox Rank sum test. DE was performed using the same number of sampled IFNGR2g1, PDL1g1 and non-targeting control cells. Boxplots: middle line is the median, the lower and upper hinges correspond to the first and third quartiles, the upper whisker extends from the hinge to the largest value no further than 1.5 × IQR from the hinge (IQR = inter-quartile range) and the lower whisker extends from the hinge to the smallest value at most 1.5 × IQR of the hinge.
CITE-seq identifies putative immune checkpoint regulators
To identify putative immune checkpoint regulators, we performed CITE-seq experiments on both stimulated and unstimulated THP-1 cells (Supplementary Note). We recovered a total of 7,566 single-cell profiles, each representing coupled measurements of cellular transcriptomes and surface levels for three proteins: PD-L1, PD-L2 and CD86. For each surface protein, we compared the patterns of up-regulation upon stimulation observed by CITE-seq with those observed by flow cytometry, and found highly concordant results across technologies (Figure 1b, c; Supplementary Figure 1a, b). The multi-modal CITE-seq measurements allowed for the identification of genes whose expression is activated alongside immune checkpoint surface protein induction (Supplementary Note). Induced genes included well-characterized members of the IFNγ pathway (JAK2, STAT1, and IRF1), while down-regulated genes (ELANE, MS4A6A, CTSG) were consistent with the monocyte progenitor identity of resting THP-1 cells (Figure 1d).
Based on these results, we looked at the top 200 genes that correlated with PD-L1 expression and selected 26 genes based on their protein class identity for downstream characterization (Supplementary Table 1). Our panel included eight genes with well-characterized regulatory effects, and 18 genes representing transcription factors, chromatin regulators, signaling regulators, and modifiers of protein stability, that were mined from our CITE-seq data but where a clear link with PD-L1 regulation has not been firmly established. We designed a pooled single gRNA (sgRNA) library consisting of three to four gRNAs per gene along with ten non-targeting (NT) controls, representing a total library of 111 gRNAs.
ECCITE-seq validates putative immune checkpoint regulators
In order to functionally characterize our previously identified genes, we performed ECCITE-seq, a 5’ capture-based scRNA-seq method that is able to reverse transcribe gRNAs via the addition of a scaffold-specific primer, alongside cellular transcriptomes and Antibody-derived oligos (ADTs). To guide our experimental design, we first performed a pilot experiment using gRNAs targeting PD-L1 or IFNGR1 as well as NT controls. In both cases, we observed a substantial reduction in PD-L1 expression, and perturbation of IFNGR1 also ablated the IFNγ transcriptional response (Figure 1e). Clear effects were observed even after downsampling the dataset to 25 cells/gRNA (Figure 1f).
We next performed an ECCITE-seq experiment utilizing our full library of 111 guides. Our total dataset represents three independent transductions at low multiplicity of infection, aiming to maximize the proportion of cells infected with a single gRNA. After transduction, Cas9 expression was activated with doxycycline, and 90% of cells were stimulated to induce immune checkpoint expression (the remainder were profiled without stimulation as a negative control and were not included in downstream analyses, Supplementary Figure 3a). Cells were processed with the 10x Genomics Single Cell 5’ assay kit and sequenced on the Illumina NovaSeq platform (55,300 average mRNA reads/cell). Out of 30,328 cells, we found 22,606 cells where we could detect robust expression of at least one gRNA, including 22,573 where a cell could be specifically assigned to an individual perturbation (Supplementary Figures 3b–d).
Perturbation signature removes confounding variation
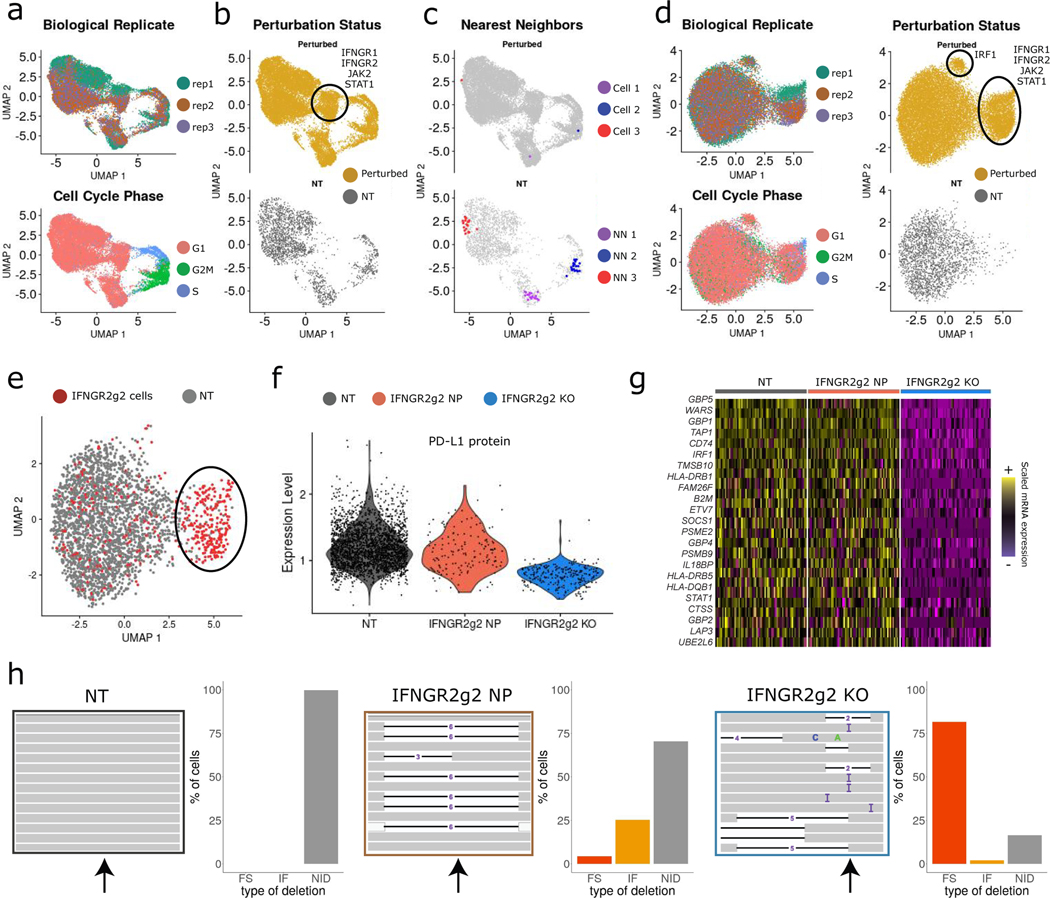
We next performed unsupervised dimensionality reduction (PCA) and visualization (UMAP) of the ECCITE-seq data based on cellular mRNA profiles (Figure 2a, b; Supplementary Note). While we had expected that cells would form groupings that were consistent with their underlying genetic perturbation, we initially observed that alternative sources of variation, including transduction replicate identity, cell-cycle stage, and the activation of cellular stress responses (Extended Data 1a, b), confounded our analysis. These sources of heterogeneity were also present in an independent analysis of control cells (those expressing NT gRNAs, Extended Data 1c), and we therefore designed a procedure to mitigate their effects.
Figure 2. Calculating perturbation signature removes confounding variation.
a) UMAP visualization of the ECCITE-seq dataset based on cellular transcriptomes. Cells are colored by transduction replicate and cell cycle state. b) Same as in (a). Cells are split and colored by perturbation status (NT; non-targeted). Circle denotes a perturbation-specific cluster. c) Same as in (b). Top: example of three distinct cells expressing an IRF1 gRNA (red, blue, purple). Bottom: their 20 nearest NT neighbors (NN). Grey dots: all other cells. d) UMAP visualization based on perturbation signatures. Ovals denote perturbation-specific clusters. e) UMAP visualization showing IFNGR2g2 and NT cells. Oval denotes a group of putative IFNGR2g2 KO cells that cluster separately, but a subset of targeted cells appears to be non-perturbed (NP). f) Violin plot showing PD-L1 protein expression in NT, NP, and KO cells. IFNGR2g2 KO cells exhibit low PD-L1 protein levels while IFNGR2g2 NP and NT cells express PD-L1 at identical levels. g) Single-cell mRNA heatmap showing the IFNγ pathway-related gene expression in NT, NP, and KO cells. Gene expression is scaled (z-scored) across all single cells. For visualization purposes we downsampled our dataset to include 150 cells from each class. h) Interactive Genome Viewer (IGV) screenshot of a representative sample of reads mapping at theIFNGR2 gene locus (chr21: 34787276–34787299) targeted by IFNGR2g2 gRNA. CRISPR-induced INDELs are seen as black lines. Arrow indicates cut site. Barplote showing the % of IFNGR2 reads with no INDELS (NID), in-frame (IF) and frameshift (FS) mutations across NT (n=2,386), IFNGR2g2 NP and KO cells (n=278).
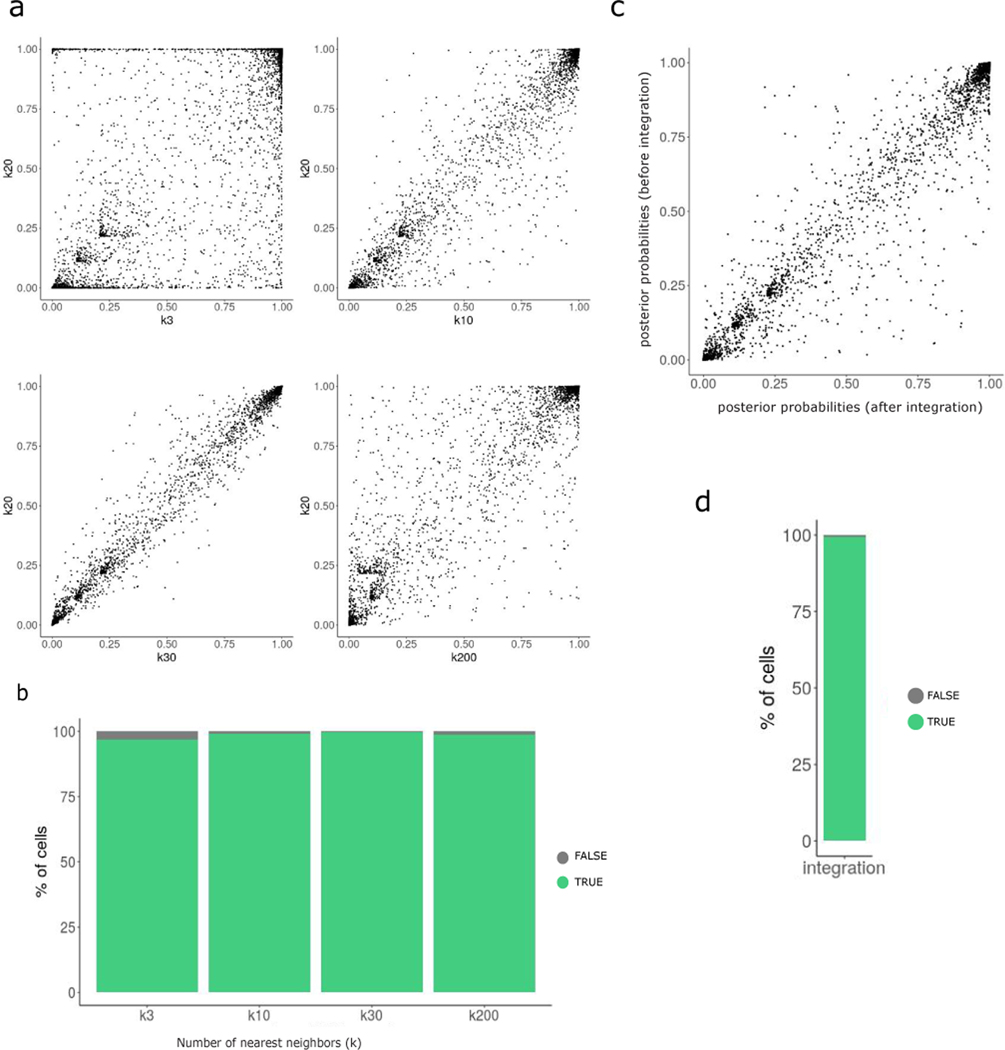
Briefly, for each cell, we identified 20 cells from the control pool (NT cells) with the most similar mRNA expression profiles (Figure 2c; Supplementary Note). These k=20 nearest neighbors should be in a matched biological state to the target cell but did not receive a targeting gRNA. Therefore, subtracting their averaged expression from each cell’s original mRNA profile results in a local perturbation signature, the component of each cell’s transcriptome that specifically reflects its genetic perturbation. Notably, our procedure is capable of characterizing both linear and non-linear perturbation effects, and requires minimal prior knowledge (for example, it does not require a pre-computed list of cell cycle genes). We note that this focuses downstream analyses on changes in expression, rather than cell-state proportions. However, we independently tested for relationships between each perturbation and the resulting fraction of cells in each cell-cycle state and found no significant effects. In addition, we obtained very similar results either when varying the choice of the k parameter, or when identifying nearest neighbors after integrating targeted and control cells (Extended Data 2a–d).
We then repeated principal components analysis and UMAP visualization based on these perturbation signatures, and found that variation in transduction replicate, cell cycle state and activation of cellular stress was substantially mitigated (Figure 2d). As a result, we observed two clear groups of cells expressing a consistent set of gRNAs, including a cluster consisting of cells perturbed for key upstream components of the IFNγ pathway (IFNGR1, IFNGR2, JAK2, STAT1), and a second consisting of cells lacking the downstream IFNγ mediator IRF1. Cells from the remaining 21 perturbations grouped into a single cluster in this unsupervised analysis. However, a subset of cells (for example, those perturbed for SMAD4) were not evenly distributed and showed evidence of substructure (Extended Data 3).
A subset of cells ‘escape’ molecular perturbation
The ECCITE-seq data clearly identified the substantial molecular consequences and distinct clustering associated with perturbation of key IFNγ components. For example, IFNGR2g2 cells in the perturbed cluster (circled cells in Figure 2e), exhibited sharp decreases in the expression of hundreds of IFNγ pathway genes, as well as in PD-L1 protein levels (Figure 2f, g). However, a subset of these cells also appeared to ‘escape’ molecular perturbation. Out of the 1,193 cells expressing gRNAs targeting IFNGR2, 74% were members of the perturbed cluster, but the remaining 26% were indistinguishable from NT controls (Figure 2f, g), demonstrating heterogeneous functional responses among cells expressing the same gRNA.
As has been previously suggested [19,21], cells that ‘escape’ perturbation may not have a deleterious mutation at the target locus. We explored this idea by isolating IFNGR2 reads overlapping the IFNGR2g2 gRNA cut site. We were able to recover reads for 16,543 cells in the overall dataset (278 of these cells expressed IFNGRg2 gRNA, of which 115 appeared to escape perturbation), and characterized the specific mutations that were introduced. As expected, non-targeted cells did not contain insertion or deletion mutations at the cut site (INDELs), while ‘perturbed’ cells typically exhibited frameshift INDELs (Figure 2h). Strikingly, ‘escaping’ cells, when mutated, were primarily characterized by in-frame INDELs, particularly for three or six bases (Figure 2h). These results confirm that a substantial fraction of cells escape the introduction of a deleterious mutation, and therefore exhibit no functional consequence of perturbation.
While this phenomenon will also weaken the signal in bulk screens, the ECCITE-seq readout provides us with an opportunity to remove ‘escaping’ cells from the analysis. Due to the limited depth of scRNA-seq based readouts (alongside the inability to profile mutations outside the transcript end), we cannot directly measure the mutational profile of each cell in the vast majority of cases. However, inspired by previous pioneering work [19,21,26], we reasoned that we could use the cell’s transcriptome as a phenotypic readout of the presence or absence of a deleterious mutation, and developed a strategy to systematically identify and remove ‘escaping’ cells.
Mixscape robustly classifies ‘non-perturbed’ cells
Our analytical solution to identify ‘escaping’ cells is inspired by a classification tool known as Mixture Discriminant Analysis (MDA). MDA assumes that individual samples fall into different groups, but that each group is a mixture of n different subclasses [27]. This assumption is valid for our ECCITE-seq data, where individual cells can be divided into groups dependent on their expressed gRNA, but each group can represent a mixture of ‘perturbed’ and ‘escaping’ (or non-perturbed) subclasses. MDA fits Gaussian mixture models for data points in each group, enabling the assignment of subclass identity.
We therefore modeled our ECCITE-seq transcriptomic data using a mixture of Gaussians, but placed two constraints on the method. First, we set n=1 for the ‘control’ group, and n=2 for all other gRNA-defined groups. Second, based on our previous observations (Figure 2e–g), we assumed that the ‘escaping’ cells exhibit a perturbation signature that is similar to ‘control’ cells. When fitting Gaussian mixture models, we therefore constrained the parameters for one of the mixture components to mirror the ‘control’ cells. We refer to the resulting procedure as mixscape. For each targeted cell, mixscape considers a cell’s perturbation signature (calculated as previously described) and assigns it to a ‘perturbed’ or ‘escaping’ subclass (Figure 3a, Extended Data 4).
Figure 3. Mixscape removes cells that escape perturbation.
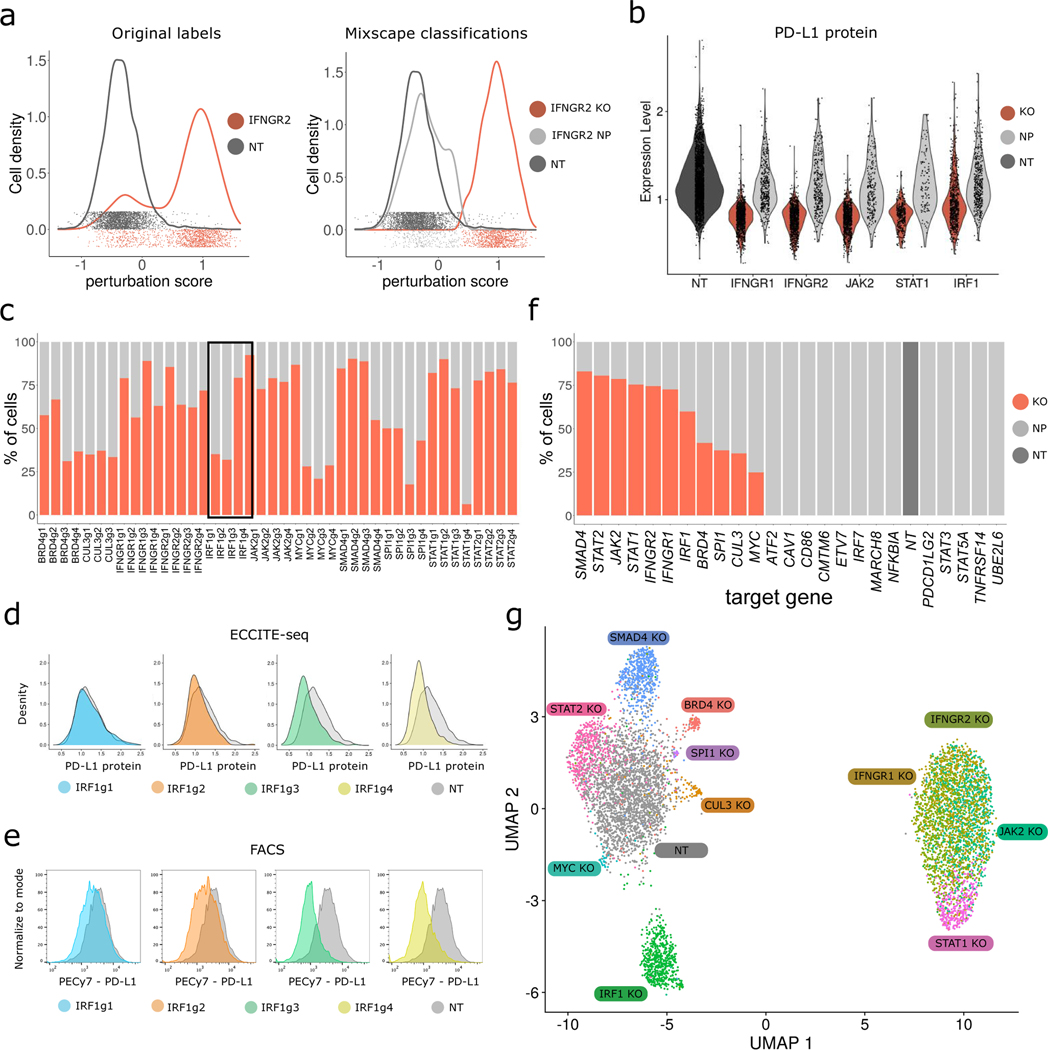
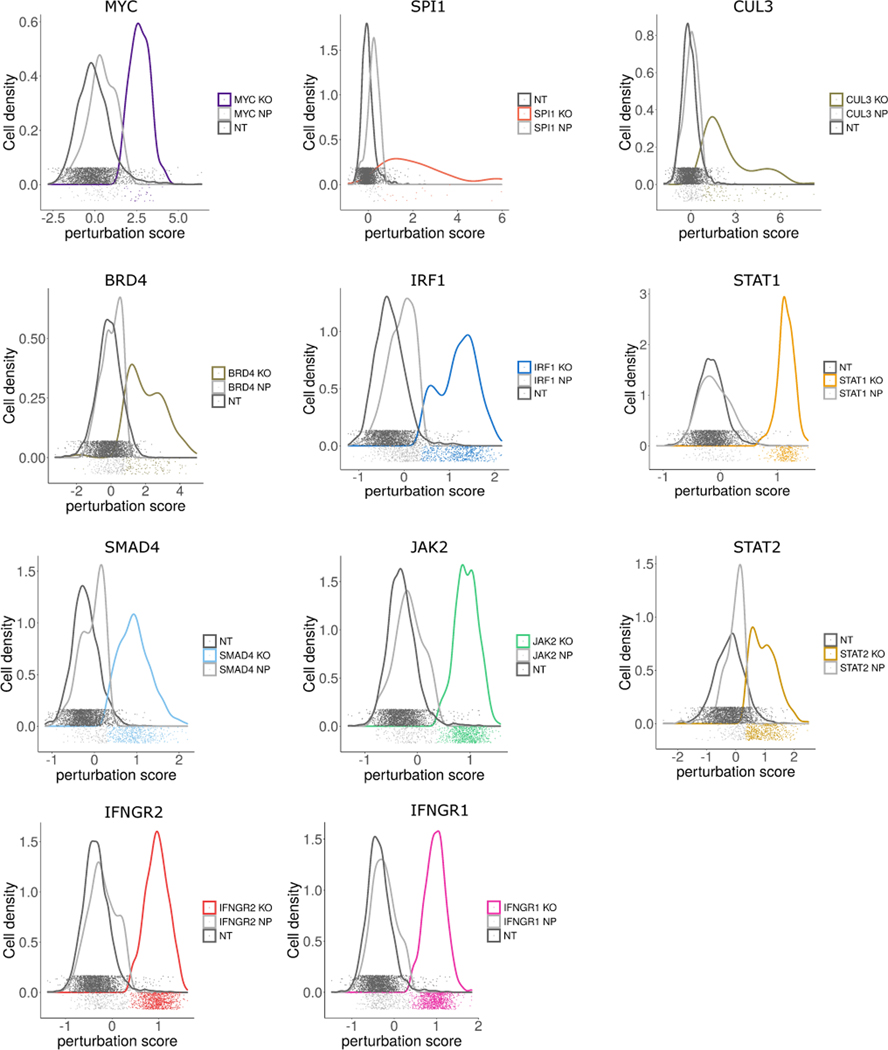
a) Distribution of perturbation scores (Supplementary Note) for NT (non-targeted, grey) and IFNGR2 (red) cells. IFNGR2 cells are a mixture of two Gaussian distributions reflecting non-perturbed (NP) and KO cells. Classifying cells with mixscape resolves this heterogeneity. b) Violin plot showing PD-L1 protein expression based on mixscape classification. Only KO cells show a reduction in PD-L1 protein levels when compared to NT control cells. c) Barplot showing the percentage of targeted cells classified as KO and NP by mixscape for each gRNA (n=20,729 cells over 3 viral transduction replicates). Black box highlights three gRNAs targeting IRF1 gene locus. d) ECCITE-seq measurements of PD-L1 protein expression for cells expressing four distinct gRNAs targeting IRF1, and NT controls. e) Flow cytometry measurements of PD-L1 protein expression for the same populations as in (d). IRF1g1=7,500, IRF1g2=9,000, IRF1g3=5,300, IRF1g4=5,800 and NT=2600 cells. f) Barplot summarizing the percentage of KO and NP cells in each target gene class (n=20,729 cells over 3 viral transduction replicates). g) UMAP visualization of all 7,421 NT and KO cells after running Linear Discriminant Analysis (LDA) (Supplementary Note), revealing perturbation-specific clustering.
We validated the mixscape predictions on IFNGR2 cells (74.6% classified as perturbed (‘KO’), 25.4% classified as non-perturbed (NP)), by confirming that only cells predicted as KO exhibited reductions in IFNγ gene expression and PD-L1 surface protein levels. We observed similar results for additional interferon-regulators, including IFNGR1, JAK2, STAT1, and IRF1 (Figure 3b). Notably, mixscape predicted substantial variation in the perturbation rate of four independent IRF1 gRNAs, ranging from 39% to 92% (Figure 3c, black box). To independently measure the efficacy of each guide, we used flow cytometry to assess its effect on PD-L1 protein expression (Figure 3d, e). These measurements were concordant with mixscape predictions, further validating our approach.
We note that in cases where functional removal of a gene fails to result in a detectable transcriptomic shift, mixscape will also mark a cell as NP, even if a frameshift mutation was introduced (Figure 3f). Indeed, for 15 genes, mixscape predicted a 0% perturbation rate (Supplementary Figure 4a, b). In each of these cases, we also found no differentially expressed genes when comparing cells targeted by these gRNAs to NT controls. Furthermore, when we attempted to classify cells expressing NT gRNAs as a negative control, mixscape correctly predicted a 0% perturbation rate. Importantly, these results demonstrated that mixscape does not overfit the data and only predicts cells to be in the ‘perturbed’ class when there is a detectable change in their molecular state.
A full description of mixscape is presented in the Supplementary Note, alongside comparative benchmarking with MIMOSCA [19] and MUSIC [26] (Extended Data 5 a–d and 6a–d). We used both positive controls (IFNGR2g2 cells) and negative controls (NT cells) to evaluate performance, and found that mixscape was the only method capable of sensitively identifying perturbed cells without overfitting (Extended Data 5a and 6a). We have implemented mixscape as part of Seurat, our open-source R toolkit for single-cell analysis [28], and include an introductory vignette (Supplementary Data 1) demonstrating how to run the software on our ECCITE-seq dataset.
For 11 genes, mixscape did predict the presence of perturbations, with a perturbation rate varying from 23% to 83%. This variation could reflect differences in gRNA targeting efficiency, the strength of perturbation for each individual gene, or differences in the dosage requirement (heterozygous vs homozygous KO) for each putative regulator. We also note in some cases our observed perturbation rate may be skewed for perturbations that result in cell death, as these could selectively deplete KO cells (Extended Data 7a, b). Regardless, these analyses highlight the importance of characterizing the extensive heterogeneity within cells that receive the same gRNA. In downstream analyses, we chose to remove cells that were predicted to escape perturbation, as including these cells will substantially dampen the biological effects associated with each knockout.
To visualize the remaining 11 classes, we applied Linear Discriminant Analysis (LDA). LDA aims to identify discriminant functions that maximally differentiate the mixscape-derived classes (Supplementary Note). We then used these discriminant functions as input to generate a two-dimensional UMAP for visualization (Figure 3f). We found that the resulting UMAP effectively separated the different perturbations from NT control cells (Supplementary Note), while maintaining local proximity for similar perturbations (i.e. IFNGR1 and IFNGR2 co-localize in the embedding). Using LDA as an initial step improved separation in all cases except for the negative control (Supplementary Figure 5), suggesting that combining LDA with UMAP is an effective approach for the visualization of pooled single-cell screens.
CUL3 and BRD4 are negative regulators of PD-L1 expression
These analyses suggest that after removing NP cells, each genetic KO induces a specific molecular response. Indeed, when performing differential expression compared to control cells, we observed striking differences in gene expression that defined each molecular perturbation (Figure 4a). Of particular interest, we observed that perturbation of eight genes also resulted in a shift of PD-L1 protein levels in our ECCITE-seq data (Figure 4b). We identified five positive regulators (PD-L1 downregulation upon perturbation) and three negative regulators, a subset of which had been previously validated [9,11,13,16,17,29]. For example, in addition to the core components of the IFNγ pathway, we verified that perturbation of BHLH transcription factor MYC [12] and the ubiquitin ligase CUL3 [15] both increased PD-L1 protein levels, consistent with previous reports. These results demonstrate the potential for ECCITE-seq data to robustly and accurately characterize multiplexed perturbations. Importantly, perturbation of these eight genes did not result in appreciable shifts in CD86 and PDL2 protein expression (Supplementary Figure 6a, b) suggesting that these regulatory effects are specific to PD-L1.
Figure 4. BRD4 and CUL3 are negative regulators of PD-L1 expression.
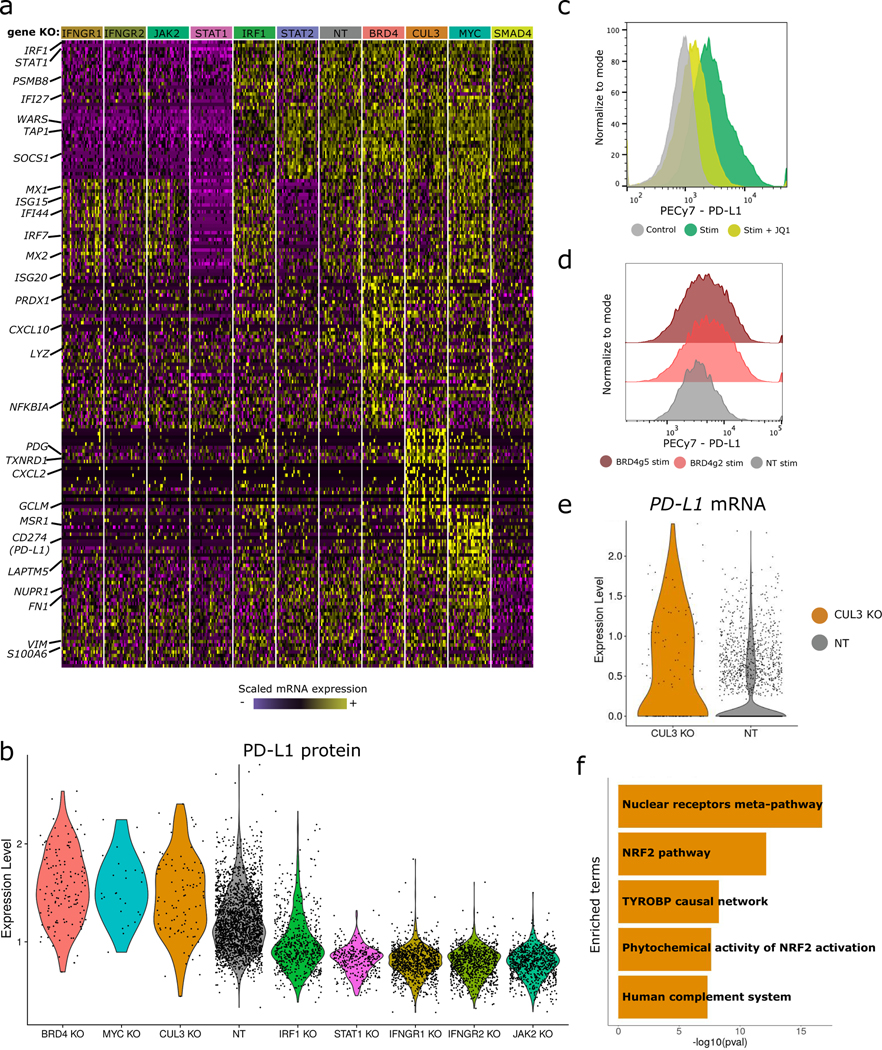
a) Single-cell mRNA expression heatmap showing 20 differentially expressed genes for each mixscape-classified perturbation. For visualization purposes we downsampled our dataset to include 30 cells from each class in the heatmap. b) Violin plots of PD-L1 protein expression for all identified regulators. BRD4 (p-value=4.37e−28), CUL3 (p-value=2.81e−11) and MYC (p-value=4.51e−7) are negative regulators, while the remaining are positive (p-value < 1e−6 in all cases, two-sided Wilcox Rank sum). NT, non-targeted. c) Flow cytometry measurements of PD-L1 protein expression across experimental conditions. JQ1 inhibitor treatment (24 hours, 1μM) reduces stimulation-induced PD-L1 expression. Control=20,000, stim=20,000 and JQ1+stim=20,000 cells. d) Flow cytometry measurements of PD-L1 protein expression in BRD4 gRNA expressing cells, validating our ECCITE-seq findings. BRD4g2=9,100, BRD4g5=15,000 and NT=4,800 cells. e) Violin plots showing elevated expression of PD-L1 transcript in CUL3 KO cells, in comparison to non-targeting controls. f) Barplot summarizing gene set enrichment analysis results for 300 genes upregulated in CUL3 KO cells. Analysis was performed using the Human WikiPathways database from the EnrichR package and shows strong enrichment for the NRF2 pathway.
We observed that perturbation of the bromodomain-containing protein BRD4 resulted in an upregulation of PD-L1 protein levels, indicating that BRD4 acts as a negative regulator. Previous studies have utilized the bromodomain inhibitor JQ1, an alternative to BRD4 genetic perturbation, to suggest that BRD4 is in fact a positive regulator of PD-L1 [13,29]. To help reconcile these differences, we treated our stimulated cells with JQ1 and observed a reduction in PD-L1 expression (Figure 4c). However, we validated that CRISPR-mediated genetic perturbation of BRD4 leads to an up-regulation of PD-L1 expression using flow cytometry (Figure 4d, two independent gRNAs), confirming the ECCITE-seq result. Furthermore, bulk RNA-seq from cells expressing BRD4 gRNAs showed upregulation of the gene module previously identified by ECCITE-seq (Extended Data 8a, b). These results indicate that BRD4 is a negative regulator of PD-L1 expression, and that the JQ1 inhibitor may interact with additional proteins in order to achieve PD-L1 reduction.
We also observed that CUL3 and BRD4 perturbation resulted in similar levels of PD-L1 protein upregulation (Figure 4b). While the ubiquitin ligase complex CUL3-SPOP has been shown to post-transcriptionally regulate PD-L1 protein levels [15], we also detected a 1.6-fold (p < 10−11) upregulation of PD-L1 mRNA levels (Figure 4e). We observed both protein and mRNA up-regulation only in cells predicted to be perturbed by mixscape. Our results suggest that in addition to its known role in regulating PD-L1 protein stability via direct ubiquitination, CUL3 also modulates PD-L1 mRNA levels.
To gain further insight into the effects of CUL3 perturbation, we identified differentially expressed genes between CUL3 KO and control cells, and intersected these genes with members of previously identified transcriptional pathways (Extended Data 9a, b). We observed no overlap with canonical IFNγ signaling targets, suggesting that CUL3-mediated transcriptional regulation of PD-L1 is mediated through an IFNγ-independent pathway. Instead, we observed a striking enrichment (p < 10−14) for target genes of the nuclear factor erythroid 2-related factor 2 (NRF2) signaling pathway (Figure 4f).
CUL3 indirectly regulates PD-L1 expression through NRF2
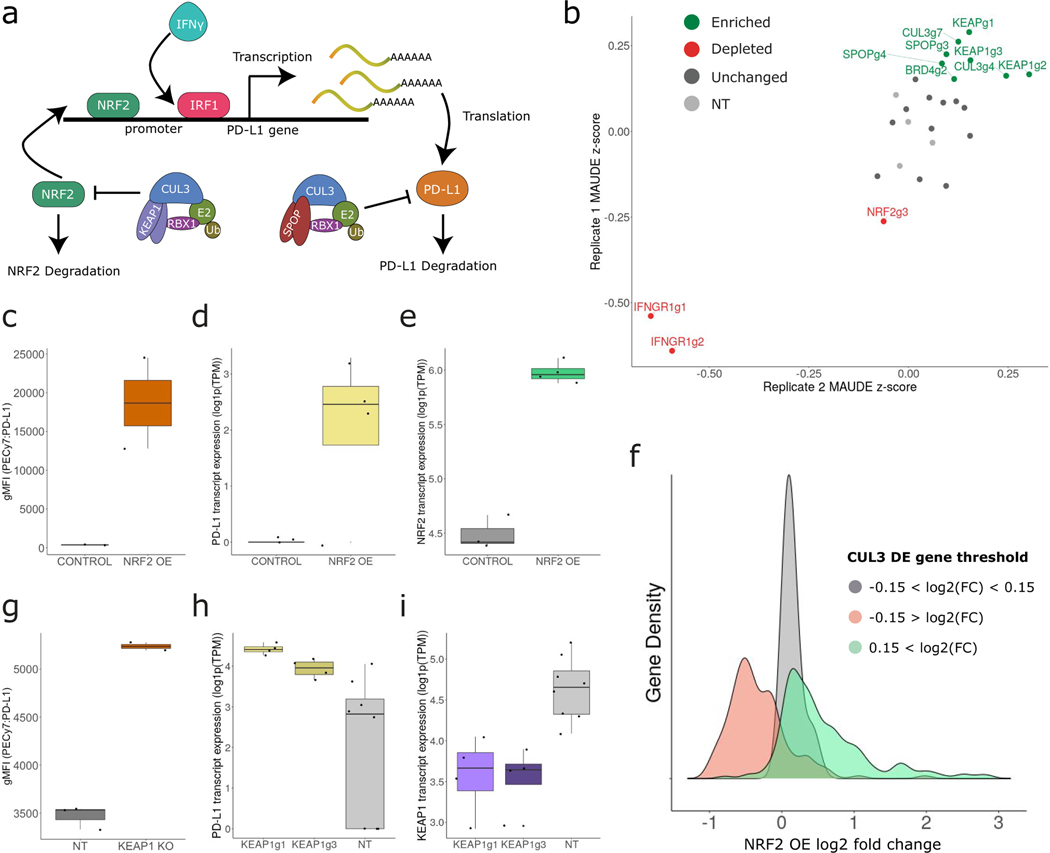
The NRF2 pathway is activated during oxidative stress and induces the expression of many antioxidant genes to prevent cellular damage and death [30]. NRF2 has been shown to directly bind to the PD-L1 promoter and activate transcription under ultraviolet-induced stress [14], and NRF2 protein stability is directly regulated by the CUL3-KEAP1 ubiquitin ligase complex [31]. Taken together with these findings, our data suggest that CUL3 may have two distinct mechanisms for regulating PD-L1 expression. First, as previously described [15], perturbation of the CUL3-SPOP complex interferes with the ubiquitination of PD-L1, directly enhancing its stability and protein expression level. Second, our data indicate that perturbing the CUL3-KEAP1 complex interferes with the ubiquitination of NRF2, boosting pathway activation and PD-L1 transcript expression (Figure 5a).
Figure 5. CUL3-KEAP1 complex indirectly regulates PD-L1 through NRF2.
a) Schematic representation describing two complementary modes of CUL3-mediated PD-L1 regulation. The CUL3-SPOP complex directly regulates PD-L1 protein stability through ubiquitination. The CUL3-KEAP1 complex regulates NRF2 protein stability, indirectly modulating NRF2-mediated PD-L1 transcription. b) Validation pooled CRISPR screen results (2 biological replicates) targeting KEAP1, SPOP, CUL3, BRD4, IFNGR1 and NRF2 (including 4 non-targeting gRNAs). gRNAs targeting KEAP1, SPOP, CUL3 and BRD4 (green) were enriched in cells expressing high levels of PD-L1 protein while NRF2 and IFNGR1 gRNAs were depleted (red) NT, non-targeted. c) Boxplots showing the PD-L1 protein geometric mean fluorescence intensity (gMFI) (n =2 for each boxplot), (d) PD-L1 transcript and (e) NRF2 transcript levels (log1p(TPM)) in control (n = 3) and NRF2 overexpression (OE) (n = 4) cells. f) Density plot showing the average log2 fold change of three CUL3 KO cell DE gene subsets in the NRF2 OE dataset. g) Boxplots showing the PD-L1 protein geometric mean fluorescence intensity (gMFI) (n=2 KEAP1 KO and n=3 NT), (h) PD-L1 transcript and (i) KEAP1 transcript levels (log1p(TPM)) in NT (n = 8) and KEAP1 KO (n = 8) cells. In c-e and g-i boxplots the middle line is the median, the lower and upper hinges correspond to the first and third quartiles, the upper whisker extends from the hinge to the largest value no further than 1.5 × IQR from the hinge (IQR = inter-quartile range) and the lower whisker extends from the hinge to the smallest value at most 1.5 × IQR of the hinge.
To validate our findings, we performed a focused CRISPR screen using 27 gRNAs targeting six genes (Supplementary Table 1). We used flow cytometry to isolate PD-L1 high (PD-L1hi) and low expressing (PD-L1lo) cells after stimulation (Supplementary Figure 7), sequenced the gRNA locus for each group, and compared the gRNA representation. gRNAs targeting genes that were predicted to be negative regulators of PD-L1, including CUL3, and KEAP1 were consistently overrepresented in PD-L1hi cells in two biological replicates (Figure 5b), while we observed the converse for genes encoding predicted positive regulators (NRF2 and IFNGR1).
As an additional validation, we transiently overexpressed NRF2 in cells, and performed flow cytometry and bulk RNA-seq. As expected, we observed up-regulation of both PD-L1 mRNA and PD-L1 protein levels (Figure 5c–e). Moreover, when we examined the module of genes that were responsive to CUL3 perturbation in our ECCITE-seq data, we found that they were strongly up-regulated after NRF2 overexpression (Figure 5f). We observed concordant results when using gRNAs against KEAP1, which should mimic NRF2 overexpression (Figure 5g–i; Extended Data 8a, b). Taken together, our data demonstrate that by modifying the activity of the NRF2 pathway, the CUL3-KEAP1 complex is an indirect regulator of PD-L1 and highlight the potential for ECCITE-seq to disentangle complex regulatory pathways via simultaneous characterization of both RNA and protein modalities.
DISCUSSION
In this study, we coupled pooled CRISPR screens to a multi-modal single-cell sequencing readout in order to investigate the regulation of immune checkpoint proteins, such as PD-L1. We leveraged our dataset to characterize the transcriptional and post-transcriptional effects of 111 independent perturbations. To assist in this process, we developed unsupervised computational methods to control for confounding sources of variation that can mask perturbation signals in ECCITE-seq datasets. Our analyses identified numerous regulators of PD-L1, and in particular, two negative regulators (BRD4 and CUL3) which we validated using complementary approaches.
The multi-modal nature of ECCITE-seq data enabled us to move beyond the identification of regulators towards a more in-depth molecular characterization. For example, we found that CUL3-KEAP1 can act as an indirect regulator of PD-L1 transcription, in addition to the previously identified role for CUL3-SPOP in directly regulating PD-L1 protein stability. These findings are intriguing in light of recent reports that KEAP1 is often mutated in lung cancer, and mutations in NRF2/KEAP1 have been associated with treatment resistance [23,32]. Future studies may benefit from exploring possible links between these mutations and the expression of immune checkpoint molecules.
Our datasets also highlight that cells which are targeted with the same sgRNA are inherently heterogeneous. First, we demonstrated that the calculation of a ‘local’ perturbation signature can remove confounding sources of variation from downstream analyses, even when these sources are unknown. Second, we introduce mixscape, inspired by mixture discriminant analysis and building on previous pioneering methods [19,21,26]. Mixscape robustly filters cells that do not exhibit transcriptomic evidence of perturbation, and substantially increases the signal-to-noise ratio in downstream analyses (Extended Data 10). The ability to computationally leverage the heterogeneity within targeted cells is a distinct advantage of coupling genetic screens to a single-cell sequencing readout. Importantly, alternative genetic perturbations such as CRISPR interference and CRISPR activation may reduce this heterogeneity, though confounding sources of variation and ‘escaping’ cells are likely to characterize these technologies as well.
One limitation of mixscape is the reliance on detecting transcriptomic shifts in order to classify cells. In particular, perturbations that modify alternative phenotypes, such as epigenetic state, protein levels, or functional responses, but exhibit no evidence of transcriptomic change will be classified as non-perturbed. In this manuscript, we inferred perturbation status using the transcriptome, and validated our calls using surface protein levels from ECCITE-seq. However, integrative multi-modal approaches [33] could enable joint analysis of the transcriptome and protein levels when filtering non-perturbed cells and represent a promising future extension of our method.
Lastly, we note that mixscape’s binary classification of targeted cells likely represents an oversimplification that can be improved with additional experimental data from large-scale future experiments. Genetic perturbation with CRISPR/Cas9 introduces a diverse set at the cut site. As datasets increase in size, we envision sufficient scale to characterize how each precise mutation has a unique (though potentially subtle) effect on a cell’s molecular phenotype. Moreover, rapid molecular advances continue to enable the simultaneous measurement of additional cellular components, such as chromatin state and gene expression [34–37]. Together, these data will enable systematic perturbation of gene structure and dosage, alongside detailed characterization of multiple molecular modalities.
METHODS
Cell culture and Maintenance
THP-1 cell line was obtained from ATCC (TIB-202) and was grown at 37C in RPMI medium supplemented with 10% FBS. To induce the expression of various immune checkpoint proteins cells were treated with Decitabine (Sigma-Aldrich A3656, 0.25μM) for three days, TGFβ1 for two days (Thermo Fisher Scientific PHG9204, 2.5ng/ml) and IFNγ for one day (R&D systems 284-IF-100, 10ng/ml). HEK293FT human embryonic kidney (#R70007) cells were grown in DMEM medium supplemented with 10% FBS (D10). The D10 medium for HEK293FT cells was additionally supplemented with 6mM L-glutamine (Thermo Fisher Scientific, #25030081), 1mM Sodium Pyruvate (Thermo Fisher Scientific, #11360070) and 0.1mM MEM Non Essential Amino Acids (Thermo Fisher Scientific, #11140050). TrypLE (Thermo Fisher Scientific, #12604039) was used to lift HEK293FT cells from plates during passaging. All cells were passaged every two to three days and low passage cells were used for all experiments (p3-p12).
Flow Cytometry
After treatment, cells were centrifuged at 300g for five minutes and resuspended in 100μl of MACS buffer (1X PBS, 0.5% BSA, 2mM EDTA). 5μl of FcX blocking reagent was added and cells were placed on ice for 10 minutes. Next, antibodies were added directly into the mix and cells were kept on ice for another 30 minutes. Prior to flow cytometry (FACS), cells were passed through a 40μm cell strainer (VWR, #10032–802) to remove any cell clumps. The following FACS antibodies were used in these experiments at concentrations recommended by the manufacturer: PD-L1 (BD Biosciences, #558017), PD-L2 (BioLegend, #329606), CD86 (BioLegend, #305412). Compensation beads were used to overcome signal overlap between fluorophores (BD Biosciences, #552843). To check and remove any dead or apoptotic cells DAPI (Sigma Aldrich, #D9542–5MG) was added to the staining mix at a concentration of (0.4μg/1mL). All FACS measurements were performed using the SONY SH800 cell sorter. FACS analyses and plots were made using the FlowJo™ Software [38].
CITE-seq experiment
THP-1 cells were stimulated as described above or left unstimulated. At the end of the stimulation, cells were collected by centrifugation at 300g for 5 minutes. Cells were resuspended in 100μl of staining buffer containing 5μl of FcX blocking reagent and were placed on ice for 10 minutes. Next, 100μl of staining buffer containing CITE-seq antibodies (0.5μg/antibody/sample) was added to the cells. The cells were placed in the 4C fridge for 30 minutes to allow for antibodies to bind to their target protein. For the CITE-seq experiment antibodies were conjugated in-house following the hyper Oligo-antibody conjugation protocol as detailed here (https://cite-seq.com/protocol/). To keep track of the experimental condition (stimulated vs unstimulated) and be able to detect and remove cell doublets, cells were aliquoted into three tubes containing a uniquely barcoded hashing antibody. Cells were placed in the fridge for an additional 20 minutes. After staining was complete, all samples were washed three times with 1ml staining buffer to remove all the excess unbound antibodies. Next, cells were resuspended in 200–300μl of 1X PBS and counted using the Countess II Automated cell counter system. Immediately before loading to the 10x Genomics instrument, cells from all experimental conditions were pooled at the appropriate concentration (recovery of 10,000 cells per lane).
CITE-seq data library construction, sequencing and data analyses
We ran 1 lane of 10x Genomics 5’ (Chromium Single Cell Immune Profiling Solution v1.0, #1000014, #1000020, #1000151) aiming for 20,000 cell recovery per lane. Prior to the run, cell viability was determined and cell numbers were estimated as previously described. To increase the number of cells assayed we hashed them following the cell hashing protocol [25]. mRNA, hashtags (Hashtag-derived oligos, HTOs) and protein (Antibody-derived oligos, ADTs) libraries were constructed by following 10x genomics and CITE-seq protocols. All libraries were sequenced together on a Novaseq run. Sequencing reads coming from the mRNA library were mapped to the hg19 reference genome using the Cellranger Software (V2.1.0). To generate count matrices for HTO and ADT libraries, the CITE-seq-count package was used (https://github.com/Hoohm/CITE-seq-Count). Count matrices were then used as input into the Seurat R package [28,39] to perform all downstream analyses.
Cells with low quality metrics, high mitochondrial gene content (> 10%) and low number of genes detected (< 500) were removed. RNA counts were log-normalized using the standard Seurat workflow. ADT and HTO counts were normalized using the centered log ratio transformation approach, with a margin = 2 (to normalize across cells instead of across features). To identity cell doublets and assign experimental conditions to cells, we used the HTODemux function. We performed PCA on the protein measurements, observing a continuum in the level of PD-L1 up-regulation, and selected the top 200 genes whose expression correlated with this continuum. These genes are shown in Figure 1D, where cells in both the protein and RNA heatmaps are ordered based on their PC1 embedding values.
CITE03 plasmid construction
To increase sgRNA targeting efficiency we switched the sgRNA scaffold on the CROP-seq plasmid (addgene, #86708) with the optimized sgRNA scaffold as described in [40]. Moreover, we replaced the puromycin resistance gene on the CROP-seq plasmid with a blasticidin resistance gene fused to eGFP amplified from the pFUGW-EFS-V5-EGFP-2A-Bla-WPRE plasmid (addgene, #71215). Finally, we removed Cas9 protein to decrease the size of our plasmid and achieve higher viral titer.
Inducible Cas9 THP-1 cell line
The THP-1-Cas9 inducible cell line was made by lentiviral transduction using the pCW-Cas9-puro plasmid (addgene, #50661). Single cells were sorted into 96-well plates three days after puromycin selection to obtain single cell clones. Single cell colonies were expanded for four weeks before assessing Cas9 expression. Protein lysates were obtained from ten clones before and after 24hrs of doxycycline treatment (1μg/ml, Sigma-Aldrich D9891) to check Cas9 expression by westernblot. Briefly, cells were washed 2 times with 1mL of ice-cold 1X PBS and resuspended in RIPA lysis buffer (Amresco, N653) supplemented with a protease inhibitor cocktail (Bimake, B14001). Cas9 expression was verified by western blot using GAPDH antibody as loading control (Cell signaling Technology, 2118S) and Flag antibody (Cell signaling Technology, 14793S) to detect Cas9 protein. Protein bands were visualized using fluorescently labeled secondary antibodies (LI-COR, #925–32212 and #925–68073) and the Odyssey Imaging System. One of the clones with the highest Cas9 expression was selected and used for all downstream experiments. To minimize leakiness of our doxycycline inducible Cas9 system, a TET-free FBS (VWR, 97065–310) was used to grow these cells.
gRNA design, virus production and Cas9 dynamics
Guides webtool (http://guides.sanjanalab.org/#/) was used to predict gRNAs with high targeting efficiency and low off-target effects [41]. 3–4 guides per gene were selected together with 10 guides predicted to have no sequence similarity with the human genome (non-targeting controls). Guide oligos were synthesized individually using IDT. Oligos were cloned into the CITE03 vector as previously described [42]. Low passage HEK293FT cells were transfected with MD2.G (addgene #12259), PAX2 (addgene #35002) and the CITE03 plasmids carrying gRNAs using Lipofectamine 2000 (Thermo Fisher Scientific, #11668030). Media was replaced with DMEM + 10% FBS + 1% BSA (NEB, B9000S), 6 hours post-transfection. Viral supernatants were harvested 48–72 hours post transfection by centrifugation (ten minutes, 3000 rpm, 4C) and stored in a −80C freezer until used. To estimate the concentration of the virus, cells were infected with increasing amounts of virus and three days post antibiotic selection, the percentage of dead and live cells was calculated. In all experiments, cells were infected at low multiplicity of infection (MOI) to achieve one gRNA insertion per cell.
To estimate how many days after Cas9 induction we have saturation of CRISPR-induced insertions and deletions (INDELs), we ran single gRNA experiments targeting PD-L1 protein. Cas9 was induced with the addition of doxycycline (1μg/mL) for one, three, five and seven days and we used TIDE [43] and Surveyor assays (IDT, #706020) to estimate the percentage of cells with INDELs. As an independent method, we also used flow cytometry to check PD-L1 expression and quantify the percentage of knockout cells (KO). We found that after five days of Cas9 induction the percentage of cells with INDELs stops increasing and we have achieved the highest percentage of cells with low PD-L1 protein expression. Based on these observations, we decided to treat cells with 1μg/mL of doxycycline for five days prior to running the ECCITE-seq experiments.
ECCITE-seq pilot experiment
We ran an initial pilot experiment to validate our ability to accurately recover gRNA and plan experimental design. We generated single gRNA cell lines for 20 gRNA, including PD-L1, IFNGR1, and non-targeting controls, and performed individual infections. Next, we stimulated cells as previously described. We hashed each cell line separately [25] prior to running our ECCITE-seq experiment. This experimental set up enabled us to have two independent methods for encoding the perturbation received by each cell. Libraries were sequenced on a NextSeq500. mRNA libraries were quantified using Cell Ranger (2.1.1; hg19 reference), and normalized using standard log-normalization in Seurat. HTO and ADT libraries were processed with CITE-seq-count (https://github.com/Hoohm/CITE-seq-Count), and normalized using the centered log-ratio (CLR, across cells). Cells with high mitochondrial gene content (> 8%) were removed. RNA counts were log-normalized using the standard Seurat workflow. ADT, HTO and GDO counts were normalized using the centered log ratio transformation approach, with a margin = 2 (to normalize across cells instead of across features).
We demultiplexed the cell hashing data using the MULTIseqDemux function adopted from [44], and removed all classified doublets. We assigned gRNA identity using HTODemux in Seurat. To assess the accuracy of gRNA classification, we examined each cell with an identified gRNA, and compared its classification to its HTO-derived label. We observed an overall concordance of 99.4%. Concordant cells were used for plotting PD-L1 expression in Figure 1E.
ECCITE-seq experimental setup
THP-1 Cas9-inducible cells were transduced with virus containing 111 guides at low MOI to obtain cells with 1 gRNA. 24 hours post-transduction cells were centrifuged and resuspended in new media containing blasticidin (15μg/mL) to select for successfully transduced cells. Three days after antibiotic selection, media was exchanged with fresh R10 containing blasticidin (15μg/mL) and doxycycline (1μg/mL) to induce Cas9 expression and INDEL formation. After five days of doxycycline treatment, cells were stimulated with DAC, IFNγ and TGFβ1 for an additional three days or left unstimulated prior to running the 10x Genomics experiment (Supplementary Figure 2A). The final pool of cells loaded onto the 10x Genomics chip contained 10% of unstimulated cells and 90% of stimulated cells coming from four biological replicates.
Single cell ECCITE-seq library construction and sequencing
For the ECCITE-seq experiment, we run eight lanes of 10x Genomics 5’ (Chromium Single Cell Immune Profiling Solution v1.0, #1000014, #1000020, #1000151) aiming for 10,000 cell recovery per lane. Prior to the run, cell viability was determined, and cell numbers were estimated as previously described. To keep track of each biological replicate identity, samples were hashed following the cell hashing protocol [25]. mRNA, hashtags (Hashtag-derived oligos, HTOs), protein (Antibody-derived oligos, ADTs) and gRNA (Guide-derived oligos, GDOs) libraries were constructed by following 10x genomics and ECCITE-seq protocols. All libraries were sequenced together on two lanes of a NovaSeq run. Sequencing reads coming from the mRNA library were mapped to the hg19 reference genome using the Cellranger Software (V2.1.1). To generate count matrices for HTO, ADT and GDO libraries, the CITE-seq-count package was used (https://github.com/Hoohm/CITE-seq-Count). Count matrices were then used as input into the Seurat R package [28,39] to perform all downstream analyses.
ECCITE-seq data pre-processing in Seurat
Cells with low quality metrics, high mitochondrial gene content (> 10%) and low number of genes detected (< 100) were removed. RNA counts were log-normalized using the standard Seurat workflow. ADT, HTO and GDO counts were normalized using the centered log-ratio transformation approach, with margin = 2 (normalizing across cells). To identity cell doublets and assign experimental conditions to cells, we used the MULTIseqDemux function adopted from [44]. MULTIseqDemux-defined cell doublets and negatives were removed from any downstream analyses. To assign a gRNA identity to each cell, we looked at the GDO counts. If a cell had less than five counts for all gRNA sequences we classified it as negative. For all other cells, we found the gRNA with the highest number of counts and assigned it to that cell. Cells that had high counts for more than one gRNA were classified as doublets.
We checked the gRNA representation across all four biological replicates included in this experiment by calculating the percentage of cells that belonged to each gRNA class within each biological replicate (Supplementary Figure 3b). We removed replicate #4 (both stimulated and unstimulated cells) as it had a skewed gRNA representation, likely due to long term cell culture. We also removed cells in target gene classes where less than 10 total cells were detected, even after pooling across gRNA and replicates.
RNA-based clustering of single cells
To visualize cells based on an unsupervised transcriptomic analysis (Figure 2a), we first ran PCA using 2000 variable genes. The first 40 components were used as input for UMAP visualization in two-dimensions [45]. We calculated cell-cycle scores using the CellCycleScoring function in Seurat v3.1 with default parameters.
Description of the mixscape method
For a detailed description of the mixscape method, please see the Supplementary Note.
Estimating the percentage of INDELs from scRNA-seq reads
We used Sinto (https://timoast.github.io/sinto/basic_usage.html) to extract all sequencing reads that belonged to the perturbed and non-perturbed IFNGR2g2 cells as well as the non-targeting control cells from the cellranger possorted genome bam files. Bam files from all 10x Genomics lanes were merged to three final bam files, one for each group (Non-targeting, knockout and non-perturbed). Samtools [46] was used to create the index file used for visualization into IGV tools Software [47]. To quantify the percentage of INDELs at the expected gRNA cut site, we used GenomicRanges, GenomicFeatures, GenomicAlignments, Rsamtools and bedr R packages. First, a bed file was constructed to specify the gRNA cut site. Next, we removed any reads that didn’t overlap our cut site. To ensure accurate INDEL quantification, we only assessed reades that extended enough into the 3’ end of the gRNA sequence. We relied on the read cigar string information to quantify the number of reads with frameshift or inframe mutations by looking at the number of bases inserted/deleted (three or multiple of three = inframe, any other as frameshift). To calculate the percentage of inframe and frameshift deletions we divided each class by the total number of reads post filtering.
IRF1 gRNA efficiency experiments
THP-1 Cas9 cells were transduced with viruses containing one of the following gRNAs: IRF1g1, IRF1g2, IRF1g3, IRF1g4 and non-targeting gRNA control. After selection, Cas9 induction and three days of stimulation with DAC, TGFB1 and IFNγ cells were collected and flow cytometry was used to assess changes in PD-L1 protein expression as previously described.
Differential expression and gene set enrichment analyses
We used FindMarkers() in Seurat to find differentially expressed genes between non-targeting cells and cells that belonged to a targeted gene class. The top 20 genes from each class were used as input into the heatmap in Figure 4A. Finally, this top 300 list of genes from each class was used as input into the EnrichR package [48,49] to run pathway analysis using the human WikiPathways database from 2019. Figure 4F shows the top five enriched pathways with a p_value < 0.001 for CUL3 KO cells.
JQ1 inhibitor experiments
THP-1 cells were treated with DMSO, JQ1 (1μM, 24 hours), JQ1 + IFNγ, Decitabine+TGFβ1+IFNγ or Decitabine+TGFβ1+IFNγ +JQ1. PD-L1 expression was assessed by flow cytometry as previously described.
Validation CRISPR screen
We designed new gRNAs using the guides webtool to target KEAP1, NRF2, BRD4 and CUL3 in order to validate our ECCITE-seq findings. Plasmids containing the gRNAs were pooled at equal ng amounts and the virus was produced as previously described. THP-1 cells were transduced at low MOI and cells were selected with blasticidin for three days. After selection Cas9 expression was induced and cells were stimulated as previously described. At the end of stimulation, cells were spun down, resuspended in 100μl of MACS buffer containing 5μl of FcX blocking reagent and placed on ice for ten minutes. Next, cells were stained with a PD-L1 antibody for 30 minutes, washed with 1mL of MACS buffer and passed through a 40μM cell strainer to remove cell clumps. The Sony SH100 sorter was used to sort the top 15% of cells with the highest and lowest PD-L1 protein expression in two separate tubes containing Quick Extract buffer (Epicenter). We amplified the gRNA sequence from the isolated genomic DNA as described in [50]. Samples we sequenced with a target recovery of 1000 reads per gRNA per sample. To quantify gRNA counts in each sample, we first made a gRNA reference fasta file and used it to map and quantify our reads with Bowtie2 [51]. To analyze our data and find gRNAs enriched or depleted in our samples we used MAUDE [52].
gRNA KEAP1 and BRD4 perturbation experiments
THP-1 Cas9 cells were transduced with viruses containing one of the following gRNAs: BRD4g2, BRD4g5, KEAP1g1, KEAP1g3 and non-targeting controls. After three days of stimulation with DAC, TGFB1 and IFNγ cells were collected and flow cytometry was used to assess changes in PD-L1 protein expression as previously described. Cells from all experimental conditions were sorted directly into 96-well plates (three replicates, 500 cells per replicate) containing 20μl of RLT lysis buffer for bulk RNA-seq analyses.
NRF2 overexpression experiments
NRF2 over-expression plasmid was purchased from Addgene (#21549). To transfect THP-1 cells, GeneXplus reagent was used as recommended by the manufacturer. 24 hours post-transfection cells were inspected under the microscope to verify reporter eGFP and dsRed proteins were expressed in the cells. 24–48 hours post-transfection, cells were collected and washed with R10 media. Flow cytometry was used to assess changes in PD-L1 protein expression as previously described. Cells from all experimental conditions (control and NRF2 OE) were sorted directly into 96-well plates (three replicates, 100 cells per replicate) containing 20μl of RLT lysis buffer for bulk RNA-seq analyses.
Bulk RNA-seq library construction, sequencing and analyses
100 – 500 cells were sorted directly into 96-well plates containing 20μl of RLT lysis buffer (#79216, Qiagen) and stored in −80C until ready to proceed with reverse transcription (RT). RNA CleanXP beads (A66514, Beckman coulter) were used for a 2X cleanup in order to exchange RLT lysis buffer for RT master mix. RNA on the beads was eluted directly into the RT master mix containing dNTP mix (10mM), NxGen RNase inhibitor (Lucigen, 40U/μl), Maxima RT 5X buffer and water. To keep track of the identity of the sample in each well, a different 3’ UMI barcode primer was added to each well. Samples were incubated at 72C for three minutes and Betaine, MgCL2 (100mM), TSO primer (10μM) and maxima enzyme were added as well. Reverse Transcription, PCR amplification and library construction following the barcoded plate-based single-cell RNA-seq protocol [53]. Samples were sequenced on a MiSeq or NextSeq instrument.
Reads were mapped to hg19 reference genome and once the count matrices were generated the Seurat package was used for all analyses. We used each sample’s 3’ UMI barcode to assign back their experimental ID. Finally, differential expression (DE) analysis was performed to generate lists of DE and compare them to the CUL3, BRD4 and KEAP1 KO DE lists from the ECCITE-seq experiment.
DATA AVAILABILITY
Raw and processed sequencing data is available through the Gene Expression Omnibus (GEO accession number: GSE153056). Processed data is also available through SeuratData (https://github.com/satijalab/seurat-data) to facilitate access with a single command: InstallData(ds = “thp1.eccite”).
CODE AVAILABILITY
The code for mixscape is freely available as open source software as part of the Seurat package for single-cell analysis (www.github.com/satijalab/seurat/tree/mixscape). A vignette demonstrating the application of mixscape to this dataset is available in Supplementary Data 1, as well as an online resource (https://satijalab.org/seurat/v4.0/mixscape_vignette.html).
Extended Data
Extended Data Fig. 1. Unwanted sources of variation drive mRNA-based clustering (related to Figure 2).
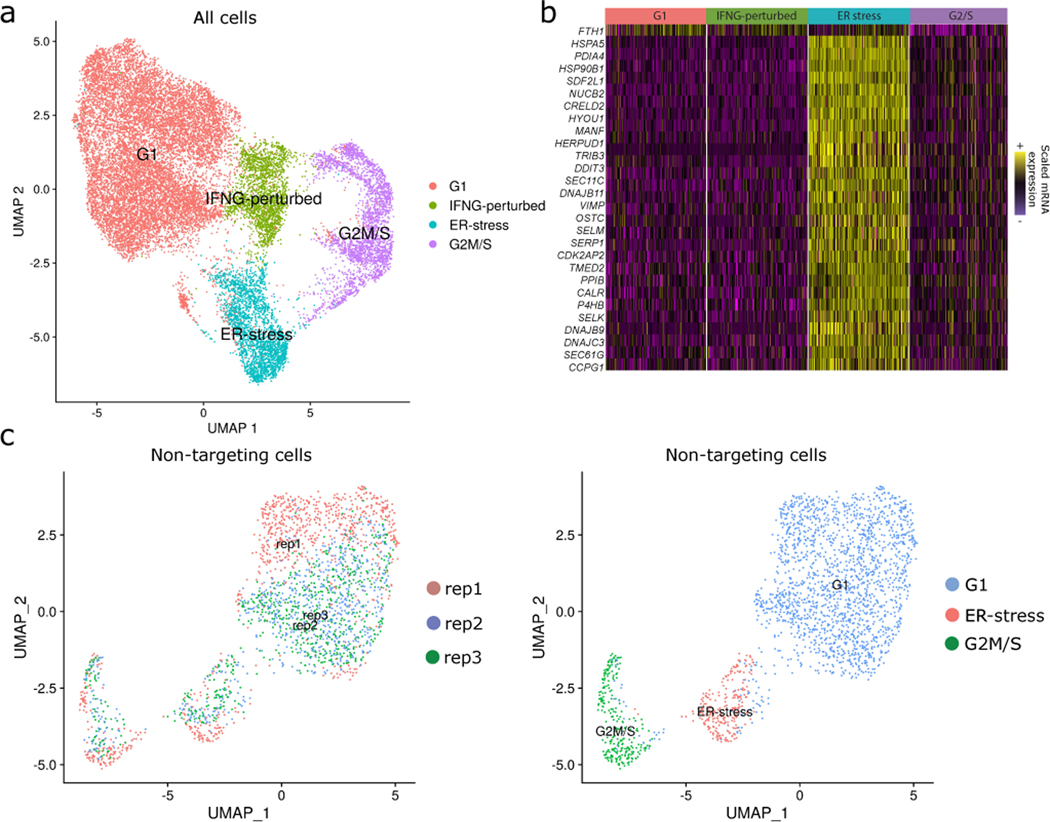
(A) UMAP visualization of the ECCITE-seq dataset based on cellular transcriptomes. Clusters are driven by different sources of variation shown in different colors (cell cycle state, CRISPR perturbation, stress). Figure is similar to Figure 2A, but with labels for the ER-stress cluster.
(B) Single-cell heatmap showing the up-regulation of a specific gene module in the ER-stress cluster. EnrichR analysis demonstrates that this gene set is enriched (adjusted p-value < 5*10−20) for ‘response to endoplasmic reticulum stress”.
(C) Similar to (A) but computed using only NT cells. This demonstrates that confounding sources of heterogeneity are present even in the absence of perturbation
Extended Data Fig. 2. Identifying optimal parameters for calculating perturbation signature.
(A)Scatterplots showing the per cell correlation of mixscape classification posterior probabilities between k =20 and k=3, k=10, k=30 and k=200.
(B) Mixscape classification agreement k=20 and all other k.
(C)Same as in (A) only this time comparing finding neighbors before and after integration. In both cases k was set to 20.
(D)Same as in (B) only this time showing classification agreement between before and after integration.
Extended Data Fig. 3. Calculating local perturbation signatures controls for unwanted sources of variation.
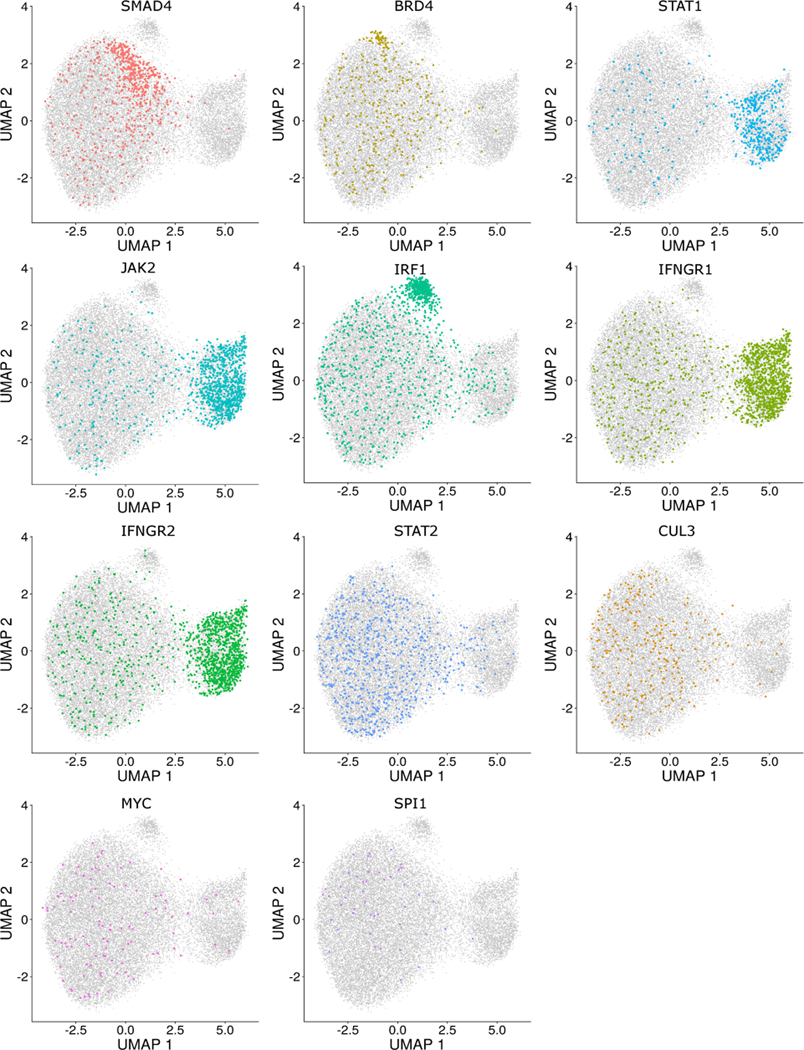
Similar to Figure 2D, but the cells from each individual perturbation are specifically highlighted. In addition to some perturbations which form specific clusters (e.g. IRF1), other perturbations (e.g. BRD4 and SMAD4) exhibit weaker evidence of sub-clustering, suggesting that improved analysis strategies would help to reveal their perturbation state.
Extended Data Fig. 4. Mixscape models targeted cells as a heterogeneous mixture.
For each cell, we calculated a perturbation score (Supplementary Methods) representing its strength of perturbation compared to the average of NT controls. We calculated this not only for targeted cells, but also for cells expressing NT gRNA in order to estimate the variance in the control population. Here, we show the distribution of perturbation scores as a function of mixscape classification (similar to Figure 3A). Dots on the x-axis represent single-cell perturbation scores and are colored to match the mixscape classifications. Non-perturbed cell densities (NP, light grey) overlap with the non-targeting control cell densities (NT, dark grey).
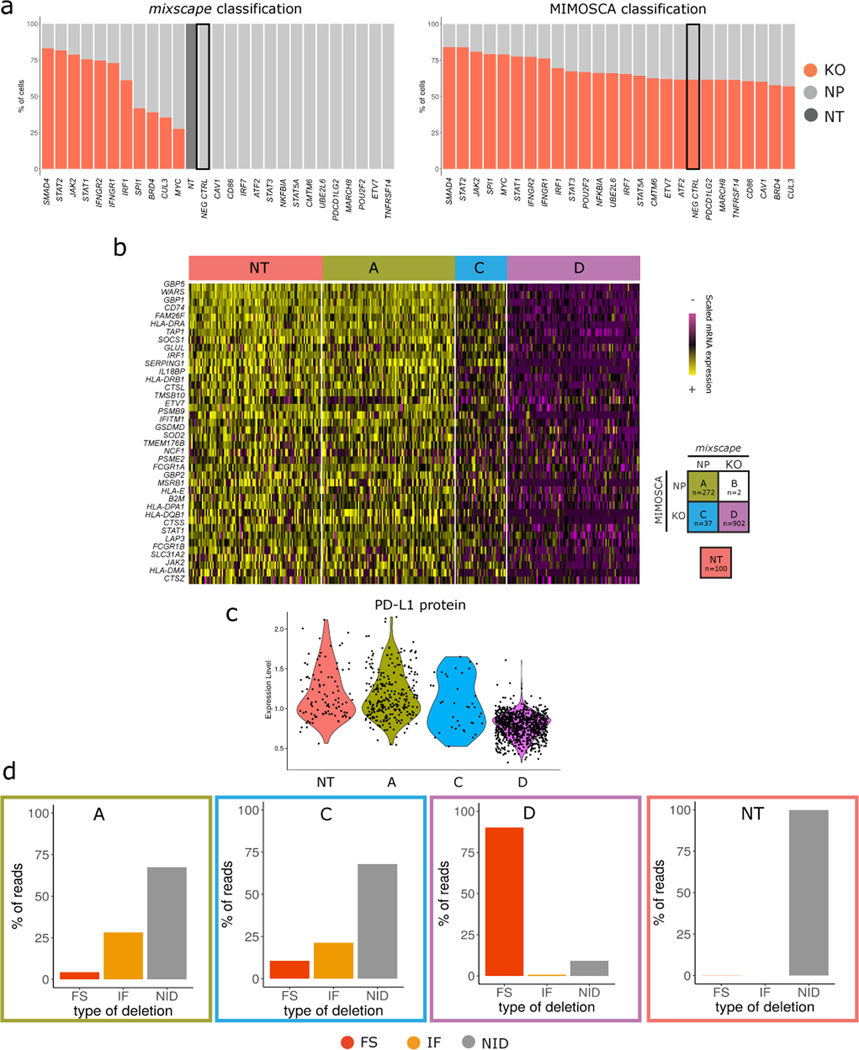
Extended Data Fig. 5. Benchmarking mixscape against MIMOSCA.
(A) Top: Barplots showing the % of KO (red) and NP (light grey) cells within each gRNA class as classified by mixscape, and MIMOSCA (Bottom). To assess the potential for overfitting, prior to running the dataset, we randomly sampled 1,000 cells expressing NT gRNA and re-labeled them as a new targeted gene class, representing a negative control (NEG CTRL, marked with a black box). Only mixscape correctly classifies all of these cells as NP.
(B) Single-cell mRNA expression heatmap with IFNGR2g2 cells being grouped by mixscape and MIMOSCA classification. Cells classified by both methods as KO (Class ‘A’) exhibit downregulation of IFNγ pathway genes, while cells classified by both methods as ND (Class ‘D’) resemble NT controls. When mixscape classifies cells as NP and MIMOSCA classifies as KO (Class C), cells resemble NT controls, suggesting that the mixscape classification is correct. Class B (2 cells total) was removed for visualization due to low cell number.
(C) Violin plots showing PD-L1 protein expression in IFNGR2g2 cells grouped by their MIMOSCA and mixscape classification (see legend in (B)). Class C cells resemble NT controls, suggesting that the mixscape classification is correct.
(D) Barplot showing the % of reads with no INDELS (grey), inframe (orange) and frameshift (red) mutations across all MIMOSCA and mixscape IFNGR2g2 cell classifications. Class C cells resemble NT controls, suggesting that the mixscape classification is correct (n==20,729 cells over 3 viral transduction replicates).
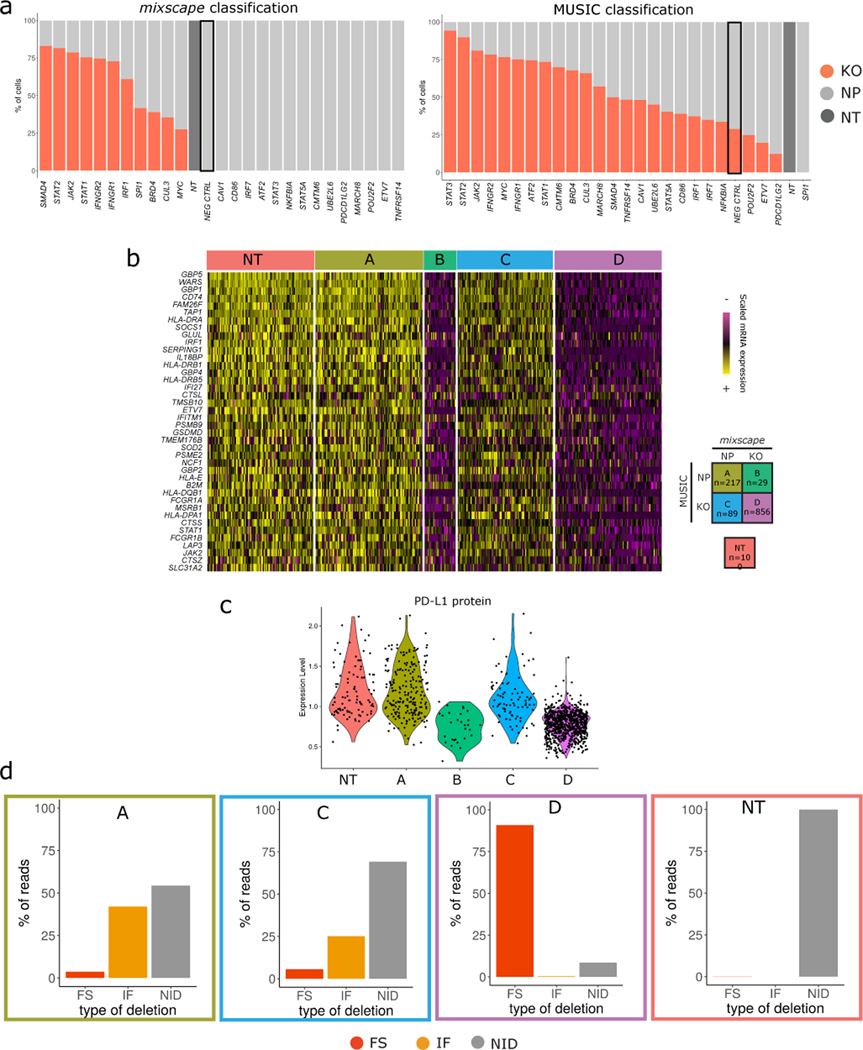
Extended Data Fig. 6. Benchmarking mixscape against MUSIC.
(A) Top: Barplots showing the % of KO (red) and NP (light grey) cells within each gRNA class as classified by mixscape, and MUSIC (Bottom). To assess the potential for overfitting, prior to running the dataset, we randomly sampled 1,000 cells expressing NT gRNA and re-labeled them as a new targeted gene class, representing a negative control (NEG CTRL, marked with a black box). Only mixscape correctly classifies all of these cells as NP.
(B) Single-cell mRNA expression heatmap with IFNGR2g2 cells being grouped by mixscape and MUSIC classification. Cells classified by both methods as KO (Class ‘A’) exhibit downregulation of IFNγ pathway genes, while cells classified by both methods as ND (Class ‘D’) resemble NT controls. When mixscape classifies cells as NP and MUSIC classifies as KO (Class C), cells resemble NT controls. When mixscape classifies cells as KO and MUSIC classifies as NP, cells exhibit evidence of perturbation. Therefore, groups B and C suggest that when the methods disagree, the mixscape classification is correct.
(C) Violin plots showing PD-L1 protein expression in IFNGR2g2 cells grouped by their MUSIC and mixscape classification. Groups B and C suggest that when the methods disagree, the mixscape classification is correct.
(D) Barplot showing the % of reads with no INDELS (grey), inframe (orange) and frameshift (red) mutations across all MUSIC and mixscape IFNGR2g2 cell classifications. Groups B and C suggest that when the methods disagree, the mixscape classification is correct (n==20,729 cells over 3 viral transduction replicates).
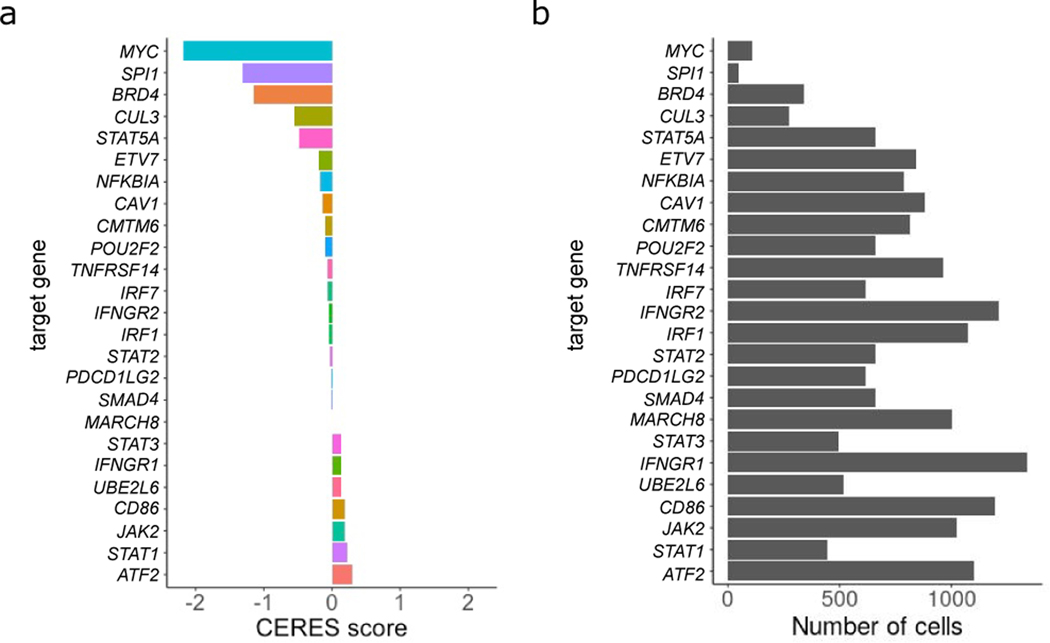
Extended Data Fig. 7. Number of detected cells in ECCITE-seq correlates with gene essentiality scores.
(A) Barplot showing the CERES scores for each target gene class generated from AVANA CRISPR screens on THP-1 cells. Low CERES scores for MYC, SPI1, BRD4 and CUL3 suggests these genes are essential for cell survival. (B) Barplot showing the number of cells recovered from each target gene class in the ECCITE-seq experiment. For target genes with low CERES scores we only recover a small number of cells most likely due to decreased survival of KO cells (n==20,729 cells over 3 viral transduction replicates).
Extended Data Fig. 8. Bulk RNA-seq on single gRNA KO samples validates ECCITE-seq findings.
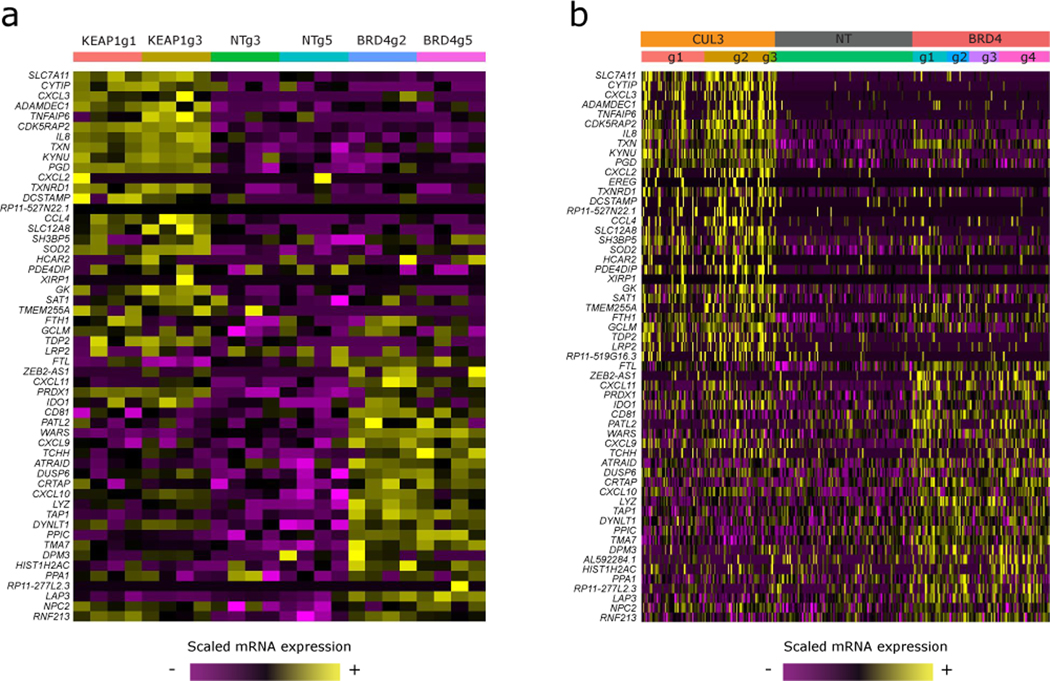
(A) Heatmap showing expression of CUL3 and BRD4 KO signature genes as identified by ECCITE-seq DE on bulk RNA-seq samples. (B) Same as in (A) only this time showing the CUL3 and BRD4 KO cells from the ECCITE-seq experiment. Cells are split into groups based on their gRNA ID.
Extended Data Fig. 9. CUL3 KO cells have a unique transcriptomic signature.
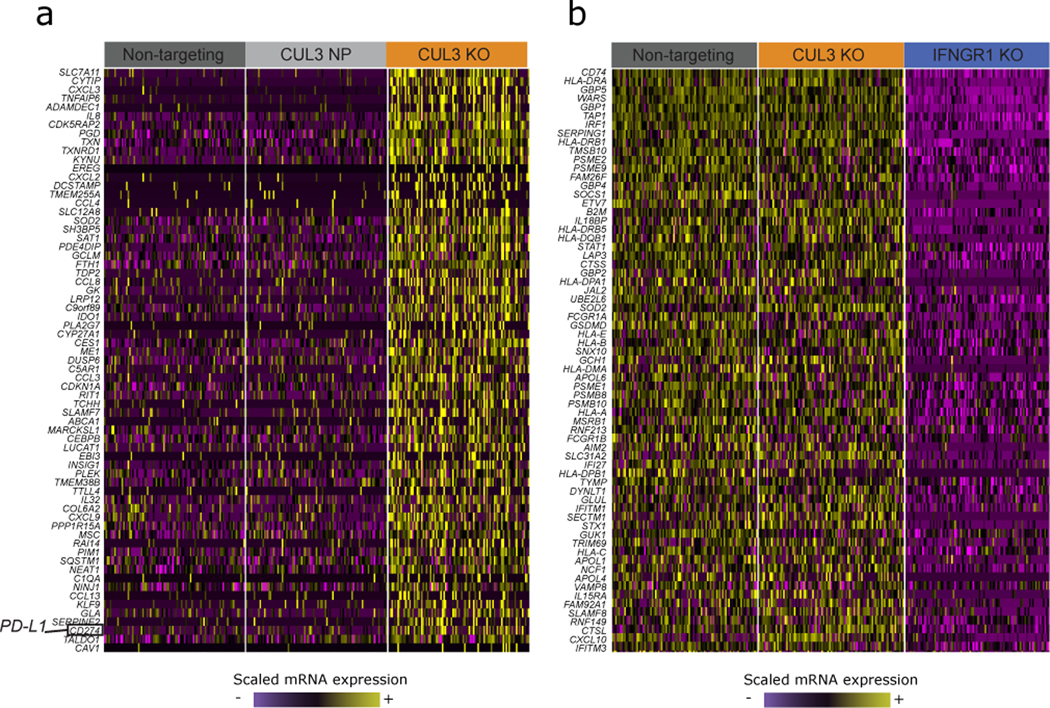
(A)Single-cell mRNA expression heatmap showing that CUL3 KO cells upregulate a module of genes in comparison to NT and CUL3 NP cells (including the PD-L1 transcript (CD274), highlighted on the heatmap).(B) Single-cell mRNA expression heatmap showing that the CUL3 transcriptomic signature is not IFNγ-related, suggesting CUL3 is acting through an alternative pathway to regulate PD-L1 at the transcriptional level. For both (B) and (C) heatmaps, lists of genes were obtained using FindMarkers() function in Seurat (Wilcoxon Rank sum test). mRNA counts are log-normalized and scaled (z-score).
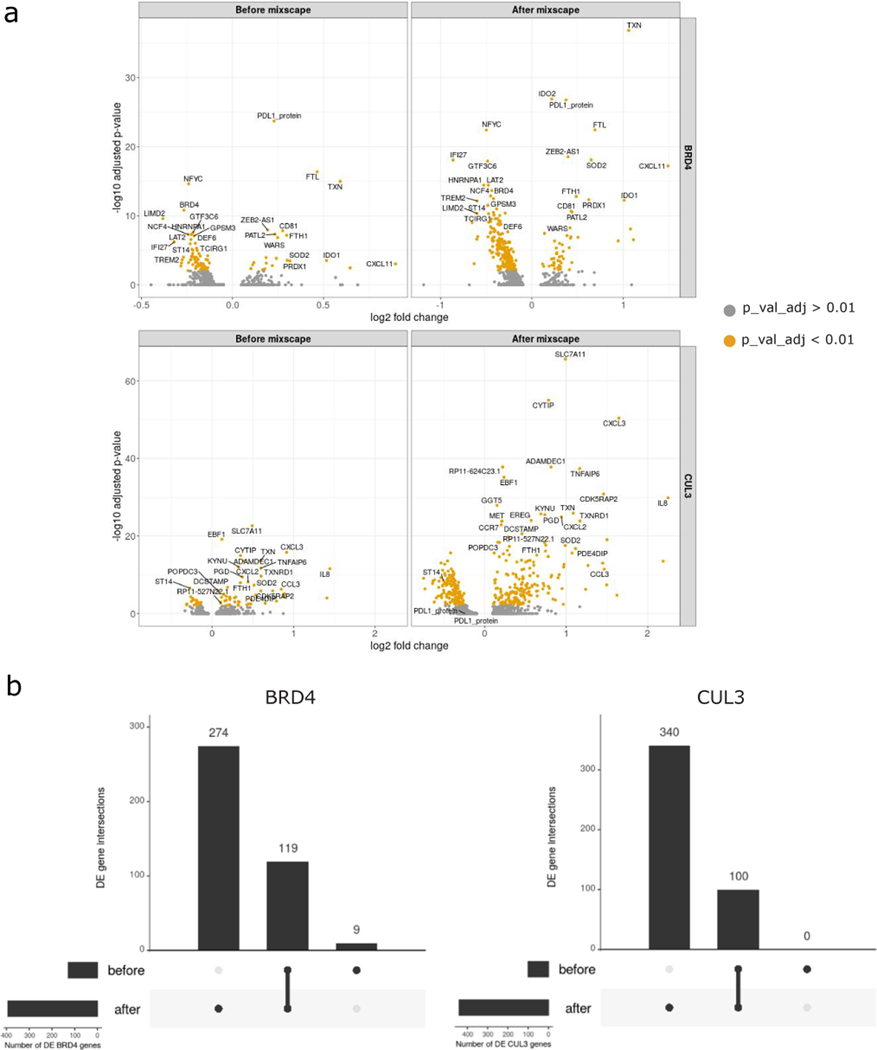
Extended Data Fig. 10. Mixscape increases the signal to noise ratio by removing “escaping” cells.
(A) Volcano plots showing DE genes before and after mixscape classification for BRD4 and CUL3 KO cells.(B) UpSet plot showing the intersection between DE genes from before and after mixscape classification.
Supplementary Material
ACKNOWLEDGEMENTS
We acknowledge Ross Levine, Thales Papagiannakopoulos, and members of the Satija and Technology Innovation Labs at NYGC for general discussion, Patrick Roelli for assistance with pre-processing, and Neil Bapodra and Neville Sanjana for advice on vector and library design. This work was supported by the Chan Zuckerberg Initiative (EOSS-0000000082 to RS, HCA-A-1704–01895 to PS and RS), and the National Institutes of Health (DP2HG009623–01 to RS, RM1HG011014–01 to PS and RS, R21HG009748–03 to PS).
Footnotes
COMPETING INTERESTS STATEMENT
In the past three years, RS has worked as a consultant for Bristol-Myers Squibb, Regeneron, and Kallyope, and served as an SAB member for ImmunAI and Apollo Life Sciences GmbH. PS is a co-inventor of a patent related to this work. BZY is an employee at BioLegend Inc., which is the exclusive licensee of the New York Genome Center patent application related to this work.
REFERENCES
- 1.Greenwald RJ, Freeman GJ, Sharpe AH. The B7 family revisited. Annu Rev Immunol. 2005;23: 515–548. [DOI] [PubMed] [Google Scholar]
- 2.Pardoll DM. The blockade of immune checkpoints in cancer immunotherapy. Nat Rev Cancer. 2012;12: 252–264. [DOI] [PMC free article] [PubMed] [Google Scholar]
- 3.Dong H, Strome SE, Salomao DR, Tamura H, Hirano F, Flies DB, et al. Tumor-associated B7-H1 promotes T-cell apoptosis: A potential mechanism of immune evasion. Nat Med. 2002. doi: 10.1038/nm730 [DOI] [PubMed] [Google Scholar]
- 4.Zou W, Chen L. Inhibitory B7-family molecules in the tumour microenvironment. Nat Rev Immunol. 2008;8: 467–477. [DOI] [PubMed] [Google Scholar]
- 5.Freeman GJ, Long AJ, Iwai Y, Bourque K, Chernova T, Nishimura H, et al. Engagement of the PD-1 immunoinhibitory receptor by a novel B7 family member leads to negative regulation of lymphocyte activation. J Exp Med. 2000;192: 1027–1034. [DOI] [PMC free article] [PubMed] [Google Scholar]
- 6.Wang X, Teng F, Kong L, Yu J. PD-L1 expression in human cancers and its association with clinical outcomes. Onco Targets Ther. 2016;9: 5023–5039. [DOI] [PMC free article] [PubMed] [Google Scholar]
- 7.Chen J, Feng Y, Lu L, Wang H, Dai L, Li Y, et al. Interferon-gamma induced PD-L1 surface expression on human oral squamous carcinoma via PKD2 signal pathway. Immunobiology. 2012;217: 385–393. [DOI] [PubMed] [Google Scholar]
- 8.Abiko K, Matsumura N, Hamanishi J, Horikawa N, Murakami R, Yamaguchi K, et al. IFN-γ from lymphocytes induces PD-L1 expression and promotes progression of ovarian cancer. Br J Cancer. 2015;112: 1501–1509. [DOI] [PMC free article] [PubMed] [Google Scholar]
- 9.Moon JW, Kong SK, Kim BS, Kim HJ, Lim H, Noh K, et al. IFNγ induces PD-L1 overexpression by JAK2/STAT1/IRF-1 signaling in EBV-positive gastric carcinoma. Sci Rep. 2017. doi: 10.1038/s41598-017-18132-0 [DOI] [PMC free article] [PubMed] [Google Scholar]
- 10.Bellucci R, Martin A, Bommarito D, Wang K, Hansen SH, Freeman GJ, et al. Interferon-γ-induced activation of JAK1 and JAK2 suppresses tumor cell susceptibility to NK cells through upregulation of PD-L1 expression. Oncoimmunology. 2015;4: e1008824. [DOI] [PMC free article] [PubMed] [Google Scholar]
- 11.Garcia-Diaz A, Shin DS, Moreno BH, Saco J, Escuin-Ordinas H, Rodriguez GA, et al. Interferon Receptor Signaling Pathways Regulating PD-L1 and PD-L2 Expression. Cell Rep. 2017;19: 1189–1201. [DOI] [PMC free article] [PubMed] [Google Scholar]
- 12.Zou J, Zhuang M, Yu X, Li N, Mao R, Wang Z, et al. MYC inhibition increases PD-L1 expression induced by IFN-γ in hepatocellular carcinoma cells. Mol Immunol. 2018;101: 203–209. [DOI] [PubMed] [Google Scholar]
- 13.Hogg SJ, Vervoort SJ, Deswal S, Ott CJ, Li J, Cluse LA, et al. BET-Bromodomain Inhibitors Engage the Host Immune System and Regulate Expression of the Immune Checkpoint Ligand PD-L1. Cell Rep. 2017;18: 2162–2174. [DOI] [PMC free article] [PubMed] [Google Scholar]
- 14.Zhu B, Tang L, Chen S, Yin C, Peng S, Li X, et al. Targeting the upstream transcriptional activator of PD-L1 as an alternative strategy in melanoma therapy. Oncogene. 2018;37: 4941–4954. [DOI] [PubMed] [Google Scholar]
- 15.Zhang J, Bu X, Wang H, Zhu Y, Geng Y, Nihira NT, et al. Cyclin D-CDK4 kinase destabilizes PD-L1 via cullin 3-SPOP to control cancer immune surveillance. Nature. 2018;553: 91–95. [DOI] [PMC free article] [PubMed] [Google Scholar]
- 16.Burr ML, Sparbier CE, Chan Y-C, Williamson JC, Woods K, Beavis PA, et al. CMTM6 maintains the expression of PD-L1 and regulates anti-tumour immunity. Nature. 2017. doi: 10.1038/nature23643 [DOI] [PMC free article] [PubMed] [Google Scholar]
- 17.Mezzadra R, Sun C, Jae LT, Gomez-Eerland R, De Vries E, Wu W, et al. Identification of CMTM6 and CMTM4 as PD-L1 protein regulators. Nature. 2017. doi: 10.1038/nature23669 [DOI] [PMC free article] [PubMed] [Google Scholar]
- 18.Mimitou EP, Cheng A, Montalbano A, Hao S, Stoeckius M, Legut M, et al. Multiplexed detection of proteins, transcriptomes, clonotypes and CRISPR perturbations in single cells. Nat Methods. 2019;16: 409–412. [DOI] [PMC free article] [PubMed] [Google Scholar]
- 19.Dixit A, Parnas O, Li B, Chen J, Fulco CP, Jerby-Arnon L, et al. Perturb-Seq: Dissecting Molecular Circuits with Scalable Single-Cell RNA Profiling of Pooled Genetic Screens. Cell. 2016;167: 1853–1866.e17. [DOI] [PMC free article] [PubMed] [Google Scholar]
- 20.Datlinger P, Rendeiro AF, Schmidl C, Krausgruber T, Traxler P, Klughammer J, et al. Pooled CRISPR screening with single-cell transcriptome readout. Nat Methods. 2017;14: 297–301. [DOI] [PMC free article] [PubMed] [Google Scholar]
- 21.Jaitin DA, Weiner A, Yofe I, Lara-Astiaso D, Keren-Shaul H, David E, et al. Dissecting Immune Circuits by Linking CRISPR-Pooled Screens with Single-Cell RNA-Seq. Cell. 2016. doi: 10.1016/j.cell.2016.11.039 [DOI] [PubMed] [Google Scholar]
- 22.Stoeckius M, Hafemeister C, Stephenson W, Houck-Loomis B, Chattopadhyay PK, Swerdlow H, et al. Simultaneous epitope and transcriptome measurement in single cells. Nat Methods. 2017. doi: 10.1038/nmeth.4380 [DOI] [PMC free article] [PubMed] [Google Scholar]
- 23.Hast BE, Cloer EW, Goldfarb D, Li H, Siesser PF, Yan F, et al. Cancer-derived mutations in KEAP1 impair NRF2 degradation but not ubiquitination. Cancer Res. 2014;74: 808–817. [DOI] [PMC free article] [PubMed] [Google Scholar]
- 24.Postow MA, Callahan MK, Wolchok JD. Immune Checkpoint Blockade in Cancer Therapy. J Clin Oncol. 2015;33: 1974–1982. [DOI] [PMC free article] [PubMed] [Google Scholar]
- 25.Stoeckius M, Zheng S, Houck-Loomis B, Hao S, Yeung BZ, Mauck WM, et al. Cell Hashing with barcoded antibodies enables multiplexing and doublet detection for single cell genomics. Genome Biol. 2018. doi: 10.1186/s13059-018-1603-1 [DOI] [PMC free article] [PubMed] [Google Scholar]
- 26.Duan B, Zhou C, Zhu C, Yu Y, Li G, Zhang S, et al. Model-based understanding of single-cell CRISPR screening. Nat Commun. 2019;10: 2233. [DOI] [PMC free article] [PubMed] [Google Scholar]
- 27.Hastie T, Tibshirani R. Discriminant Analysis by Gaussian Mixtures. J R Stat Soc Series B Stat Methodol. 1996;58: 155–176. [Google Scholar]
- 28.Stuart T, Butler A, Hoffman P, Hafemeister C, Papalexi E, Mauck WM 3rd, et al. Comprehensive Integration of Single-Cell Data. Cell. 2019;177: 1888–1902.e21. [DOI] [PMC free article] [PubMed] [Google Scholar]
- 29.Zhu H, Bengsch F, Svoronos N, Rutkowski MR, Bitler BG, Allegrezza MJ, et al. BET Bromodomain Inhibition Promotes Anti-tumor Immunity by Suppressing PD-L1 Expression. Cell Rep. 2016;16: 2829–2837. [DOI] [PMC free article] [PubMed] [Google Scholar]
- 30.Nguyen T, Nioi P, Pickett CB. The Nrf2-Antioxidant Response Element Signaling Pathway and Its Activation by Oxidative Stress. Journal of Biological Chemistry. 2009. pp. 13291–13295. doi: 10.1074/jbc.r900010200 [DOI] [PMC free article] [PubMed] [Google Scholar]
- 31.Cullinan SB, Gordan JD, Jin J, Harper JW, Diehl JA. The Keap1-BTB protein is an adaptor that bridges Nrf2 to a Cul3-based E3 ligase: oxidative stress sensing by a Cul3-Keap1 ligase. Mol Cell Biol. 2004;24: 8477–8486. [DOI] [PMC free article] [PubMed] [Google Scholar]
- 32.Taguchi K, Yamamoto M. The KEAP1–NRF2 System in Cancer. Front Oncol. 2017;7: 85. [DOI] [PMC free article] [PubMed] [Google Scholar]
- 33.Argelaguet R, Arnol D, Bredikhin D, Deloro Y, Velten B, Marioni JC, et al. MOFA : a statistical framework for comprehensive integration of multi-modal single-cell data. Genome Biology. 2020. doi: 10.1186/s13059-020-02015-1 [DOI] [PMC free article] [PubMed] [Google Scholar]
- 34.Cao J, Cusanovich DA, Ramani V, Aghamirzaie D, Pliner HA, Hill AJ, et al. Joint profiling of chromatin accessibility and gene expression in thousands of single cells. Science. 2018;361: 1380–1385. [DOI] [PMC free article] [PubMed] [Google Scholar]
- 35.Clark SJ, Argelaguet R, Kapourani C-A, Stubbs TM, Lee HJ, Alda-Catalinas C, et al. scNMT-seq enables joint profiling of chromatin accessibility DNA methylation and transcription in single cells. Nat Commun. 2018;9: 781. [DOI] [PMC free article] [PubMed] [Google Scholar]
- 36.Rubin AJ, Parker KR, Satpathy AT, Qi Y, Wu B, Ong AJ, et al. Coupled Single-Cell CRISPR Screening and Epigenomic Profiling Reveals Causal Gene Regulatory Networks. Cell. 2019;176: 361–376.e17. [DOI] [PMC free article] [PubMed] [Google Scholar]
- 37.Chen S, Lake BB, Zhang K. High-throughput sequencing of the transcriptome and chromatin accessibility in the same cell. Nat Biotechnol. 2019;37: 1452–1457. [DOI] [PMC free article] [PubMed] [Google Scholar]
METHODS-ONLY REFERENCES
- 38.Ashland OR: Becton, Dickinson and Company. FlowJo TM Software, Version 10.6.2. 2020. [Google Scholar]
- 39.Butler A, Hoffman P, Smibert P, Papalexi E, Satija R. Integrating single-cell transcriptomic data across different conditions, technologies, and species. Nat Biotechnol. 2018;36: 411–420. [DOI] [PMC free article] [PubMed] [Google Scholar]
- 40.Dang Y, Jia G, Choi J, Ma H, Anaya E, Ye C, et al. Optimizing sgRNA structure to improve CRISPR-Cas9 knockout efficiency. Genome Biol. 2015;16: 280. [DOI] [PMC free article] [PubMed] [Google Scholar]
- 41.Meier JA, Zhang F, Sanjana NE. GUIDES: sgRNA design for loss-of-function screens. Nat Methods. 2017. doi: 10.1038/nmeth.4423 [DOI] [PMC free article] [PubMed] [Google Scholar]
- 42.Ran FA, Hsu PD, Wright J, Agarwala V, Scott DA, Zhang F. Genome engineering using the CRISPR-Cas9 system. Nat Protoc. 2013;8: 2281–2308. [DOI] [PMC free article] [PubMed] [Google Scholar]
- 43.Brinkman EK, van Steensel B. Rapid Quantitative Evaluation of CRISPR Genome Editing by TIDE and TIDER. Methods Mol Biol. 2019;1961: 29–44. [DOI] [PubMed] [Google Scholar]
- 44.McGinnis CS, Patterson DM, Winkler J, Conrad DN, Hein MY, Srivastava V, et al. MULTI-seq: sample multiplexing for single-cell RNA sequencing using lipid-tagged indices. Nat Methods. 2019;16: 619–626. [DOI] [PMC free article] [PubMed] [Google Scholar]
- 45.McInnes L, Healy J, Melville J. UMAP: Uniform Manifold Approximation and Projection for Dimension Reduction. arXiv [stat.ML]. 2018. Available: http://arxiv.org/abs/1802.03426 [Google Scholar]
- 46.Li H, Handsaker B, Wysoker A, Fennell T, Ruan J, Homer N, et al. The Sequence Alignment/Map format and SAMtools. Bioinformatics. 2009;25: 2078–2079. [DOI] [PMC free article] [PubMed] [Google Scholar]
- 47.Robinson JT, Thorvaldsdóttir H, Winckler W, Guttman M, Lander ES, Getz G, et al. Integrative genomics viewer. Nat Biotechnol. 2011;29: 24–26. [DOI] [PMC free article] [PubMed] [Google Scholar]
- 48.Chen EY, Tan CM, Kou Y, Duan Q, Wang Z, Meirelles GV, et al. Enrichr: interactive and collaborative HTML5 gene list enrichment analysis tool. BMC Bioinformatics. 2013;14: 128. [DOI] [PMC free article] [PubMed] [Google Scholar]
- 49.Kuleshov MV, Jones MR, Rouillard AD, Fernandez NF, Duan Q, Wang Z, et al. Enrichr: a comprehensive gene set enrichment analysis web server 2016 update. Nucleic Acids Res. 2016;44: W90–7. [DOI] [PMC free article] [PubMed] [Google Scholar]
- 50.Yau EH, Rana TM. Next-Generation Sequencing of Genome-Wide CRISPR Screens. Methods Mol Biol. 2018;1712: 203–216. [DOI] [PMC free article] [PubMed] [Google Scholar]
- 51.Langmead B, Salzberg SL. Fast gapped-read alignment with Bowtie 2. Nat Methods. 2012;9: 357–359. [DOI] [PMC free article] [PubMed] [Google Scholar]
- 52.De Boer CG, Ray JP, Hacohen N, Regev A. MAUDE: Inferring expression changes in sorting-based CRISPR screens. BioRxiv. 2019. Available: https://www.biorxiv.org/content/10.1101/819649v1.abstract [DOI] [PMC free article] [PubMed] [Google Scholar]
- 53.Satija R. Barcoded Plate-Based Single Cell RNA-seq v1. protocols.io. doi: 10.17504/protocols.io.nkgdctw [DOI] [Google Scholar]
Associated Data
This section collects any data citations, data availability statements, or supplementary materials included in this article.
Supplementary Materials
Data Availability Statement
Raw and processed sequencing data is available through the Gene Expression Omnibus (GEO accession number: GSE153056). Processed data is also available through SeuratData (https://github.com/satijalab/seurat-data) to facilitate access with a single command: InstallData(ds = “thp1.eccite”).


