

Abstract
The Orphan Drug Act of 1983 provides benefits to promote the development of treatments for rare diseases that have limited sales potential. Policy makers have questioned whether this purpose is furthered in the case of “partial orphan drugs” approved to treat both rare and common diseases, as many of these drugs are top sellers. In this study, we used national commercial claims data to estimate the proportion of spending in the US on fifteen top-selling partial orphan drugs that was assigned to orphan indications in 2018. Of this spending, 21.4 percent was assigned to orphan indications, 70.7 percent to nonorphan indications, and 7.9 percent to neither orphan nor nonorphan indications (for example, off-label use). These findings support growing concerns regarding the costs of granting orphan drug benefits to the sponsors of top-selling partial orphan drugs.
In 2017, 25 percent of US prescription drug spending was for orphan drugs, defined as drugs with at least one orphan indication approved by the Food and Drug Administration (FDA) to treat rare diseases.1 Although most orphan drugs only have orphan indications, approximately one-fifth are also approved by the FDA for nonorphan indications to treat common diseases (“partial orphan drugs”).2,3 In both cases, sponsors are entitled to the same benefits under the Orphan Drug Act of 1983, including tax credits for clinical testing and a seven-year period of orphan drug exclusivity during which competitors cannot market the same drug for the same indication.1
The purpose of these benefits is to promote the development of rare disease treatments that otherwise might not be brought to market because of limited sales potential. Paradoxically, however, many partial orphan drugs have blockbuster sales. In 2018, partial orphan drugs accounted for five of the six top-selling drugs in the US, including the top-selling drug, adalimumab, at $13.7 billion in sales.4 On the basis of these outsized sales, some policy makers have questioned whether the sponsors of partial orphan drugs are profiting from orphan drug benefits in a manner that is discordant with their purpose.5–7 The degree of discordance may be particularly pronounced for partial orphan drugs that were initially approved for rare diseases and later obtained approvals for common diseases. Sponsors of these “orphan first” drugs can often set high launch prices because of orphan drug exclusivity and the lack of competition in small-revenue rare disease markets.8 These high prices might transfer to subsequent approvals in common disease markets because US drug prices vary little by indication.9,10 Moreover, orphan approvals are often based on a lower level of evidence for efficacy and safety compared with nonorphan approvals.11 As a result of these dynamics, sponsors of novel drugs with several potential uses are incentivized to first seek approval for a rare disease before seeking approval for a common disease.12 Concerns regarding price transfers may be less applicable to “nonorphan-first” drugs initially approved as common disease treatments, as prices are set in markets in which competition may be more robust.
To inform debates regarding the justifiability of orphan drug benefits for partial orphan drugs, it is important to determine the proportion of spending on these drugs that is for orphan indications. To our knowledge, however, no peer-reviewed estimates of this proportion exist. In this study, we used national 2018 commercial claims to estimate this proportion for fifteen top-selling partial orphan drugs, both overall and among orphan-first versus nonorphan-first drugs. We focused on top-selling partial orphan drugs because the justifiability of their orphan drug benefits has been the subject of the most debate among policy makers.5
Study Data And Methods
Data Sources
We conducted a cross-sectional analysis of the 2017–18 IBM MarketScan Commercial Database, which includes claims from 28 million nonelderly patients across the US with employer-sponsored insurance coverage from medium to large firms.13 Data elements included International Statistical Classification of Diseases and Related Health Problems, Tenth Revision, Clinical Modification (ICD-10-CM) diagnosis codes; Current Procedural Terminology (CPT) codes; Healthcare Common Procedure Coding System (HCPCS) codes; national drug codes; and spending. In our database, spending equals out-of-pocket spending plus insurer reimbursement, but does not reflect rebates paid by drug sponsors to pharmacy benefit managers or payers. We used 2018 as the year of analysis and 2017 as a look-back period for diagnosis codes.
To obtain information on FDA-approved orphan and nonorphan indications, we searched the FDA Orphan Drug Database and drug labels on the FDA website. Searches were conducted between January and March 2020.14–16 Because we used publicly available or limited data sets, the Institutional Review Board of the University of Michigan Medical School exempted this study from review; informed consent was not required.
Study Population
We included patients ages 0–64 who were continuously enrolled with pharmacy benefits throughout 2017 and 2018. We excluded patients enrolled in plans that reimburse via capitation, as capitated claims may not reliably report spending.
Identification Of Fifteen Top-Selling Partial Orphan Drugs
Using the FDA Orphan Drug Database, we identified 768 orphan indications approved as of December 31, 2018, and mapped these indications to one of 526 orphan drugs. For each drug, we used national drug codes to capture claims for prescriptions dispensed at retail or mail-order pharmacies. These codes were compiled by searching product names in the IBM Micromedex Red Book.17 In addition, we used CPT and HCPCS codes to capture claims for drug administrations during outpatient visits. These codes were compiled by searching code directories and reimbursement guides from manufacturers and payers. The online appendix includes code lists and additional details on methodology.18
Among the 526 orphan drugs, 405 had at least one pharmacy or drug administration claim in our analysis. We summed spending across all pharmacy and drug administration claims for each of these 405 orphan drugs. For drug administration claims, we only included spending for the drug itself, not spending for the associated health care visit. We sorted drugs by descending spending and serially classified drugs as partial orphan drugs according to whether they had at least one nonorphan indication as of December 31, 2018 (defined as an indication on a drug label but not in the FDA Orphan Drug Database).14,15 We stopped classification once we identified the fifteen top-selling partial orphan drugs.
We classified the fifteen drugs as “orphan first” if the first orphan indication was approved before the first nonorphan indication and “nonorphan first” if the first nonorphan indication was approved before the first orphan indication (see appendix for details).18
Assigning Claims To Indications
We assigned claims for the fifteen drugs to one of three categories. Claims were assigned to an orphan indication if patients had an ICD-10-CM diagnosis code corresponding to the orphan indication on at least one inpatient, outpatient, or facility claim during a look-back period that began January 1, 2017, and ended on the date of the orphan drug claim and if patients belonged to the age group for which the orphan indication was approved.14,15 For eight orphan indications for which marketing exclusivity began during 2018, we required the date of the orphan drug claim to occur on or after the date on which exclusivity began.
Claims were assigned to a nonorphan indication if there was at least one claim with a corresponding diagnosis code in the look-back period and if any age or date criteria were met. For some claims, the look-back period contained diagnosis codes for both orphan and nonorphan indications (for example, patients with both a rare and a common disease for which a drug is approved). We erred on the side of assuming orphan use by assigning these claims to orphan indications. In a sensitivity analysis, we assigned these claims to nonorphan indications.
Claims assigned to neither orphan nor nonorphan indications were categorized as “unassigned.” These claims could represent off-label use versus orphan or nonorphan use that was not captured by our diagnosis codes.19 As with procedure codes, we compiled diagnosis codes by searching code directories and reimbursement guides from manufacturers and payers (see appendix for details on methodology and a list of diagnosis codes and age criteria for the orphan and nonorphan indications of the fifteen drugs).18
Statistical Analysis
To characterize orphan drug users, we used descriptive statistics to describe patients with at least one orphan drug claim in 2018. For each of the fifteen drugs, we determined spending totals, the number of orphan and nonorphan indications approved by the end of 2018, and the patient populations corresponding to these indications. Furthermore, for each drug, we calculated the proportion of spending assigned to orphan indications, the proportion assigned to nonorphan indications, and the proportion that was for unassigned claims. We repeated these analyses in aggregate across the fifteen drugs and among drugs that were orphan first versus nonorphan first. Our analyses used SAS, version 9.4.
Sensitivity Analyses
In an additional sensitivity analysis, we defined the look-back period as 365 days before the orphan drug claim to the date of the claim, thus ensuring a consistent look-back period for each claim. To assess whether results change substantially when considering use rather than spending, we calculated the proportion of orphan drug claims that were assigned to orphan indications, assigned to nonorphan indications, and unassigned.
Limitations
Our study has several strengths, including the use of recent national data. In contrast to prior claims-based studies that assessed use of a limited number of orphan drugs, using pharmacy claims,20 we used both pharmacy and drug administration claims to assess use of 526 orphan drugs. We provide the codes used to identify these claims in the appendix to facilitate replication and use.18
Our study also has limitations. First, we could not assess spending for orphan indications among all partial orphan drugs. We could not confidently identify all partial orphan drugs because of incomplete information on approvals on the FDA website, a barrier that also impeded prior analyses of orphan drugs.5,21 The fifteen partial orphan drugs in our study may be top-selling drugs because they are broadly used for common diseases. If this is not true of partial orphan drugs with lower sales, the proportion of spending for orphan indications among all partial orphan drugs may be lower than what we report. Second, our findings may not generalize to patients covered by Medicaid or Medicare. In February 2020, the Office of Inspector General announced it will analyze Medicare claims to estimate the proportion of spending for high-expenditure orphan drugs that is assigned to orphan indications.22 It will be important to compare results from our analysis and this Medicare analysis, which is expected to be released in 2021. For partial orphan drugs in our analysis that have nonorphan indications to treat common cancers, such as bevacizumab and nivolumab, the Medicare analysis may report a lower proportion of spending for orphan indications, as cancer is more prevalent in the elderly than the nonelderly.
Third, we did not assess the benefits of the orphan uses of partial orphan drugs or conduct a cost-effectiveness analysis. One study suggested that orphan drugs typically confer greater benefit than nonorphan drugs but are less cost-effective because of their high prices.23 Similar studies should be conducted specifically for partial orphan drugs, given their outsized budgetary impacts.
Fourth, if diagnosis codes for orphan and nonorphan indications do not exist or were not coded, or if we failed to include relevant diagnosis codes, spending for orphan and nonorphan indications would be underestimated. However, any underestimation is likely small. As discussed below, just 7.9 percent of spending on the fifteen drugs was not assigned to orphan or nonorphan indications. Some of this spending likely represents off-label use as opposed to orphan or nonorphan use that was not captured by our algorithms, as off-label use of orphan drugs is common.19
Fifth, analyses did not include inpatient orphan drug administration events, which are not well-captured in claims in part because of bundled hospitalization reimbursement policies. Sixth, our database lacked information on rebates paid by orphan drug sponsors to pharmacy benefit managers or payers. However, we have no reason to suspect that the magnitude of rebates would have varied on the basis of whether drugs were used for orphan versus nonorphan indications.
Finally, our analysis did not differentiate between spending for older orphan indications and spending for indications that were recently approved (and therefore might have lower use). However, of the forty-eight orphan indications for the fifteen partial orphan drugs in our study, thirty-three had been approved by the end of 2016, suggesting that most orphan indications had been established for at least one year by the time our study period began in 2018.
Study Results
Study Population Characteristics
Among 13,300,118 patients ages 0–64 who were continuously insured with pharmacy benefit coverage throughout 2017 and 2018, we excluded 478,205 (3.6 percent) because they had at least one capitated claim in 2018, leaving 12,821,913 patients. Of these patients, 301,329 (2.4 percent) had at least one claim in 2018 for one of the 405 orphan drugs.
Among these 301,329 patients, 93.8 percent were adults (mean age, 46.6 years) and 6.2 percent were children ages 0–17. Most patients were female (61.5 percent). Almost half (45.4 percent) lived in the South compared with 20.7 percent in the Midwest, 19.3 percent in the Northeast, 14.3 percent in the West, and 0.2 percent in an unknown census region.
Orphan Drug Use And Spending
These 301,329 patients had 1,907,534 orphan drug claims. Of these claims, 1,130,517 (59.3 percent) were pharmacy claims and 777,017 (40.7 percent) were drug administration claims. These 1,907,534 claims were for 405 unique orphan drugs and accounted for $7.34 billion in spending.
Fifteen Top-Selling Partial Orphan Drugs
The fifteen top-selling partial orphan drugs accounted for 705,866 (37.0 percent) of the 1,907,534 orphan drug claims and $3.84 billion (52.3 percent) of the $7.34 billion spent on all 405 orphan drugs. These partial orphan drugs represented the six top-selling orphan drugs and fifteen of the twenty top-selling orphan drugs.
As shown in exhibit 1, the median number of orphan and nonorphan indications among the fifteen drugs was three and four, respectively. Of the fifteen drugs, seven were orphan first and eight were nonorphan first. Each of the drugs had become partial orphan drugs by the end of 2015. The orphan and nonorphan indications of the fifteen drugs are listed in the appendix.18 Many of these orphan and nonorphan indications targeted cancer or autoimmune diseases.
Exhibit 1:
Characteristics of the fifteen top-selling partial orphan drugs among privately insured nonelderly patients in the US
| Generic name (trade name) | No. of orphan indicationsa | No. of nonorphan indicationsb | Date of first approved orphan indication | Date of first approved nonorphan indication | Orphan first?c |
|---|---|---|---|---|---|
| Adalimumab (Humira) | 7 | 6 | February 21, 2008 | December 31, 2002 | No |
| Infliximab (Remicade) | 3 | 5 | August 24, 1998 | November 10, 1999 | Yes |
| Etanercept (Enbrel) | 1 | 4 | May 27, 1999 | November 2, 1998 | No |
| Pegfilgrastim (Neulasta) | 1 | 1 | November 13, 2015 | January 31, 2002 | No |
| Trastuzumab (Herceptin) | 1 | 2 | October 20, 2010 | September 25, 1998 | No |
| Rituximab (Rituxan) | 4 | 1 | November 26, 1997 | February 10, 2006 | Yes |
| Bevacizumab (Avastin) | 5 | 3 | May 5, 2009 | February 26, 2004 | No |
| Nivolumab (Opdivo) | 7 | 5 | December 22, 2014 | March 4, 2015 | Yes |
| Pembrolizumab (Keytruda) | 7 | 5 | September 4, 2014 | October 2, 2015 | Yes |
| Immune globulin injection (Gamunex-C) | 1 | 2 | September 12, 2008 | August 27, 2003 | No |
| Immune globulin infusion (Gammagard Liquid) | 1 | 1 | June 22, 2012 | April 27, 2005 | No |
| Onabotulinum toxin A (Botox) | 3 | 8 | December 29, 1989 | April 12, 2002 | Yes |
| Somatropin (Humatrope) | 3 | 3 | March 8, 1987 | August 1, 1996 | Yes |
| Somatropin (Norditropin) | 2 | 5 | June 20, 2000 | November 1, 2004 | Yes |
| Denosumab (Xgeva) | 2 | 6d | June 13, 2013 | June 1, 2010 | No |
| Total | 48 | 57 | —e | —e | 7 |
SOURCE Authors’ analysis of the 2018 IBM MarketScan Commercial Database. NOTES Drugs are listed in descending order of total spending.
We counted each entry in the Food and Drug Administration (FDA) Orphan Drug Database as a separate orphan indication, with one exception. Bevacizumab has eleven entries in the FDA Orphan Drug Database, but six of these were duplicate indications that received an entry because they derived from different orphan drug designations. In total, this drug has five unique orphan indications.
Based on information from the most recent drug label on the FDA website.
Orphan-first drugs are defined as those for which the first orphan indication was approved before the first nonorphan indication; see the online appendix for more details (see note 18 in text).
The sponsor of denosumab markets the drug as Prolia for certain indications (all of which are nonorphan indications, such as osteoporosis) and Xgeva for other indications. We counted Prolia’s indications in the number of nonorphan indications for Xgeva.
Not applicable.
Spending By Indication
For each of the fifteen drugs, exhibit 2 displays the proportion of spending assigned to orphan indications, the proportion assigned to nonorphan indications, and the proportion that was for unassigned claims. The proportion of spending assigned to orphan indications ranged from 0.6 percent to 74.2 percent (median, 25.3 percent) and was less than 50 percent for ten drugs (exhibit 3).
Exhibit 2:
Spending on fifteen top-selling partial orphan drugs by indication
| Generic name (trade name) | Orphan first?a | Total spending (millions) | Spending assigned to orphan indications (%) | Spending assigned to nonorphan indications (%) | Spending for unassigned claims (%) |
|---|---|---|---|---|---|
| Adalimumab (Humira) | No | $1,353 | 8.4 | 84.9 | 6.7 |
| Infliximab (Remicade) | Yes | $475 | 54.1 | 37.8 | 8.1 |
| Etanercept (Enbrel) | No | $469 | 1.4 | 93.9 | 4.7 |
| Pegfilgrastim (Neulasta) | No | $248 | 0.6 | 99.4 | 0.0 |
| Trastuzumab (Herceptin) | No | $225 | 2.4 | 97.0 | 0.6 |
| Rituximab (Rituxan) | Yes | $191 | 50.9 | 24.1 | 25.1 |
| Bevacizumab (Avastin) | No | $135 | 44.7 | 50.3 | 5.0 |
| Nivolumab (Opdivo) | Yes | $127 | 62.3 | 35.6 | 2.1 |
| Pembrolizumab (Keytruda) | Yes | $101 | 25.3 | 69.9 | 4.8 |
| Immune globulin injection (Gamunex-C) | No | $97 | 32.2 | 35.5 | 32.2 |
| Immune globulin infusion (Gammagard Liquid) | No | $90 | 4.0 | 43.2 | 52.9 |
| Onabotulinum toxin A (Botox) | Yes | $90 | 14.5 | 79.8 | 5.6 |
| Somatropin (Humatrope) | Yes | $86 | 70.9 | 25.6 | 3.5 |
| Somatropin (Norditropin) | Yes | $86 | 74.2 | 23.7 | 2.1 |
| Denosumab (Xgeva) | No | $71 | 6.1 | 92.7 | 1.2 |
| All drugs | 7 | $3,844 | 21.4 | 70.7 | 7.9 |
SOURCE Authors’ analysis of the 2018 IBM MarketScan Commercial Database.
Orphan-first drugs are defined as those for which the first orphan indication was approved before the first nonorphan indication; see online appendix for more details (see note 18 in text).
Exhibit 3:
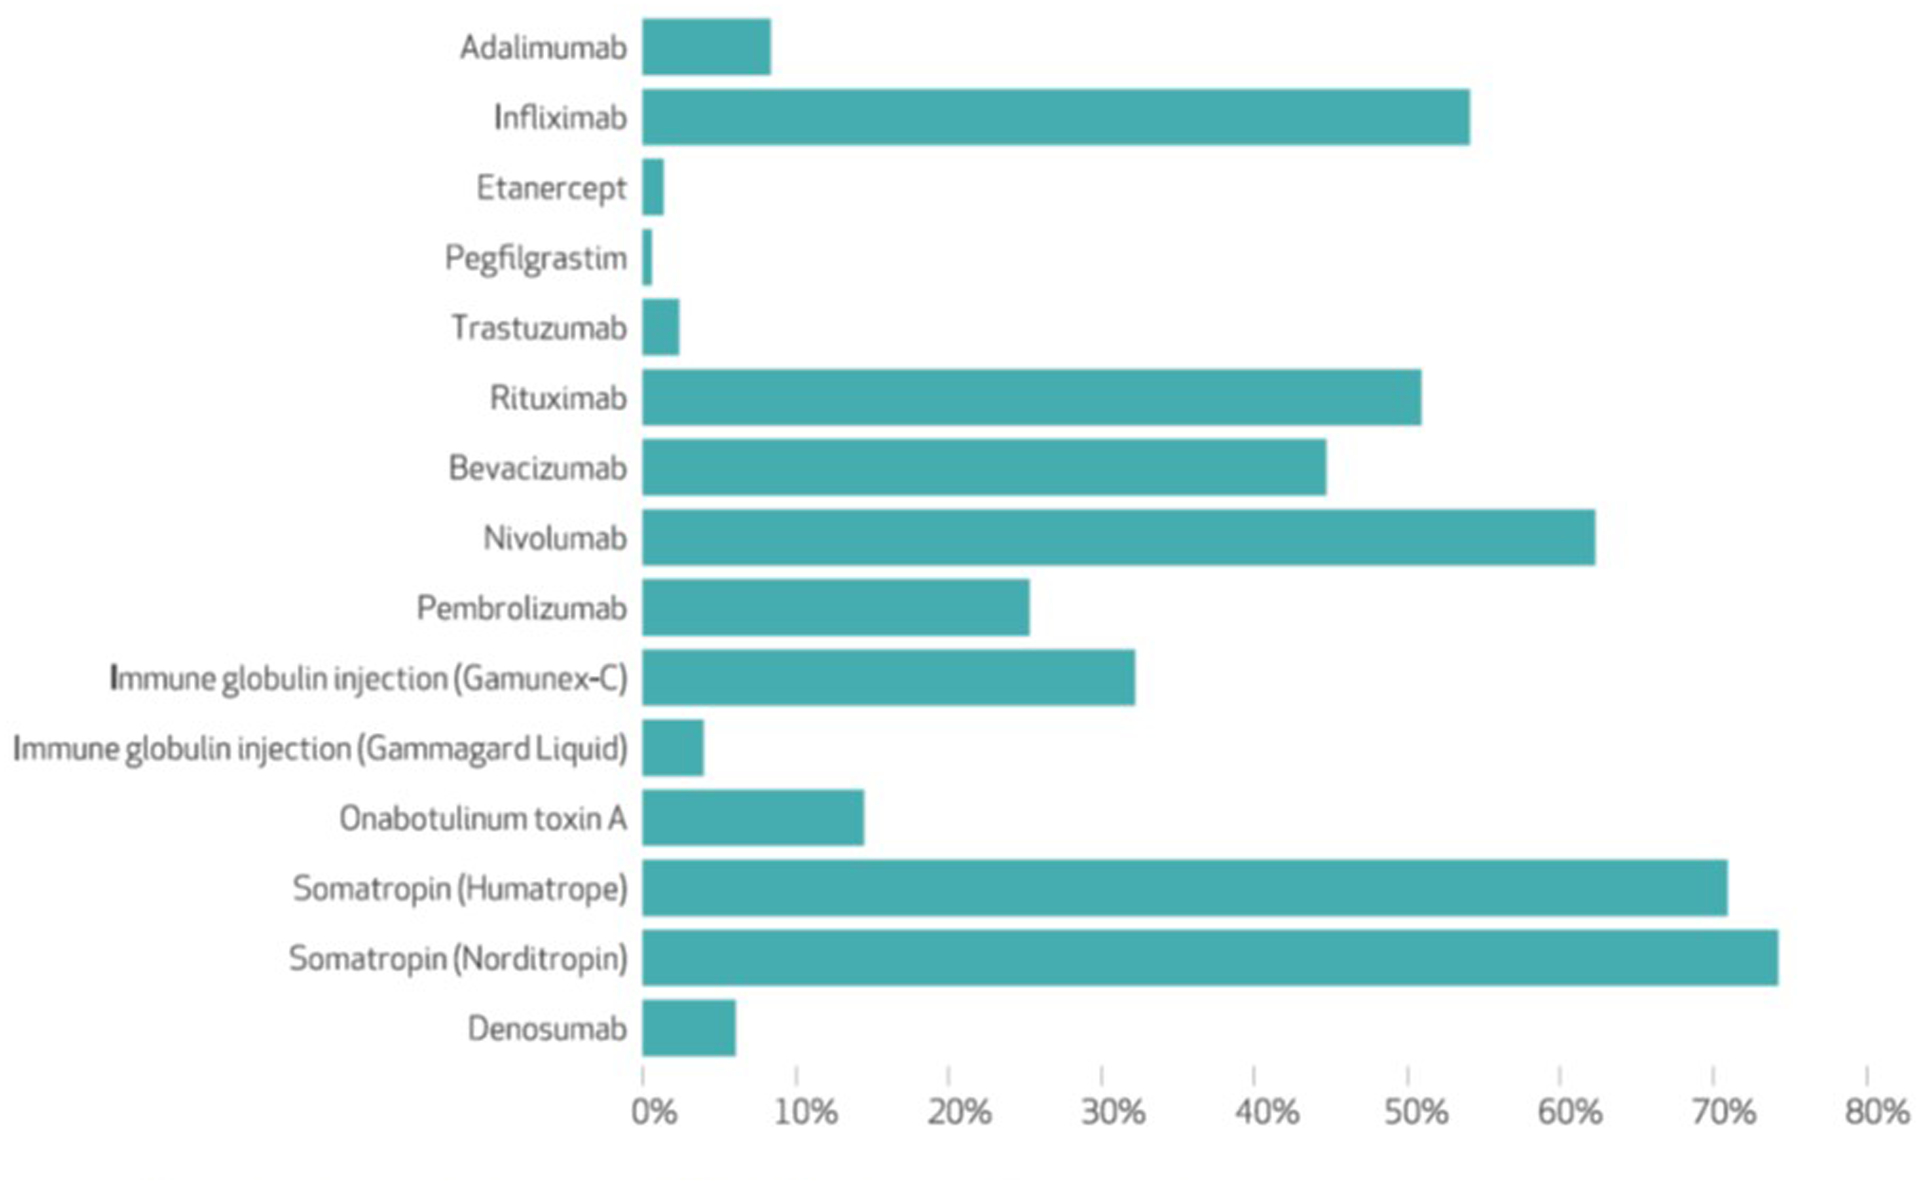
Percentage of spending on fifteen top-selling partial orphan drugs for orphan indications
SOURCE Authors’ analysis of the 2018 IBM MarketScan Commercial Database.
Of the $3.84 billion spent on the fifteen drugs, $822 million (21.4 percent) and $2.72 billion (70.7 percent) was assigned to orphan and nonorphan indications, respectively; $304 million (7.9 percent) was for unassigned claims. The $2.72 billion in aggregate nonorphan spending for the fifteen drugs accounted for 37.0 percent of the $7.34 billion spent on all 405 orphan drugs.
Of the $1.15 billion spent on orphan first drugs, $596 million (51.6 percent) and $455 million (39.4 percent) was assigned to orphan and nonorphan indications, respectively; $104 million (9.0 percent) was for unassigned claims. Of the $2.69 billion spent on nonorphan first drugs, $226 million (8.4 percent) and $2.26 billion (84.1 percent) were assigned to orphan and nonorphan indications, respectively; $202 million (7.5 percent) was for unassigned claims (see appendix).18
Sensitivity Analysis
When we assigned claims with diagnosis codes for both orphan and nonorphan indications in the look-back period to nonorphan indications, the proportion of spending on the fifteen drugs assigned to orphan indications decreased from 21.4 percent to 15.5 percent. When we defined the look-back period as the 365 days before the orphan drug claim to the date of the claim, the proportion of spending on the fifteen drugs assigned to orphan indications decreased from 21.4 percent to 20.9 percent. Of the 705,866 orphan drug claims for the fifteen drugs, 17.3 percent were assigned to orphan indications (compared with 21.4 percent for spending), a difference mediated by small differences in spending per claim by use (data not shown).
Discussion
In this analysis of 2018 national commercial claims from 12.8 million nonelderly US patients, just one-fifth of spending on the fifteen top-selling partial orphan drugs was for the rare diseases for which sponsors received orphan drug benefits. For orphan-first drugs initially approved as rare disease treatments, approximately one-half of spending was for orphan indications compared with one-twelfth for nonorphan-first drugs initially approved as common disease treatments.
To our knowledge, this is the first study to estimate spending for orphan indications among a broad group of partial orphan drugs. One report estimated that 9.6 percent and 15.3 percent of US prescription drug spending in 2017 was for the orphan indications and nonorphan indications of all orphan drugs approved as of August 2018.1 These estimates imply that 24.9 percent of US prescription drug spending is for orphan drugs and that 38.6 percent (9.6 percent/24.9 percent) of orphan drug spending is for orphan indications. Although useful, this analysis did not distinguish between partial orphan drugs and those with orphan indications only.
Among orphan-first drugs in our study, half of spending was for orphan indications and almost 40 percent of spending was for nonorphan indications. The substantial amount of nonorphan spending might partially reflect the unforeseen discovery of common disease indications after initial orphan approval. However, the substantial amount of nonorphan spending might also partially reflect the fact that orphan drug policy incentivizes sponsors to pursue an orphan-first strategy.7,12 Orphan approval is typically easier to obtain than nonorphan approval, both because expedited review pathways are readily available for orphan drugs and because orphan approval typically requires less robust evidence of efficacy and safety.11 At the same time, because US drug pricing is not typically indication-specific,10 high launch prices for rare disease drugs could allow sponsors to charge higher prices in the common disease market than they otherwise would be able to charge if launch prices were lower. As a consequence, sponsors of drugs with potential orphan and nonorphan uses are incentivized to first pursue orphan approval, thus obtaining lucrative orphan drug benefits such as tax credits while leveraging the lower bar for approval, and then subsequently market the drug primarily for common diseases.
Policy makers have several options if they wish to reduce incentives to pursue an orphan-first strategy. First, they could consider varying the price of orphan drugs between indications based on factors such as the availability of therapeutic alternatives.9 Such “indication-specific pricing,” which is rarely used in the US but has been applied in the case of chimeric antigen receptor T-cell therapy,24 could make it more difficult for sponsors to charge the same high prices in rare disease and common disease markets. The tradeoff is that the lower profit potential in common disease markets might deter some sponsors from developing new drugs that may have benefited patients with rare diseases.
Second, policy makers could allow the FDA to revoke orphan drug designation once the total patient population treated by the drug across all indications exceeds 200,000, thus decreasing the incentive for sponsors of rare disease drugs to obtain nonorphan indications. Third, policy makers could pass legislation that forces sponsors to repay subsidies for clinical testing provided under the Orphan Drug Act once drugs are sufficiently profitable, mirroring an orphan drug policy used in Japan.7
Among nonorphan-first drugs in our study, $1 in $12 spent was for orphan indications and almost $5 in $6 spent was for nonorphan indications. Whether the low proportion of spending for orphan indications should cause concern among policy makers is more ambiguous than for orphan-first drugs. On the one hand, there is some benefit to finding new orphan uses for drugs to treat common diseases for which safety has already been established in large populations. On the other hand, the fact that safety has been established, coupled with the typically small sizes of clinical trials required for orphan approval,11 raises the question of whether lucrative orphan drug benefits are required to compensate sponsors for the comparatively low costs of repurposing drugs to treat rare diseases.
Moreover, the costs of granting orphan status to drugs that treat common diseases may be substantial, as this status can increase profits from the drugs’ nonorphan use. First, orphan drugs are often not excluded from formularies because of the lack of therapeutic alternatives.25,26 Because formulary placement is typically not indication-specific, sponsors of common disease drugs may be able to secure less restricted access across all uses by obtaining orphan indications.
Second, sponsors of orphan drugs do not have to provide discounts to critical access hospitals, rural referral centers, sole community hospitals, and freestanding cancer hospitals that participate in the 340B Drug Pricing Program,27 which typically provides 25–50 percent discounts on outpatient drugs to facilities with a high proportion of underserved patients.28 Our findings suggest this exemption could result in substantial revenue gained for sponsors of partial orphan drugs. For example, consider pegfilgrastim, the partial orphan drug accounting for the fourth-highest spending in our study. Just 0.6 percent of spending on pegfilgrastim was assigned to its orphan indication of acute radiation syndrome, indicating that hospitals subject to the exemption cannot obtain 340B discounts in the vast majority of instances in which pegfilgrastim is used for its nonorphan indication (preventing infection due to low white blood cells in cancer patients receiving chemotherapy).
Policy makers have several potential options if they wish to decrease the rewards for repurposing a common disease drug to treat rare disease. One option is to limit the 340B exemption to instances in which the drug is used for the rare disease for which it has orphan drug designation (for example, acute radiation syndrome in the case of pegfilgrastim). Such an approach, which has been proposed in legislation introduced in the House of Representatives,29 could also decrease the rewards of pursuing an orphan-first strategy but would result in more savings for nonorphan-first drugs because of their greater nonorphan use. Another option is to decrease the magnitude of orphan drug benefits, for example, lowering the amount of tax credits, when orphan drug designation is awarded to drugs that treat common diseases.
The sizable amount of nonorphan spending demonstrated in our study highlights the importance of including orphan drug spending across all indications in policy discussions. For example, one group of authors argued that concerns about high orphan drug spending were unfounded on the basis of an analysis that only included spending for orphan indications.3 In our study, nonorphan spending for just fifteen partial orphan drugs accounted for 37 percent of all orphan drug spending, suggesting that failure to include nonorphan spending would drastically underestimate the budgetary impact of orphan drugs in the US.
Conclusion
Our findings provide some support to policy makers’ concerns regarding the costs of orphan drug benefits for partial orphan drugs, particularly those initially approved for rare diseases.5 Yet reducing these benefits entails trade-offs. To inform assessments of these trade-offs, future studies should evaluate whether the benefits of the orphan uses of partial orphan drugs justify the potentially substantial costs of granting these drugs orphan status.
Supplementary Material
Acknowledgment
An earlier version of this manuscript was presented at the AcademyHealth Research Meeting in Washington, D.C., on June 2, 2019. Kao-Ping Chua is supported by a career development award from the National Institute on Drug Abuse (Grant No. 1K08DA048110-01) and by a grant from the Benter Foundation, both unrelated to the current work. Rena Conti is supported by a grant from the American Cancer Society. These funders had no role in the design and conduct of the study; collection, management, analysis, and interpretation of the data; preparation, review, or approval of the manuscript; and decision to submit the manuscript for publication. The authors thank Frank David for comments on an earlier draft; he was not compensated for his contribution.
Notes
- 1.IQVIA Institute. Orphan drugs in the United States: growth trends in rare disease treatments. Durham (NC): IQVIA; 2018. [Google Scholar]
- 2.EvaluatePharma. Orphan drug report 2019. London (UK): EvaluatePharma; 2019. April. [Google Scholar]
- 3.Divino V, DeKoven M, Kleinrock M, Wade RL, Kaura S. Orphan drug expenditures in the United States: a historical and prospective analysis, 2007–18. Health Aff (Millwood). 2016;35(9):1588–94. [DOI] [PubMed] [Google Scholar]
- 4.Blankenship K The top 20 drugs by 2018 U.S. sales [Internet] Washington (DC): FiercePharma; 2019. June 17 [cited 2021 Jan 11]. Available from: https://www.fiercepharma.com/special-report/top-20-drugs-by-2018-u-s-sales [Google Scholar]
- 5.Tribble SJ, Lupkin S. Drugmakers manipulate orphan drug rules to create prized monopolies. Kaiser Health News [serial on the Internet]. 2017. January 17 [cited 2021 Jan 11]. Available from: https://khn.org/news/drugmakers-manipulate-orphan-drug-rules-to-create-prized-monopolies/ [Google Scholar]
- 6.Sarpatwari A, Kesselheim AS. Reforming the Orphan Drug Act for the 21st century. N Engl J Med. 2019;381(2):106–8. [DOI] [PubMed] [Google Scholar]
- 7.Bagley N, Berger M, Chandra A, Garthwaite C, Stern A. The Orphan Drug Act at 30. In: Lerner J, Stern S, editors. Innovation Policy and the Economy, 2018, Volume 19 (National Bureau of Economic Research Innovation Policy and the Economy). Chicago (IL): University of Chicago Press; 2019. [Google Scholar]
- 8.Sarpatwari A, Beall RF, Abdurrob A, He M, Kesselheim AS. Evaluating the impact of the Orphan Drug Act’s seven-year market exclusivity period. Health Aff (Millwood). 2018;37(5):732–7. [DOI] [PubMed] [Google Scholar]
- 9.Bach PB. Indication-specific pricing for cancer drugs. JAMA. 2014;312(16):1629–30. [DOI] [PubMed] [Google Scholar]
- 10.Pearson SD, Dreitlein WB, Henshall C. Indication-specific pricing of pharmaceuticals in the United States health care system [Internet]. Boston (MA): Institute for Clinical and Economic Review; 2016. March [cited 2021 Jan 11]. Available from: http://icerorg.wpengine.com/wp-content/uploads/2020/11/Final-Report-2015-ICER-Policy-Summit-on-Indication-specific-Pricing-March-2016_revised-icons-002.pdf [Google Scholar]
- 11.Kesselheim AS, Myers JA, Avorn J. Characteristics of clinical trials to support approval of orphan vs nonorphan drugs for cancer. JAMA. 2011;305(22):2320–6. [DOI] [PubMed] [Google Scholar]
- 12.Côté A, Keating B. What is wrong with orphan drug policies? Value Health. 2012;15(8):1185–91. [DOI] [PubMed] [Google Scholar]
- 13.IBM Watson Health. IBM MarketScan research databases for health services researchers [Internet]. Somers (NY): IBM Corporation; 2019. April [cited 2021 Jan 11]. Available from: https://www.ibm.com/downloads/cas/6KNYVVQ2 [Google Scholar]
- 14.Food and Drug Administration. Drugs@FDA: FDA-approved drugs [Internet]. Silver Spring (MD): FDA; 2019. [cited 2021 Jan 11]. Available from: https://www.accessdata.fda.gov/scripts/cder/daf/ [Google Scholar]
- 15.Food and Drug Administration. Licensed biological products with supporting documents [Internet]. Silver Spring (MD): FDA; 2020. [cited 2021 Jan 11]. Available from: https://www.fda.gov/vaccines-blood-biologics/licensed-biological-products-supporting-documents [Google Scholar]
- 16.Food and Drug Administration. Search orphan drug designations and approvals [Internet]. Silver Spring (MD): FDA; 2020. [cited 2021 Jan 11]. Available from: https://www.accessdata.fda.gov/scripts/opdlisting/oopd/index.cfm [Google Scholar]
- 17.IBM Corporation. IBM Micromedex Red Book [Internet]. Armonk (NY): IBM Corporation; 2019. [cited 2021 Jan 11]. Available from: https://www.ibm.com/products/micromedex-red-book [Google Scholar]
- 18. To access the appendix, click on the Details tab of the article online.
- 19.Kesselheim AS, Myers JA, Solomon DH, Winkelmayer WC, Levin R, Avorn J. The prevalence and cost of unapproved uses of top-selling orphan drugs. PLoS One. 2012;7(2):e31894. [DOI] [PMC free article] [PubMed] [Google Scholar]
- 20.Chua KP, Conti RM. Out-of-pocket spending on orphan drug prescriptions among commercially insured adults in 2014. J Gen Intern Med. 2019;34(3):338–40. [DOI] [PMC free article] [PubMed] [Google Scholar]
- 21.Government Accountability Office. Orphan drugs: FDA could improve designation review consistency; rare disease drug development challenges continue. Washington (DC): GAO; 2018. November 30. (Report No. GAO-19–83). [Google Scholar]
- 22.Office of Inspector General. Data brief: how often are high-expenditure orphan drugs being used for their orphan indications in Medicare [Internet]. Washington (DC): Department of Health and Human Services, OIG; 2020. [cited 2021 Jan 11]. Available from: https://www.oig.hhs.gov/reports-and-publications/workplan/summary/wp-summary-0000433.asp [Google Scholar]
- 23.Chambers JD, Silver MC, Berklein FC, Cohen JT, Neumann PJ. Orphan drugs offer larger health gains but less favorable cost-effectiveness than non-orphan drugs. J Gen Intern Med. 2020;35(9):2629–36. [DOI] [PMC free article] [PubMed] [Google Scholar]
- 24.Jacobson C, Emmert A, Rosenthal MB. CAR T-cell therapy: a microcosm for the challenges ahead in Medicare. JAMA. 2019; [Epub ahead of print]. [DOI] [PubMed] [Google Scholar]
- 25.Faden L, Huskamp H. Appendix C: Medicare Part D coverage and reimbursement of orphan drugs. In: Field MJ, Boat TF, editors. Rare diseases and orphan products: accelerating research and development. Washington (DC): National Academies Press; 2010. P. 309–44. [PubMed] [Google Scholar]
- 26.Chambers JD, Panzer AD, Kim DD, Margaretos NM, Neumann PJ. Variation in US private health plans’ coverage of orphan drugs. Am J Manag Care. 2019;25(10):508–12. [PubMed] [Google Scholar]
- 27.Health Resources and Services Administration. Orphan drugs [Internet]. Rockville (MD): HRSA; 2020. December [cited 2021 Jan 11]. Available from: https://www.hrsa.gov/opa/program-requirements/orphan-drug-exclusion/index.html [Google Scholar]
- 28.Thomas S, Schulman K. The unintended consequences of the 340B safety-net drug discount program. Health Serv Res. 2020;55(2):153–6. [DOI] [PMC free article] [PubMed] [Google Scholar]
- 29. Closing Loopholes for Orphan Drugs Act, Stat. H.R. 4538 (2017).
Associated Data
This section collects any data citations, data availability statements, or supplementary materials included in this article.