Abstract
Per and polyfluoroalkyl substances (PFASs) are an important class of organic pollutants. Many diverse PFASs are used in commerce and most are not amenable to conventional targeted chemical analysis due to lack of reference standards. Therefore, methods for elucidating the chemical structure of previously unreported or unexpected PFASs in the environment rely extensively on high-resolution mass spectrometry (HRMS). High-throughput structure identification by HRMS is hindered by a lack of PFAS molecular databases and tandem mass spectral libraries. Here, we report a new approach for generating an environmentally relevant PFAS molecular database constructed from curated structure lists and biotic/abiotic in silico predicted transformation products. Further, we have generated a predicted tandem mass spectral library using computational mass spectrometry tools. Results demonstrate the utility of the generated database and approach for identifying PFASs in HRMS-enabled suspect- and nontarget screening studies.
Per- and polyfluoroalkyl substances (PFASs) are high production volume synthetic organic chemicals widely used throughout commerce. PFASs are globally distributed in the environment where they enter through direct dispersal,1 discharge from manufacturing2 or waste treatment facilities,3,4 or through leaching5 or off-gassing6,7 from various consumer products where they are applied. Certain PFASs bioaccumulate in higher organisms8–11 and may be toxic at low levels (ng L−1 range) of exposure.12,13 Therefore, chemical analysis techniques for the identification of PFASs in support of environmental fate and effect studies are needed.
The diversity of PFASs used in commerce, the complexity of PFAS technical mixtures, limited availability of reference materials, sparse information on specific product applications, and ever-evolving PFAS product formulations coupled with environmental (bio)transformation of PFASs present unique analytical challenges to PFAS detection.14 Only a small fraction of known PFASs have been measured via targeted chemical analysis, and many more PFASs likely occur in the environment than are currently routinely monitored.15,16 High-resolution mass spectrometry (HRMS) offers—at present—the only practical solution for identifying previously unreported or unexpected PFASs at environmentally relevant concentrations and has been widely used to identify PFASs through suspect screening and nontargeted analysis.17–22 However, current screening workflows are limited by relatively sparse annotated PFAS molecular databases and a general paucity of curated spectral libraries containing PFAS structures.
Here, we have addressed these critical needs through generation of a comprehensive PFAS chemical structure database with a corresponding in silico tandem mass spectrometry (MS/MS) spectral library intended for high-throughput annotation of PFAS structures in environmental samples. The objectives of this work were to (1) aggregate high-quality, curated chemical structure lists of known PFASs, (2) enumerate possible biotic and abiotic transformation products of PFAS using environmentally relevant reaction libraries, (3) predict MS/MS fragmentation spectra for both parent structures and any predicted transformation products using in silico computational mass spectrometry methods, and (4) assess the utility of the resultant structure database and spectral library for the HRMS structure annotation of PFASs. Figure 1 depicts an overview of the workflow employed for generating the comprehensive PFAS screening database. Using open-source cheminformatics and computational mass spectrometry tools, the resultant PFAS spectral library enables rapid and high-throughput structural annotation of PFASs in the environment using HRMS.
Figure 1.
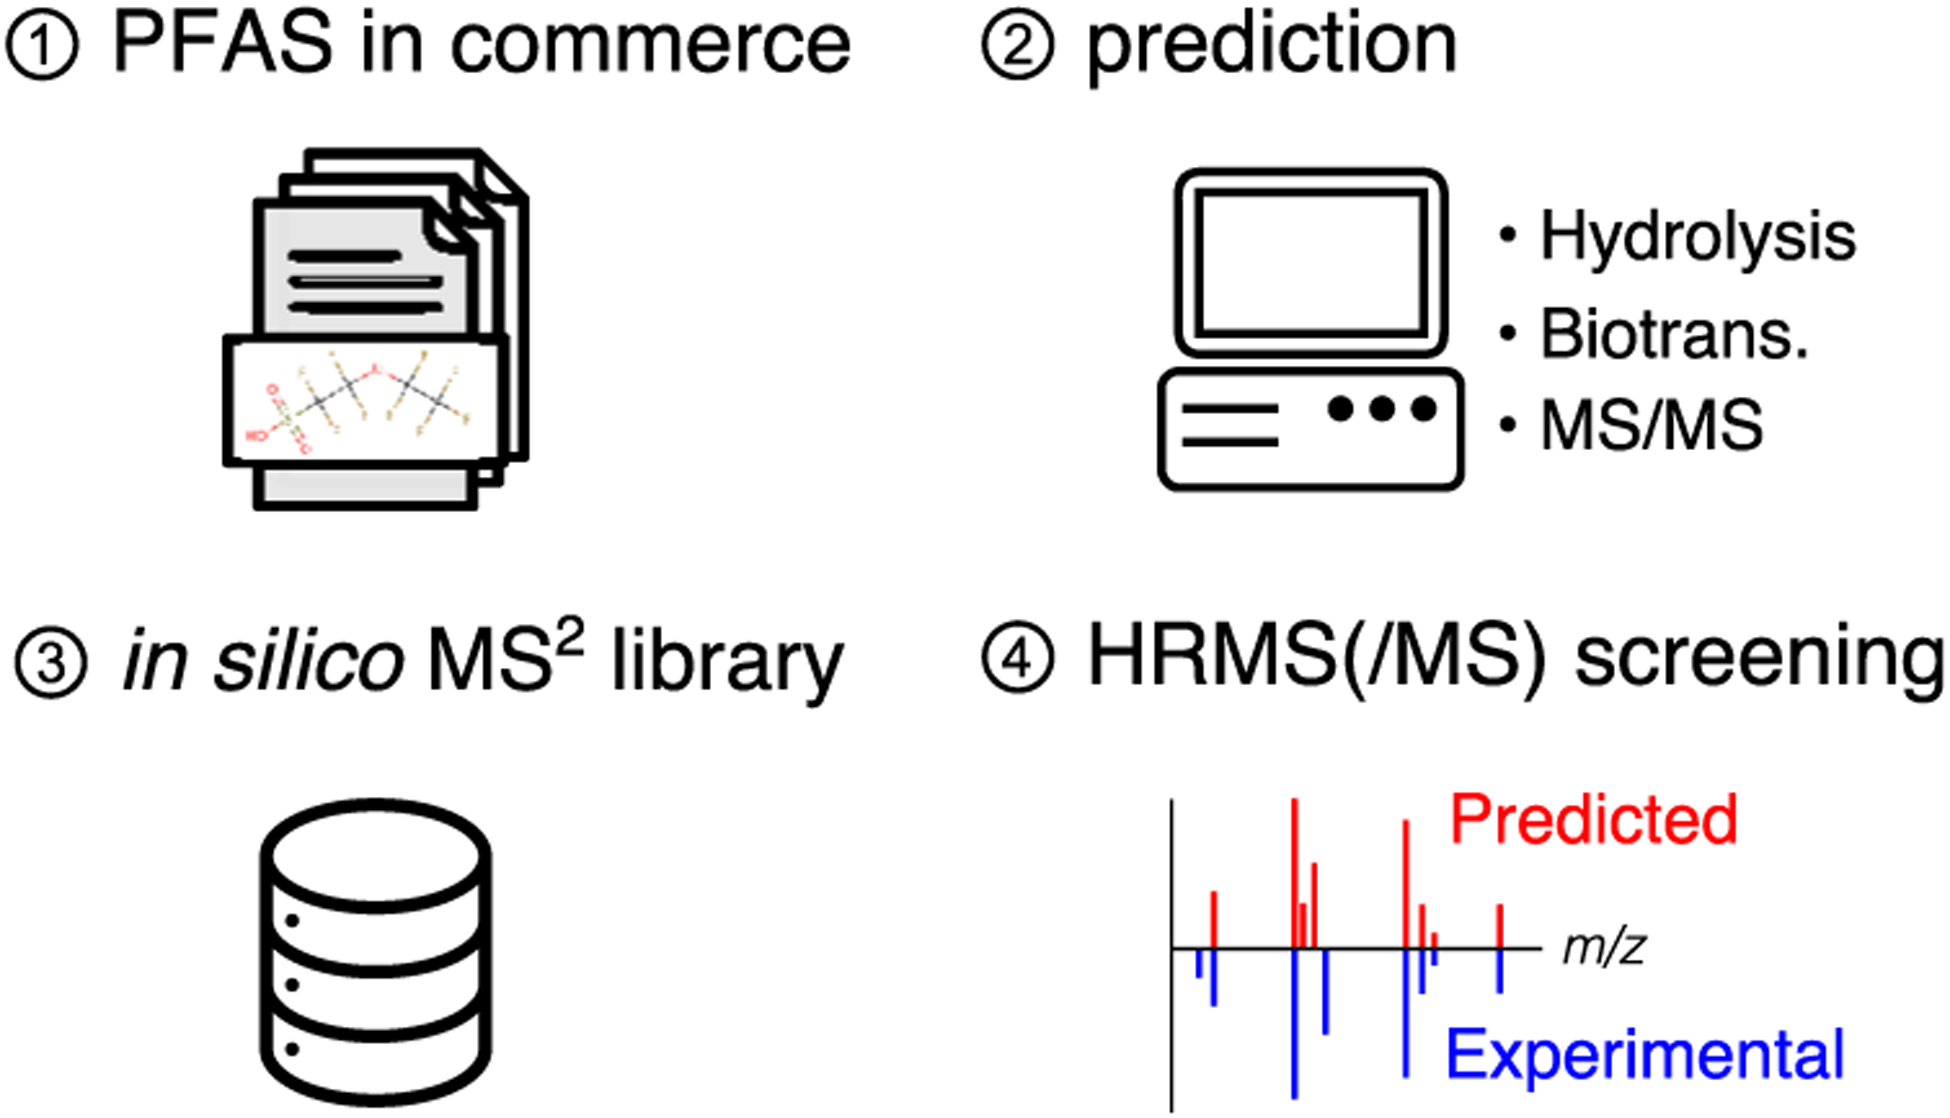
Overview of workflow for generating a comprehensive PFAS structure and in silico MS/MS library for screening for the presence of PFASs in environmental media.
MATERIALS AND METHODS
Chemical Structure Handling and Standardization.
Chemical structure representations were managed using RDKit (v3.1).23 Before and after predicting transformation products, structure representations were standardized using the molecule validation and standardization (MolVS) software package to determine the charge, isotope, tautomer, and stereoisomer parents of each molecule.24 Standardized molecules were indexed by the 14-character connectivity and the proton layer of their respective hashed International Chemical Identifier (i.e., InChIKey-14, InChIKey skeleton). The InChIKey-14 served as the primary key for the resultant database such that the molecule table contained a non-redundant list of molecules, while linked tables, such as list membership, parent–product relationships are retained (i.e., one-to-many relationship). A database schema depicting the resultant relational database including the associated tables and foreign keys can be found in Figure S1 of the Supporting Information.
Source Datasets.
Commercially and environmentally relevant PFASs totaling 6097 unique structures were retrieved from the United States Environmental Protection Agency (USEPA) Chemistry Dashboard.25 An additional 1170 PFASs from an in-house list of PFAS structures related to aqueous film-forming foams (AFFF) were combined with the EPA Dashboard Chemicals to bring the total input database to 7267 unique two-dimensional chemical structures.
Transformation Product Prediction.
Hydrolytic transformations were predicted using the USEPA Chemical Transformation Simulator (CTS) Abiotic Hydrolysis Reaction Library,26 which was transcribed into reaction SMARTS for batch prediction using RDKit.27 Biotransformations were predicted using enviPath28 aerobic biotransformation pathways implemented through the BioTransformer command-line tool.29
Computational Mass Spectrometry.
Even-electron, tandem mass spectrometry fragmentation spectra were predicted in both positive and negative ionization modes for all PFASs using the machine-learning-based Competitive Fragmentation Modeling (CFM) algorithm.30 A new CFM prediction model was trained using an in-house curated, nonredundant set of 5836 unique structure–spectrum pairs for positive ions and 1969 structure–spectrum pairs for negative ions. These training spectra were selected from high-resolution MS/MS library spectra in National Institute of Standards and Technology (NIST) 2017 and MassBank of North America to match typical data acquisition conditions within our laboratory (e.g., Orbitrap mass analyzer, 35–55 normalized collision energies, higher-energy collisional dissociation (HDC) fragmentation). Results of spectral prediction were compared to available PFAS library spectra from an in-house library of AFFF compounds, the NIST 2017 MS/MS library, Mass Bank,31 and Thermo Scientific mzCloud. The spectral similarity between experimental and predicted mass spectra was calculated as the dot-product similarity using the MSnbase: Base Functions and Classes for Mass Spectrometry and Proteomics R package.32
Data and Code Availability.
The database described herein may be accessed through the Duke University Research Repository under DOI 10.7924/r4c53n875 (https://doi.org/10.7924/r4c53n875). To facilitate batch spectral prediction for large numbers of molecules, collection and storage of the resultant spectra, and spectral similarity searching, we developed an open-source R-extension called cfmR, which is available on Github at https://github.com/gjgetzinger/cfmR. Executable scripts for generating the database and spectral library and for replicating the analysis described herein can also be found on Github at https://github.com/gjgetzinger/PFAScreeneR.
RESULTS AND DISCUSSION
Hydrolysis.
Various commercial PFAS chemistries as well as associated byproducts or impurities contain hydrolytically labile moieties. For instance, fluorosulfonyl and acyl fluoride moieties are thought to form their corresponding sulfonic and carboxylic acid analogs in aqueous environments.19 Furthermore, hydrolysis likely represents the main abiotic transformation processes for most PFAS since few PFASs contain chromophores and are therefore not susceptible to direct photolysis by sunlight. Therefore, 22 hydrolysis reaction rules were applied in two steps to molecules with at least one hydrolyzable moiety. In the first and second hydrolysis steps, reactions predicted totaled 3391 and 3305 and gave 3355 and 1947 unique parent–product pairs, respectively. Products containing a carbon-fluorine substructure were retained for further analysis.
Few literature reports of PFAS hydrolysis pathways are available. Therefore, we evaluated our hydrolysis predictions against CTS predictions since they incorporate empirically derived likelihood estimates.26 We randomly sampled up to 10 unique hydrolysis reactions from each applied reaction rule and manually predicted the hydrolysis products using the CTS online batch transformation tool. A total of 100 unique precursors were processed in batches by CTS giving 170 unique parent–product relationships, of which 138 matched our predictions. Where predicted reactions matched those of CTS, 63 were rated by CTS as likely, while 75 were rated as unlikely. This indicates that our approach to hydrolysis product prediction overestimates the formation of hydrolysis products. Therefore, products predicted should be considered possible without any guarantee that the enumerated reaction pathway is either thermodynamically or kinetically competent. We assess that the presence of “unlikely” hydrolysis products in our database may actually pose advantages for identification of novel PFAS transformation products in certain environmental or engineered systems, operating under atypical or higher-energy conditions.
Biotransformation.
Aerobic biotransformation products of PFASs were predicted from the input molecules and their resultant hydrolysis products, allowing for two successive biotransformation steps. Molecules subjected to biotransformation prediction totaled 10 031, and 73 773 transformation products were predicted. Parent compounds yielding fluorinated products totaled 20 367 from 54 853 reactions with 53 401 unique parent–product combinations.
To evaluate biotransformation prediction performance for PFASs, we compared our predicted transformation to aerobic transformation pathways for 28 PFASs chosen based on the availability of published biotransformation pathways from laboratory or field studies.33–45 When evaluating literature biotransformation pathways, we defined parent–product relationships based on the presence of a product anywhere in the reaction pathway, such that both intermediate and terminal products all share the same precursor compound. Predicted biotransformation reactions where the parent and products matched relationships reported in the literature totaled 24 and represented 12 different biotransformation rules. These results indicate that—for the relatively few PFASs with extant biotransformation studies—the applied biotransformation rules may adequately predict environmentally relevant transformation pathways for PFASs.
PFAS Molecular Networks.
Parent–product relationships established by reaction predictions represent an important consideration when analyzing PFASs in the environment. For instance, many PFASs used in commerce do not possess physicochemical properties favoring environmental dispersal (e.g., hydrolytically unstable moieties, high molecular weight, low water solubility) but may be transformed during use or disposal to product PFASs with enhanced environmental mobility. Such is the case with compounds that are known to be precursors to commonly monitored PFASs (e.g., perfluorooctanoic acid, PFOA).46 Therefore, when previously unknown PFASs are (tentatively) identified in environmental samples, the co-occurrence of PFAS with a plausible (predicted or known) transformation pathway leading to the observed putative structure assignment may contribute to the weight of evidence for the structure annotation.
The PFAS molecular database described herein captures and maintains parent product relationships and provides a facile method for constructing PFAS molecular networks that can be used to aid PFAS identification, connections, and environmental fate studies. Figure 2 depicts the molecular network for PFAS within four predicted reactions of PFOA, where nodes represent unique chemical structures (totaling 184) and edges denote predicted chemical reactions (totaling 451 unique parent–product–reaction type combinations). Representative structures depicted in Figure 2b highlight both the diversity of PFAS chemistry captured in the molecular database, the variety of reaction mechanisms applied, and the degree of connectivity among PFAS chemistries.
Figure 2.
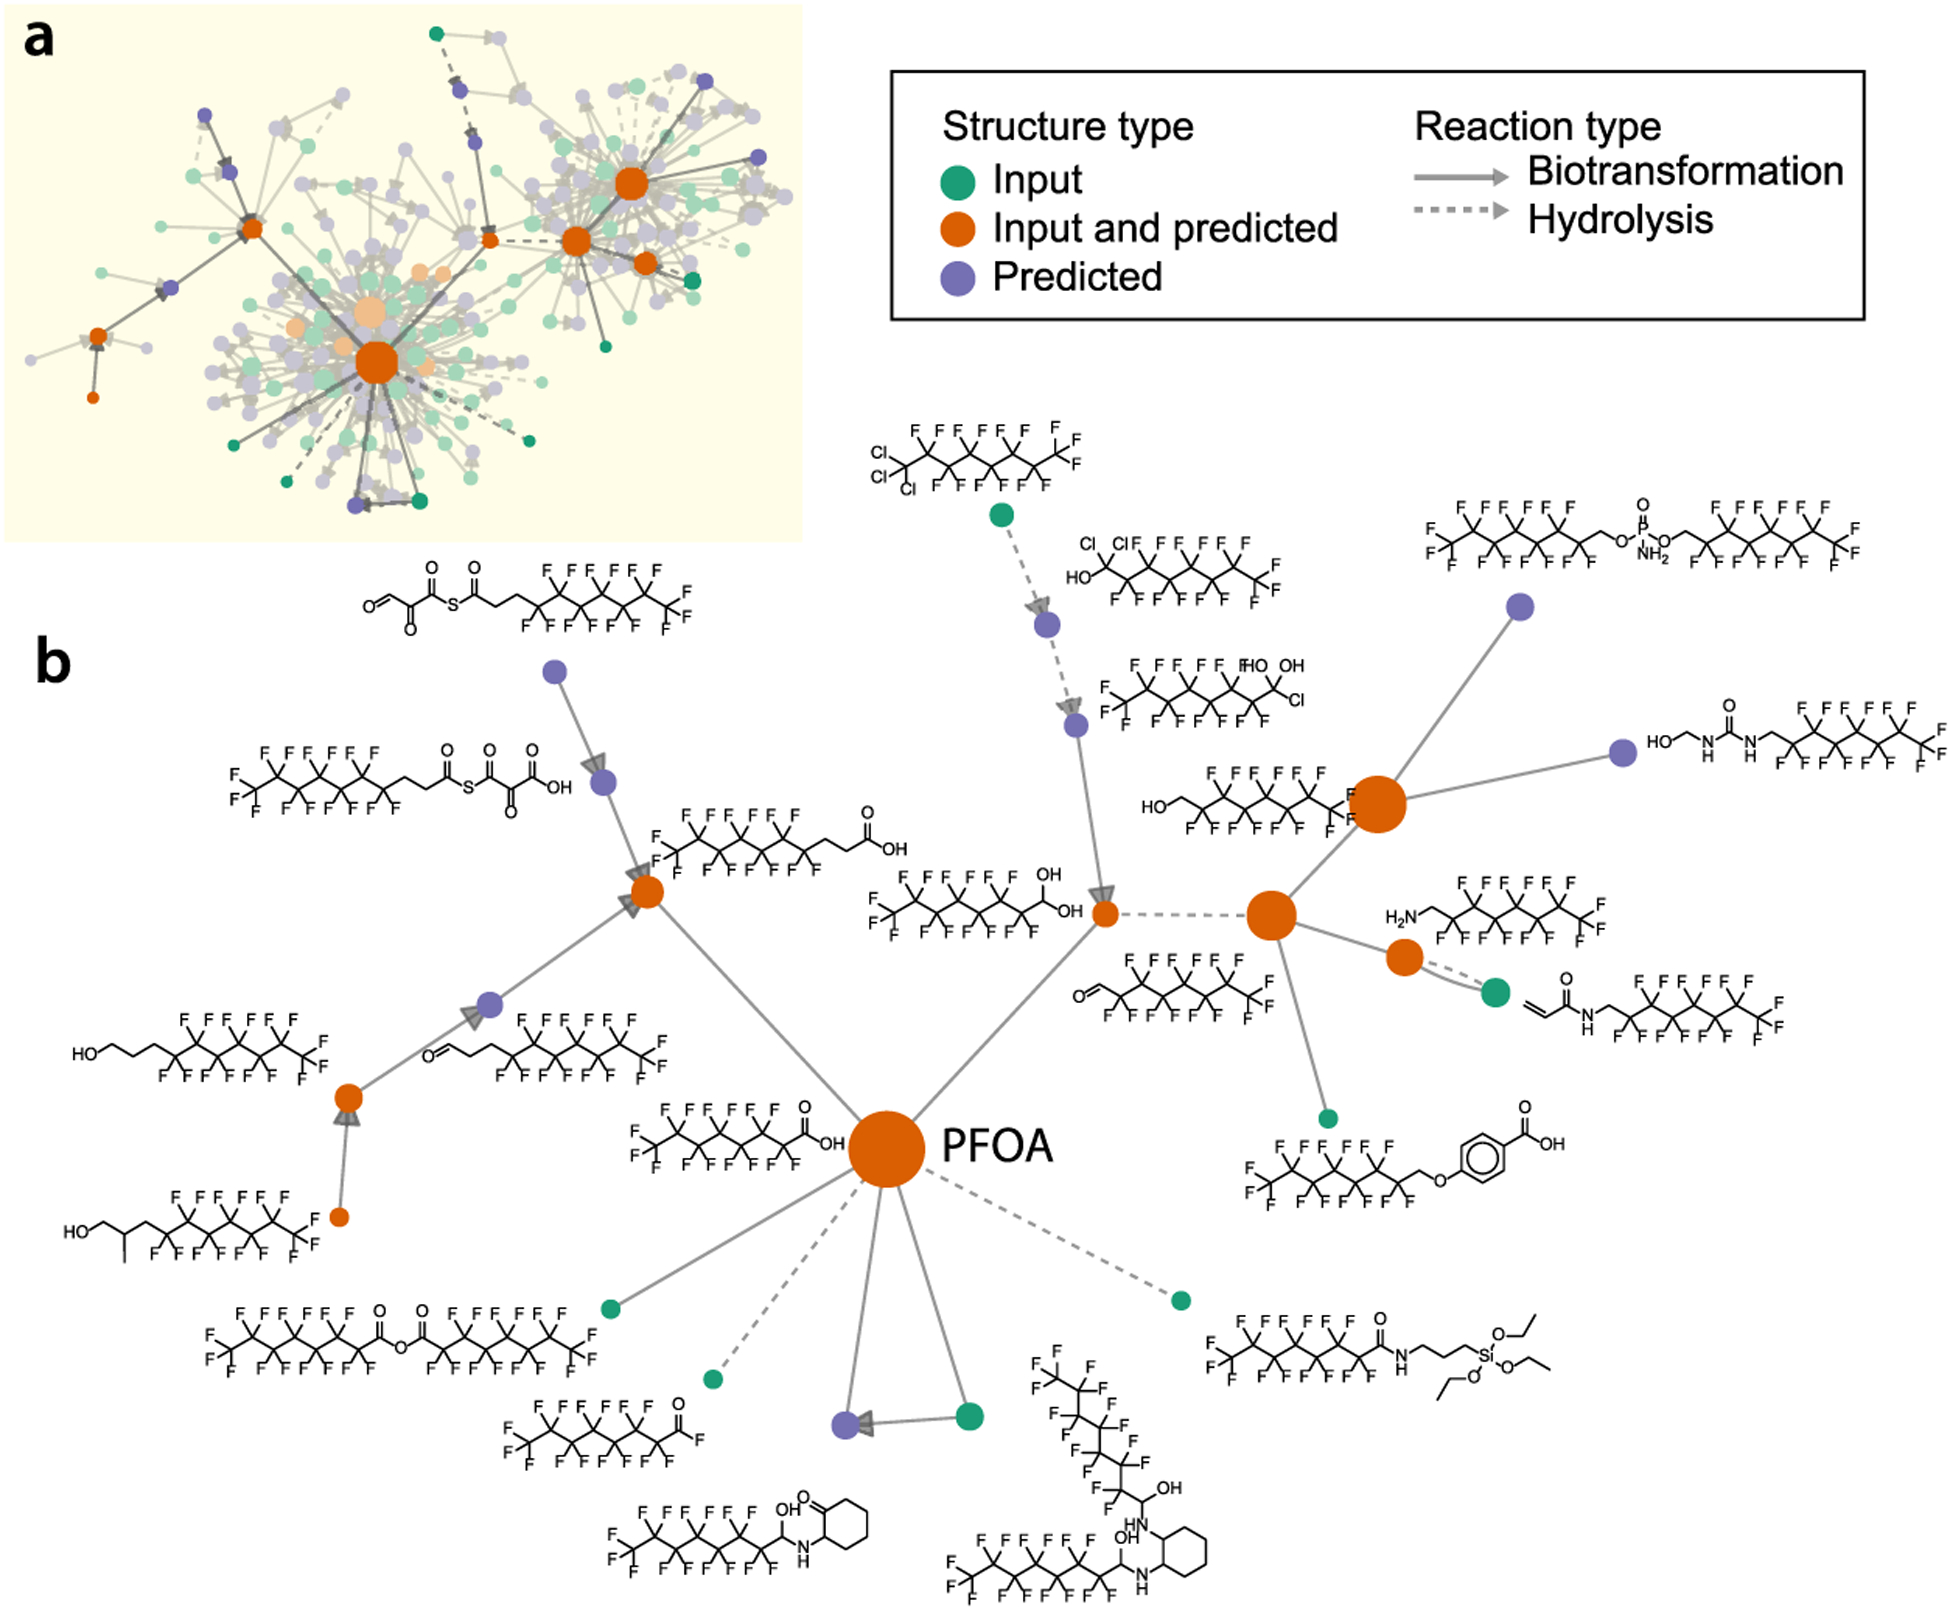
Molecular network for structures within four predicted reactions of perfluorooctanoic acid (PFOA). Nodes represent unique chemical structures. Structures from PFAS molecular databases are depicted as green nodes, while those predicted by transformations are shown as purple nodes. Structures present in input molecular databases and predicted by in silico transformations are depicted in orange. Edges depict predicted parent–product relationships from either biotransformation (solid arrows) or hydrolysis (dashed arrow). (a) Molecular network of PFASs within four predicted reaction steps of PFOA. (b) Subset of the PFOA molecular network depicting representative chemical structures.
PFAS Molecular Properties.
The overlap in unique molecular structures (defined by InChIKey-14 match) between the input structure databases and predicted transformation products is depicted in Figure 3 as an up-set diagram. Overlap among datasets was relatively small compared to the overall size of each individual dataset, indicating that the chosen input molecules covered a diverse array of potential PFAS chemistries and that the predicted transformation products greatly expanded molecular diversity. Predicted biotransformation products represented the largest set within the final dataset, likely reflecting the diversity of enzymatic processes potentially acting on organic pollutants in the environment. Overlap among transformation products and input databases indicates that predicted products have been previously observed in the environment, either as bonafide transformation products or commercial PFASs in their own right. Therefore, as research on the fate of PFASs continues, overlap between predicted transformation products and resources such as the EPA’s Chemistry Dashboard will likely continue to grow.
Figure 3.
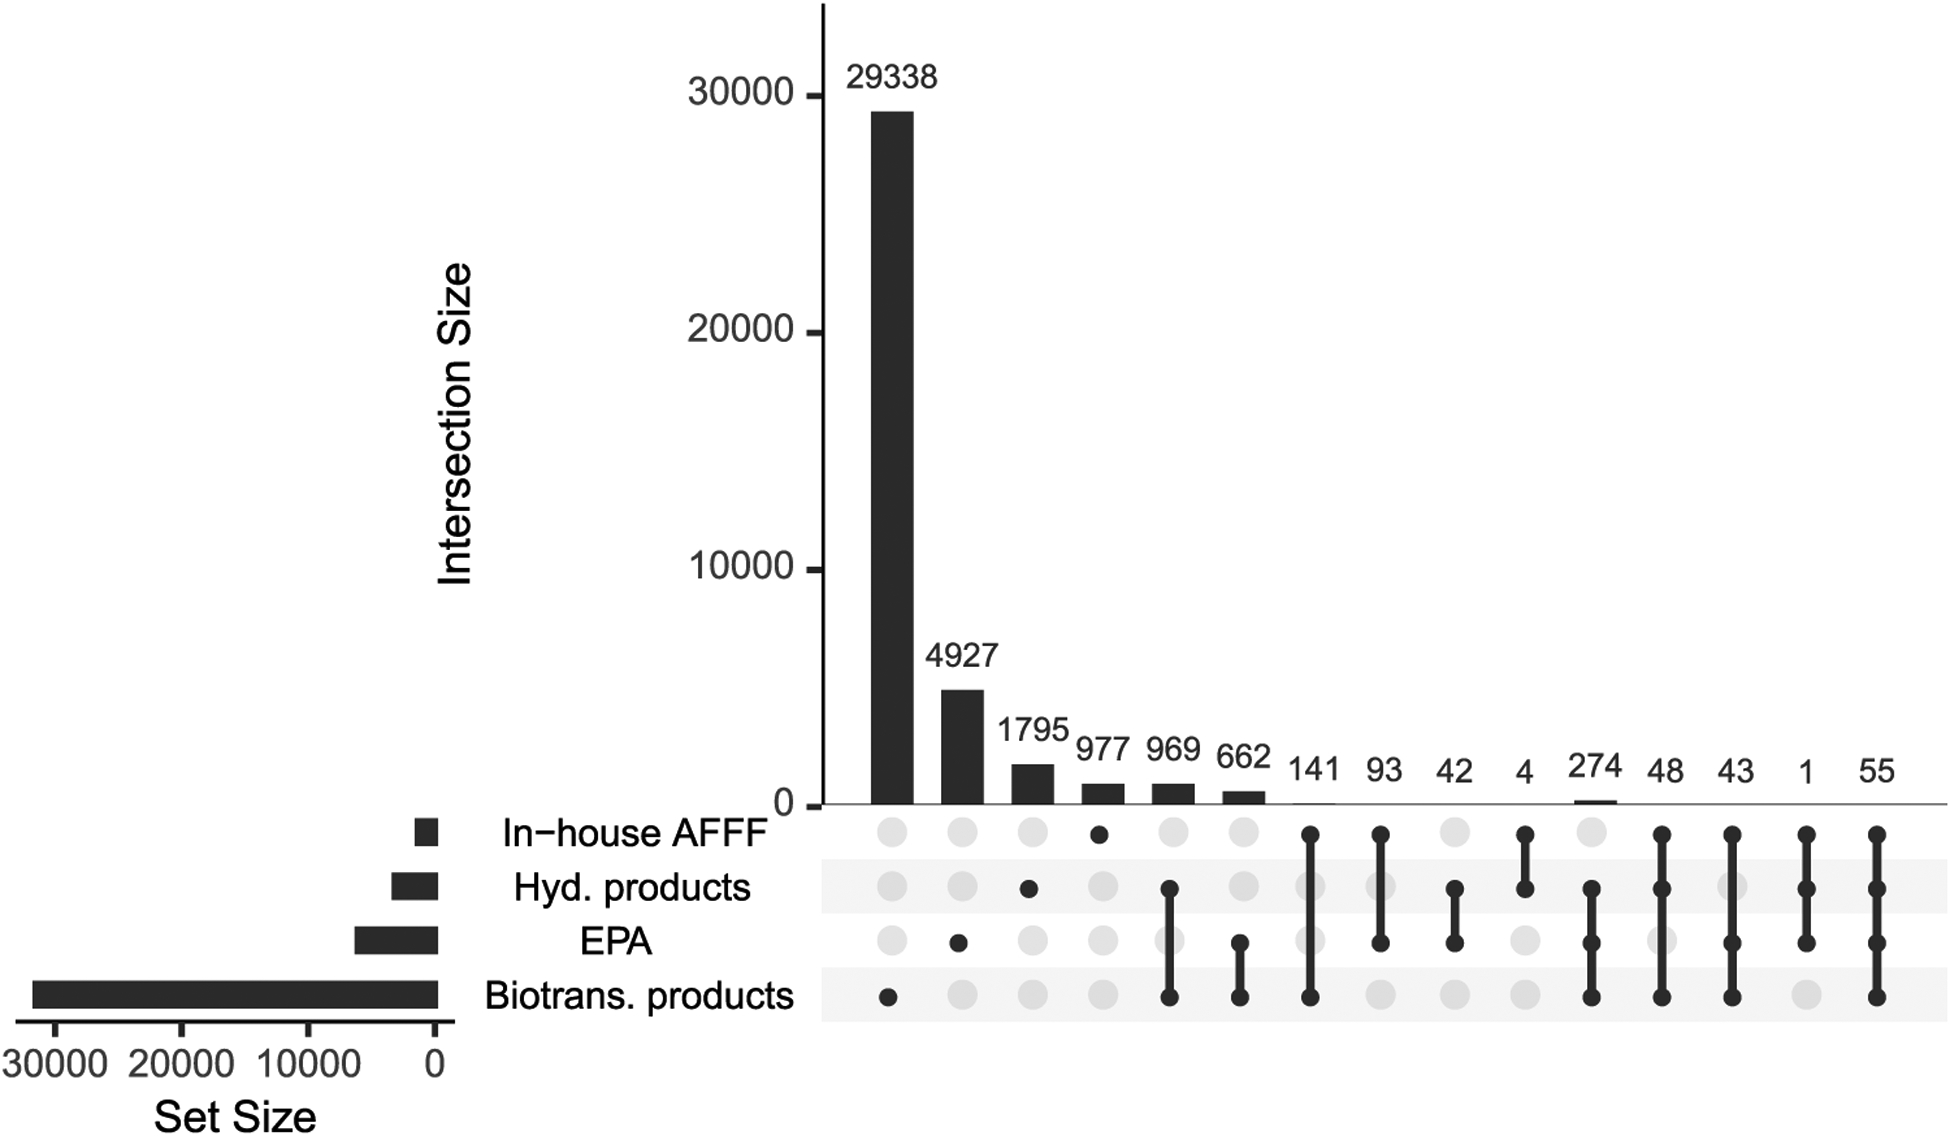
Up-set diagram depicting the total number of unique structures (i.e., set size) and overlap between various input lists and predicted transformation products (i.e., intersection size). The total number of entries in each chemical structure list (i.e., set) is indicated by horizontal bars (i.e., set size) in the lower left. Vertical bars denote the intersection size between lists denoted with filled circles below the bar. For example, the biotransformation product structure list contained 29 338 structures not found in other lists, while 969 structures are shared between the EPA and biotransformation product datasets.
The molecular properties of the combined database are shown in Figure 4. Hydrolysis and biotransformation reactions yielded lower-molecular-weight product distributions, consistent with the fact that the applied transformation reactions did not include any condensation or conjugation reactions. Distributions in exact molecular weight ranged from approx. 50 to 3200 Da centered at approx. 500 Da. The distribution in carbon counts trended with molecular weight, consistent with the fact that most PFASs contain relatively few nonfluorine heteroatoms relative to the number of carbons in each molecule. Fluorine counts ranged from 1 to 102 and all sublists had significantly more molecules with odd fluorine counts than even. Structures from the EPA dataset had markedly fewer hydrogen bond donors (HBD) and acceptors (HBA) on average compared to the other datasets. By contrast, the in-house AFFF dataset had HBD and HBA on par with hydrolysis products, likely reflecting the fact that AFFF compounds are designed for use in aqueous solution and therefore contain one or more polar functional groups to facilitate water solubility. Predicted biotransformation products had on average the highest number of HBD and HBA moieties per molecule, reflecting the aerobic biotransformation rules applied in BioTransformer. Given these molecular properties, most molecules present in the database should be amenable to conventional liquid chromatography (LC)-HRMS analysis. Molecules with molecular weight >1000 Da and no HBD or no HBA moieties would likely not be amenable to LC-HRMS but were preserved in the database so that any parent–product relationships could be retained in the underlying relational database.
Figure 4.
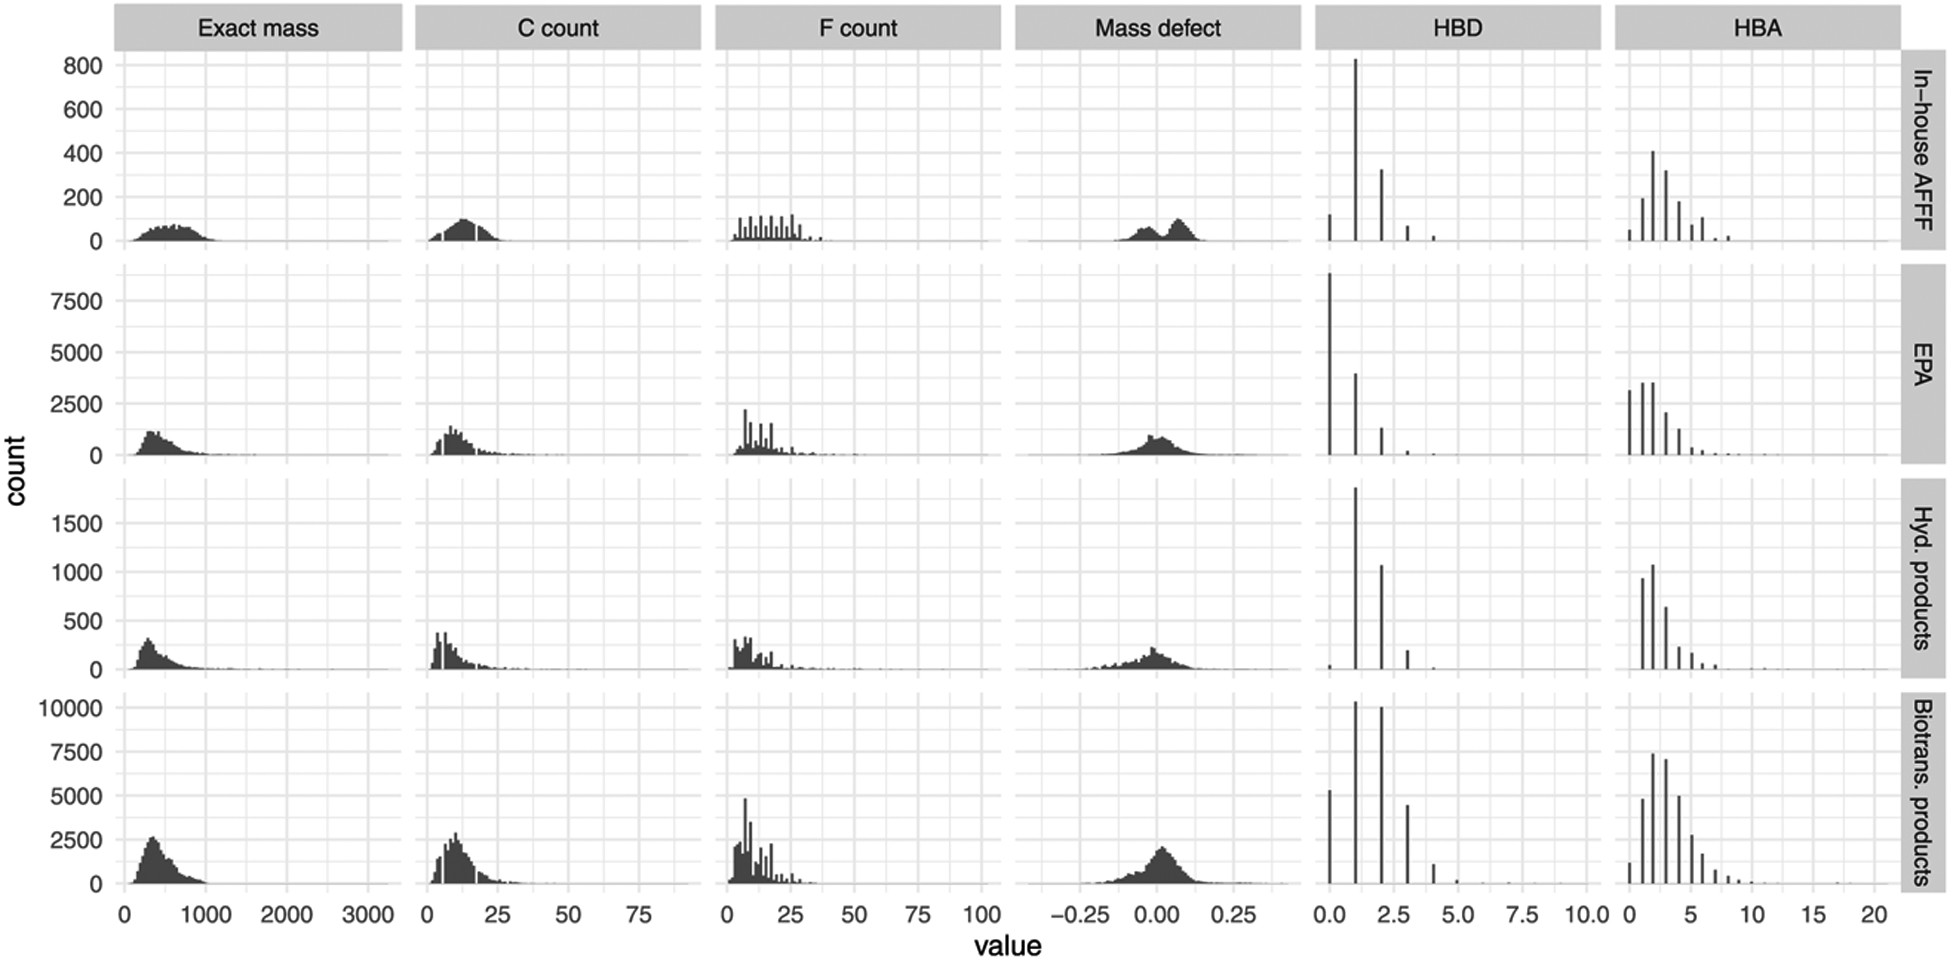
Molecular properties of PFASs from the in-house aqueous firefighting foam (AFFF) dataset, mass lists obtained from the USEPA Chemicals Dashboard, predicted hydrolysis products, and predicted biotransformation products.
Mass defect analysis is a common data filtering approach for isolating potential PFASs from complex mixtures analyzed by LC-HRMS.47 Here, we calculated the mass defect by subtracting the molecular weight rounded to zero decimal places (i.e., rounded nominal mass) from the exact molecular weight. Using this approach, PFASs typically give negative mass defects—due to their high fluorine counts—that provide a means for filtering out non-PFASs. However, our analysis shows that such an approach would likely eliminate a large number of potential structure matches given that a significant portion of known or predicted structures in our database had positive mass defects. For instance, the mass defect distributions for compounds from the in-house AFFF database are bimodal, likely due to the large number of AFFF compounds that contain nitrogen, which results in more positive mass defects. Table 1 shows the distribution of mass defects for the various PFAS groups by nitrogen content.
Table 1.
Mass Defect by chemical List and Nitrogen Content
| mass defect (mean ± std. dev.) | ||
|---|---|---|
| list | N = 0 | N > 0 |
| hyd. products | −0.0277 ± 0.0761 | 0.0376 ± 0.0915 |
| in-house AFFF | −0.0019 ± 0.0585 | 0.0772 ± 0.0263 |
| EPA | 0.0001 ± 0.0733 | 0.0567 ± 0.0745 |
| biotrans. products | 0.0018 ± 0.0718 | 0.0632 ± 0.0547 |
Extended PFAS Suspect Screening Analysis.
In total, the final molecular database contained 17 047 unique molecular formulas from 39 369 unique structures, greatly expanding the chemical space available for annotating nontarget PFASs by molecular formula or accurate mass look-up approaches. Using the constructed molecular database, we reanalyzed a mass list of suspected PFASs recently detected in surface water using LC-HRMS methods.19 Using the reported neutral molecular weights for detected compounds, 119 of 258 features had at least one database formula match with molecular weight within 10 ppm. Individual features had 1–4 unique molecular formulas within 10 ppm, giving a total of 164 molecular formulas matched. In the original analysis, McCord et al. (2019) reported 36 identifications at the molecular formula level, of which 19 had structure proposals. Reannotation of these HRMS analyses using the database described herein represents a more than fivefold increase in the number of possible PFAS structure annotations for that dataset. Specifically, database mass matches within the applied tolerance gave possible structure matches performula ranging from 1 to 59 with an average of more than five possible unique structures per annotated molecular formula and a total of 661 structure candidates for the entire dataset. This large increase in the number of structure candidates demonstrates the need for MS/MS analysis to differentiate among possible structure isomer/isobar annotations within a given query.
Unique structures in the constructed database totaled 39 369 and >43% of molecular formulas in the database had more than one associated structure. Therefore, database matching by molecular formula alone will often result in multiple annotations for a single detected feature. Furthermore, database matching by molecular formula or accurate mass alone is susceptible to false-positive identifications because measurements are often made with insuffcient mass accuracy to uniquely determine the molecular formula by the mass-to-charge (m/z) ratio alone. To increase the confidence in structure assignment, analysis of MS/MS data is highly desirable. However, most compounds in our molecular database did not have available experimental MS/MS data within free or commercial spectral libraries. We addressed this shortcoming by constructing an in silico PFAS MS/MS spectral library to accompany our molecular database and provide a unique resource for structural annotation of PFAS from experimental HRMS/MS data.
Predicted MS/MS.
Predicted fragmentation spectra were generated for all input PFASs and any predicted transformation products using the CFM algorithm, which differs from most other in silico fragmentation approaches in that it predicts both the m/z and intensity of fragment ions using fragmentation rules trained by machine learning.30 Therefore, resultant predicted spectra can be searched using conventional spectral library searching techniques. Like other predictive fragmentation models, CFM is based on a training set of reference spectra. Where model training sets contain disproportionately high numbers of specific structural classes of interest, resultant models may exhibit bias in predictive performance toward those particular structural classes, to the detriment of general utility. Notably, in the present work, the presence of many PFAS in the training set would bias CFM performance toward PFAS. Therefore, we evaluated the presence of PFAS in the CFM training set and found that a total of eight reference spectra—out of a total of >7000 training spectra—contained a −CF2CF2− moiety, reflecting the paucity of PFAS MS/MS in curated libraries. This result indicates that the CFM model used here was not overly biased toward PFAS. The CFM algorithm was applied to structures (encoded as InChI strings) for each molecule in both positive and negative electrospray ionization modes. Prediction in positive ionization mode gave 39 081 spectra, while negative ionization yielded 36 604 spectra. In both cases, the total number of spectra predicted did not match the number of input molecules, which arises when CFM does not detect an ionizable moiety or predict reactions.
The accuracy of spectral library matching based on predicted mass spectra depends on the fidelity with which the chosen algorithm predicts the intensity and mass position of ion species. At present, due to heavy reliance on training sets, in silico fragmentation tools invariably omit relevant fragmentation pathways or overpredict fragmentation. Predicted mass spectra are nonetheless useful for ranking putative structure identifications when multiple possible structure annotations are possible or for adding to the weight of evidence for a proposed structure when only one proposed structure annotation is available. To demonstrate this utility, the PFAS database was queried by the exact neutral mass of the [M − H]− pseudo molecular ion of N-ethyl perfluoro-1-decane sulfonamido acetic acid (N-EtFDSAA). The four resultant putative structure annotations were ranked according to their scaled dot-product similarity to the authentic N-EtFDSAA MS/MS spectrum (Figure 5), which resulted in top-rank for the true structure. Inspection of the predicted mass spectra in Figure 5 reveals that even though the predicted spectra for the true annotation vary significantly from the experimental spectrum, the presence of diagnostic fragment ions allows for the correct ranking of the true structure relative to the other postulated structures. This result indicates that the use of predicted MS/MS spectral matching is useful for ranking putative structure assignments in the nontargeted analysis of PFASs.
Figure 5.
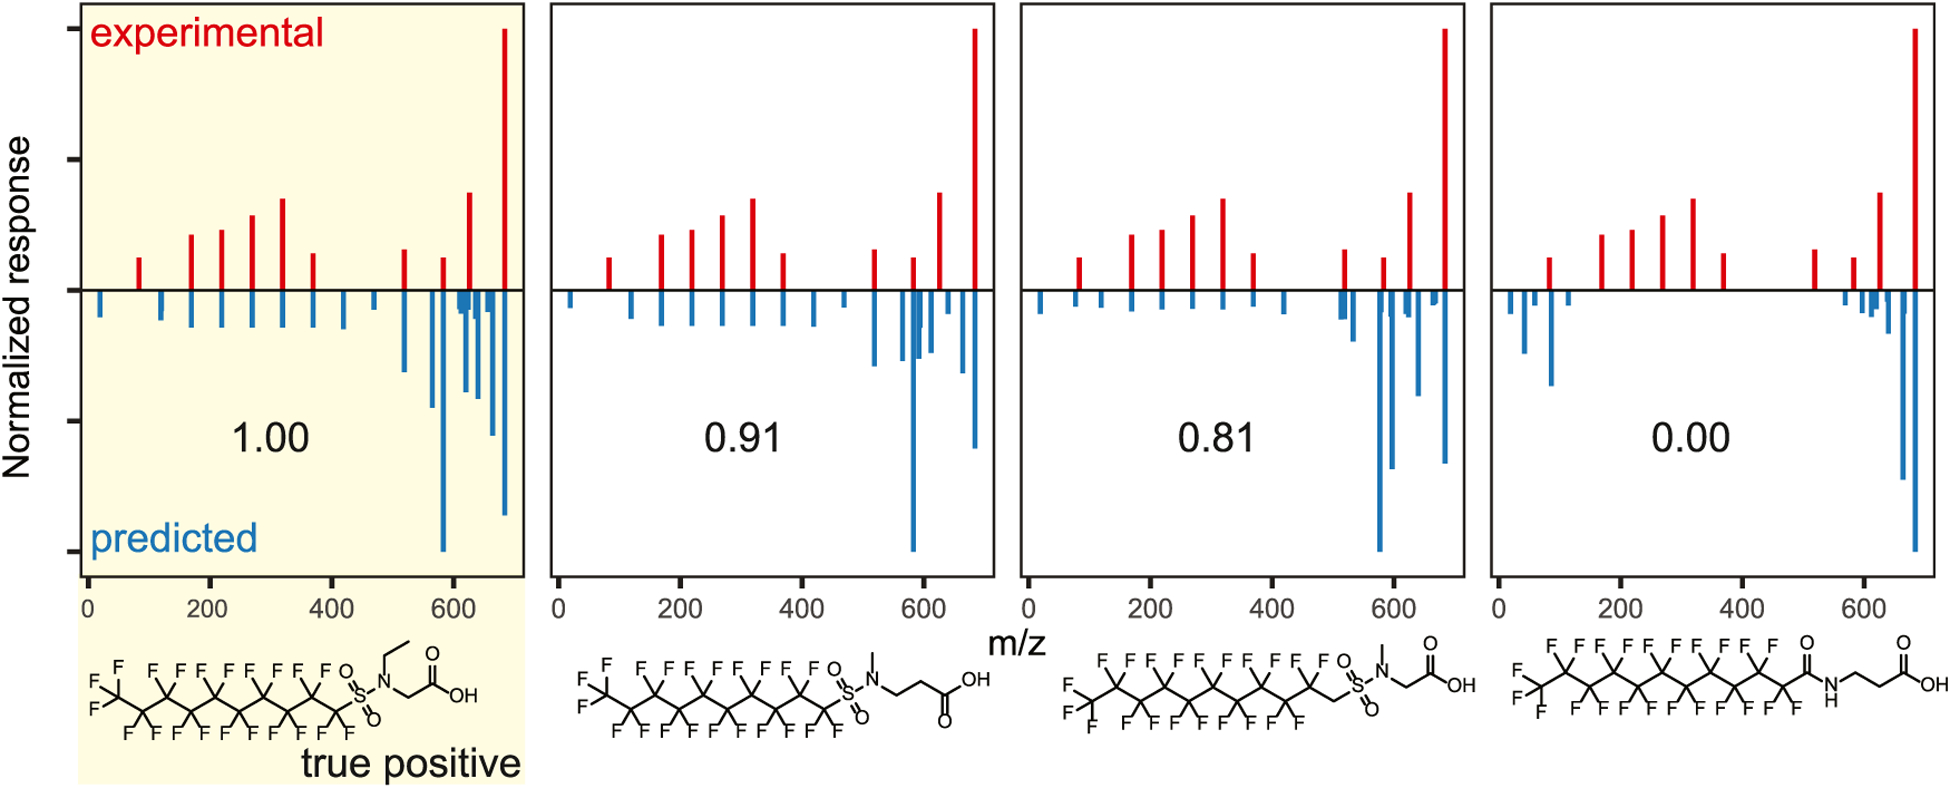
Results of neutral accurate mass database search and spectral similarity comparison for the negative ion mass spectrum of N-ethyl perfluoro-1-decane sulfonamido acetic acid. The top panels (red) depict the experimental mass spectrum. The botom panels (blue) show the predicted mass spectrum for each of the depicted structures. The scaled dot-product similarity is printed in each predicted mass spectrum. Spectral similarity searching returned the correct structure as the top-ranked result (i.e., true-positive identification).
To evaluate the performance of the in silico spectral library searching approach, we compared predicted spectra for PFASs for which we had access to HRMS MS/MS spectra within spectral libraries (i.e., our test set), using dot-product similarity as a scoring metric. The test set contained 301 MS/MS spectra from 277 unique compounds acquired using atmospheric pressure ionization (i.e., electrospray or atmospheric pressure chemical ionization) on Orbitrap (N = 43) or time-of-flight instruments (N = 258). Negative ion spectra totaled 174, while positive ion spectra totaled 127. The test set pairwise structure similarity—as Tanimoto fingerprint similarity—ranged from 0.03 to 1.0 with an interquartile range of 0.27–0.57, indicating a high degree of structural diversity in the test set. Furthermore, the test set contained 85 PFAS from the OECD Global Database of PFASs, which represent manufactured PFAS (i.e., those present in technical mixtures and product formulations). Conversely, the 192 test set PFASs not contained in the OECD database represent structures for which experimental spectra were available but that may not be well-characterized, intentionally manufactured PFASs. The large number of non-OECD PFASs result primarily from our in-house AFFF database, which contains various nonregistered PFASs identified as byproducts in commercial products or in forced-degradation studies (e.g., environmental biotransformation).
In assessing the annotation of test set spectra by predicted MS/MS, we assumed that ion-phase fragmentation processes do not vary according to mass spectrometer design or manufacturer and therefore differences in instrument-type should not influence spectral matching. A similar assumption is applied when searching unknown spectra against commercial spectral libraries (e.g., NIST MS/MS) that contain tandem mass spectra acquired on instruments of varying design and performance. While the number of spectra was not evenly distributed among instrument types in our test set—the test set contained 43 Orbitrap and 258 time-of-flight spectra—we found that the difference on the mean dot-product similarities for correct annotations did not differ according to instrument-type (unpaired t-test, p > 0.01).
To understand the influence of various query strategies on library matching performance, the rank of the true structure was assessed when the set of possible structure matches contained structural isomers only (i.e., molecular formula look-up) or isobars (i.e., accurate molecular mass or m/z searches). Queries by accurate molecular mass simulate a situation where a previous software step has been used to calculate the neutral molecular weight of the precursor molecule based on the detected m/z and charge, while m/z searches used the precursor ion m/z to calculate potential neutral masses based on possible adduct ion species. For both molecular weight and m/z searches, we evaluated the influence of using accurately measured values vs nominal mass database queries.
Figure 6 shows the results of in silico spectral library annotation when searching with MS/MS spectra of known PFASs (our test set) when considering multiple candidate selection strategies. Figure 6a shows the cumulative fraction of test set spectra by the rank of the correct structure annotation according to the implemented structure candidate selection method. Figure 6b shows the distribution of the scaled dot-product similarity for correct and incorrect annotations. Scaled dot-product spectral similarity was higher across various search strategies for true-positive annotations than for false-positive annotations within queries (p < 0.005, unpaired Mann–Whitney U test), indicating that correct structure annotations had predicted mass spectra that better matched the experimental mass spectra relative to other candidate molecules. Importantly, the number of candidate molecules varied among structure candidate selection methods, as shown in Figure 6c. Larger numbers of structure candidates in this case also increased structural diversity among candidate molecules and concurrently increased the chance that predicted MS/MS spectra could rule-out candidates with predicted fragments inconsistent with the experimental spectrum.
Figure 6.
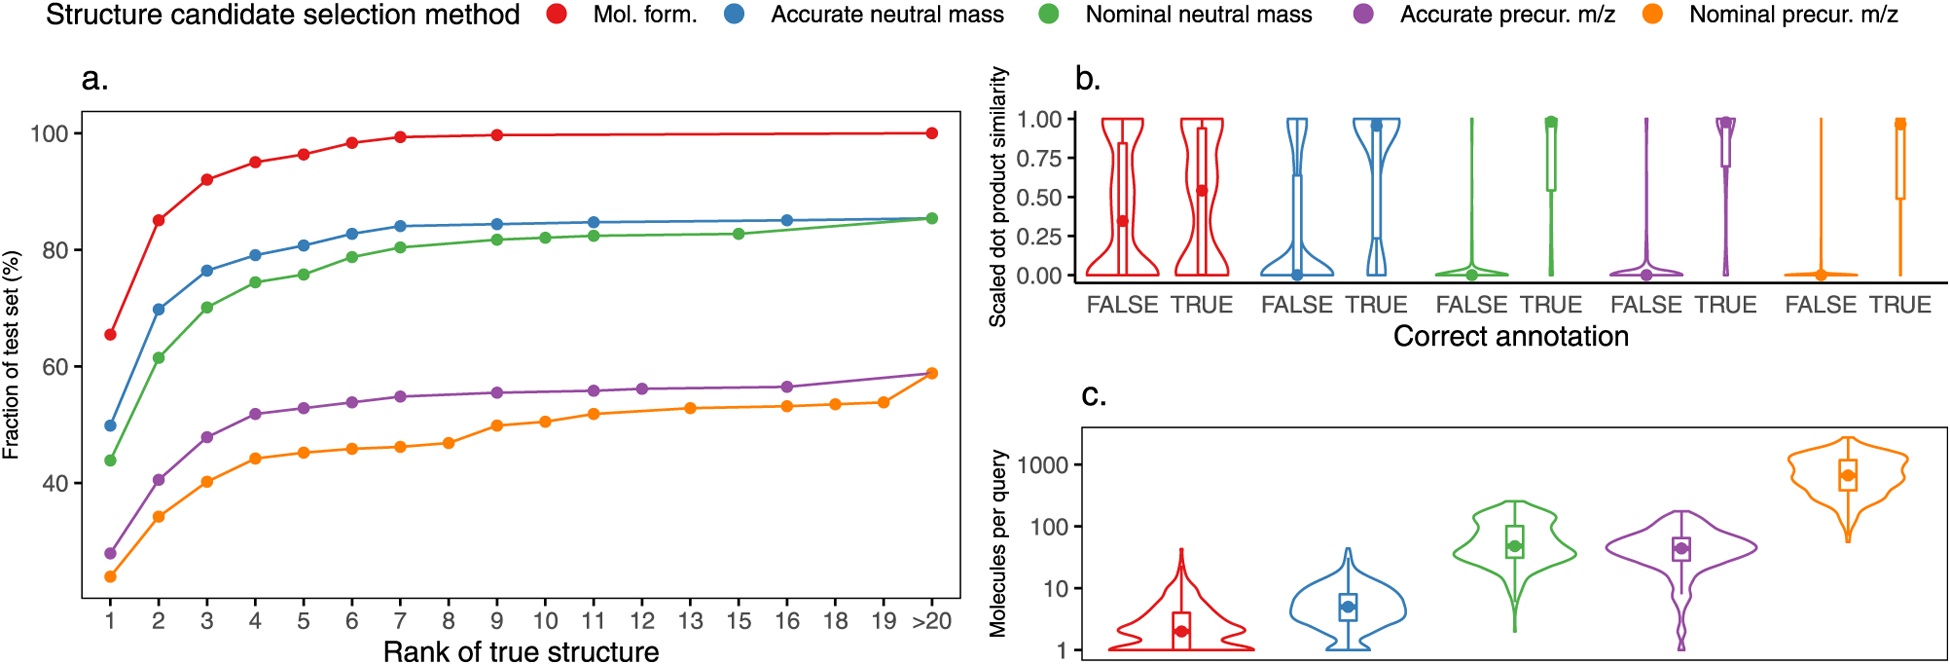
Results of searching 301 experimental MS/MS spectra against the constructed in silico MS/MS library by various search strategies. For each search strategy, the experimental spectra were compared to the subset of database molecules corresponding to the search strategy (e.g., isomers, isobars). (a) Fraction of test set spectra by the rank of the true structure by various search strategies. (b) Scaled dot-product similarities for correct and incorrect structure annotations by different search strategies. (c) Number of unique structures per query by different search strategies. Violin plots in panels (b) and (c) show the estimated kernel density of the data distribution, while the inlaid box and whisker plots show the median value, interquartile range, and extreme values for each distribution.
Selecting candidate structures via molecular formula look-up gave the highest true-positive rate for the test set as indicated by the >65% of instances where the correct structure was top-ranked. In contrast, accurate and nominal precursor m/z searches provided the lowest true-positive rates for the test set. It is to be expected that more restrictive structure candidate selection strategies are advantageous for increasing the likelihood of correct annotation, if those strategies are based on rigorous and robust filtering methods (e.g., definitive molecular formula assignment via isotope fine structure assessment or fragment ion formula assignment).
Results of the test set analysis indicate that as the number of candidate molecules increased, the utility of predictive mass spectra to correctly discriminate true vs false structures annotations increased concurrently, as illustrated by separation of average scaled dot-product similarity values for correct vs incorrect annotations (Figure 6b) in different candidate selection strategies. In the case where molecular formula look-up was used to select candidate structures, >65% test set spectral annotations ranked the correct structure as the top result. More than 68% of molecular formula look-up queries returned >1 structural candidate and in 50% of those cases the correct structure was top-ranked. This result illustrates that in choosing among structural isomers using MS/MS spectral matching, predicted mass spectra may struggle to distinguish among highly structurally similar isomers, due to a lack of predicted diagnostic fragment ions. This represents the limits of achievable annotation success using conventional MS/MS with typical fragmentation modes (e.g., CID). More extensive multistage MSn or alternative fragmentation mode strategies will be required to overcome this limit.
The challenges associated with ranking highly structurally similar candidate molecules by predicted MS/MS alone highlight the need for weight-of-evidence-based identification schemes that include experimental data (e.g., presence of homologues series) or environmental context (e.g., known suspected PFAS source material). Work is currently underway to investigate workflows for integrating the spectral matching approach described herein with PFAS occurrence data to enable holistic PFAS identification in environmental samples.
Overall, we found that CFM-predicted MS/MS spectra provided a useful tool for annotating experimental PFAS spectra with chemical structure and enabled a quantitative measure of the spectral match and a weight-of-evidence approach to structure assignment. The strategy employed here will provide a means for providing additional evidence for the occurrence of nontarget PFAS structures detected by HRMS.
CONCLUSIONS
In this study, we have demonstrated the construction and utility of a comprehensive PFAS structure database and an accompanying in silico MS/MS spectral library that includes both known PFAS and predicted PFAS transformation products. This resource will greatly enhance HRMS identification of previously unreported or unexpected PFASs in complex environmental media by providing a diverse and comprehensive molecular database of commercially relevant PFASs and their transformation products, along with a quantitative metric for ranking postulated structure annotations based on MS/MS data. Furthermore, the use of open-source cheminformatics tools, code availability, and automated data processing steps makes this approach both reproducible and easily extensible as new information on novel PFASs becomes available or in silico transformation and MS/MS prediction algorithm are improved.
Supplementary Material
ACKNOWLEDGMENTS
This work was supported by funding from the North Carolina Per- and Polyfluoroalkyl Substances Testing Network (https://ncpfastnetwork.com) ,the Michael and Annie Falk Foundation, and a grant from NIEHS (U2C ES030351) to P.L.F.
Footnotes
Supporting Information
The Supporting Information is available free of charge at https://pubs.acs.org/doi/10.1021/acs.analchem.0c04109.
Vignette describing and demonstrating the code for reproducing the described database and performing searches (PDF)
Complete contact information is available at: https://pubs.acs.org/10.1021/acs.analchem.0c04109
The authors declare no competing financial interest.
Contributor Information
Gordon J. Getzinger, Department of Civil and Environmental Engineering and Nicholas School of the Environment, Duke University, Durham, North Carolina 27708-0287, United States.
Christopher P. Higgins, Department of Civil and Environmental Engineering, Colorado School of Mines, Golden, Colorado 80401, United States.
P. Lee Ferguson, Department of Civil and Environmental Engineering and Nicholas School of the Environment, Duke University, Durham, North Carolina 27708-0287, United States.
REFERENCES
- (1).Moody CA; Field JA Environ. Sci. Technol 2000, 34, 3864–3870. [Google Scholar]
- (2).Sun M; Arevalo E; Strynar M; Lindstrom A; Richardson M; Kearns B; Pickett A; Smith C; Knappe DR U. Environ. Sci. Technol. Lett 2016, 3, 415–419. [Google Scholar]
- (3).Hu XC; Andrews DQ; Lindstrom AB; Bruton TA; Schaider LA; Grandjean P; Lohmann R; Carignan CC; Blum A; Balan SA; Higgins CP; Sunderland EM Environ. Sci. Technol. Lett 2016, 3, 344–350. [DOI] [PMC free article] [PubMed] [Google Scholar]
- (4).Schultz MM; Higgins CP; Huset CA; Luthy RG; Barofsky DF; Field JA Environ. Sci. Technol 2006, 40, 7350–7357. [DOI] [PMC free article] [PubMed] [Google Scholar]
- (5).Begley TH; White K; Honigfort P; Twaroski ML; Neches R; Walker RA Food Addit. Contam 2005, 22, 1023–1031. [DOI] [PubMed] [Google Scholar]
- (6).Dreyer A; Neugebauer F; Neuhaus T; Selke S Organohalogen Compd. 2014, 76, 1211–1213. [Google Scholar]
- (7).Shoeib M; Harner T; Webster GM; Lee SC Environ. Sci. Technol 2011, 45, 7999–8005. [DOI] [PubMed] [Google Scholar]
- (8).Conder JM; Hoke RA; de Wolf W; Russell MH; Buck RC Environ. Sci. Technol 2008, 42, 995–1003. [DOI] [PubMed] [Google Scholar]
- (9).Calafat AM; Kuklenyik Z; Reidy JA; Caudill SP; Tully JS; Needham LL Environ. Sci. Technol 2007, 41, 2237–2242. [DOI] [PubMed] [Google Scholar]
- (10).Calafat AM; Wong L-Y; Kuklenyik Z; Reidy JA; Needham LL Environ. Health Perspect 2007, 115, 1596–1602. [DOI] [PMC free article] [PubMed] [Google Scholar]
- (11).Kato K; Wong L-Y; Jia LT; Kuklenyik Z; Calafat AM Environ. Sci. Technol 2011, 45, 8037–8045. [DOI] [PubMed] [Google Scholar]
- (12).Apelberg BJ; Witter FR; Herbstman JB; Calafat AM; Halden RU; Needham LL; Goldman LR Environ. Health Perspect 2007, 115, 1670–1676. [DOI] [PMC free article] [PubMed] [Google Scholar]
- (13).Maisonet M; Terrell ML; McGeehin MA; Christensen KY; Holmes A; Calafat AM; Marcus M Environ. Health Perspect 2012, 120, 1432–1437. [DOI] [PMC free article] [PubMed] [Google Scholar]
- (14).Wang Z; DeWitt JC; Higgins CP; Cousins IT Environ. Sci. Technol 2017, 51, 2508–2518. [DOI] [PubMed] [Google Scholar]
- (15).McCord J; Strynar M Environ. Sci. Technol 2019, 53, 4717–4727. [DOI] [PMC free article] [PubMed] [Google Scholar]
- (16).Howard PH; Muir DC G. Environ. Sci. Technol 2010, 44, 2277–2285. [DOI] [PubMed] [Google Scholar]
- (17).D’Agostino LA; Mabury SA Environ. Sci. Technol 2014, 48, 121–129. [DOI] [PubMed] [Google Scholar]
- (18).Liu Y; Pereira ADS; Martin JW Anal. Chem 2015, 87, 4260–4268. [DOI] [PubMed] [Google Scholar]
- (19).McCord J; Strynar M Environ. Sci. Technol 2019, 53, 4717–4727. [DOI] [PMC free article] [PubMed] [Google Scholar]
- (20).Newton S; McMahen R; Stoeckel JA; Chislock M; Lindstrom A; Strynar M Environ. Sci. Technol 2017, 51, 1544–1552. [DOI] [PMC free article] [PubMed] [Google Scholar]
- (21).Barzen-Hanson KA; Roberts SC; Choyke S; Oetjen K; McAlees A; Riddell N; McCrindle R; Ferguson PL; Higgins CP; Field JA Environ. Sci. Technol 2017, 51, 2047–2057. [DOI] [PubMed] [Google Scholar]
- (22).Washington JW; Rosal CG; McCord JP; Strynar MJ; Lindstrom AB; Bergman EL; Goodrow SM; Tadesse HK; Pilant AN; Washington BJ; Davis MJ; Stuart BG; Jenkins TM Science 2020, 368, 1103. [DOI] [PMC free article] [PubMed] [Google Scholar]
- (23).Landrum G RDKit: Open-source cheminformatics; 2006. [Google Scholar]
- (24).Swain M MolVS. https://molvs.readthedocs.io/en/latest/.
- (25).Williams AJ; Grulke CM; Edwards J; McEachran AD; Mansouri K; Baker NC; Patlewicz G; Shah I; Wambaugh JF; Judson RS; Richard AM J. Cheminf 2017, 9, No. 61. [DOI] [PMC free article] [PubMed] [Google Scholar]
- (26).Tebes-Stevens C; Patel JM; Jones WJ; Weber EJ Environ. Sci. Technol 2017, 51, 5008–5016. [DOI] [PMC free article] [PubMed] [Google Scholar]
- (27).SMARTS-A Language for Describing Molecular Patterns. https://www.daylight.com/dayhtml/doc/theory/theory.smarts.html.
- (28).Wicker J; Lorsbach T; Gütlein M; Schmid E; Latino D; Kramer S; Fenner K Nucleic Acids Res. 2016, 44, D502–D508. [DOI] [PMC free article] [PubMed] [Google Scholar]
- (29).Djoumbou-Feunang Y; Fiamoncini J; Gil-de-la-Fuente A; Greiner R; Manach C; Wishart DS J. Cheminf 2019, 11, No. 2. [DOI] [PMC free article] [PubMed] [Google Scholar]
- (30).Allen F; Greiner R; Wishart D Metabolomics 2015, 11, 98–110. [Google Scholar]
- (31).Horai H; Arita M; Kanaya S; Nihei Y; Ikeda T; Suwa K; Ojima Y; Tanaka K; Tanaka S; Aoshima K; Oda Y; Kakazu Y; Kusano M; Tohge T; Matsuda F; Sawada Y; Hirai MY; Nakanishi H; Ikeda K; Akimoto N; Maoka T; Takahashi H; Ara T; Sakurai N; Suzuki H; Shibata D; Neumann S; Iida T; Tanaka K; Funatsu K; Matsuura F; Soga T; Taguchi R; Saito K; Nishioka TJ Mass Spectrom. 2010, 45, 703–714. [DOI] [PubMed] [Google Scholar]
- (32).Gatto L; Lilley KS Bioinformatics 2012, 28, 288–289. [DOI] [PubMed] [Google Scholar]
- (33).Butt CM; Muir DCG; Mabury SA Environ. Toxicol. Chem 2014, 33, 243–267. [DOI] [PubMed] [Google Scholar]
- (34).Harding-Marjanovic KC; Houtz EF; Yi S; Field JA; Sedlak DL; Alvarez-Cohen L Environ. Sci. Technol 2015, 49, 7666–7674. [DOI] [PubMed] [Google Scholar]
- (35).Mejia-Avendaño S; Vo Duy S; Sauvé S; Liu J Environ. Sci. Technol 2016, 50, 9923–9932. [DOI] [PubMed] [Google Scholar]
- (36).Shaw DMJ; Munoz G; Bottos EM; Duy SV; Sauve S; Liu J; Van Hamme JD Sci. Total Environ 2019, 647, 690–698. [DOI] [PubMed] [Google Scholar]
- (37).Zhang S; Lu X; Wang N; Buck RC Chemosphere 2016, 154, 224–230. [DOI] [PubMed] [Google Scholar]
- (38).Kishi T; Arai MJ Hazard. Mater 2008, 159, 81–86. [DOI] [PubMed] [Google Scholar]
- (39).Li R; Munoz G; Liu Y; Sauvé S; Ghoshal S; Liu JJ Hazard. Mater 2019, 362, 140–147. [DOI] [PubMed] [Google Scholar]
- (40).Field JA; Seow J Crit. Rev. Environ. Sci. Technol 2017, 47, 643–691. [Google Scholar]
- (41).Yu X; Nishimura F; Hidaka T Sci. Total Environ 2018, 610–611, 776−785. [DOI] [PubMed] [Google Scholar]
- (42).D’Agostino LA; Mabury SA Environ. Toxicol. Chem 2017, 36, 2012–2021. [DOI] [PubMed] [Google Scholar]
- (43).Dasu K; Liu J; Lee LS Environ. Sci. Technol 2012, 46, 3831–3836. [DOI] [PubMed] [Google Scholar]
- (44).Lee H; D’eon J; Mabury SA Environ. Sci. Technol 2010, 44, 3305–3310. [DOI] [PubMed] [Google Scholar]
- (45).Rhoads KR; Janssen EML; Luthy RG; Criddle CS Environ. Sci. Technol 2008, 42, 2873–2878. [DOI] [PubMed] [Google Scholar]
- (46).Houtz EF; Sedlak DL Environ. Sci. Technol 2012, 46, 9342–9349. [DOI] [PubMed] [Google Scholar]
- (47).Strynar M; Dagnino S; McMahen R; Liang S; Lindstrom A; Andersen E; McMillan L; Thurman M; Ferrer I; Ball C Environ. Sci. Technol 2015, 49, 11622–11630. [DOI] [PubMed] [Google Scholar]
Associated Data
This section collects any data citations, data availability statements, or supplementary materials included in this article.
Supplementary Materials
Data Availability Statement
The database described herein may be accessed through the Duke University Research Repository under DOI 10.7924/r4c53n875 (https://doi.org/10.7924/r4c53n875). To facilitate batch spectral prediction for large numbers of molecules, collection and storage of the resultant spectra, and spectral similarity searching, we developed an open-source R-extension called cfmR, which is available on Github at https://github.com/gjgetzinger/cfmR. Executable scripts for generating the database and spectral library and for replicating the analysis described herein can also be found on Github at https://github.com/gjgetzinger/PFAScreeneR.


