Abstract
We report a multiplexed imaging mass spectrometry method which spatially localizes and selectively accesses the extracellular matrix on formalin-fixed paraffin-embedded tissue sections. The extracellular matrix (ECM) consists of 1) fibrous proteins, post-translationally modified (PTM) via N- and O-linked glycosylation, as well as hydroxylation on prolines and lysines; and 2) glycosaminoglycan-decorated proteoglycans. Accessing all these components poses a unique analytical challenge. Conventional peptide analysis via trypsin inefficiently captures ECM peptides due to their low abundance, intra- and inter-molecular crosslinking, and PTMs. In previous studies, we have developed Matrix Assisted Laser Desorption Ionization imaging mass spectrometry (MALDI-IMS) techniques to capture collagen peptides via Collagenase Type III digestion, both alone and after N-glycan removal via PNGaseF digest. However, in fibrotic tissues the buildup of ECM components other than collagen type proteins, including elastin and glycosaminoglycans, limits efficacy of any single enzyme to access the complex ECM. Here, we have developed a novel serial enzyme strategy to define the extracellular matrix, including PTMs, from a single tissue section for MALDI-IMS applications.
Keywords: multiplexed, imaging mass spectrometry, chondroitin sulfate, N-glycans, elastin, collagen
1. Introduction
The extracellular matrix (ECM) consists of the non-cellular components of tissues and provides essential biochemical and biomechanical signaling [1]. The ECM is a complex environment of fibrous type proteins – such as collagen, elastin, and fibronectin – as well as proteoglycans, which consist of sulfated glycosaminoglycan (GAGs) chains covalently bound to a core protein. The GAGs present in the ECM can be sulfated (chondroitin sulfate, heparan sulfate, and keratan sulfate) or non-sulfated (hyaluronic acid) [2]. The most abundant fibrous proteins are collagen type proteins [1]. Collagens are both intra- and inter-molecularly crosslinked with elastin and other proteoglycans at mainly lysine residues. These proteins are also abundantly post-translationally modified, with hydroxyproline, hydroxylysine, and N- and O-linked glycans [3, 4]. Post-translational modifications (PTMs) at lysine residues as well as abundant intra- and intermolecular crosslinking of ECM components make this environment a unique analytical challenge for mass spectrometry-based approaches. To date, no single enzymatic targeting technique can elucidate all constituents of the extracellular matrix.
Enzymatically targeted techniques have been developed recently for multi-omics studies and can analyze tissue glycomics, glycoproteomics, and/or proteomics from a single sample [5–7]. These techniques are largely serial LC-MS/MS strategies applied to fresh frozen tissue samples. While serial LC-MS/MS techniques allow for a large amount of identifications, the link between -omics data and tissue morphological structure is lost. Imaging Mass Spectrometry (IMS) methods, however, can be used to visualize the spatial distribution of analytes within tissue sections. One such IMS technique is Matrix-Assisted Laser Desorption/Ionization (MALDI) Imaging Mass Spectrometry (IMS). MALDI-IMS is a robust proteomic technique that can spatially map tryptic peptides from histological tissue sections [8]. This is done by spraying the tissue with a thin, uniform layer of trypsin that, when analyzed in parallel to high resolution accurate mass proteomics, allows for the relative quantitation and localization of tryptic peptide sequences to specific regions of the tissue. Although trypsin-based ECM-IMS techniques have been developed, these approaches decellularize fresh, unfixed tissue which is not an option for clinically archived formalin-fixed paraffin embedded (FFPE) tissue [9]. Novel MALDI-IMS techniques have been developed to enzymatically target ECM proteins via collagenase type III (COLase3) and elastase [10, 11], allowing peptide tissue mapping of ECM proteins that are largely trypsin-resistant.
In this study, we used MALDI-IMS techniques to visualize and relatively quantify in situ chondroitin sulfate (CS) GAGs, N-glycans and ECM peptides and proteoglycans from a single tissue section after serial treatment with enzymes. PNGaseF has been used to release N-glycans from thin FFPE tissue sections followed by MALDI-IMS [12]. Recently, PNGaseF and trypsin have been used in tandem, colocalizing the N-glycome to the tryptic proteome [13, 14]. Additionally, our lab has combined histological staining with MALDI-IMS to map complex ECM proteins in thin FFPE tissue sections [10, 11, 15]. While other studies have used IMS techniques to analyze GAG fragments [16], we outline here the first enzymatically targeted study of chondroitin sulfate GAGs via MALDI-IMS techniques. By combining these enzymatic approaches, comprehensive mining of protein translational and post-translational information becomes possible. This is especially useful for understanding the complex ECM profile as GAG, N-glycan, collagen, and ECM peptide data can be analyzed from one FFPE tissue section.
2. Materials and Methods
2.1. Materials and Chemicals
All solutions were prepared using double distilled or HPLC grade water, following all necessary safety and waste disposal regulations. Xylenes, 200 proof ethanol was purchased from Fisher Scientific (Pittsburgh, PA, USA). Acetonitrile, Ammonium Bicarbonate, Calcium Chloride, Formic Acid, EDTA, Trizma Base, and Chondroitinase ABC were purchased from Sigma-Aldrich (St. Louis, MO, USA). PNGase F PRIME was purchased from N-Zyme scientific (Charleston, SC, USA). Collagenase type III (COLase3) (C. histolyticum) was purchased from Worthington Biochemical (Lakewood, NJ, USA). Porcine MMP12 (elastase) was purchased from Alfa Aesar (Fisher Scientific, Pittsburgh, PA).
2.2. Specimens
Aortic valve tissue biopsy was procured through the Vanderbilt Core Laboratory for Cardiovascular Translational and Clinical Research and the National Disease Research Interchange. Tissue procurement for banking was approved by the Vanderbilt Institutional Review Board (IRB) and for project use by the Medical University of South Carolina IRB. Tissues were fixed overnight in 10% neutral buffered formalin (American Mastertech), cut through the central portion of the cusp, and embedded in paraffin blocks.
2.3. Tissue Preparation & Histology
Formalin-fixed, paraffin-embedded tissue was cut to 5 μm thick sections via microtome and mounted onto microscope slides (Tissue Tack, Polysciences, Inc., Warrington, PA, USA) then dehydrated overnight at 37°C prior to storage at room temperature. Tissues were stained with Verhoeff Van Gieson (Verhoeff solution for elastin; Van Gieson counterstain for collagen), Movat’s Pentachrome (Alcian Blue for GAG, Saffron for collagen, Resorcin-Fuchsin for elastin, and Woodstain Scarlet-Acid Fuchsin for muscle), or Alcian Blue alone (Polysciences, Inc.), following manufacturer’s protocols. All staining protocols included a hematoxylin counterstain.
For N-glycan and ECM peptide MALDI-IMS studies, FFPE tissues were prepared as previously described [11, 12]. Chondroitinase imaging preparation is novel to this study. Briefly, a 1 mg/mL Chondroitinase ABC (Sigma Aldrich, St. Louis, MO, USA) solution was prepared in 60mM Ammonium Acetate (pH 8 with sodium hydroxide). Solution was sprayed with a TM Sprayer M3 (HTX Imaging, Chapel Hill, NC, USA) under the following parameters: 15 passes, crisscross pattern, 3.0 mm track spacing, velocity of 1200 mm/min, and a dry time of zero. Before enzymatic digest, four antigen retrieval conditions (20 minutes, 95°C) were studied: 1) EDTA pH 8; 2) Citraconic Buffer pH 3; 3) Tris pH 9; and 4) Double antigen retrieval of Citraconic, wash and desiccate, then Tris.
FFPE aortic valve tissue sections were digested with COLase3 after serial treatment with chondroitinase, PNGaseF (N-Zyme Scientifics), elastase, and for MALDI-IMS experiments. Trypsin (Porcine Pancrease, Sigma Aldrich, St. Louis, MO, USA) was applied during preliminary studies to determine the effects of a single enzyme before COLase3. Spray conditions for all enzymes were as previously published [11, 12]. Samples were digested in high humidity at 37.5°C for either 2 hours (chondroitinase, PNGaseF) or 5 hours (elastase, COLase3). A 7 mg/mL solution of alpha-cyano-4-hydroxycinnamic acid (CHCA) matrix solution was prepared in 50% acetonitrile and 0.1% trifluoroacetic acid (TFA; for chondroitinase, PNGaseF imaging) or 1.0% TFA (for elastase, COLase3 imaging). CHCA matrix solution prepared for peptide imaging was spiked with a standard of 200 femtomole/L [Glu1]-fibrinopeptide B human (GluFib) (Sigma-Aldrich, St Louis, MO, USA). CHCA automatic spray conditions included: 79°C, 10 psi, 70 μl/min, 1300 velocity, and 14 passes with a 2.5 mm offset. Slides for peptide imaging were rapidly dipped (<1 second) in cold 5mM ammonium phosphate and immediately dried in a desiccator.
2.4. Chondroitin Sulfate Standard Preparation
A dilution series of digested CS standards were spotted onto a MALDI plate for CS peak validation. Standard used was chondroitin sulfate sodium salt from shark cartilage (Sigma Aldrich, St. Louis, MO, USA). Dilution shown was 5 μM of CS. Samples were brought up in 60 mM ammonium Acetate pH 8 and digested with 4 μg of Chondroitinase ABC. Samples were incubated overnight, shaking at 38°C. Samples were spotted with 0.5 μl of digest solution onto a MALDI plate and sprayed with CHCA as previously described.
2.5. Imaging Mass Spectrometry
Tissues were analyzed by MALDI-FT-ICR (7.0 Tesla solariX™ Legacy FT-ICR (Bruker Scientific, LLC, Bremen, Germany) operated in positive ion broadband mode over m/z range 500–4000. Laser settings used were 300 shots/pixel with a 45 μm stepsize. The average laser shot was measured to be approximately 25 μm x 30 μm. A lock mass of 1570.6768 (GluFib peptide) was used for peptide IMS studies. Images were visualized in FlexImaging v5.0 and analyzed using SCiLS 2017a version 5.00.9510 (Bruker Scientific, LLC, Bremen, Germany). All images shown are normalized to total ion current.
Chondroitin Sulfate fragmentation and ion mobility data was acquired using a Trapped Ion-Mobility Time-of-Flight Mass Spectrometer (timsTOF fleX) (Bruker Scientific, LLC, Bremen, Germany) equipped with a dual ESI/MALDI source. The samples were analyzed in positive ion Q-TOF mode and scanned at a mass range from 500 – 4000 m/z. The SmartBeam 3D 10 kHz laser was set to 33% power, scan range of 20 μm for X and Y and resulting field size of 24 μm for X and Y. The measured average spot size was 18.66 μm for X and 19.94 μm for Y. Additional instrument parameters for CS studies include: an ion transfer time of 125 μs, pre pulse storage time of 25 μs, a collision RF of 4000 Vpp, a collision energy of 15 eV, an ion energy in the quadrupole of 5 eV, a TIMS funnel 1 RF of 500 Vpp, a TIMS funnel 2 RF of 500 Vpp and a multipole RF of 500 Vpp. After MS acquisition, the data was imported into SCiLS Lab 2020a (Bruker Scientific, LLC, Bremen, Germany) and normalized to total ion current. CS peaks were identified by accurate mass using a database created in GlycoWorkBench [17].
Spectra shown were analyzed using mMass version 5.5.0. Putative peptide identifications are based on our previously acquired databases from many tissue samples on human aortic and same valvular tissues [10–11]. This analysis does not include peaks with biologically relevant spatial distribution that have not yet been sequenced. Percent fold change was calculated as: .
3. Results & Discussion
3.1. The Aortic Valve as a Prototype Model Tissue for ECM Analysis
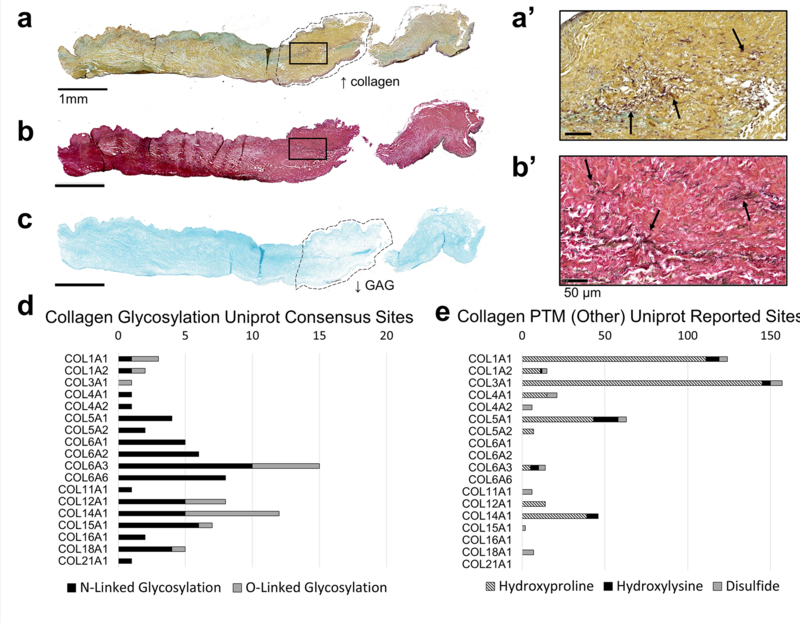
Human stenotic bicuspid aortic valves were used to develop this method since the hallmark of aortic valve stenosis is overproduction of ECM. Histopathological evaluation was done as an initial assessment of the tissue. Movat’s Pentachrome (MP) (Fig. 1a, 1a’), Verhoeff van Geison (VVG) (Fig. 1b, 1b’) and Alcian Blue stain (Fig 1c) show elastin, collagen, and GAGs are present throughout the length of the valve leaflet. A dense band of collagen can be seen clearly in the medial of the leaflet via the MP stain (Fig. 1a, outlined). In the same region, reduced GAG deposition can be seen via Alcian Blue staining (Fig. 1c, outlined). Elastin fibers can be seen at higher magnification to be present throughout the leaflet, both via MP and VVG staining (Fig. 1, a–b). These morphological features were used to show GAGs, collagen, and elastin are abundant throughout the length of the leaflet and to further validate localization of MALDI-IMS data in later figures.
Figure 1: Method development tissue (pediatric bicuspid aortic valve) displays aberrant ECM production and post-translational modifications ideal for ECM studies.
a. Movat’s Pentachrome staining with GAGs in blue, elastin in purple, and collagen in yellow. 20x magnification of the square in a is seen in a’. b. Verhoeff van Gieson staining with collagen in red/pink and elastin in purple/black. 20x magnification of the square in b is seen in b’. c. Alcian blue staining shown GAGs present throughout the valve. d. In silico PTM site count analysis of N- and O-linked glycans (d) and hydroxyproline, hydroxylysine, and disulfide modifications (e). Uniprot reported sites for each protein were obtained from the Uniprot compiled Amino Acid Modification database. Both published confirmed sites and sites identified by similarity and consensus sequences were included in d-e.
Potential regulation of collagen PTMs was quantified via in silico analysis (Fig. 1 d–e). Uniprot Amino Acid Modification database analysis of confirmed sites, similar sites, and consensus sequences shows that all collagen-type proteins identified via our COLase3 MALDI-IMS and LC-MS/MS method contain at least one N-linked glycosylation site (N-X-S/T site, where X is any amino acid besides proline), with as many as 15 sites per collagen-type protein. Previous analysis of acquired COLase3 using LC-MS/MS methods indicated that 4.8% of all ECM peptides identified in our database are potential glycopeptides (146 out of 3024 peptides have an N-X-S/T site) [10, 11]. Additionally, PTMs, such as hydroxyproline and hydroxylysine are abundant in collagen type proteins, with as many as 150 hydroxyproline sites present in COL3a1. These modifications on lysine residues prevent conventional tryptic digests from accessing ECM proteins [18, 19], indicating a targeted enzymatic strategy would be adventageous, including enzymes targeting N-glycosylation and proteomics databases searched for hydroxylysine and hydroxyproline.
Aortic valve tissues are comprised of both activated and inactivated valvular interstitial fibroblasts – the average size being approximately 5×30μm and 7×10μm, respectively. Additionally, these aortic valve tissues studied are relatively low cell density. A serial section of the valve sample shown in Figure 1 was measured to have an average cell density of 370 cells/mm2. These data suggest that a imaging mass spectrometry-based methodologies are conducted at an appropriate resolution for ECM-based studies in these tissues.
3.2. Imaging Mass Spectrometry Workflow
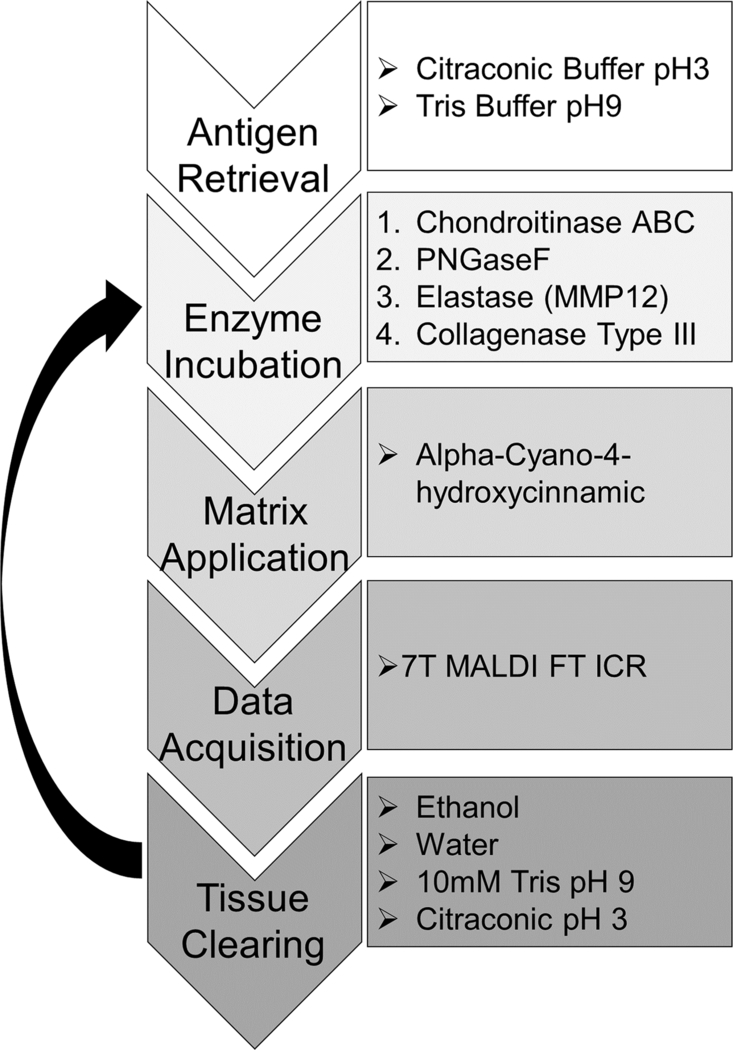
An overview of the optimized MALDI-IMS workflow can be seen in Figure 2. Optimization of PNGaseF, elastase, and COLase3 have been completed in previous studies [11, 12, 15]. Optimization of Chondroitinase ABC for MALDI-IMS included investigating antigen retrieval conditions, concentrations, incubation times, and optimal matrix application. Antigen retrieval steps (Citraconic Buffer pH3 and Tris pH9) were completed serially before the serial enzyme treatment. Specific washing steps to remove analytes were completed to prevent cross-contamination between imaging acquisitions [14]. Within this study, no significant reduction in spatial resolution was seen, as compared to the first image of the series.
Figure 2. MALDI-IMS multi-enzyme workflow.
A single FFPE tissue section is taken through four serial enzyme treatments to target CS GAGs, N-glycans, elastin, and collagen and other ECM peptides. Images are acquired via a MALDI-FT-ICR instrument between each enzyme treatment.
3.3. Method Optimization for Chondroitin Sulfate Imaging MS
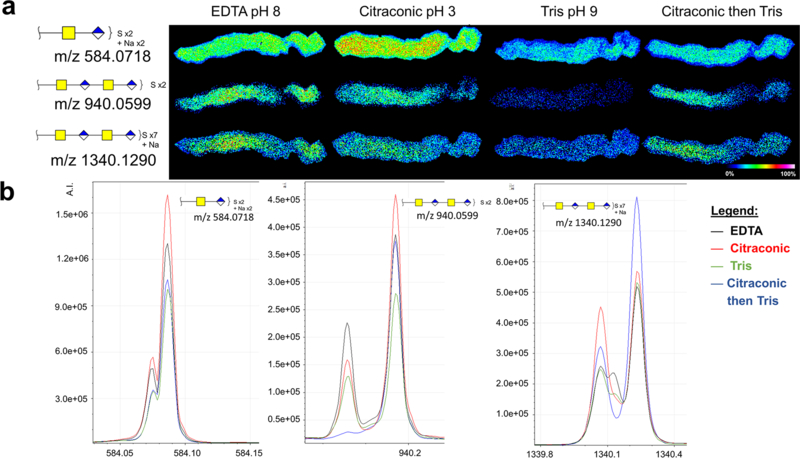
This method targets chondroitin sulfates (CS) via application of chondroitinase ABC. CS is an abundant glycosaminoglycan (GAG) of repeating glucuronic acid (GlcUA) and N-acetylgalactosamine (GalNAc) di-saccharides in the extracellular space, and are known to be upregulated in cardiac, pulmonary, and liver fibrosis [20–22]. Previous work has shown via LC-MS/MS analysis that tissue treated with chondroitinase ABC can be used to detect CS chains of 1–3 repeats in multiple sulfation states [7, 23, 24]. Similar results were seen in our studies. A single sulfated CS chain as well as two examples of multiply-sulfated dimers can be seen in Figure 3a–b. Previous LC-MS/MS-based studies have shown that other enzymes targeted to GAGs, such as hyaluronidase and heparan lysase, can be used in tandem to chondroitinase ABC to serially access the proteoglycome [5]. Ongoing studies aim to incorporate these enzymes into MALDI-IMS multi-enzyme workflows.
Figure 3: Chondroitinase ABC MALDI-IMS method is capable of imaging several chain lengths and sulfation states of CSs.
a. Antigen retrieval study on serial aortic valve tissue sections to determine optimal conditions for MALDI-IMS acquisition. Three representative CSs are shown. b. Corresponding peaks to images shown in a, with all four antigen retrieval conditions overlayed: EDTA (black); Citraconic (red); Tris (green); Citraconic then Tris (blue).
An antigen retrieval study was done to optimize the chrondroitinase IMS method (Fig. 3a). Antigen retrieval of FFPE tissues reverses protein chemical modification induced via formalin [25]. It is known that the pH of the antigen retrieval solution alters enzymatic access for purposes of MALDI IMS studies, with incubation time and temperature also playing role [26]. The pH category shown represents pH of different antigen retrieval conditions, suggesting differential specificity to CS under different antigen retrieval conditions (Fig 3a). Chondroitinase ABC preferentially cleaves CSs, however other GAG structural classes are cleaved when the digestion buffer is prepared at different pHs [27]. The final antigen retrieval method for the multi-enzyme study was condition #4 (Methods 2.3, Citraconic then Tris). While other conditions were more optimal for CS imaging, antigen retrieval for N-glycan and COLase3 imaging have been already optimized with Citraconic, pH 3 and Tris pH 9 buffers, respectively [11, 12].
The theoretical mass values for some chondroitinase products had a similar mass defect and m/z value as matrix peaks. For example, a single GalNAc-GlcUA chain has a theoretical m/z of 379.0794, while CHCA [2M+H]+ has a theoretical m/z of 379.0925 [28]. To confirm the peaks chosen did in fact correspond to CSs and not matrix, on-tissue fragmentation was performed using MALDI and trapped ion mobility combinations on a timsTOF fleX mass spectrometer. Peak m/z 1340.129 was fragmented via CID to obtain the MS/MS spectra seen in Supplemental Figure 1. Serially increasing collision voltages shows a loss of sulfate state, chain length, and chain formation with fragmented ions corresponding to GalNAc and GlcUA also seen. To further validate this, ion mobility analysis was also performed on- and off-tissue. Supplemental Figure 2 shows that the on-tissue ion mobility data displays two unique populations – one corresponding to matrix-only signal taken off tissue, and one corresponding to tissue treated with chondroitinase ABC. These experiments were also done on spotted CS standards for further validation (Supp. Fig. 2). Trapped ion mobility analysis can be used in further studies to not only to distinguish between isobaric matrix and GAG peaks, but also between isobaric GAG species of differential sulfation states and acid species [29, 30].
3.4. N-glycosylation imaging may be improved by chondroitin sulfate removal
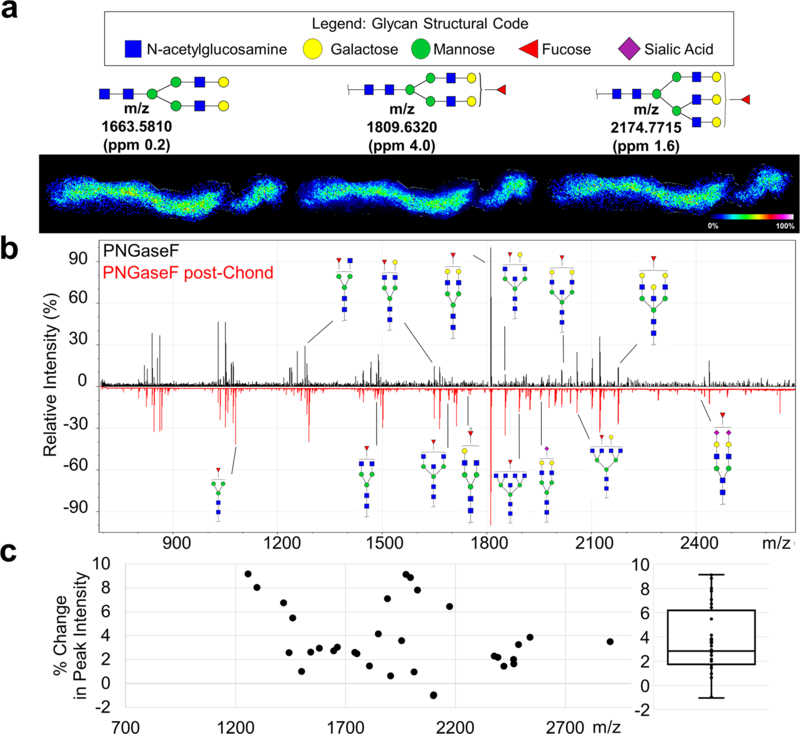
N-glycosylation patterns were then obtained from the same tissue section, with N-glycan signal improved by removal of GAGs (Fig. 4a–b). A total of 25 N-glycans were identified by MALDI-IMS after CS-removal, while only 10 N-glycans were identified using PNGase F alone. Quantification of N-glycan peak intensity shows that N-glycan signal was improved by removal of CSs, with a maximum of 9.2% and a mean of 3.7 ± 2.8% increase in peak intensity after CS removal, averaged across 32 identified N-glycan peaks (Fig. 4c). While many classes of N-glycans were identified (high-mannose, fucosylated, sialylated, bisecting), no single class was uniquely affected by removal of CSs. Removal of CSs may impact enzyme access of PNGaseF to N-glycosylation sites of small-leucine rich proteoglycans (SLRPs). Many SLRPs are found in healthy and stenotic heart valves, such as biglycan, decorin, and versican [31]. Studies with decorin show that both CS-linker and N-glycan sites are present within the primary sequence [27], which could potentially affect enzymatic access for analytical purposes.
Figure 4: N-glycan signal by PNGaseF was improved by removal of CS GAGs via Chondroitinase ABC.
a. Three representative N-glycan images with corresponding structures. b. Annotated spectra with PNGaseF treated tissue alone (top, black) and PNGaseF treated post-CS GAG removal (bottom, red). c. Quantification of the percent change in peak signal intensity for all glycans identified. Each point represents an N-glycan peak with a boxplot of the data shown to the right.
3.5. Elastin imaging by elastase is improved after N-glycan and CS removal
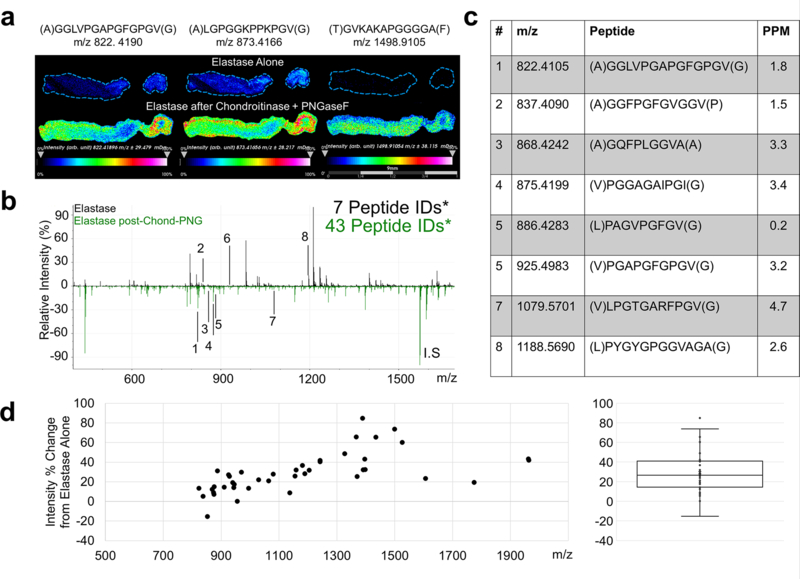
After removal of sugar moieties, we evaluated whether the deglycosylation steps improved detection of ECM peptides following elastase or COLase3 digestions (Figure 5). Preliminary studies determined that the order with which the peptide-cleaving enzymes (elastase, COLase3) was applied has little effect on overall peptide signal intensity. Elastase was applied to the tissue previously treated with Chondroitinase ABC and PNGaseF, with a control tissue treated in parallel with only elastase under the same antigen retrieval conditions. The elastase signal was greatly improved by deglycosylation and removal of CS. This increase in signal intensity is shown clearly via three representative images (Fig. 5a). Without CS and N-glycan removal, 7 putative elastin peptides were observed (Fig. 5b–c). With CS and N-glycan removal 42 putative peptides were detected, with a 29% increase in average peak intensity (Fig. 5d; Supplementary Table 1).
Figure 5: Detection of elastin peptides by Elastase is improved by PNGaseF and Chondroitinase ABC pretreatment.
a. Representative images and corresponding m/z values of three elastin peptides. b Annotated spectra with elastase alone (top, black) and elastase post-CS and N-glycan removal (bottom, green), with corresponding annotations in c. Identified peptide counts are out of 48 peptides IDs via acquired LC-MS/MS databases. d. Quantification of the percent change in peak signal intensity for all elastin peptides identified. Each point represents an elastin peptide peak with a boxplot of the data shown to the right. *Putative peptide IDs from databases acquired from a different tissue cohort.
Consistent with histopathological evaluation, elastin peptides were seen throughout the length of the leaflet. Interestingly, the area of the leaflet that stained heavily for collagen was lower in signal intensity. This could be due to the intermolecular crosslinking of collagen and elastin, limiting enzymatic access. Here, initial treatment with COLase3 may improve localized elastase signal in these areas. While elastin does not contain any consensus sites for N-glycosylation, tropoelastin aggregates can crosslink with certain proteoglycans and glycoproteins in the extracellular space [32, 33]. Matrix glycoproteins have been thought to play a role in elastin fiber orientation, while proteoglycans have been implicated in elastin fibrogenesis [32, 34]. These interactions may be responsible for decreased enzymatic access of elastase to the fibrotic aortic valve tissue without deglycosylation and CS removal.
3.6. Collagenase peptide imaging is compatible with pre-treatment of other ECM-targeting enzymes
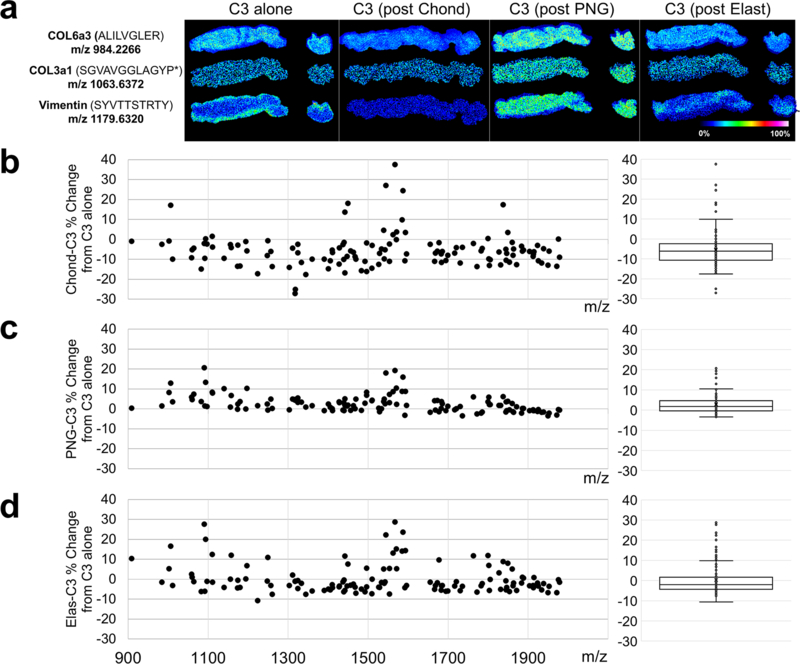
Initial studies in our lab have shown that deglycosylating tissues with PNGaseF before COLase3 treatment allows for capture of both the N-glycome and collagen proteome while improving collagen peptide signal versus COLase3-treatment alone [15]. To continue these studies as part of this multi-enzyme strategy, additional COLase3 experiments were done to evaluate the quality of the signal after single enzyme treatments. While removal of certain analytes, such as N-glycans improved the COLase3 signal more than others, no single enzyme treatment detrimentally effected the COLase3 signal (Fig. 6a–d; Supp Fig. 3). Consistent with previous studies by our lab, deglycosylation with PNGaseF had the greatest effect on improved COLase3 signal (Fig. 6a,c).
Figure 6: Single enzyme treatment does not detrimentally alter Collagenase Type III collagen peptide signal.
a. Representative images of COLase3 digests either after antigen retrieval only (C3 alone) or after digestion with a single ECM-targeting enzyme and analyte removal. From left to right: COLase3 control, post-chondroitinase, post- PNGaseF, and post-elastase. Three ECM peaks are shown: collagen 6a3 peptide (top), collagen 3a1 peptide (middle), and vimentin peptide (bottom). b-d. Quantification of the percent change in peak signal intensity for all COLase3 peptides identified after chondroitinase ABC (b), PNGaseF (c), and elastase (d) incubation and analyte removal as compared to control. Each point represents a COLase3 peptide peak with a boxplot of the data shown to the right. No single enzyme treatment had a significant effect on COLase3 signal intensity. P* indicates hydroxyproline.
3.7. Multi-enzyme treatment reproducibly increases enzymatic access to ECM peptides
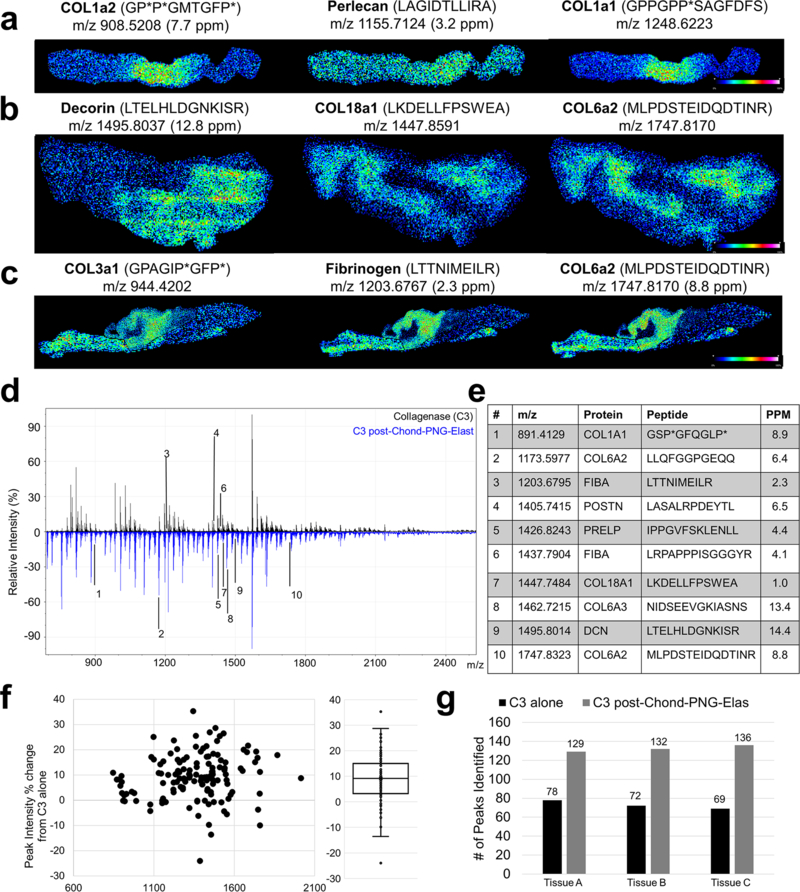
The same tissue section treated with chondroitinase, PNGaseF and elastase was finally treated with COLase3 to image collagen and other ECM peptides (Fig. 7a–d). Quantification of signal intensities between the two methods shows an average of 3.1% increase in peak intensity (mean across all samples and peptides) (Fig. 7f) and an 82 ± 15% increase in total number of peptides identified (mean across all samples) (Fig. 7g). Peptides containing the PTM hydroxyproline (HYP) were also able to be identified (Fig. 7a, c). HYP peptides were not uniquely enriched in this method compared to non-modified peptides. In addition to collagen-type proteins, other ECM peptides were also identified, such as the proteoglycans decorin, perlecan, and fibrinogen (Fig. 7b). COLase3 has low secondary proteolytic activity, with a primary cleavage site at the Y-G bonds of G-X-Y sequence in triple helical protein structures. Because of this, the specificity of this enzyme is not limited to collagen-type proteins but many ECM proteins with triple helical regions [35]. This study was tested for reproducibility across three different human aortic valve samples (Fig. 7a–c, g; Supp Fig. 4)
Figure 7: Collagenase Type III collagen peptide signal and reproducibility study after removing the Chondroitin Sulfates, N-Glycans, and Elastin peptides.
a-c. Representative images of COLase3 peptides in three separate aortic valve samples that have been digested with the serial enzyme methodology. d. Annotated spectra with of COLase3 alone (top, black) and COLase3 signal post-CS-N-glycan-elastin removal, with corresponding peptide sequences shown in e. f. Quantification of the percent change in peak signal intensity for all COLase3 peptides identified. Each point represents an COLase3 peptide peak with a boxplot of the data shown to the right. g. Quantification of total number of peptides identified between C3 alone (black) and C3 post-CS-N-glycan-elastin removal (grey). Data shown for the three tissues in a-c. P* indicates hydroxyproline.
3.8. Multi-Enzyme Methodology Summary and Future Directions
An advantage of the multi-enzyme ECM-targeting strategy is that multiple analytes can be mapped to the same spatial coordinates which synergistically increases molecular information obtained from a single tissue section. Our work has shown that serial application of these enzymes does not impair the quality of the signal of the following enzyme, and it some cases it improves it. This workflow on a single tissue section allows for deep tissue mining of the extracellular matrix as well as colocalization and correlation studies between analytes. Work by Heijs et al described an elegant bioinformatic approach to colocalize N-glycan tissue maps to tryptic glycopeptide mapping [13]. A similar technique could be used in this current study not only for collagenase and elastin peptides but also for N-glycans and CS GAGs.
A serial enzyme method as outlined in this study may have advantages for proteoglycan analysis. For example, digestions with chondroitinase ABC leaves behind a disaccharide and linker tetrasaccharide attached to the core protein that is later cleaved with COLase3 [36]. This unsaturated linker could be used in future studies to determine potential GAG-linker sites on identified CS-proteoglycan peptides (e.g., decorin, biglycan) [27]. While currently unexplored, this same linker-tracking methodology may be applicable with heparan sulfate proteoglycans and hyalectan proteoglycans, which are also detected via our COLase3 digest methodology.
Current work focuses on strategies for imaging of COLase3-produced glycopeptides. Previous studies have shown that PNGase F digestion combined with 18O water may be used to demark occupied sites of N-glycosylation on a tryptic glycopeptide [37]. For ECM analysis, this strategy combines PNGase F digestion in 18O water followed by COLase3 to understand site occupancy of ECM glycopeptides. An additional strategy incorporates another enzyme, endoglycosidase F3, into this workflow. Endoglycosidase F3, which cleaves N-glycans directly above the core fucose-N-acetylglucasamine structure, creates an effective tag for core fucosylated N-glycopeptides [38, 39]. While not yet applied to glycopeptide imaging studies, this mass shift has shown to be a trackable linker in glycopeptide LC-MS/MS workflows [38].
4. Conclusions
The serial application of Chondroitinase ABC, PNGaseF, Elastase, and Collagenase Type III, along with specific washing steps, allows for the mapping of the complex ECM from the same 5 μm tissue section. This multimodal approach may be useful for deep mining of extracellular matrix information from difficult to obtain tissues, as one tissue section can be evaluated for 1) pathology via histology 2) CS GAGs, 3) N-glycans, 4) elastin, and 5) collagens and other ECM peptides. Ongoing studies aim to incorporate i) hyaluronidase treatment to visualize hyaluronic acid; ii) endoglycosidase F3, to identify core-fucosylated N-glycan structures; and iii) trypsin, to further probe the ECM and non-ECM proteome. This multi-enzyme strategy is beneficial in clinical and biomedical research studies of the extracellular matrix, where patient samples may be limited.
Supplementary Material
5.1. Acknowledgements and Funding
The authors acknowledge Dr. Shannon Cornett for his help with ion mobility experiments. Funding provided for this work by the American Heart Association (16GRNT31380005) to PMA with additional support by the NIH/NIGMS (P20 GM103542) and National Center for Advancing Translational Sciences (UL1 TR000445), which supported initial studies for the project. CLC supported by HL007260 (NIH/NHLBI). Support to RRD provided NCI/IMAT (1R21CA207779). RRD and ASM supported by the South Carolina Centers of Economic Excellence SmartState program.
Abbreviations:
- GAG
glycosaminoglycan
- CS
chondroitin sulfate
- ECM
extracellular matrix
- PTM
post-translational modification
- HRAM
high resolution accurate mass
- MALDI
Matrix assisted laser desorption ionization
- IMS
imaging mass spectrometry
- TIMS-TOF
trapped ion mobility time of flight
- AVS
aortic valve stenosis
Footnotes
5.2 Conflicts of interest/Competing interests
The authors declare that they have no conflicts of interest.
5. Declarations
5.3 Availability of data and material
The datasets generated during and/or analysed during the current study are available from the corresponding author on reasonable request.
5.4 Code availability
Not applicable.
References
- 1.Frantz C, Stewart KM, Weaver VM. The extracellular matrix at a glance. J. Cell Sci 2010;123:4195–200. [DOI] [PMC free article] [PubMed] [Google Scholar]
- 2.Schaefer L, Schaefer RM. Proteoglycans: From structural compounds to signaling molecules. Cell Tissue Res. 2010;339:237–46. [DOI] [PubMed] [Google Scholar]
- 3.Shoulders MD, Raines RT. Collagen Structure and Stability. Annu. Rev. Biochem 2009;78:929–58. [DOI] [PMC free article] [PubMed] [Google Scholar]
- 4.Gordon MK, Hahn RA. Collagens. Cell Tissue Res. 2010;339:247–57. [DOI] [PMC free article] [PubMed] [Google Scholar]
- 5.Sethi MK, Downs M, Zaia J. Serial in-solution digestion protocol for mass spectrometry-based glycomics and proteomics analysis. Mol. Omics 2020;4. [DOI] [PMC free article] [PubMed] [Google Scholar]
- 6.Ruhaak LR, Xu G, Li Q, Goonatilleke E, Lebrilla CB. Mass Spectrometry Approaches to Glycomic and Glycoproteomic Analyses. Chem. Rev 2018;118:7886–930. [DOI] [PMC free article] [PubMed] [Google Scholar]
- 7.Raghunathan R, Sethi MK, Zaia J. On-slide tissue digestion for mass spectrometry based glycomic and proteomic profiling. MethodsX. 2019;6:2329–47. [DOI] [PMC free article] [PubMed] [Google Scholar]
- 8.Norris JL, Caprioli RM. Analysis of Tissue Specimens by Matrix-Assisted Laser Desorption/Ionization Imaging Mass Spectrometry in Biological and Clinical Research. Chem. Rev 2013;113:2309–42. [DOI] [PMC free article] [PubMed] [Google Scholar]
- 9.Gessela M, Spraggins JM, Voziyanb P, Hudsonb BG, Caprioli RM. Decellularization of intact tissue enables MALDI imaging mass spectrometry analysis of the extracellular matrix. J Mass Spectrom. 2015;50:1288–93. [DOI] [PMC free article] [PubMed] [Google Scholar]
- 10.Angel PM, Schwamborn K, Comte-Walters S, Clift C, Ball LE, Mehta AS, et al. Extracellular Matrix Imaging of Breast Tissue Pathologies by MALDI Imaging Mass Spectrometry. Proteomics - Clin Appl. 2018;1700152:1700152. [DOI] [PMC free article] [PubMed] [Google Scholar]
- 11.Angel PM, Comte-Walters S, Ball LE, Talbot K, Mehta AS, Brockbank KGMM, et al. Mapping Extracellular Matrix Proteins in Formalin-Fixed, Paraffin-Embedded Tissues by MALDI Imaging Mass Spectrometry. J. Proteome Res 2018;17:635–46. [DOI] [PMC free article] [PubMed] [Google Scholar]
- 12.Powers TW, Neely BA, Shao Y, Tang H, Troyer DA, Mehta AS, et al. MALDI imaging mass spectrometry profiling of N-glycans in formalin-fixed paraffin embedded clinical tissue blocks and tissue microarrays. PLoS ONE. 2014;9:e106255. [DOI] [PMC free article] [PubMed] [Google Scholar]
- 13.Heijs B, Holst S, Briaire-De Bruijn IH, Van Pelt GW, De Ru AH, Van Veelen PA, et al. Multimodal Mass Spectrometry Imaging of N-Glycans and Proteins from the Same Tissue Section. Anal Chem. 2016;88:7745–53. [DOI] [PubMed] [Google Scholar]
- 14.Angel PM, Mehta A, Norris-Caneda K, Drake RR. MALDI Imaging Mass Spectrometry of N-glycans and Tryptic Peptides from the Same Formalin-Fixed, Paraffin-Embedded Tissue Section. Methods in Mol Biol (Clifton, NJ). 2018;1788:225–41. [DOI] [PMC free article] [PubMed] [Google Scholar]
- 15.Clift C, Mehta A, Drake RR, Angel PM. Multiplexed Imaging Mass Spectrometry of Histological Staining, N-glycan and Extracellular Matrix from One Tissue Section: A Tool for Fibrosis Research. Methods in Mol Biol 2020;xx:xxx. [DOI] [PubMed] [Google Scholar]
- 16.Aichler M, Kunzke T, Buck A, Sun N, Ackermann M, Jonigk D, et al. Molecular similarities and differences from human pulmonary fibrosis and corresponding mouse model: MALDI imaging mass spectrometry in comparative medicine. Lab Invest. 2018;98:141–9. [DOI] [PubMed] [Google Scholar]
- 17.Ceroni A, Maass K, Geyer H, Geyer R, Dell A, Haslam SM. GlycoWorkbench: A Tool for the Computer-Assisted Annotation of Mass Spectra of Glycans. J Proteome Res. 2008;7:1650–9. [DOI] [PubMed] [Google Scholar]
- 18.Yamauchi M, Sricholpech M. Lysine post-translational modifications of collagen. 2012;52. [DOI] [PMC free article] [PubMed] [Google Scholar]
- 19.Zhang Y, Fonslow BR, Shan B, Baek MC, Yates JR. Protein analysis by shotgun/bottom-up proteomics. Chem. Rev 2013;113:2343–94. [DOI] [PMC free article] [PubMed] [Google Scholar]
- 20.Zhao RR, Ackers-Johnson M, Stenzig J, Chen C, Ding T, Zhou Y, et al. Targeting Chondroitin Sulfate Glycosaminoglycans to Treat Cardiac Fibrosis in Pathological Remodeling. Circulation. 2018;137:2497–513. [DOI] [PubMed] [Google Scholar]
- 21.Westergren-Thorsson G, Hedstrom U, Nybom A, Tykesson E, Ahrman E, Hornfelt M, et al. Increased deposition of glycosaminoglycans and altered structure of heparan sulfate in idiopathic pulmonary fibrosis. Int J Biochem Cell B. 2017;83:27–38. [DOI] [PubMed] [Google Scholar]
- 22.Guo S, Xue C, Li G, Zhao X, Wang Y, Xu J. Serum Levels of Glycosaminoglycans and Chondroitin Sulfate/Hyaluronic Acid Disaccharides as Diagnostic Markers for Liver Diseases. J Carbohydr Chem. 2015;34:55–69. [Google Scholar]
- 23.Zaia J Glycosaminoglycan glycomics using mass spectrometry. Mol. Cell. Proteomics 2013;12:885–92. [DOI] [PMC free article] [PubMed] [Google Scholar]
- 24.Turiák L, Tóth G, Ozohanics O, Révész Á, Ács A, Vékey K, et al. Sensitive method for glycosaminoglycan analysis of tissue sections. J. Chromatogr. A 2018;1544:41–8. [DOI] [PMC free article] [PubMed] [Google Scholar]
- 25.Tacha D, Teixeira M. History and overview of antigen retrieval: Methodologies and critical aspects. J. Histotechnol 2002;25:237–42. [Google Scholar]
- 26.Magangane PS, Khumalo NP, Adeola HA. The effect of antigen retrieval buffers on MALDI mass spectrometry imaging of peptide profiles in skin FFPE tissue. J Interdiscip. Histopathol 2018;6:26–32. [Google Scholar]
- 27.Klein JA, Meng L, Zaia J. Deep sequencing of complex proteoglycans: A novel strategy for high coverage and sitespecific identification of glycosaminoglycanlinked peptides. Mol. Cell. Proteomics 2018;17:1578–90. [DOI] [PMC free article] [PubMed] [Google Scholar]
- 28.Smirnov IP, Zhu X, Taylor T, Huang Y, Ross P, Papayanopoulos IA, et al. Suppression of α-cyano-4-hydroxycinnamic acid matrix clusters and reduction of chemical noise in MALDI-TOF mass spectrometry. Anal. Chem 2004;76:2958–65. [DOI] [PubMed] [Google Scholar]
- 29.Wei J, Wu J, Tang Y, Ridgeway ME, Park MA, Costello CE, et al. Characterization and Quantification of Highly Sulfated Glycosaminoglycan Isomers by Gated-Trapped Ion Mobility Spectrometry Negative Electron Transfer Dissociation MS/MS. Anal. Chem 2019;91:2994–3001. [DOI] [PMC free article] [PubMed] [Google Scholar]
- 30.Miller RL, Guimond SE, Schwörer R, Zubkova OV, Tyler PC, Xu Y, et al. Shotgun ion mobility mass spectrometry sequencing of heparan sulfate saccharides. Nat. Commun 2020;11:1481. [DOI] [PMC free article] [PubMed] [Google Scholar]
- 31.Stephens EH, Saltarrelli JG, Baggett LS, Nandi I, Kuo JJ, Davis AR, et al. Differential proteoglycan and hyaluronan distribution in calcified aortic valves. Cardiovasc. Pathol 2011;20:334–42. [DOI] [PMC free article] [PubMed] [Google Scholar]
- 32.Fornieri C, Baccarani-Contri M, Quaglino D, Pasquali-Ronchetti I. Lysyl oxidase activity and elastinglycosaminoglycan interactions in growing chick and rat aortas. J. Cell Biol 1987;105:1463–9. [DOI] [PMC free article] [PubMed] [Google Scholar]
- 33.Itabashi T, Harata S, Endo M, Takagaki K, Yukawa M, Ueyama K, et al. Interaction Between Proteoglycans and α-Elastin in Construction of Extracellular Matrix of Human Yellow Ligament. Connect Tissue Res. 2005;46:67–73. [DOI] [PubMed] [Google Scholar]
- 34.Reinboth B, Hanssen E, Cleary EG, Gibson MA. Molecular interactions of biglycan and decorin with elastic fiber components: Biglycan forms a ternary complex with tropoelastin and microfibril-associated glycoprotein 1. J Biol. Chem 2002;277:3950–7. [DOI] [PubMed] [Google Scholar]
- 35.Duarte AS, Correia A, Esteves AC. Bacterial collagenases – A review. Criti. Rev. Microbiol 2016;42:106–26. [DOI] [PubMed] [Google Scholar]
- 36.Shibata S, Midura RJ, Hascall VC. Structural analysis of the linkage region oligosaccharides and unsaturated disaccharides from chondroitin sulfate using CarboPac PA1. J Biol. Chem 1992;267:6548–55. [PubMed] [Google Scholar]
- 37.Yao X, Freas A, Ramirez J, Demirev PA, Fenselau C. Proteolytic 18O labeling for comparative proteomics: Model studies with two serotypes of adenovirus. Anal. Chem 2001;73:2836–42. [DOI] [PubMed] [Google Scholar]
- 38.West C Determination of N-Linked Glycosylation Changes in Hepatocellular Carcinoma and the Associated Glycoproteins for Enhanced Biomarker Discovery and Therapeutic Targets. 2020. Medical University of South Carolina, Charleston, SC, USA. [Google Scholar]
- 39.West CA, Liang H, Drake RR, Mehta AS. New Enzymatic Approach to Distinguish Fucosylation Isomers of N-Linked Glycans in Tissues Using MALDI Imaging Mass Spectrometry. J. Proteome Res 2020;19:2989–2996. [DOI] [PMC free article] [PubMed] [Google Scholar]
Associated Data
This section collects any data citations, data availability statements, or supplementary materials included in this article.


