

Abstract
Introduction
The biological mechanisms linking mild cognitive impairment (MCI) and major depressive disorder are not well understood. We investigated whether molecular senescence changes in older adults are associated with a history of major depressive disorder (MDD) or MCI.
Methods
We included 371 participants: 167 with MCI; 62 cognitively normal with a history of MDD; 97 with MDD+MCI; and 45 cognitively unimpaired (CU) without a history of MDD. The candidate Senescence‐Associated Secretory Phenotype (SASP) biomarkers were measured in the plasma using a customized LUMINEX assay.
Results
The MDD+MCI group had a higher SASP index than the other groups (P < .001). A higher SASP index was significantly associated with worse global cognitive performance, executive dysfunction, slower processing speed, and episodic memory deficits.
Discussion
Our study suggests that increased molecular changes are associated with cognitive impairment in older adults with MDD and indicate that accelerated biological aging is an underlying feature of MDD.
Keywords: aging, biomarkers, cognitive impairment, late‐life depression, major depressive disorder, SASP
1. INTRODUCTION
Major depressive disorder (MDD) and mild cognitive impairment (MCI) are among the most common neuropsychiatric disorders in the elderly, affecting 16% and 5% of older adults in the general population, respectively. 1 , 2 Their co‐occurrence is associated with poor short‐ and long‐term outcomes. Older adults with MDD and MCI have worse antidepressant response rates than those without cognitive impairment, mostly mediated by executive dysfunction. 3 , 4 They also have a higher risk of progressing to Alzheimer's disease (AD) and related dementias, especially those with a recent depressive episode and with persistent depressive symptoms. 5 , 6 , 7
Individuals with MCI+MDD have more significant cerebrovascular disease burden when compared to age‐matched control participants or individuals with MDD or MCI alone. 8 , 9 They also have greater hippocampal and global cortical atrophy and reduced fractional anisotropy in white matter tracts related to executive function and episodic memory. 10 , 11 , 12 Studies investigating the association between AD‐related pathology and MDD have shown a significant association between higher brain amyloid burden and cognitive impairment in MDD. 13 However, non‐significant associations among brain amyloid burden, cognitive impairment, and MDD have also been reported, 14 , 15 and the exact role of AD‐related pathology in the pathogenesis of cognitive impairment in MDD is not clear.
More recently, there has been a growing interest in the role of age‐related biological changes as potential mechanisms for MDD across the lifespan. 16 , 17 Cellular senescence is a common feature of biological aging. 18 One of its consequences is a significant shift in the cellular secretory pattern, called the Senescence‐Associated Secretory Phenotype (SASP). 19 For instance, Coppe et al. 20 evaluated the secretome of fibroblasts after different senescence stimuli. They found a consistent pattern of secretion of signaling protein involved in the immune‐inflammatory response, cell growth, control of cell cycle and apoptosis, cell‐to‐cell communication, and tissue remodeling by senescence cells. Changes in SASP are also observed in animal models of senescence, 21 , 22 , 23 , 24 suggesting that molecular senescence changes are conserved across different cells, tissues, and animals. SASP proteins activate the Mitogen‐activated protein kinases (MAPK), Nuclear factor κβ (NFκβ), and Janus kinase‐signal transducer and activator of transcription (JAK‐STAT), and p53. JAK‐STAT and suppress the p53 intracellular signaling pathways. 21 , 25 , 26 , 27 The net biological effects of SASP include increased pro‐inflammatory status, exacerbation of DNA damage response, telomere shortening, mitochondrial stress, and cell cycle arrest, ultimately inducing further cellular senescence in neighboring cells and on distant tissues. Abnormalities in these biological processes have been described in individuals with major depression and neurocognitive disorders and can provide a mechanistic link between these conditions.
Based on the findings of preclinical models of senescence, we developed the SASP index. 28 , 29 , 30 The SASP index is composed of 22 independent circulating proteins that are part of the secretome of aging cells and that were described previously as a cellular secretory pattern common to different senescent stimuli. 20 , 21 In an initial study we found that older adults with MDD had significantly higher SASP indices than never‐depressed control participants. 30 The SASP index was also negatively correlated with cognitive performance, particularly executive function and information processing speed. We recently reported a significant association between the SASP index and brain microstructural abnormalities (ie, decreased fractional anisotropy and increased mean diffusivity in diffusion‐tensor imaging) in white matter tracts related to executive function and episodic memory in MDD. 31
RESEARCH IN CONTEXT
Systematic review: Recent evidences suggest that senescence changes are one of the mechanisms related to the early development of cognitive impairment in older adults.
Interpretation: Our finding that individuals with co‐morbid mild cognitive impairment (MCI) and major depression have higher molecular senescence markers indicates a synergic effect on the activation of senescence‐related biological pathways, measured by the Senescence‐Associated Secretory Phenotype (SASP) index. Our findings provide a new mechanistic framework that can explain why older with major depression have a higher risk of developing Alzheimer's disease and related dementia (ADRD) compared to never‐depressed older adults.
Future directions: The manuscript proposes a framework for the generation of new hypotheses and the conduct of additional studies. Examples include the understanding of how molecular senescence changes interact with core AD pathology to accelerate cognitive decline; if the SASP index can identify individuals at highest risk to progress from MCI to dementia stages; and if senolytics can have disease‐modifying properties for preventing AD.
Altogether, these prior studies suggest that a higher SASP index, indicating more significant molecular senescence changes, reflects potential mechanisms linking cognitive impairment to MDD. However, these prior studies included relatively small sample sizes and lacked adequate comparison groups; specifically, those with MCI with or without a history of depression. Such limitations did not allow us to determine whether the effect of molecular senescence on cognition is secondary to a history of depression or if it is a primary driver of cognitive impairment in older adults, independent of a history of depression. To address these limitations, we conducted a study with individuals with a history of MDD without MCI; and individuals with MCI with or without a history of MDD. We hypothesized that those with MDD+MCI would have a higher SASP index than those with MCI without MDD or MDD without MCI, and controls who have never been depressed and are cognitively unimpaired (CU). We also hypothesized that a higher SASP index would be associated across groups with worse cognitive performance, particularly in episodic memory, processing speed, and executive function domains.
2. METHODS
2.1. Participant recruitment
The Prevention of Alzheimer's Disease with Cognitive Remediation Plus tDCS in Mild Cognitive Impairment and Depression (PACt‐MD) study (ClinicalTrials.gov Identifier: NCT02386670, Rajji et al., in press) is an ongoing clinical trial that evaluates the efficacy and safety of transcranial direct current stimulation (tDCS) and CR to delay cognitive decline in participants with MCI, a history of MDD, or both. Recruitment was completed in June 2018, and a total of 375 participants started the intervention. For the current study, we included 326 participants who had blood samples for biomarker analyses collected (Figure 1). There were no statistically significant differences in baseline diagnoses, demographics, and neurocognitive performance between the PACt‐MD participants included and those not included in this analysis. PACt‐MD was approved the institutional review board at the Centre for Addiction and Mental Health (CAMH), and all participants provided written informed consent.
FIGURE 1.
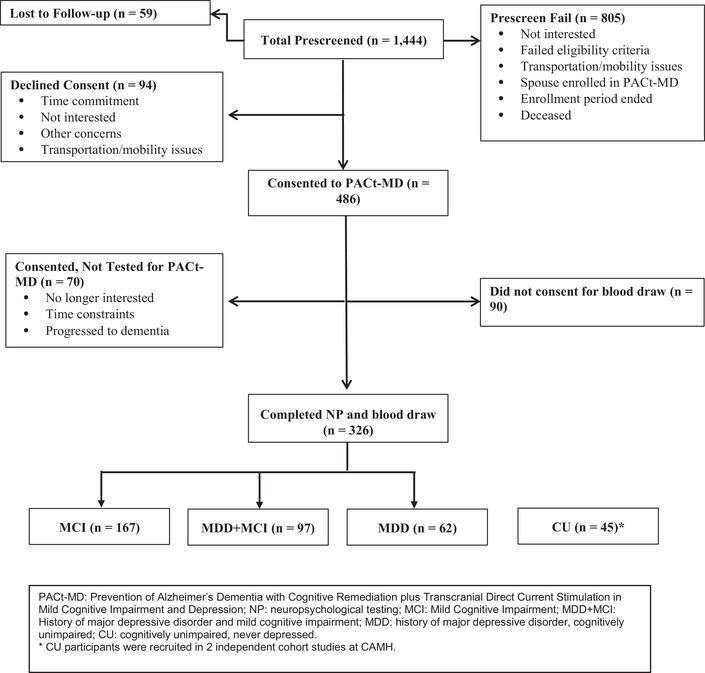
Consort chart showing the recruitment for the PACt‐MD study
2.2. Clinical assessment
All participants underwent a comprehensive clinical assessment, including the Structured Clinical Interview for DSM Disorders (SCID) for the Diagnostic and Statistical Manual of Mental Disorders, Fourth Edition (DSM‐IV 32 ) to establish a history of MDD and rule out the presence of excluded psychiatric disorders, including current alcohol abuse or dependence. The presence and severity of depressive symptoms were evaluated with the Montgomery‐Asberg Depression Rating Scale (MADRS). 33 All participants had to have MADRS scores <10, and if they had a diagnosis of MDD, it needed to be in remission for at least 2 months at the time of the baseline assessment. The use of antidepressants or other psychotropic medications was allowed at study entry, except for cholinesterase inhibitors and memantine. The burden of physical co‐morbidities was evaluated by the Cumulative Illness Rating Scale‐Geriatrics (CIRS‐G).
2.3. Neuropsychological battery
A comprehensive battery was used to characterize participants' cognitive performance in the following domains: attention/speed of processing, executive functioning, verbal and visual memory, language, and visual processing (Table S1). All the neuropsychological tests are standardized, have established reliabilities, and have been shown to differentiate among various neurological and psychiatric disorders, including MDD, and non‐depressed individuals. 34 , 35 , 36 Test scores were combined into cognitive domain scores, and each domain score contributed equally to a global cognitive score.
2.4. Adjudication of Cognitive Status
After participants completed the baseline research assessments, all their available data (including available MRI and other clinical laboratory tests) were reviewed during a consensus conference. This conference involved the geriatric psychiatrist and the research associate who completed the clinical and research assessments, at least two study Principal Investigators who were all senior geriatric psychiatrists, a senior neuropsychologist, and the study coordinator. Based on the diagnostic criteria of the Diagnostic and Statistical Manual of Mental Disorders, Fifth Edition (DSM‐5), all participants were classified into one of three groups: (1) MCI without a history of MDD (MCI group); (2) a history of MDD without MCI (MDD group); and (3) MCI and history of MDD (MDD+MCI group).
2.5. Comparison group
The PACt‐MD study did not obtain blood in its control group of participants with neither MDD nor MCI. Thus for this analysis, we included such older participants from two other studies to serve as a CU comparison group: we used the data and blood of 32 CU controls from the Cognition in Bipolar Disorder (CogBD) study, 37 and 13 from an ongoing late‐life depression cohort study (SenDep). In both studies, the control group's eligibility criteria were the following: the absence of psychiatric disorders; not using psychotropic medications, and cognitive performance in the normal range considering age and educational levels. Both studies were conducted at the CAMH, and the participants were from the same geographical area as the PACt‐MD participants. Those two studies used different neuropsychological batteries (supplementary methods information), and it was not possible to calculate the same cognitive scores as in the PACt‐MD study.
2.6. Laboratory analysis
2.6.1. Blood collection and processing
Blood was collected by venipuncture into EDTA tubes, with samples taken in the morning. Participants were not required to be on overnight fasting. Blood was processed immediately after collection, and plasma was separated, aliquoted, and stored in a −80°C freezer until the laboratory analysis. Blood collection and plasma separation protocols were similar for the PACt‐MD, CogBD, and SenDep studies.
2.6.2. SASP biomarkers
The plasma SASP biomarkers were analyzed by a customized multiplex assay (R&D system, MN, USA) using the LUMINEX platform. We selected the candidate SASP proteins included in our analyses based on previous preclinical studies focused on the changes in the secretome pattern of senescent cells 20 and our previous publications. 30 All the experiments were performed according to the manufacturer's instructions and analyzed using the same assay batch. The coefficient of variation (CV) was <10% for all analytes. All samples were analyzed on the same day to reduce variability across laboratory experiments. After laboratory analysis and data quality analysis, most of the samples had a recoverable biomarker value. For those biomarkers with missing values after data quality check, we substituted the missing value for the lower limit of quantitation (LLOQ) divided by 2. We included the number of missing values after data quality check for each biomarker and their mean ± SD values according to the diagnostic group in the Table 2.
TABLE 2.
SASP biomarker weights
| Biomarker | Weight | Mean | SD |
|---|---|---|---|
| TNFR1 | 0.719 | 14.10 | 0.70 |
| TNFR2 | 0.612 | 2.96 | 1.61 |
| μPAR | 0.583 | 16.67 | 0.37 |
| MIP1A | 0.572 | 5.16 | 1.26 |
| Osteoprotegerin | 0.565 | 8.41 | 0.22 |
| CCL‐4 | 0.556 | 18.01 | 0.98 |
| IL‐1β | 0.536 | 16.61 | 0.70 |
| MIP3A | 0.481 | 15.09 | 0.52 |
| IL‐8 | 0.470 | 2.74 | 0.28 |
| TIMP1 | −0.219 | 0.91 | 1.03 |
| IGFBP2 | −0.104 | 0.98 | 1.46 |
| Angiogenin | −0.364 | 7.16 | 0.57 |
| IGFBP6 | −0.185 | 5.93 | 0.67 |
| MCP4 | 0.347 | 11.57 | 1.02 |
| ICAM1 | 0.416 | 8.77 | 0.16 |
| GM‐CSF | 0.466 | 4.81 | 1.12 |
| MCP1 | 0.350 | 9.95 | 0.42 |
| gp130 | 0.403 | −0.35 | 1.36 |
| PLGF | 0.211 | 14.42 | 0.62 |
| MIF | 0.304 | 10.07 | 0.48 |
| GROα | 0.169 | 11.39 | 0.62 |
| IL‐6 | 0.364 | 10.86 | 0.37 |
Abbreviations: TNFR1, soluble tumor necrosis factor receptor 1; TNFR2, soluble tumor necrosis factor receptor 2; μPAR, urokinase‐type plasminogen activator receptor; MIP1A, macrophage inflammatory protein 1α; CCL‐4, chemokine (C‐C motif) ligands 4 or macrophage inflammatory protein 1β; IL‐1β, interleukin 1β; MIP3A, macrophage inflammatory protein 3α; IL‐8, interleukin 8; TIMP1, tissue inhibitor matrix metalloproteinase 1; IGFBG2, insulin‐like growth factor binding protein 2; IGFBP6, insulin‐like growth factor binding protein 6; MCP4, monocyte chemoattractant protein 4; ICAM1, intercellular adhesion molecule 1; GM‐CSF, granulocyte‐macrophage colony‐stimulating factor; MCP1, monocyte chemoattractant protein 1; PLGF, placental growth factor; MIF, macrophage migration inhibitory factor; GROα, growth‐regulated alpha protein; IL‐6, interleukin 6.
The raw biomarker data were log2 transformed and standardized to the z‐score. We calculated the SASP index for each participant based on the following regression formula:
Where βx is the individual weight and xx is the standardized value of each biomarker included in the SASP index. The biomarker weight for each biomarker was based on the first component of principal component analysis. The SASP index mean was centered at 0, with an SD of 1 in the whole sample. Table S3 shows the biomarkers included in the SASP index, their respective weights to calculate the SASP index score, and their mean values in this sample. Our previous works have focused on major depression across the lifespan. 30 , 31 , 38 Therefore, we recalculated the SASP index weights to reflect the relationship between the SASP proteins and cognitive dysfunction (SASP index—Cog).
2.7. Statistical analysis
Before statistical analysis, we evaluated the distribution of data to ensure that it followed a parametric distribution. Depending on the number of groups and type of data (continuous vs dichotomous data), we used Student t‐test, chi‐square, or univariate analysis of variance (ANOVA) to evaluate the relationship between the SASP index and demographics, clinical measures, cognitive domain scores, or global cognitive score. We used Pearson correlations to evaluate the correlation between the SASP index and demographic data, clinical measures, and neurocognitive scores. We next evaluated the impact of potential confounding variables on the association between the SASP index and specific cognitive scores using generalized linear models. The significance level was set at P < .05 without adjustment for multiple comparisons unless specified. All analyses were done with the Statistical Package for Social Science (SPSS v25, Chicago, USA).
3. RESULTS
The 371 participants belonged to the following four diagnostic groups: MCI (n = 167); MDD (n = 62); MDD+MCI (n = 97); and CU (n = 45). Table 1 shows the demographic, clinical, and neurocognitive data of each group. Age and BMI were significantly different between groups. They did not differ statistically in terms of sex frequency, apolipoprotein E (APOE) ε4 allele frequency, education, or CIRS‐G scores. Participants in the MDD and MDD+MCI groups were more likely to be taking psychotropic medication than those in the MCI group (and by design, those in the CU group were not taking any psychotropic medication). Participants in the MCI and MDD+MCI groups had lower scores in all cognitive domains than those in the MDD group.
TABLE 1.
Demographic and clinical characteristics of the study sample
| Diagnosis | |||||||
|---|---|---|---|---|---|---|---|
| CU (N = 45) | MCI (N = 167) | MDD (N = 62) | MDD+MCI (N = 97) | Statistics (d.f.) | P | ||
| Sex | M (%) | 51% | 42% | 32% | 39% | (3) = 4.2 | .24 |
| F (%) | 49% | 58% | 68% | 61% | |||
| Education | <12 years | 14% | 15% | 12% | 17% | (3) = 0.9 | .89 |
| ⇒ 12 years | 86% | 85% | 88% | 83% | |||
| Psychotropic meds (%) | No | 100% | 86% | 27% | 27% | (16) = 0.9 | <.001 |
| SSRI | 0% | 4% | 19% | 17% | |||
| SNRI | 0% | 1% | 22% | 17% | |||
| Tricyclics | 0% | 2% | 3% | 5% | |||
| Bupropion | 0% | 0% | 3% | 6% | |||
| BZD and Z‐drugs | 0% | 6% | 14% | 20% | |||
| Other antidepressants | 0% | 2% | 10% | 4% | |||
| Antipsychotics | 0% | 0% | 0% | 2% | |||
| Others | 0% | 0% | 2% | 1% | |||
| Age | 67.3 ± 10.0 | 71.9 ± 7.5 | 70.2 ± 4.6 | 70.9 ± 4.5 | F(3368) = 5.43 | <.001 | |
| CIRS‐G | 4.8 ± 3.4 | 4.7 ± 3.0 | 4.1 ± 2.7 | 5.3 ± 3.3 | F(3368) = 1.86 | .13 | |
| MADRS | 1.3 ± 1.6 | 3.6 ± 2.7 | 4.9 ± 3.2 | 4.8 ± 3.2 | F(3368) = 8.58 | <.001 | |
| BMI | 23.01 ± 1.33 | 25.84 ± 4.03 | 27.67 ± 5.34 | 28.38 ± 5.60 | F(3368) = 16.74 | <.001 | |
| APOE ε4 (%) | – | 29.5% | 26.4% | 29.6% | (2) = 0.13 | .9 | |
| Verbal memory composite | – | −1.1 ± 1.3 | 0.0 ± 0.9 | −0.8 ± 1.0 | F(2311) = 20.25 | <.001 | |
| Visuospatial memory composite | – | −1.0 ± 1.4 | −0.1 ± 0.8 | −0.8 ± 1.2 | F(2311) = 10.89 | <.001 | |
| Processing speed composite | – | −0.9 ± 1.1 | −0.2 ± 1.0 | −1.1 ± 1.2 | F(2311) = 10.48 | <.001 | |
| Language composite | – | −0.9 ± 1.1 | −0.1 ± 0.8 | −0.9 ± 1.1 | F(2311) = 14.03 | <.001 | |
| Executive function composite | – | −0.7 ± 0.9 | −0.1 ± 0.8 | −0.7 ± 0.9 | F(2311) = 9.24 | <.001 | |
| Working memory composite | – | −0.8 ± 0.9 | −0.3 ± 0.8 | −0.8 ± 0.9 | F(2311) = 9.56 | <.001 | |
| Global cognition composite | – | −0.9 ± 0.8 | −0.1 ± 0.6 | −0.8 ± 0.7 | F(2311) = 24.64 | <.001 | |
Abbreviations: CU, cognitively unimpaired; CIRS‐G, Cumulative Illness Rating Scale–Geriatrics; MADRS, Montgomery‐Asberg Depression Rating Scale; BMI, body mass index.
3.1. Effect of diagnosis on SASP index‐Cog
The SASP index‐Cog means were significantly different among groups (F(3368) = 7.83, omnibus P‐value < .001; η2 = 0.06), with the highest mean in the MDD+MCI group. Contrast analyses showed that the MDD+MCI (Cohen's d = 0.75 95% CI (0.40 to 1.10); P < .001), MCI (Cohen's d = 0.43 95% CI (0.15 to 0.71); P = .003), and MDD (Cohen's d = 0.39 95% CI (0.11 to 0.67); P = .04) groups had significantly higher means than the CU group (Figure 2).
FIGURE 2.

Senescence‐Associated Secretory Phenotype (SASP) index scores according to the different diagnostic groups. ANOVA test: F(3368) = 7.83, omnibus P‐value < .001; η2 = 0.06. Contrast comparison analysis: MCI+MDD > controls: P < .001; MCI+MDD > MDD only: P = .006; MCI+MDD > MCI only: P = .006. MCI only > controls: P = .003; MCI only > MDD only: P > .05. MDD only > controls: P = .04
The SASP index‐Cog did not differ significantly when participants were grouped based on sex (man: 0.13 ± 1.01 vs woman: −0.06 ± 0.96; t(368) = 1.86, P = .07), education level (≥12 years: −0.03 ± 0.98 vs <12 years: 0.22 ± 0.99; t(368) = 1.77, P = .08), use of psychotropic medication (F(8631) = 0.69; P = .69), or APOE genotype (APOE ε4: 0.001 ± 0.98 vs not APOE ε4: 0.10 ± 0.94; t(298) = 0.82, P = 0.3; PACt‐MD participants only). SASP index‐Cog was significantly correlated with age (r = 0.32, P < .001) and CIRS‐G scores (r = 0.14, P = .007), and BMI (r = 0.14, P = .007), but not with MADRS scores (r = −0.03, P = .2).
We conducted additional analyses to control for potential confounding effects on the association between diagnosis and SASP index‐Cog, including age, CIRS‐G, psychotropic medication use, BMI, and MADRS scores in the model. SASP index‐Cog means significantly differed among groups after controlling for these variables, with the MDD+MCI group still having the highest SASP index‐Cog mean (F(3348) = 4.16, omnibus P‐value = .006) and contrast analyses showing that the MDD+MCI (P < .001) had significantly higher means than the CU group, but not the MCI (P = .3) and MDD (P = .21) groups.
Because the CU group participants were not recruited in the PACt‐MD study and may differ from the PACt‐MD participants in some important sociodemographic characteristics, we conducted a sensitivity analysis including only the PACt‐MD participants (ie, participants in the MCI, MDD, and MDD+MCI groups). The SASP index‐Cog means differed significantly among these three groups (F(2326) = 5.43, omnibus P‐value = .005), with the MDD+MCI group having the highest mean. After controlling for age, CIRS‐G, psychotropic use, BMI, and MADRS scores, the SASP index‐Cog means remained significantly different (F(2306) = 4.10, omnibus P‐value = .007) with the MDD+MCI group having the highest SASP scores.
3.2. Association between cognitive performance and SASP index‐Cog
We explored the association between SASP index‐Cog and specific cognitive domains or global cognition across diagnostic groups. For these analyses, we included only the MCI, MDD, and MDD+MCI groups. We first investigated the correlation between the SASP index‐Cog and the performance on verbal memory, visuospatial memory, language, information processing speed, executive function, working memory, and global cognition. We adjusted the threshold for statistical significance at the P‐value < .007 (Bonferroni correction). There were significant correlations between SASP index‐Cog and verbal memory (r = −0.173, P = .002), information processing speed (r = −0.217, P = .00009), executive function (r = −0.204, P = .0002), working memory (r = −0.181, P = .001), and global cognition (r = −0.241, P = .00001). The correlations between SASP index‐Cog and visuospatial memory (r = −0.119, P = .035) or language (r = −0.146, P = .009) were not significant after correcting for multiple comparisons.
We conducted additional analyses to statistically adjust for the effect of age, education, sex, CIRS‐G scores, APOE ε4 status, BMI, and MADRS scores on the association between SASP index‐Cog and cognitive performance. We used generalized linear models with cognitive scores as the dependent variable; SASP index‐Cog, CIRS‐G, BMI, and MADRS scores as continuous covariates; and sex APOE ε4 group, and education level as dichotomous covariates. The association between SASP index‐Cog and cognition was statistically significant for processing speed (B =−0.151, Wald chi‐square = 5.08, df = 1, P = .024) and global cognition (B = −0.107, Wald Chi‐square = 5.81, df = 1, P = .016), although none remained statistically significant after correcting for multiple comparisons. The SASP index‐Cog was not associated with verbal memory, executive function, working memory, visuospatial memory, or language when controlling for the effect of the covariates. Figure 3 shows the scatter plot for the association between processing speed, global cognition composite scores, and the SASP index—Cog.
FIGURE 3.
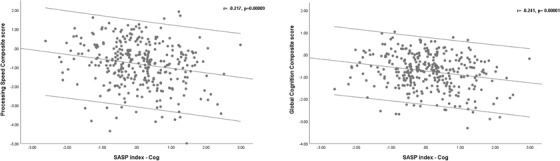
Scatter plot of the association between Senescence‐Associated Secretory Phenotype (SASP) and performance on cognitive domains
Finally, we evaluated whether the association between the SASP index‐Cog and cognitive performance was moderated by the diagnostic group. We tested the effect of the interaction between the diagnosis group (MCI, MDD, and MDD+MCI) and SASP index‐Cog on each cognitive domain and global cognition scores. The association between SASP index‐Cog and cognitive performance was not moderated by the diagnostic group (Table S3).
4. DISCUSSION
In this study, we found that older adults with MDD+MCI had the highest SASP index‐Cog followed by those with MCI and MDD. Higher SASP indices were negatively correlated with processing speed, working memory, and global cognition. Compared to the CU group, the effect sizes for the differences in SASP index‐Cog means were moderate for the MCI and MDD groups and high for the MDD+MCI group. Our findings suggest that a circulating pattern of proteins related to senescence can be a putative mechanism related to cognitive impairment in older adults with and without MDD.
The effect of MDD+MCI on the SASP index‐Cog was independent of well‐established risk factors for cognitive impairment in older adults like age, education, or APOE genotype. The co‐occurrence of MDD and MCI has important clinical implications. First, these individuals have a higher risk of progression to AD and other dementia syndromes. 7 Second, they also have a worse response to antidepressant treatment, higher risk of treatment resistance even after sequential antidepressant treatment, 3 , 4 and are at higher risk of disability and frailty. 39 , 40 The higher SASP index‐Cog in the MDD+MCI group and the significant correlations between SASP index‐Cog and performance on specific cognitive domains may illuminate the possible biological mechanism by which these individuals are more vulnerable to age‐ and disease‐related adverse outcomes. These findings are also congruent with previous reports that individuals with MDD+MCI have broad neurobiological abnormalities, including the intensification of different aging‐related biological processes. 29 , 41
How SASP proteins are associated with cognitive impairment is not fully understood. A recent study showed that the build‐up of senescent glial cells increased the production of SASP proteins in our study in the brain, triggering neurodegenerative changes (ie, accumulation of neurofibrillary tangles) in neurons and cognitive impairment in mice. 42 The clearance of senescence cells reduced SASP proteins and improved tau pathology and cognitive performance in these animals. A critical aspect of SASP proteins is that they can be secreted by brain cells like the microglia, astrocytes, and neurons; they can also cross the blood‐brain barrier from the systemic circulation and influence brain function and structure. 43 , 44 In a previous study, we found that SASP index scores were significantly correlated with mean diffusivity and fractional anisotropy measures, suggesting that changes in peripheral measures of molecular senescence are closely related to structural brain damage in tracts subsuming executive function and episodic memory. 31
The SASP proteins have a pleiotropic and possibly redundant effect on different intracellular signaling pathways, including the MAPK, NFκβ, JAK‐STAT, and p53. The regulation of these signaling pathways mediates the deleterious effects of SASP proteins on cellular and tissue function, including the stimulation of a pro‐inflammatory state, cell cycle arrest, cellular dystrophy, and tissue remodeling. The dysregulation of these signaling pathways has been implicated previously in MDD and different neurodegenerative disorders, including Alzheimer's disease (AD). 45 , 46 , 47 Therefore, the higher SASP index in older adults with MDD+MCI and MCI may reflect broader pervasive abnormalities in multiple intracellular signaling pathways relevant to the physiopathology of both MDD and AD, suggesting that these are common biological pathways by which MDD increases the risk of AD in older adults.
All participants in the MDD only and MDD+MCI groups were in full remission at the time of blood draw, and the SASP indices were not influenced by the use of psychotropic medications, consistent with a recent study including acutely depressed younger adults. 38 These findings have important implications. Although the antidepressants used currently in clinical practice can improve depressive symptoms and bring patients to full remission, they may not be sufficient to restore the biological abnormalities associated with MDD in older adults. The persistence of higher SASP indices in remitted MDD can represent a “biological scar” 48 (accentuated in those with comorbid MCI) and can reduce the biological resilience against further damage, increasing the susceptibility to adverse outcomes associated with MDD, even in those in full remission. Alternatively, more severe molecular senescence abnormalities can contribute to the higher allostatic load and neurodegeneration observed in older adults with MDD. 49 , 50 , 51
Aging is a complex phenomenon that involves inter‐related changes in multiple biological processes and pathways 18 ; it is not a pathological state per se, but it predisposes individuals to develop a myriad of pathological conditions associated with premature death, including cardiovascular diseases, metabolic disorders, and neurodegeneration. Our findings add to a growing body of evidence suggesting that older adults with MDD present with an acceleration of age‐related biological processes reflected by a higher SASP index. However, there are several important unanswered questions regarding the association between MDD and these accelerated aging processes. First, is there a temporal sequence of biological events that leads to the acceleration of age‐related biological processes in MDD? How early do SASP proteins start to change in individuals with MDD? Given its cross‐sectional design, our analysis cannot address these questions. To answer them, future studies should include longitudinal assessments of mood, cognition, and SASP biomarkers in individuals across a broad age range.
This study has several limitations. First, the SASP proteins were measured in the plasma, and their exact cellular or tissue sources are unknown. SASP proteins can be secreted by different cells systemically (eg, endothelial cells, immune cells, preadipocytes, epithelial cells, fibroblasts), and in the brain (eg, microglia, astrocytes, and neurons), in association with physiologic or pathologic conditions, and we are not able to pinpoint which are the cell types that contribute more to the SASP proteins. 43 , 44 , 52 Even without specific cellular sources, once secreted in the blood, SASP proteins act in concert, leading to senescence changes both loca,lly and at distant sites and increasing the vulnerability of tissues to additional damage and senescence changes. These circulating proteins are also secreted by non‐senescence cells under different conditions, and the SASP index might reflect other biological processes not related to senescence. There was no statistically significant difference in some SASP proteins among groups in the univariate analysis (suppl. Table 2), although they significantly contributed to the SASP‐Cog index weight (eg, the TNFRII). However, such findings highlight the main strength of the SASP index, since it can capture the complex inter‐relationships (and probably more biologically meaningful) among different biomarkers, moving beyond the impact of individual proteins on the outcomes of interest, for example, cognitive performance. Likewise, the small to moderate correlation coefficients between cognitive performance and SASP‐Cog index values suggest that other processes not captured by the SASP proteins would be mechanistically involved in cognitive dysfunction.
Another limitation is that because the SASP index‐Cog includes several inflammatory cytokines, it can be viewed as biased toward measuring inflammatory processes rather than senescence. However, although low‐grade sterile inflammation is a key aspect of senescence, it is one among many other biological abnormalities related to senescence (eg, disruption in metabolic control, decreased insulin sensitivity, impaired tissue remodeling, cell growth, cell cycle control, and cell cycle arrest). Molecules related to these senescence mechanisms (eg, IGFBP‐2 and 6, angiogenin, GROa, TIMP‐1, placental growth factor) are included in the SASP index‐Cog. Thus the biological processes captured by the SASP index are broader than inflammation and consistent with the complexity of senescence. Finally, the inclusion of control participants from different studies who did not undergo the same cognitive evaluation as those from the PACt‐MD study is another important methodological limitation. Although these controls had normal cognitive performance and no history of psychiatric disorders upon recruitment, we could not evaluate the impact of the SASP index‐Cog on specific cognitive domains in this group. This could have influenced the association between the SASP index and cognitive performance. However, the results of the primary and sensitivity analyses were consistent.
CONFLICTS OF INTEREST
Dr. Mulsant reports non‐financial support from HAPPYneuron (free use of software) and a grant from Brain Canada related to the PACt‐MD study. In the past 3 years, he has also received non‐financial support from Eli Lilly, Pfizer, and Capital Solutions Design LLC, all outside the submitted work. The other contributors do not have a conflict of interest to report.
Supporting information
Supporting information
Supporting information
Supporting information
Supporting information
ACKNOWLEDGMENT
This work was supported by grant from Brain Canada Foundation and Chagnon Family (PACt‐MD) and from NIMH grant (R01MH115953‐01A1). The grant agencies had no influence in the study design, interpretation of the results, and decision to submit this manuscript for publication.
Diniz BS, Vieira EM, Mendes‐Silva AP, et al. Mild cognitive impairment and major depressive disorder are associated with molecular senescence abnormalities in older adults. Alzheimer's Dement. 2021;7:e12129. 10.1002/trc2.12129
REFERENCES
- 1. Hu C, Yu D, Sun X, Zhang M, Wang L, Qin H. The prevalence and progression of mild cognitive impairment among clinic and community populations: a systematic review and meta‐analysis. Int Psychogeriatr. 2017;29:1595‐1608. [DOI] [PubMed] [Google Scholar]
- 2. Byers AL, Yaffe K, Covinsky KE, Friedman MB, Bruce ML. High occurrence of mood and anxiety disorders among older adults: the National Comorbidity Survey Replication. Arch Gen Psychiatry. 2010;67:489‐496. [DOI] [PMC free article] [PubMed] [Google Scholar]
- 3. Lenze EJ, Mulsant BH, Blumberger DM, et al. Efficacy, safety, and tolerability of augmentation pharmacotherapy with aripiprazole for treatment‐resistant depression in late life: a randomized, double‐blind, placebo‐controlled trial. Lancet. 2015;386:2404‐2412. [DOI] [PMC free article] [PubMed] [Google Scholar]
- 4. Kaneriya SH, Robbins‐Welty GA, Smagula SF, et al. Predictors and moderators of remission with aripiprazole augmentation in treatment‐resistant late‐life depression: an analysis of the IRL‐GRey randomized clinical trial. JAMA Psychiatry. 2016;73:329‐336. [DOI] [PMC free article] [PubMed] [Google Scholar]
- 5. Gallagher D, Kiss A, Lanctot K, Herrmann N. Depression and risk of Alzheimer dementia: a longitudinal analysis to determine predictors of increased risk among older adults with depression. Am J Geriatr Psychiatry. 2018;26:819‐827. [DOI] [PMC free article] [PubMed] [Google Scholar]
- 6. Kaup AR, Byers AL, Falvey C, et al. Trajectories of depressive symptoms in older adults and risk of dementia. JAMA Psychiatry. 2016;73:525‐531. [DOI] [PMC free article] [PubMed] [Google Scholar]
- 7. Mourao RJ, Mansur G, Malloy‐Diniz LF, Castro Costa E, Diniz BS. Depressive symptoms increase the risk of progression to dementia in subjects with mild cognitive impairment: systematic review and meta‐analysis. Int J Geriatr Psychiatry. 2016;31:905‐911. [DOI] [PubMed] [Google Scholar]
- 8. Aizenstein HJ, Baskys A, Boldrini M, et al. Vascular depression consensus report—a critical update. BMC Med. 2016;14:161. [DOI] [PMC free article] [PubMed] [Google Scholar]
- 9. Fujishima M, Maikusa N, Nakamura K, Nakatsuka M, Matsuda H, Meguro K. Mild cognitive impairment, poor episodic memory, and late‐life depression are associated with cerebral cortical thinning and increased white matter hyperintensities. Front Aging Neurosci. 2014;6:306. [DOI] [PMC free article] [PubMed] [Google Scholar]
- 10. Geerlings MI, Brickman AM, Schupf N, et al. Depressive symptoms, antidepressant use, and brain volumes on MRI in a population‐based cohort of old persons without dementia. J Alzheimers Dis. 2012;30:75‐82. [DOI] [PMC free article] [PubMed] [Google Scholar]
- 11. Smagula SF, Aizenstein HJ. Brain structural connectivity in late‐life major depressive disorder. Biol Psychiatry Cogn Neurosci Neuroimaging. 2016;1:271‐277. [DOI] [PMC free article] [PubMed] [Google Scholar]
- 12. Reppermund S, Zhuang L, Wen W, et al. White matter integrity and late‐life depression in community‐dwelling individuals: diffusion tensor imaging study using tract‐based spatial statistics. Br J Psychiatry. 2014;205:315‐320. [DOI] [PubMed] [Google Scholar]
- 13. Gatchel JR, Rabin JS, Buckley RF, et al. Longitudinal association of depression symptoms with cognition and cortical amyloid among community‐dwelling older adults. JAMA Netw Open. 2019;2:e198964. [DOI] [PMC free article] [PubMed] [Google Scholar]
- 14. Diniz BS, Teixeira AL, Machado‐Vieira R, et al. Reduced cerebrospinal fluid levels of brain‐derived neurotrophic factor is associated with cognitive impairment in late‐life major depression. J Gerontol B Psychol Sci Soc Sci. 2014;69:845‐851. [DOI] [PMC free article] [PubMed] [Google Scholar]
- 15. De Winter FL, Emsell L, Bouckaert F, et al. No association of lower hippocampal volume with Alzheimer's disease pathology in late‐life depression. Am J Psychiatry. 2017;174:237‐245. [DOI] [PubMed] [Google Scholar]
- 16. Sibille E. Molecular aging of the brain, neuroplasticity, and vulnerability to depression and other brain‐related disorders. Dialogues Clin Neurosci. 2013;15:53‐65. [DOI] [PMC free article] [PubMed] [Google Scholar]
- 17. Diniz BS. The molecular intersection between senescence and major depression in the elderly. Am J Geriatr Psychiatry. 2018;26:1097‐1105. [DOI] [PubMed] [Google Scholar]
- 18. López‐Otín C, Blasco MA, Partridge L, Serrano M, Kroemer G. The hallmarks of aging. Cell. 2013;153:1194‐1217. [DOI] [PMC free article] [PubMed] [Google Scholar]
- 19. Young ARJ, Narita M. SASP reflects senescence. EMBO Rep. 2009;10:228‐230. [DOI] [PMC free article] [PubMed] [Google Scholar]
- 20. Coppe JP, Patil CK, Rodier F, et al. Senescence‐associated secretory phenotypes reveal cell‐nonautonomous functions of oncogenic RAS and the p53 tumor suppressor. PLoS Biol. 2008;6:2853‐2868. [DOI] [PMC free article] [PubMed] [Google Scholar]
- 21. Coppe JP, Patil CK, Rodier F, et al. A human‐like senescence‐associated secretory phenotype is conserved in mouse cells dependent on physiological oxygen. PLoS One. 2010;5:e9188. [DOI] [PMC free article] [PubMed] [Google Scholar]
- 22. Okuda R, Aoshiba K, Matsushima H, Ogura T, Okudela K, Ohashi K. Cellular senescence and senescence‐associated secretory phenotype: comparison of idiopathic pulmonary fibrosis, connective tissue disease‐associated interstitial lung disease, and chronic obstructive pulmonary disease. J Thorac Dis. 2019;11:857‐864. [DOI] [PMC free article] [PubMed] [Google Scholar]
- 23. Acosta JC, Banito A, Wuestefeld T, et al. A complex secretory program orchestrated by the inflammasome controls paracrine senescence. Nat Cell Biol. 2013;15:978‐990. [DOI] [PMC free article] [PubMed] [Google Scholar]
- 24. Csiszar A, Sosnowska D, Wang M, Lakatta EG, Sonntag WE, Ungvari Z. Age‐associated pro‐inflammatory secretory phenotype in vascular smooth muscle cells from the non‐human primate Macaca mulatta: reversal by resveratrol treatment. J Gerontol A Biol Sci Med Sci. 2012;67:811‐820. [DOI] [PMC free article] [PubMed] [Google Scholar]
- 25. Bachstetter AD, Xing B, de Almeida L, Dimayuga ER, Watterson DM, Van Eldik LJ. Microglial p38alpha MAPK is a key regulator of pro‐inflammatory cytokine up‐regulation induced by toll‐like receptor (TLR) ligands or beta‐amyloid (Abeta). J Neuroinflammation. 2011;8:79. [DOI] [PMC free article] [PubMed] [Google Scholar]
- 26. Mombach JC, Vendrusculo B, Bugs CA. A model for p38MAPK‐induced astrocyte senescence. PLoS One. 2015;10:e0125217. [DOI] [PMC free article] [PubMed] [Google Scholar]
- 27. Kojima H, Inoue T, Kunimoto H, Nakajima K. IL‐6‐STAT3 signaling and premature senescence. JAK‐STAT. 2013;2:e25763‐e. [DOI] [PMC free article] [PubMed] [Google Scholar]
- 28. Diniz BS, Lin CW, Sibille E, et al. Circulating biosignatures of late‐life depression (LLD): towards a comprehensive, data‐driven approach to understanding LLD pathophysiology. J Psychiatr Res. 2016;82:1‐7. [DOI] [PMC free article] [PubMed] [Google Scholar]
- 29. Diniz BS, Sibille E, Ding Y, et al. Plasma biosignature and brain pathology related to persistent cognitive impairment in late‐life depression. Mol Psychiatry. 2015;20:594‐601. [DOI] [PMC free article] [PubMed] [Google Scholar]
- 30. Diniz BS, Reynolds CF 3rd, Sibille E, et al. Enhanced molecular aging in late‐life depression: the senescent‐associated secretory phenotype. Am J Geriatr Psychiatry. 2017;25:64‐72. [DOI] [PMC free article] [PubMed] [Google Scholar]
- 31. Mendes‐Silva AP, Mwangi B, Aizenstein H, Reynolds CF 3rd, Butters MA, Diniz BS. Molecular senescence is associated with white matter microstructural damage in late‐life depression. Am J Geriatr Psychiatry. 2019;27:1414‐1418. [DOI] [PMC free article] [PubMed] [Google Scholar]
- 32. First M, Spitzer RL, Gibbon ML, Williams J. Structured clinical interview for DSM‐IV‐TR Axis I Disorders, Research Version, Non‐patient Edition. 2002.
- 33. Montgomery SA, Asberg M. A new depression scale designed to be sensitive to change. Br J Psychiatry. 1979;134:382‐389. [DOI] [PubMed] [Google Scholar]
- 34. Bhalla RK, Butters MA, Mulsant BH, et al. Persistence of neuropsychologic deficits in the remitted state of late‐life depression. Am J Geriatr Psychiatry. 2006;14:419‐427. [DOI] [PubMed] [Google Scholar]
- 35. Butters MA, Becker JT, Nebes RD, et al. Changes in cognitive functioning following treatment of late‐life depression. Am J Psychiatry. 2000;157:1949‐1954. [DOI] [PubMed] [Google Scholar]
- 36. Butters MA, Whyte EM, Nebes RD, et al. The nature and determinants of neuropsychological functioning in late‐life depression. Arch Gen Psychiatry. 2004;61:587‐595. [DOI] [PubMed] [Google Scholar]
- 37. Vaccarino SR, Rajji TK, Gildengers AG, et al. Allostatic load but not medical burden predicts memory performance in late‐life bipolar disorder. Int J Geriatr Psychiatry. 2018;33:546‐552. [DOI] [PMC free article] [PubMed] [Google Scholar]
- 38. Diniz BS, Reynolds Iii CF, Sibille E, Bot M, Penninx B. Major depression and enhanced molecular senescence abnormalities in young and middle‐aged adults. Transl Psychiatry. 2019;9:198. [DOI] [PMC free article] [PubMed] [Google Scholar]
- 39. Brown PJ, Roose SP, O'Boyle KR, et al. Frailty and its correlates in adults with late life depression. Am J Geriatr Psychiatry. 2020;28:145‐154. [DOI] [PMC free article] [PubMed] [Google Scholar]
- 40. Morin RT, Insel P, Bickford D, Nelson C, Mackin RS. Depression severity, but not cognitive impairment or frailty, is associated with disability in late‐life depression. Clin Gerontol. 2019:1‐9. [DOI] [PMC free article] [PubMed] [Google Scholar]
- 41. Diniz BS, Reynolds CF 3rd, Begley A, et al. Brain‐derived neurotrophic factor levels in late‐life depression and comorbid mild cognitive impairment: a longitudinal study. J Psychiatr Res. 2014;49:96‐101. [DOI] [PMC free article] [PubMed] [Google Scholar]
- 42. Bussian TJ, Aziz A, Meyer CF, Swenson BL, van Deursen JM, Baker DJ. Clearance of senescent glial cells prevents tau‐dependent pathology and cognitive decline. Nature. 2018;562:578‐582. [DOI] [PMC free article] [PubMed] [Google Scholar]
- 43. Salminen A, Ojala J, Kaarniranta K, Haapasalo A, Hiltunen M, Soininen H. Astrocytes in the aging brain express characteristics of senescence‐associated secretory phenotype. Eur J Neurosci. 2011;34:3‐11. [DOI] [PubMed] [Google Scholar]
- 44. Chinta SJ, Woods G, Rane A, Demaria M, Campisi J, Andersen JK. Cellular senescence and the aging brain. Exp Gerontol. 2015;68:3‐7. [DOI] [PMC free article] [PubMed] [Google Scholar]
- 45. Kheiri G, Dolatshahi M, Rahmani F, Rezaei N. Role of p38/MAPKs in Alzheimer's disease: implications for amyloid beta toxicity targeted therapy. Rev Neurosci. 2018;30:9‐30. [DOI] [PubMed] [Google Scholar]
- 46. Li X, Long J, He T, Belshaw R, Scott J. Integrated genomic approaches identify major pathways and upstream regulators in late onset Alzheimer's disease. Sci Rep. 2015;5:12393. [DOI] [PMC free article] [PubMed] [Google Scholar]
- 47. Mendes‐Silva AP, Pereira KS, Tolentino‐Araujo GT, et al. Shared biologic pathways between Alzheimer disease and major depression: a systematic review of MicroRNA expression studies. Am J Geriatr Psychiatry. 2016;24:903‐912. [DOI] [PubMed] [Google Scholar]
- 48. Wichers M, Geschwind N, van Os J, Peeters F. Scars in depression: is a conceptual shift necessary to solve the puzzle?. Psychol Med. 2010;40:359‐365. [DOI] [PubMed] [Google Scholar]
- 49. Moylan S, Maes M, Wray NR, Berk M. The neuroprogressive nature of major depressive disorder: pathways to disease evolution and resistance, and therapeutic implications. Mol Psychiatry. 2013;18:595‐606. [DOI] [PubMed] [Google Scholar]
- 50. Andreescu C, Ajilore O, Aizenstein HJ, et al. Disruption of neural homeostasis as a model of relapse and recurrence in late‐life depression. Am J Geriatr Psychiatry. 2019;27:1316‐1330. [DOI] [PMC free article] [PubMed] [Google Scholar]
- 51. Morris G, Puri BK, Walker AJ, et al. Shared pathways for neuroprogression and somatoprogression in neuropsychiatric disorders. Neurosci Biobehav Rev. 2019;107:862‐882. [DOI] [PubMed] [Google Scholar]
- 52. Bhat R, Crowe EP, Bitto A, et al. Astrocyte senescence as a component of Alzheimer's disease. PLoS One. 2012;7:e45069. [DOI] [PMC free article] [PubMed] [Google Scholar]
- 53. Rajji TK, Bowie CR, Herrmann N, et al. Design and rationale of the PACt‐MD randomized clinical trial: Prevention of Alzheimer’s dementia with cognitive remediation plus transcranial direct current stimulation in mild cognitive impairment and depression. J Alzheimer's Dis. (2020). 76(2):733–751. [DOI] [PubMed] [Google Scholar]
Associated Data
This section collects any data citations, data availability statements, or supplementary materials included in this article.
Supplementary Materials
Supporting information
Supporting information
Supporting information
Supporting information