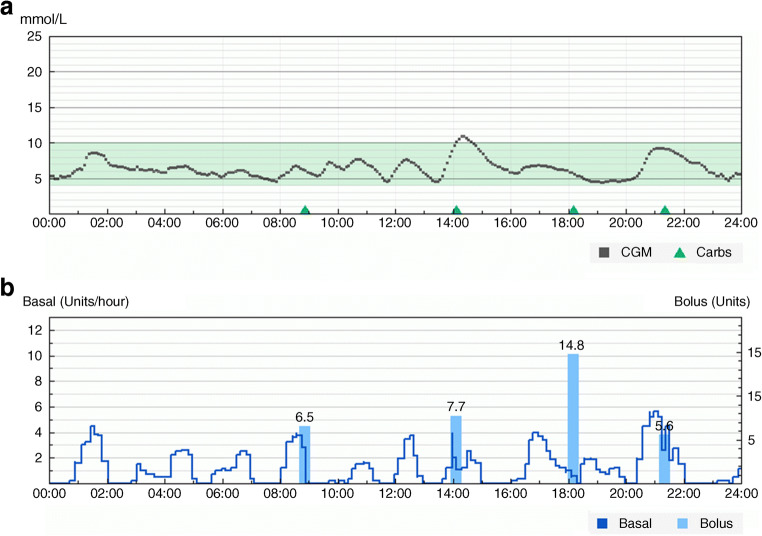
Fig. 3.
Hybrid closed-loop glucose control. (a) 24 h of sensor glucose data. Green shaded area is the target glucose range (3.9–10 mmol/l). Green triangles indicate carbohydrate (carbs) intake. (b) Algorithm-driven insulin delivery and manual insulin boluses. Data in both graphs derived from a Cambridge closed-loop study participant (the individual provided permission to share this anonymised data for the purpose of advancement of science). The graphs were generated using the data management platform Diasend (https://diasend.com//en). Image credit: Glooko Inc. All rights reserved. 2021. The x-axes show time in hours. This figure is available as part of a downloadable slideset

