

Abstract
Introduction and Objective: Benign prostatic hyperplasia (BPH) is an age-related disease that is frequently associated with chronic prostatic inflammation. In previous studies, we detected the presence of PSA protein in the stroma of BPH nodules and down-regulation of junction proteins E-cadherin and claudin-1. Transmission electron microscopy (TEM) imaging showed a decrease in tight junctions suggesting the luminal epithelial barrier in BPH tissues may be compromised. Recent in vitro studies showed that stimulation of benign prostate epithelial cell lines with TGF-β1 induced a decrease in claudin-1 expression suggesting that inflammation might be associated with alterations in the prostate epithelial barrier. This study explored the potential associations between aging and loss of junction proteins and the presence of inflammatory cells in prostate tissue specimens from young healthy donors and aged BPH patients. Methods: Immunostaining of serial prostate sections from 13 BPH patients and five healthy young donors was performed for claudin-1, CD4, CD8, CD20 and CD68. H-Scores and the number of inflammatory cells were calculated for the same area in donor, normal adjacent prostate (NAP) to and BPH specimens. Quantification and statistical correlation analyses were performed. Results: Claudin-1 immunostaining was inversely associated with increasing age, and inflammation in prostate specimens. B-cell infiltration increased with age and BPH was associated with an increased infiltration of T-cells and macrophages compared to NAP. Conclusions: These findings suggest that aging is associated with down-regulation of claudin-1 and claudin-1 is further decreased in BPH. Claudin-1 down-regulation was associated with increased infiltration of inflammatory cells in both NAP and BPH tissues. Claudin-1 down-regulation in the aging prostate could contribute to increased prostatic inflammation, subsequently contributing to BPH pathogenesis.
Keywords: Claudin-1, prostate, inflammation, BPH, aging
Introduction
Benign prostatic hyperplasia (BPH) is a common age-related prostatic disease and is the most common cause of lower urinary tract symptoms (LUTS) in men due in part to bladder outlet obstruction [1,2]. There can be a spectrum of clinical manifestations, ranging from urinary hesitancy, urgency, and frequency to acute urinary retention. Although generally not lethal, BPH is associated with significant morbidity, typically urinary bleeding, infections, bladder stones, and renal failure. Aging and androgens are two well-established risk factors for BPH/LUTS [3-7]. With increasing life expectancy, BPH incidence and costs for treatment and management of symptomatic BPH have risen [8]. Morphologic changes indicative of BPH have been consistently documented, as early as 50 years and in approximately 50% of men at the age of 50 [9]. Subsequently its prevalence increases about 10% each subsequent decade [10]. In parallel, LUTS is present in about 10%-20% of men at ages 50-59; and is present in about one-third of men by age 75 [10]. Prostate volume also increases with age, with the greatest increases appearing in the sixth and seventh decades of life [11]. The changes of BPH in the prostate manifest as a nodular proliferation, typically present in the transition zone of the prostate. Histologically BPH is most commonly an admixture of epithelial and stromal cells. However, in some cases glandular epithelial elements can predominate, while in others fibromuscular-rich stroma comprises the dominant constituent of the BPH nodule [12]. Understanding the mechanisms of BPH development and progression is important because it may eventually lead to novel preventive and/or treatment approaches.
Other factors, including inflammation could also impact BPH/LUTS pathogenesis and progression [13-18]. Inflammation detected in patients enrolled in the Medical Therapies of Prostate Symptoms (MTOPS) study predicted BPH progression events such as symptom worsening, acute urinary retention, and need for surgery [16]. In 8,224 men, statistically significant correlations were found between average and maximum chronic inflammation and IPSS variables, and more severe inflammation was associated with higher IPSS scores [15]. However, the causes and consequences of prostatic inflammation remain poorly understood. Defining the role of prostatic inflammation in BPH pathogenesis and associated LUTS may lead to new approaches to prevent and/or treat BPH/LUTS.
Our studies suggest that epithelial barrier proteins are altered in BPH and may contribute to prostatic inflammation. We previously reported the presence of secretory proteins prostate specific antigen (PSA) and kallikrein 2 (KLK2) in the stromal compartment and down-regulation of adherens junction protein E-cadherin and claudin-1 in mixed nodular BPH compared to associated normal adjacent tissues [19-21], suggesting that the epithelial barrier of BPH glands may be altered and leaky. Tight junction ‘kiss points’ in BPH luminal epithelial cells were decreased compared to normal adjacent prostate glands [22]. The presence of secretory proteins in the prostate stroma might induce stromal inflammation, proliferation or fibrosis, which are also frequently observed in BPH [14,23]. In rats, formalin-induced prostatic inflammation resulted in activation of the transforming growth factor beta 1 (TGF-β1) signaling pathway and down-regulation of E-cadherin immunostaining [24]. In benign prostate epithelial cell lines BHPrE1 and BPH-1, stimulation with TGF-β1 induced an increase in epithelial barrier permeability and a decrease in tight junction ‘kiss points’ [20,21], suggesting that inflammatory mediators could contribute to the down-regulation of E-cadherin and claudin-1. Chronic prostatic inflammation and increased TGF-β1 have been associated with age-related prostatic disease and the onset of LUTS (Reviewed in [13]). Furthermore, BPH patients with inflammation were shown to be at increased risk of clinical progression to acute urinary retention or urinary incontinence [17]. Down-regulation of junction proteins such as E-cadherin and claudin-1 may be associated with a decline in prostate epithelial barrier function and increased prostatic inflammation, thus contributing to the pathogenesis of BPH.
One of the single greatest risk factors for BPH is age [25]. Our previous studies showed profound claudin-1 down-regulation in clinical BPH specimens [21]. However, the potential mechanism for claudin-1 down-regulation in the prostate is unknown. Aging has been associated with changes in cell adhesion complexes and an increase in epithelial barrier permeability (Reviewed in [4]). Aging is also associated with increased prostatic inflammation [26,27]. Here we explored the potential association of claudin-1 and inflammation with aging in prostate tissue specimens from young healthy donor and BPH patients. Immunostaining of claudin-1, CD4, CD8, CD20 and CD68 was performed on serial sections from young healthy donor, normal adjacent prostate to BPH (NAP) and BPH tissues and scored for comparison. This study provides new insights into the potential association of aging with prostatic epithelial barrier permeability and prostatic inflammation.
Materials and methods
Patient cohort
The cases selected included 14 patients with symptomatic BPH who required surgical intervention via either a transurethral resection of the prostate or a simple prostatectomy. BPH consisted of mixed hyperplastic nodules comprised of both glandular and stromal proliferation. In addition, prostate specimens were obtained from 6 organ donors. Any case with the presence of moderate to severe prostatitis was excluded. The criteria used for defining moderate prostatitis was the presence of inflammatory cells in the prostate stroma infiltrating into prostate glands with or without presence of crypt abscess formation. Two patients were identified with prostatitis, one donor and one BPH, and were excluded from the analyses. None of these 20 patients had any prior history of chemo-, radio-, or hormone therapy. These “deidentified” specimens were retrieved from the clinical files of UPMC by the University of Pittsburgh Biospecimen Core (PBC) with approval from the University of Pittsburgh Institutional Review Board for this research project. PBC also provided deidentified pathology reports for the patients constituting the study cohort. All participating patients or their next of kin were asked to give consent for the banking protocol. The University of Pittsburgh has designed a generic consent form for tissue and biological specimen collection. This consent form also gives permission for tracking of patient progression, gathering of patient demographics and collection of clinically relevant information. Patient demographics for the analyzed cohort were listed in Table 1.
Table 1.
Demographics of human prostate tissue specimens for immunostaining study
| Tissue type | Mean age (range) | No. patients | Mean Prostate mass (g) | Mean Prostate volume (cm3) |
|---|---|---|---|---|
| BPH | 62.5 (50-77) | 13 | 81.4 | 74.7 |
| NAP | 62 (50-77) | 8 | ||
| Donor | 20.2 (15-26) | 5 | 39.1 | 24.1 |
BPH: benign prostatic hyperplasia. NAP: normal adjacent prostate.
Histopathologic analysis and immunohistochemistry
Samples were fixed in 10% formalin for at least 24 hrs, then embedded in paraffin. Immunohistochemical staining was performed on five-micron sections of paraffin-embedded prostate tissue specimens as described previously [22]. Briefly, sections were deparaffinized and rehydrated through a graded series of ethanol. Heat-induced epitope retrieval was performed using a BioCare Decloaking Chamber (Biocare Medical, Pacheco, CA), followed by 5 minutes rinsing in TBS buffer. Primary antibodies for immunostaining of prostate tissue sections were mouse monoclonal anti-claudin-1 (XX7, sc-81796, Santa Cruz Biotechnology, Dallas, TX), rabbit monoclonal anti-CD4 (EPR6855, ab133616, Abcam, Cambridge, MA, USA), mouse monoclonal anti-CD8 (144B, M7103, Dako), mouse monoclonal anti-CD20 (L26, 14-0202-82, Invitrogen, Carlsbad, CA, USA), and mouse monoclonal anti-CD68 (KP1, CM033, BioCare Medical). Serial sections were cut and stained using the following scheme: slide 1 was double stained with CD4 and CD8; slide 2 with CD20 and CD68, slide 3 with hematoxylin and eosin (H&E), and slide 4 with claudin-1. Slides were then counterstained in hematoxylin and cover-slipped. Stained sections were imaged with a Leica DM LB microscope (Leica Microsystems Inc., Bannockburn, IL, USA) equipped with an Imaging Source NII 770 camera (The Imaging Source Europe GmbH, Bremen, Germany) and NIS-Elements Documentation v 4.6 software (Nikon Instruments, Inc., Mellville, NY). All tissues were examined by a board-certified genitourinary pathologist (R.D.) using light microscopy. Scores for each antibody were determined for prostate glands in the same field for all slides by three independent investigators (L.E.P., W.C., and C.N.H.).
In silico analysis of claudin-1 gene expression in BPH and normal adjacent epithelium
Publicly available RNA-Seq data from prostate cancer specimens with concurrent BPH was queried to determine the differential expression of claudin-1 [28]. Expression level data for claudin-1 (CLDN1) was available for 19 specimens of normal peripheral zone prostate tissue and 37 BPH specimens as normalized log2 transcript levels.
Statistical methods
Summary statistics were provided for the three tissue groups: donor, NAP and BPH. Due to the smaller sample size in all three groups, the group comparison between donor vs. NAP and BPH vs. NAP for all the outcomes was presented with median and inter-quartile range values, and the significance was tested using Wilcoxon signed-rank test. The Pearson correlation coefficient was used to determine the correlation between claudin-1 and age in the combined samples from groups donor vs. NAP. To study the linear relationship, a simple linear regression analysis was used between the dependent variables (outcomes) and the group of the independent variable. A multiple regression method was used to include the predictor variable ‘Age’ along with the group (donor, NAP and BPH). Several regression models were built to see the significance of the primary predictor group and ‘Age’. A type I error or a p-value <0.05 was used as a threshold to identify statistical significance. Data were analyzed using SAS version 9.4 (SAS Institute Inc., Cary, NC, USA). GraphPad Prism version 9 was used for graphics (GraphPad Software, San Diego, CA, USA). Values are expressed as means ± S.D.
Results
Expression of tight junction protein claudin-1 in the aging prostate and in BPH
Claudin-1 expression was previously reported to localize in the basal cell layer of BPH but was absent or very rare in prostate cancer tissue [29]. In a more recent study, claudin-1 expression was increased in a fraction of prostate cancers and associated with a favorable prognosis in ERG-positive cancer [30]. We previously reported a reduction in claudin-1 expression in BPH tissue compared to NAP [21]. However, no previous reports of claudin-1 expression have compared expression in young healthy donor prostate to older BPH patient and normal prostate adjacent to BPH tissues. In our analysis, cytoplasmic claudin-1 immunostaining was observed in the luminal and basal epithelial cells of healthy young donor prostate glands (Figure 1A top panels). NAP glands in aged patients displayed a similar staining pattern (Figure 1A center panels), while claudin-1 immunostaining in BPH glands was observed in the basal epithelial cell layer as previously reported [21,29], or was completely absent (Figure 1A bottom panels). Quantification of the H-Score for each tissue type showed that claudin-1 expression was decreased with age and was further decreased in BPH (Figure 1B). In silico analysis of recently published RNA-Seq data for BPH and matched normal prostate from radical prostatectomy specimens (performed for prostate cancer) with concurrent BPH [28] showed that claudin-1 was down-regulated at the mRNA level as well (Figure 1C), in agreement with our previous findings that claudin-1 down-regulation was also evident at the mRNA level in the epithelium of BPH tissues [20].
Figure 1.
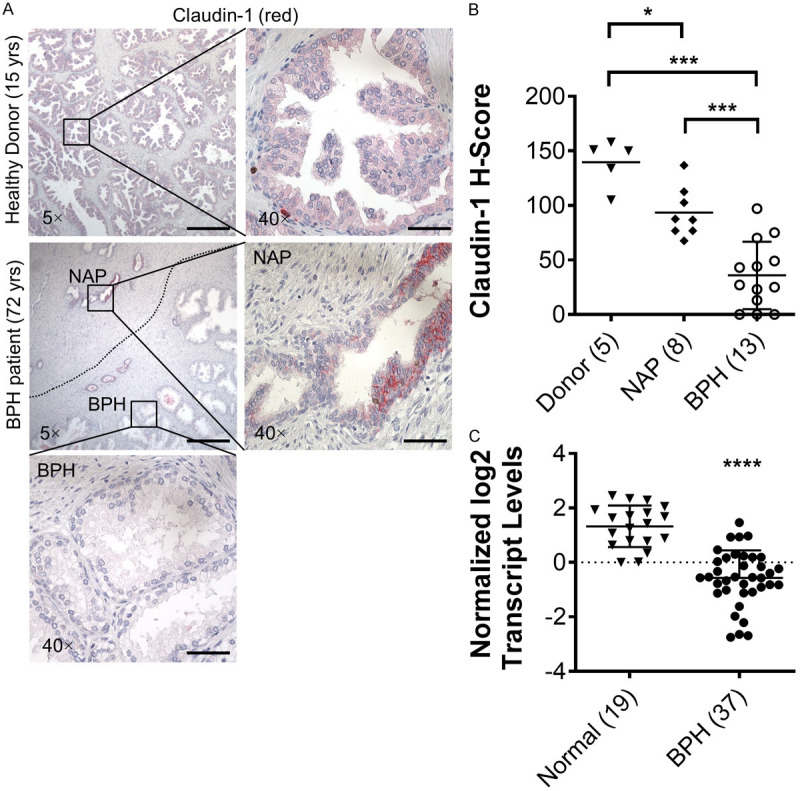
Expression of claudin-1 in the prostate. Immunostaining of claudin-1 expression in young healthy donor, normal adjacent prostate (NAP) and BPH specimens. A. Representative images showing the expression of claudin-1 (red). Scale bars indicate 400 µm in 5×, 50 µm in 40×. Age of patient in parentheses. B. Quantification of mean claudin-1 staining intensity H-score. C. Quantification of claudin-1 mRNA expression from in silico analysis of RNA-Seq data [28]. Number of patients in parentheses. Data represent mean ± S.D.; *, P<0.05; ***, P<0.001; ****, P<0.0001.
Inflammation in the aging prostate and BPH
Serial sections of the same prostate specimens used to examine claudin-1 were also stained for inflammatory cell markers. The number of infiltrating inflammatory cells was counted per 40× field in each corresponding area of healthy young donor tissue and older patients with BPH and corresponding NAP (Figure 2). Compared to young donor tissues, older NAP tissues displayed a decrease in claudin-1 immunostaining, an increase in the infiltration of CD20 positive B-cells and an increase in prostate volume (Table 2). BPH tissues displayed a further decrease in claudin-1 immunostaining as well as an increased infiltration of CD4 and CD8 positive T-cells and CD68 positive macrophages (Table 2; Figure 3). The average number of CD20 positive B-cells was increased with age (Figure 3A), while BPH displayed a significant increase in the average number of both CD4 and CD8 positive killer T-cells compared to NAP (Figure 3B). The overall average number of CD20 positive B-cells and CD68 positive macrophage cells was not differentially expressed in donor compared to older NAP tissues, but BPH displayed a significant increase in CD68 positive macrophages compared to NAP (Figure 3C, 3D).
Figure 2.

Immunostaining of claudin-1, CD4 (brown), CD8 (red), CD20 (red) and CD68 (brown) in serial sections of young healthy donor, normal adjacent prostate (NAP) and BPH specimens. Age of patient in parentheses. Scale bars indicate 50 µm in 40×.
Table 2.
Comparing claudin-1 H-Score and number of inflammatory cells per field in young healthy donor (Donor), normal adjacent prostate to BPH (NAP) and BPH tissues. Donor vs. NAP and BPH vs. NAP
| Outcome | Donor (n=5) vs. NAP (n=8) | P value1 | BPH (n=13) vs. NAP (n=8) | P value1 | ||
|---|---|---|---|---|---|---|
|
|
|
|||||
| Median (IQR) | Median (IQR) | Median (IQR) | Median (IQR) | |||
| Claudin-1 H-Score | 150 (17) | 87.1 (30.8) | 0.0156 | 27 (36) | 87.1 (30.8) | 0.0002 |
| Number of CD8 positive cells per field | 1.2 (1) | 0.4 (1.2) | 0.3353 | 2 (1.3) | 0.4 (1.2) | 0.0135 |
| Number of CD4 positive cells per field | 1.4 (0.6) | 1.8 (2.1) | 0.6084 | 4.5 (3.3) | 1.8 (2.1) | 0.0271 |
| Number of CD20 positive cells per field | 0.1 (0.1) | 0.7 (1.3) | 0.0463 | 2 (3) | 0.7 (1.3) | 0.4240 |
| Number of CD68 positive cells per field | 1.3 (0.8) | 0.8 (0.9) | 0.8260 | 1.8 (1.8) | 0.8 (0.9) | 0.0326 |
| Prostate mass (g) | 36 (9) | 49.1 (47.3) | 0.3142 | 55.4 (43.1) | 49.1 (47.3) | 0.4810 |
| Prostate volume (cm3) | 19.1 (2.6) | 33.5 (30.2) | 0.0135 | 45.4 (40.7) | 33.5 (30.2) | 0.6053 |
IQR: Inter-Quartile range (difference between third quartile-First Quartile).
P value based non-parametric test using Wilcoxon Signed Rank Test due to smaller sample size.
Bold indicates statistically significant difference between groups. BPH: benign prostatic hyperplasia. NAP: normal adjacent prostate.
Figure 3.
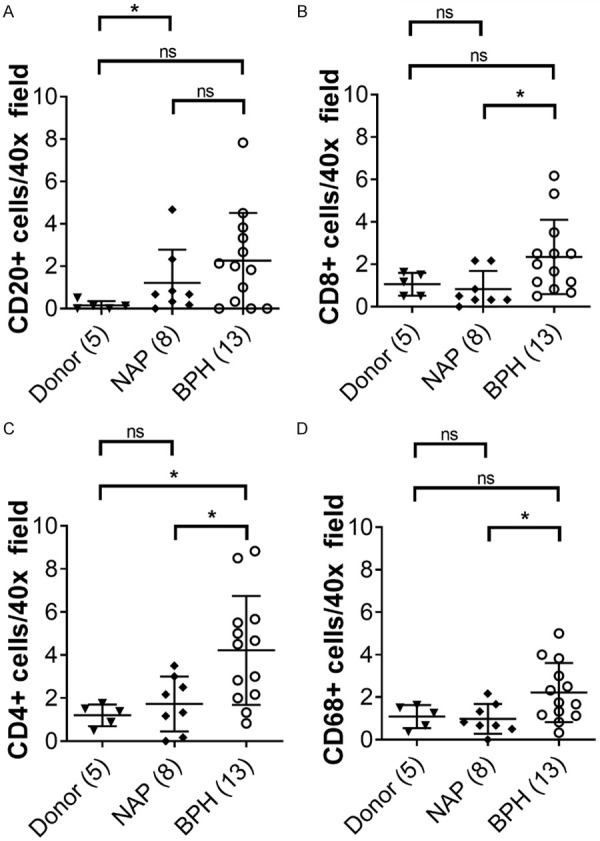
Inflammation in the prostate. Quantification of the number of inflammatory cells in prostate tissues from young healthy donors, normal adjacent prostate (NAP) and BPH. A. Quantification of CD4 positive T-cells. B. Quantification of CD8 positive T-cells. C. Quantification of CD20 positive B-cells. D. Quantification of CD68 positive macrophages. Number of patients in parentheses. Data represent mean ± S.D.; *, P<0.05; **, P<0.01. ns, not significant.
Correlation of claudin-1 and inflammation with age and BPH
Correlation analyses identified a significant negative correlation between claudin-1 and age in the prostate (-0.64, P = 0.0182). A simple linear regression model comparing donor versus NAP revealed a significant association between claudin-1 down-regulation and increasing age (Table 3). Aging was also associated with an increase in prostate mass and volume (Table 3). When comparing BPH to NAP, there was a significant association between claudin-1 down-regulation and increased CD4 and CD8 positive T-cells and CD68 positive macrophages (Table 4). BPH was also associated with an increase in prostate mass and volume (Table 4). Pearson correlation analysis comparing claudin-1 to age, inflammatory cells, prostate mass and volume in all prostate tissues analyzed showed that claudin-1 expression was negatively correlated with age, CD4, CD20 and CD68 (Table 5).
Table 3.
Generalized Linear Model (Donor vs. NAP). The unadjusted and covariate adjusted model with intercept, estimate, SE of both and its significance
| Outcome Model | Simple Regression Model | Adjusted with Covariate | ||||
|---|---|---|---|---|---|---|
|
|
|
|||||
| Estimate (SE) | P value | R-square | Estimate (SE) | P value | R-square | |
| Claudin-1 H-Score Average | 0.41 | 0.56 | ||||
| Intercept | 151.96 (16.33) | -- | 130.47 (18.73) | --- | ||
| Age | -0.89 (0.32) | 0.0182 | 0.45 (0.78) | 0.5735 | ||
| Group (ref.=Donor) | --- | --- | -65.15 (34.98) | 0.0921 | ||
| Number of CD8 positive cells per field | 0.01 | 0.05 | ||||
| Intercept | 1.042 (0.49) | -- | 0.77 (0.64) | --- | ||
| Age | -0.003 (0.01) | 0.7896 | 0.02 (0.030 | 0.5939 | ||
| Group (ref.=Donor) | --- | --- | -0.83 (1.19) | 0.4991 | ||
| Number of CD4 positive cells per field | 0.07 | 0.07 | ||||
| Intercept | 0.96 (0.68) | --- | 0.99 (0.91) | --- | ||
| Age | 0.01 (0.01) | 0.3796 | 0.01 (0.04) | 0.7911 | ||
| Group (ref.=Donor) | --- | --- | 0.10 (1.70) | 0.9546 | ||
| Number of CD20 positive cells per field | 0.11 | 0.18 | ||||
| Intercept | -0.08 (0.83) | --- | 0.51 (1.07) | --- | ||
| Age | 0.02 (0.02) | 0.2655 | -0.02 (0.04) | 0.6981 | ||
| Group (ref.=Donor) | --- | --- | 1.80 (1.99) | 0.3898 | ||
| Number of CD68 positive cells per field | 0.06 | 0.22 | ||||
| Intercept | 1.34 (0.40) | --- | 1.76 (0.49) | -- | ||
| Age | -0.07 (0.01) | 0.4032 | -0.03 (0.02) | 0.1289 | ||
| Group (ref.=Donor) | --- | --- | 1.30 (0.91) | 0.1865 | ||
| Prostate mass (g) | 0.37 | 0.51 | ||||
| Intercept | 23.7 (12.86) | --- | 6.01 (17.04) | --- | ||
| Age | 0.64 (0.28) | 0.0468 | 1.67 (0.74) | 0.0551 | ||
| Group (ref.=Donor) | --- | --- | -45.17 (30.65) | 0.1787 | ||
| Prostate volume (cm3) | 0.61 | 0.84 | ||||
| Intercept | -2.85 (11.45) | --- | -29.07 (10.94) | --- | ||
| Age | 0.94 (0.25) | 0.0045 | 2.46 (0.48) | 0.0009 | ||
| Group (ref.=Donor) | --- | --- | -66.94 (19.67) | 0.0093 | ||
R-Square: Square of correlation. NAP: normal adjacent prostate.
Table 4.
The unadjusted and covariate adjusted model with intercept, estimate, SE of both and its significance (NAP vs. BPH)
| Outcome Model | Simple Regression Model | Adjusted with Covariate | ||||
|---|---|---|---|---|---|---|
|
|
|
|||||
| Estimate (SE) | P value | R-square | Estimate (SE) | P value | R-square | |
| Claudin-1 H-Score Average | 0.52 | 0.52 | ||||
| Intercept | 93.33 (9.97) | -- | 80.01 (43.05) | --- | ||
| Group (ref.=NAP) | -57.49 (12.67) | 0.0002 | -57.60 (12.98) | 0.0003 | ||
| Age | --- | --- | 0.22 (0.67) | 0.7537 | ||
| Number of CD8 positive cells per filed | 0.21 | 0.23 | ||||
| Intercept | 0.83 (0.52) | --- | -0.69 (2.24) | -- | ||
| Group (ref.=NAP) | 1.51 (0.67) | 0.0352 | 1.50 (0.68) | 0.0398 | ||
| Age | --- | --- | 0.02 (0.04) | 0.4924 | ||
| Number of CD4 positive cells per field | 0.26 | 0.30 | ||||
| Intercept | 1.73 (0.76) | --- | 4.92 (3.20) | --- | ||
| Group (ref.=NAP) | 2.49 (0.97) | 0.0186 | 2.52 (0.97) | 0.0179 | ||
| Age | --- | --- | -0.05 (0.05) | 0.3180 | ||
| Number of CD20 positive cells per field | 0.07 | 0.14 | ||||
| Intercept | 1.21 (0.72) | --- | 4.88 (2.97) | --- | ||
| Group (ref.=NAP) | 1.06 (0.91) | 0.2600 | 1.09 (0.90) | 0.2401 | ||
| Age | --- | --- | -0.06 (0.05) | 0.2193 | ||
| Number of CD68 positive cells per field | 0.22 | 0.25 | ||||
| Intercept | 0.98 (0.42) | --- | 2.43 (1.78) | --- | ||
| Group (ref.=NAP) | 1.24 (0.53) | 0.0310 | 1.25 (0.54) | 0.0314 | ||
| Age | --- | --- | -0.02 (0.03) | 0.4133 | ||
| Prostate mass (g) | 0.04 | 0.38 | ||||
| Intercept | 58.94 (23.18) | --- | -158.28 (77.91) | --- | ||
| Group (ref.=NAP) | 22.43 (28.39) | 0.4410 | 12.25 (23.80) | 0.6142 | ||
| Age | --- | --- | 3.70 (1.29) | 0.0115 | ||
| Prostate volume (cm3) | 0.03 | 0.37 | ||||
| Intercept | 48.29 (31.17) | --- | -241.37 (105.23) | --- | ||
| Group (ref.=NAP) | 26.36 (38.18) | 0.4998 | 12.78 (32.15) | 0.6965 | ||
| Age | --- | --- | 4.94 (1.74) | 0.0124 | ||
R-Square: Square of correlation. BPH: benign prostatic hyperplasia. NAP: normal adjacent prostate.
Table 5.
Pearson correlation of claudin-1 with inflammatory cells
| Claudin-1 vs. | Age | CD8 | CD4 | CD20 | CD68 | Mass | Volume |
|---|---|---|---|---|---|---|---|
| Pearson r | |||||||
| r | -0.5838 | -0.2751 | -0.6099 | -0.5560 | -0.4246 | -0.2660 | -0.2745 |
| 95% CI | -0.7921 to -0.2539 | -0.5986 to 0.1257 | -0.8067 to -0.2915 | -0.7762 to -0.2149 | -0.6973 to -0.04460 | -0.6112 to 0.1642 | -0.6169 to 0.1553 |
| R squared | 0.3409 | 0.07566 | 0.3720 | 0.3091 | 0.1803 | 0.07075 | 0.07534 |
| P value | |||||||
| P (two-tailed) | 0.0017 | 0.1738 | 0.0009 | 0.0032 | 0.0306 | 0.2199 | 0.2050 |
CI: confidence interval. Bold indicates statistically significant between groups.
Discussion
The tight junction protein claudin-1 is critical for the maintenance of the epithelial barrier [31] and is expressed by tight epithelia [32]. Deletion of claudin-1 in a mouse model resulted in severe dehydration and death within 1 day of birth due to the loss of a tight junction barrier and subsequent excessive transepidermal water loss across the skin [33]. Previous studies of claudin-1 expression in prostate tissues have mainly focused on its differential expression in prostate cancer. Loss of claudin-1 was associated with prostate cancer invasion, progression and metastatic transformation [29,34], while increased claudin-1 expression was correlated with better prognosis [30]. We recently reported that claudin-1 expression was down-regulated in BPH [20,21], which is another prevalent prostate disease associated with aging in men [35,36]. Our immunostaining results reveal that immunostaining of claudin-1 was significantly decreased with age in the prostate, while the average number of B-cells was increased with age. Claudin-1 immunostaining was further decreased in mixed hyperplastic epithelial and stromal nodules of BPH tissues compared to NAP, and this decrease was associated with increased infiltration of T-cells and macrophages. A reduction in claudin-1 within tight junctions of BPH glands could help explain our previous findings of PSA in the prostatic stroma of BPH tissues [19]. This could be a consequence of claudin-1 down-regulation resulting in a loss of tight junctions and a “leaky” prostate luminal epithelial barrier in BPH glands. Increased leakiness and decreased claudin protein expression with age has been reported in other tissues [37] and could contribute to the development of age-related diseases. Taken together, these findings and ours suggest that claudin-1 plays a critical role in the maintenance of the prostate epithelial barrier and altered claudin-1 expression in the aging prostate could contribute to the development of age-related prostatic disease.
The presence of increased inflammatory cell infiltration in the current study is consistent with the frequent histologic finding of inflammation associated with BPH [15,38]. Chronic prostatic inflammation has been associated with prostatic enlargement and LUTS; and has been implicated as a cause of prostatic fibrosis and subsequent bladder outlet obstruction (Reviewed in [39]). Chronic prostatic inflammation has also been associated with the severity of bladder voiding dysfunction in patients [38]. Several rodent studies have shown that chemical- or bacterial-induced prostatic inflammation can induce bladder overactivity [24,40,41], further implicating prostatic inflammation as a potential contributing factor to BPH pathogenesis. We have also previously shown that inflammatory cytokine, TGF-β1, could down-regulate claudin-1 mRNA and increase transepithelial electrical resistance and FITC-dextran diffusion in benign prostatic epithelial cell lines grown in a monolayer [20,21], suggesting that inflammation could inhibit claudin-1 expression and contribute to increased epithelial barrier permeability. Here, we showed that claudin-1 was inversely correlated with age and the infiltration of inflammatory cells in the prostate, suggesting that alterations to the epithelial barrier were associated with increased prostatic inflammation. Thus, age-related claudin-1 down-regulation could result in the loss of tight junctions and a leaky prostate epithelial barrier. Defects in the prostate epithelial barrier could subsequently trigger the infiltration of inflammatory cells and secretion of inflammatory cytokines, the further inhibition of claudin-1 expression, and a chronic inflammatory response.
In summary, our results suggest that a compromise of tight junction structure and function as manifested by reductions in claudin-1, could be a consequence of normal aging in the prostate and ultimately contribute to inflammatory cell infiltration in the prostate and the development of BPH.
Acknowledgements
We are grateful to Elaine V. Byrnes and Paul Knizner for technical support. This work was funded in part by NIH grants U54 from NIDDK, DK112079 (ZW), R56 DK107492 (ZW), and 1R50 CA211242 (LEP), American Urology Association Award (WC). This project used the Hillman Cancer Center Tissue and Research Pathology Services (TARPS) and the Pitt Biospecimen Core and was supported in part by award P30CA047904 with additional support from the University of Pittsburgh Institute for Precision Medicine.
Disclosure of conflict of interest
None.
Abbreviations
- BPH
benign prostatic hyperplasia
- LUTS
lower urinary tract symptoms
- NAP
normal adjacent prostate
References
- 1.Ng M, Baradhi KM. Benign prostatic hyperplasia. Treasure Island (FL): StatPearls; 2020. [PubMed] [Google Scholar]
- 2.Andersson KE, de Groat WC, McVary KT, Lue TF, Maggi M, Roehrborn CG, Wyndaele JJ, Melby T, Viktrup L. Tadalafil for the treatment of lower urinary tract symptoms secondary to benign prostatic hyperplasia: pathophysiology and mechanism(s) of action. Neurourol Urodyn. 2011;30:292–301. doi: 10.1002/nau.20999. [DOI] [PubMed] [Google Scholar]
- 3.Isaacs JT, Coffey DS. Etiology and disease process of benign prostatic hyperplasia. Prostate Suppl. 1989;2:33–50. doi: 10.1002/pros.2990150506. [DOI] [PubMed] [Google Scholar]
- 4.Vickman RE, Franco OE, Moline DC, Vander Griend DJ, Thumbikat P, Hayward SW. The role of the androgen receptor in prostate development and benign prostatic hyperplasia: a review. Asian J Urol. 2020;7:191–202. doi: 10.1016/j.ajur.2019.10.003. [DOI] [PMC free article] [PubMed] [Google Scholar]
- 5.Banerjee PP, Banerjee S, Brown TR, Zirkin BR. Androgen action in prostate function and disease. Am J Clin Exp Urol. 2018;6:62–77. [PMC free article] [PubMed] [Google Scholar]
- 6.Barry M, Roehrborn C. Management of benign prostatic hyperplasia. Annu Rev Med. 1997;48:177–189. doi: 10.1146/annurev.med.48.1.177. [DOI] [PubMed] [Google Scholar]
- 7.Lee C, Kozlowski JM, Grayhack JT. Etiology of benign prostatic hyperplasia. Urol Clin North Am. 1995;22:237–246. [PubMed] [Google Scholar]
- 8.Vuichoud C, Loughlin KR. Benign prostatic hyperplasia: epidemiology, economics and evaluation. Can J Urol. 2015;22(Suppl 1):1–6. [PubMed] [Google Scholar]
- 9.Lim KB. Epidemiology of clinical benign prostatic hyperplasia. Asian J Urol. 2017;4:148–151. doi: 10.1016/j.ajur.2017.06.004. [DOI] [PMC free article] [PubMed] [Google Scholar]
- 10.Egan KB. The epidemiology of benign prostatic hyperplasia associated with lower urinary tract symptoms: prevalence and incident rates. Urol Clin North Am. 2016;43:289–297. doi: 10.1016/j.ucl.2016.04.001. [DOI] [PubMed] [Google Scholar]
- 11.Loeb S, Kettermann A, Carter HB, Ferrucci L, Metter EJ, Walsh PC. Prostate volume changes over time: results from the Baltimore Longitudinal Study of Aging. J Urol. 2009;182:1458–1462. doi: 10.1016/j.juro.2009.06.047. [DOI] [PMC free article] [PubMed] [Google Scholar]
- 12.Chughtai B, Forde JC, Thomas DD, Laor L, Hossack T, Woo HH, Te AE, Kaplan SA. Benign prostatic hyperplasia. Nat Rev Dis Primers. 2016;2:16031. doi: 10.1038/nrdp.2016.31. [DOI] [PubMed] [Google Scholar]
- 13.De Nunzio C, Presicce F, Tubaro A. Inflammatory mediators in the development and progression of benign prostatic hyperplasia. Nat Rev Urol. 2016;13:613–626. doi: 10.1038/nrurol.2016.168. [DOI] [PubMed] [Google Scholar]
- 14.Fibbi B, Penna G, Morelli A, Adorini L, Maggi M. Chronic inflammation in the pathogenesis of benign prostatic hyperplasia. Int J Androl. 2010;33:475–488. doi: 10.1111/j.1365-2605.2009.00972.x. [DOI] [PubMed] [Google Scholar]
- 15.Nickel JC, Roehrborn CG, O’Leary MP, Bostwick DG, Somerville MC, Rittmaster RS. The relationship between prostate inflammation and lower urinary tract symptoms: examination of baseline data from the REDUCE trial. Eur Urol. 2008;54:1379–1384. doi: 10.1016/j.eururo.2007.11.026. [DOI] [PMC free article] [PubMed] [Google Scholar]
- 16.Roehrborn CG. Male lower urinary tract symptoms (LUTS) and benign prostatic hyperplasia (BPH) Med Clin North Am. 2011;95:87–100. doi: 10.1016/j.mcna.2010.08.013. [DOI] [PubMed] [Google Scholar]
- 17.Torkko KC, Wilson RS, Smith EE, Kusek JW, van Bokhoven A, Lucia MS. Prostate biopsy markers of inflammation are associated with risk of clinical progression of benign prostatic hyperplasia: findings from the MTOPS study. J Urol. 2015;194:454–461. doi: 10.1016/j.juro.2015.03.103. [DOI] [PubMed] [Google Scholar]
- 18.Xiong Y, Zhang Y, Li X, Qin F, Yuan J. The prevalence and associated factors of lower urinary tract symptoms suggestive of benign prostatic hyperplasia in aging males. Aging Male. 2020:1–8. doi: 10.1080/13685538.2020.1781806. [DOI] [PubMed] [Google Scholar]
- 19.O’Malley KJ, Eisermann K, Pascal LE, Parwani AV, Majima T, Graham L, Hrebinko K, Acquafondata M, Stewart NA, Nelson JB, Yoshimura N, Wang Z. Proteomic analysis of patient tissue reveals PSA protein in the stroma of benign prostatic hyperplasia. Prostate. 2014;74:892–900. doi: 10.1002/pros.22807. [DOI] [PMC free article] [PubMed] [Google Scholar]
- 20.Li F, Pascal LE, Wang K, Zhou Y, Balasubramani GK, O’Malley KJ, Dhir R, He K, Stolz D, DeFranco DB, Yoshimura N, Nelson JB, Chong T, Guo P, He D, Wang Z. Transforming growth factor beta 1 impairs benign prostatic luminal epithelial cell monolayer barrier function. Am J Clin Exp Urol. 2020;8:9–17. [PMC free article] [PubMed] [Google Scholar]
- 21.Wang K, Pascal LE, Li F, Chen W, Dhir R, Balasubramani GK, DeFranco DB, Yoshimura N, He D, Wang Z. Tight junction protein claudin-1 is downregulated by TGF-beta1 via MEK signaling in benign prostatic epithelial cells. Prostate. 2020;80:1203–1215. doi: 10.1002/pros.24046. [DOI] [PMC free article] [PubMed] [Google Scholar]
- 22.Li F, Pascal LE, Stolz DB, Wang K, Zhou Y, Chen W, Xu Y, Chen Y, Dhir R, Parwani AV, Nelson JB, DeFranco DB, Yoshimura N, Balasubramani GK, Gingrich JR, Maranchie JK, Jacobs BL, Davies BJ, Hrebinko RL, Bigley JD, McBride D, Guo P, He D, Wang Z. E-cadherin is downregulated in benign prostatic hyperplasia and required for tight junction formation and permeability barrier in the prostatic epithelial cell monolayer. Prostate. 2019;79:1226–1237. doi: 10.1002/pros.23806. [DOI] [PMC free article] [PubMed] [Google Scholar]
- 23.Rodriguez-Nieves JA, Macoska JA. Prostatic fibrosis, lower urinary tract symptoms, and BPH. Nat Rev Urol. 2013;10:546–550. doi: 10.1038/nrurol.2013.149. [DOI] [PMC free article] [PubMed] [Google Scholar]
- 24.Funahashi Y, O’Malley KJ, Kawamorita N, Tyagi P, DeFranco DB, Takahashi R, Gotoh M, Wang Z, Yoshimura N. Upregulation of androgen-responsive genes and transforming growth factor-beta1 cascade genes in a rat model of non-bacterial prostatic inflammation. Prostate. 2014;74:337–345. doi: 10.1002/pros.22668. [DOI] [PMC free article] [PubMed] [Google Scholar]
- 25.Meng J, Liu Y, Guan SY, Ma H, Zhang X, Fan S, Hu H, Zhang M, Liang C. Age, height, BMI and FBG predict prostate volume in ageing benign prostatic hyperplasia: evidence from 5285 patients. Int J Clin Pract. 2019:e13438. doi: 10.1111/ijcp.13438. [DOI] [PubMed] [Google Scholar]
- 26.Crowell PD, Fox JJ, Hashimoto T, Diaz JA, Navarro HI, Henry GH, Feldmar BA, Lowe MG, Garcia AJ, Wu YE, Sajed DP, Strand DW, Goldstein AS. Expansion of luminal progenitor cells in the aging mouse and human prostate. Cell Rep. 2019;28:1499–1510. e1496. doi: 10.1016/j.celrep.2019.07.007. [DOI] [PMC free article] [PubMed] [Google Scholar]
- 27.Bianchi-Frias D, Vakar-Lopez F, Coleman IM, Plymate SR, Reed MJ, Nelson PS. The effects of aging on the molecular and cellular composition of the prostate microenvironment. PLoS One. 2010;5:e12501. doi: 10.1371/journal.pone.0012501. [DOI] [PMC free article] [PubMed] [Google Scholar]
- 28.Middleton LW, Shen Z, Varma S, Pollack AS, Gong X, Zhu S, Zhu C, Foley JW, Vennam S, Sweeney RT, Tu K, Biscocho J, Eminaga O, Nolley R, Tibshirani R, Brooks JD, West RB, Pollack JR. Genomic analysis of benign prostatic hyperplasia implicates cellular re-landscaping in disease pathogenesis. JCI Insight. 2019;5:e129749. doi: 10.1172/jci.insight.129749. [DOI] [PMC free article] [PubMed] [Google Scholar]
- 29.Krajewska M, Olson AH, Mercola D, Reed JC, Krajewski S. Claudin-1 immunohistochemistry for distinguishing malignant from benign epithelial lesions of prostate. Prostate. 2007;67:907–910. doi: 10.1002/pros.20578. [DOI] [PubMed] [Google Scholar]
- 30.Kind S, Buscheck F, Hoflmayer D, Hube-Magg C, Kluth M, Tsourlakis MC, Steurer S, Clauditz TS, Luebke AM, Burandt E, Wilczak W, Hinsch A, Dum D, Weidemann S, Fraune C, Beyer B, Steuber T, Huland H, Graefen M, Fisch M, Simon R, Sauter G, Schlomm T, Minner S, Eichenauer T. Claudin-1 upregulation is associated with favorable tumor features and a reduced risk for biochemical recurrence in ERG-positive prostate cancer. World J Urol. 2020;38:2185–2196. doi: 10.1007/s00345-019-03017-w. [DOI] [PubMed] [Google Scholar]
- 31.Gonzalez-Mariscal L, Betanzos A, Nava P, Jaramillo BE. Tight junction proteins. Prog Biophys Mol Biol. 2003;81:1–44. doi: 10.1016/s0079-6107(02)00037-8. [DOI] [PubMed] [Google Scholar]
- 32.Claude P, Goodenough DA. Fracture faces of zonulae occludentes from “tight” and “leaky” epithelia. J Cell Biol. 1973;58:390–400. doi: 10.1083/jcb.58.2.390. [DOI] [PMC free article] [PubMed] [Google Scholar]
- 33.Furuse M, Hata M, Furuse K, Yoshida Y, Haratake A, Sugitani Y, Noda T, Kubo A, Tsukita S. Claudin-based tight junctions are crucial for the mammalian epidermal barrier: a lesson from claudin-1-deficient mice. J Cell Biol. 2002;156:1099–1111. doi: 10.1083/jcb.200110122. [DOI] [PMC free article] [PubMed] [Google Scholar]
- 34.Seo KW, Kwon YK, Kim BH, Kim CI, Chang HS, Choe MS, Park CH. Correlation between claudins expression and prognostic factors in prostate cancer. Korean J Urol. 2010;51:239–244. doi: 10.4111/kju.2010.51.4.239. [DOI] [PMC free article] [PubMed] [Google Scholar]
- 35.Das AK, Leong JY, Roehrborn CG. Office-based therapies for benign prostatic hyperplasia: a review and update. Can J Urol. 2019;26:2–7. [PubMed] [Google Scholar]
- 36.Boukovala M, Spetsieris N, Efstathiou E. Systemic treatment of prostate cancer in elderly patients: current role and safety considerations of androgen-targeting strategies. Drugs Aging. 2019;36:701–717. doi: 10.1007/s40266-019-00677-6. [DOI] [PubMed] [Google Scholar]
- 37.D’Souza T, Sherman-Baust CA, Poosala S, Mullin JM, Morin PJ. Age-related changes of claudin expression in mouse liver, kidney, and pancreas. J Gerontol A Biol Sci Med Sci. 2009;64:1146–1153. doi: 10.1093/gerona/glp118. [DOI] [PMC free article] [PubMed] [Google Scholar]
- 38.Inamura S, Shinagawa T, Hoshino H, Sakai Y, Imamura Y, Yokoyama O, Kobayashi M. Appearance of high endothelial venule-like vessels in benign prostatic hyperplasia is associated with lower urinary tract symptoms. Prostate. 2017;77:794–802. doi: 10.1002/pros.23319. [DOI] [PubMed] [Google Scholar]
- 39.Bushman WA, Jerde TJ. The role of prostate inflammation and fibrosis in lower urinary tract symptoms. Am J Physiol Renal Physiol. 2016;311:F817–F821. doi: 10.1152/ajprenal.00602.2015. [DOI] [PubMed] [Google Scholar]
- 40.Funahashi Y, Takahashi R, Mizoguchi S, Suzuki T, Takaoka E, Ni J, Wang Z, DeFranco DB, de Groat WC, Tyagi P, Yoshimura N. Bladder overactivity and afferent hyperexcitability induced by prostate-to-bladder cross-sensitization in rats with prostatic inflammation. J Physiol. 2019;597:2063–2078. doi: 10.1113/JP277452. [DOI] [PMC free article] [PubMed] [Google Scholar]
- 41.Lee S, Yang G, Bushman W. Prostatic inflammation induces urinary frequency in adult mice. PLoS One. 2015;10:e0116827. doi: 10.1371/journal.pone.0116827. [DOI] [PMC free article] [PubMed] [Google Scholar]