

Abstract
BACKGROUND AND PURPOSE:
Quantitative MR imaging techniques may improve the pathologic specificity of MR imaging regarding white matter abnormalities. Our purposes were to determine whether ADC, FA, MTR, and MRS metabolites correlate with the degree of white matter damage in patients with X-ALD; whether differences in ADC, FA, and MTR observed in vivo are retained in fresh and formalin-fixed postmortem brain tissue; and whether the differences predict histopathology.
MATERIALS AND METHODS:
MRS metabolites, MTR, ADC, and FA, were determined in 7 patients with X-ALD in 3 white matter areas (NAWM, active demyelination, and complete demyelination) and were compared with values obtained in 14 controls. MTR, ADC, and FA were assessed in postmortem brains from 15 patients with X-ALD and 5 controls. Values were correlated with the degree of astrogliosis and density of myelin, axons, and cells. Equations to estimate histopathology from MR imaging parameters were calculated by linear regression analysis.
RESULTS:
MRS showed increased mIns, Lac, and Cho and decreased tNAA in living patients with X-ALD; the values depended on the degree of demyelination. MTR, ADC, and FA values were different in postmortem than in vivo white matter, but differences related to degrees of white matter damage were retained. ADC was high and FA and MTR were low in abnormal white matter. Correlations between histopathologic findings and MR imaging parameters were strong. A combination of ADC and FA predicted pathologic parameters best.
CONCLUSIONS:
Changes in quantitative MR imaging parameters, present in living patients and related to the severity of white matter pathology, are retained in postmortem brain tissue. MR imaging parameters predict white matter histopathologic parameters.
Conventional MR imaging has a high sensitivity for the detection of white matter abnormalities. However, it cannot distinguish among different pathologic substrates of white matter lesions. Pathologic findings associated with T2 hyperintensity and T1 hypointensity of the white matter are highly variable and include hypomyelination, demyelination, axonal loss, gliosis, interstitial edema, and cystic white matter degeneration.1 Application of additional quantitative MR imaging techniques, such as DTI, MTI, and proton MRS, may improve the pathologic specificity of MR imaging findings and, in this way, add to the understanding of white matter disease processes. Quantitative MR imaging parameters may also provide reliable measures of the degree of white matter abnormality and may be applicable in the monitoring of treatment of white matter disorders.
X-ALD is one of the most common leukodystrophies. In 80% of the patients with cerebral involvement, MR imaging shows a large bilateral white matter lesion involving the periventricular and deep white matter of the posterior parietal and occipital lobes.2 Histopathologically, the center of the lesion is characterized by almost complete loss of axons and myelin, accompanied by attenuated astrogliosis. Active demyelination occurs at the edge of the lesion, accompanied by axonal damage and loss and inflammation.2,3 Outside the lesion, the white matter is apparently normal. We decided to study the possible contribution of quantitative MR imaging parameters to the prediction of histologic parameters and chose X-ALD as the study subject because this disease allows comparison of large white matter areas with different degrees of myelin loss, axonal loss, and gliosis within the same brain section.
A few studies have investigated the pathologic specificity of quantitative MR imaging parameters in the white matter of postmortem MS brains by comparing them with histopathologic parameters in MS lesions. In a study by Schmierer et al4 significant correlations were found between myelin content and MTR and between myelin content and axonal count. In an earlier study by van Waesberghe et al,5 T1 signal intensity and MTR were strongly correlated with axonal attenuation. Comparison of MRS and stereotactic brain biopsy findings in patients with MS revealed a parallel decrease of tNAA and reduction of axonal attenuation in demyelinating plaques.6 Concomitant increases of Cho and mIns were found to correspond to glial proliferation; elevation of Lac was associated with inflammation.7 A postmortem study correlating diffusion parameters with histopathology in patients with MS showed associations between myelin content and FA and ADC.6 A correlative in vivo MR imaging−postmortem histopathology study of the diffusely abnormal white matter in chronic MS showed that decreased FA values were associated with extensive axonal loss and reduced myelin density.8
In our present study, we obtained quantitative MR imaging parameters, including MTR, diffusion parameters, and MRS metabolite concentrations, from living patients with the cerebral form of X-ALD and healthy control subjects. We also studied fresh and formalin-fixed postmortem brain sections of patients with X-ALD and controls with both MR imaging and histopathology.
The aims of this study were the following: 1) to determine whether the degree of change in ADC, FA, MTR, and MRS metabolites correlates with the degree of white matter damage in vivo and in postmortem brain tissue in patients with X-ALD; 2) to determine whether the differences in ADC, FA, and MTR observed in vivo are retained in fresh and fixed postmortem brain tissue and, thus, whether application of quantitative MR imaging parameters in studies of postmortem tissue would be justified; and 3) to assess whether ADC, FA, and MTR predict histologic changes with regard to amounts of myelin, axons, gliosis, and cell density.
Materials and Methods
Patients and Control Subjects
This study was performed with the informed consent of patients, control subjects, and parents and with the approval of the institutional ethics review board. Table 1 clarifies the number of patients and controls included for in vivo and postmortem MR imaging studies and gives the age range and median age.
Table 1:
Characteristics of patients and control subjects
| In Vivo MR Imaging Study |
Postmortem MR Imaging Study |
|||
|---|---|---|---|---|
| Patients | Controls | Patients | Controls | |
| Total no. subjects | 7 | 14 | 15a,b | 5c |
| Age range (yr) | 6–16.7 | 9.3–26.3 | 8.5–52 | 12–68 |
| Median age (yr) | 10 | 17.1 | 15.3 | 24.2 |
| No. subjects, | ||||
| MTR | 5 | 14 | 15 | 5 |
| ADC | 5 | 14 | 15 | 5 |
| FA | 5 | 14 | 15 | 5 |
| MRS | 7 | 14 | n.d. | n.d. |
Two of these had MR imaging 3 and 9 months before death.
In 1 of these, a brain MR image was obtained in fresh and formalin-fixed state.
In all 5, a brain MR image was obtained in fresh and formalin-fixed state.
In a prospective study, we included 7 patients with cerebral X-ALD (6 with the childhood cerebral and 1 with the adolescent cerebral phenotype) and 14 healthy control subjects. The patients received no special treatment apart from hormonal replacement therapy for adrenal insufficiency. Their disease was considered too far advanced for hematopoietic stem cell transplantation. The control subjects were either healthy volunteers or pediatric subjects with normal findings on neurologic examination and MR imaging. The latter subjects underwent MR imaging for reasons such as headache and epileptic seizures. In 2 of the 7 patients with X-ALD, we performed a brain autopsy within 6 hours after death. The intervals between their last in vivo MR imaging studies and the time of death were 3 and 9 months, respectively.
Formalin-fixed brain tissue from the latter 2 patients with X-ALD (both childhood cerebral phenotypes), 13 additional patients with X-ALD (7 childhood cerebral and 6 adult cerebral phenotypes, cause of death in all patients was disease progression), and 5 non-neurologic controls (cause of death was cardiac or respiratory failure) was collected from the neuropathology departments of VU University Medical Center and the Academic Medical Center in Amsterdam, University of Antwerp, and the Maryland Brain and Tissue Bank for Developmental Disorders.
In 1 of the 2 patients with X-ALD who underwent postmortem examination within 6 hours after death, as mentioned above, and in 5 controls, a postmortem MR imaging study was performed on unfixed coronal brain sections directly at postmortem examination. In all 15 X-ALD brains and the 5 control brains, an MR imaging study was performed after at least 5 weeks of formalin fixation.
MR Imaging and Spectroscopy
All MR imaging studies of living patients and postmortem specimens were performed on the same 1.5T MR imaging scanner (Vision, Siemens, Erlangen, Germany).
In Vivo MR Imaging Protocol
The in vivo MR imaging protocol included transverse T2-weighted spin-echo images (TR, 3000 ms; TE, 22, 60, and 120 ms; 1 excitation) and coronal FLAIR images (TR, 9000 ms; TE, 105 ms; TI, 2200 ms; 1 excitation). In 5 patients, axial T1-weighted spin-echo images were obtained before and after gadolinium-diethylene-triamine pentaacetic acid administration.
In all subjects, MRS was performed by using a STEAM sequence (TR/TE/mixing time, 6000/20/10 ms; 64 accumulations) in a single VOI of 4–6 mL. In control subjects, the VOI was placed within parietal white matter. In patients, 1 VOI was selected in the white matter lesion center, 1 at the lesion edge, and 1 in the NAWM. Metabolite concentrations were calculated by using the LCModel (Stephen Provencher, Oakville, Ontario, Canada)9 and expressed as millimolars. Concentrations were determined for tCr, tNAA, Cho, mIns, and Lac.10
DTI was performed in 5 patients and in all control subjects with a multisection EPI sequence11 by using a reference b=0 s/mm2 and 8 noncollinear gradient vectors with b=1044 s/mm2. In the transverse orientation, 16 sections of 5 mm were acquired, with a 128 × 128 matrix, by using a TR of 3600 ms and a TE of 123 ms. The DTI analysis included a correction of eddy current−induced distortion and calculation of eigenvalues of the diffusion tensor, resulting in maps of ADC and FA.11
MTI was performed in 5 patients and in all control subjects with a 3D fast low-angle shot sequence. Two sets of images were obtained, 1 with (MS) and one without (M0) MT saturation pulse (7.68-ms Gaussian radio-frequency pulse, 1500-Hz off-resonance) by using a TR of 23 ms, TE of 4 ms, flip angle of 20°, and a 3D slab consisting of 54 transverse sections of 3 mm. MTR maps were created according to MTR = (1 Ms / M0) × 100%.
Regions of interest corresponding to the MRS VOIs (the x, y, and z coordinates of the VOI were noted) were transferred to the equivalent ADC, FA, or MTR maps to determine mean values in these regions of interest.
Postmortem MR Imaging Protocol
The postmortem MR imaging study, performed on unfixed coronal brain sections directly at autopsy, was done at room temperature (20°-22°C). Five 1-cm-thick brain sections were placed in a section holder, which fits in the head coil. The MR imaging pulse sequences as described for living patients were modified and included T2-weighted spin-echo images (TR, 2000 ms; TE, 20 and 45 ms; excitation, 1; matrix, 160 × 256; FOV, 125 × 200 mm; section thickness, 5 mm; in-plane resolution, 0.78 × 0.78 mm) and multislab 3D-FLAIR images (turbo spin-echo imaging sequence with a turbo factor of 2712; six 1-cm-thick slabs with 8 partitions each, resulting in a section thickness of 1.25 mm; TR, 6500 ms; TE, 120 ms; TI, 2200 ms; matrix, 162 × 256; FOV, 127 × 200 mm; in-plane resolution, 0.78 × 0.78 mm). The imaging sections were located at the center of brain sections. To avoid EPI-related distortion artifacts at the interface between air and brain tissue,13,14 we performed DTI with a diffusion-weighted single-shot STEAM sequence (TR, 6000 ms; TE, 65 ms; excitations, 8; section thickness, 8 mm; FOV, 80 × 128 mm; matrix, 40 × 64; flip angle, 11°),12–15 and not with the EPI sequence. Despite a lower signal intensity–to-noise ratio of the STEAM DTI sequence, it yielded quantitative results similar to those of the EPI DTI sequence in human controls in vivo (data not shown). MRS was not performed in postmortem tissue.
The same MR imaging protocol was followed for imaging of the formalin-fixed brain sections.
Histopathologic Analysis
The fixed coronal brain sections were cut in half after imaging, sections were embedded in paraffin, and whole-mount 7-μm-thick sections were made. Routine staining techniques were applied, including HE to verify whether histologic sections matched corresponding MR images, LFB to determine myelin density, and Bodian silver impregnations to determine axonal density. Immunohistochemical staining with GFAP (Dako, Copenhagen, Denmark) as the primary antibody was performed to assess the degree of astrogliosis. Only sections containing 3 different histologic areas were examined (ie, NAWM; active demyelination, with inflammation; and complete demyelination, without inflammation). In total, 55 areas were examined in 15 patients: 18 areas with complete demyelination, 20 areas with active demyelination, and 17 with NAWM. The size of the areas examined was 0.5–1.0 cm × 0.5–1.0 cm.
HE-stained sections were used to transfer the examined areas to corresponding ADC, FA, and MTR maps by matching the histologic contours with lesion detail on the postmortem FLAIR images.
Axonal densities were determined in Bodian silver−stained sections by using a stereologic grid.4 Random points of a grid were superimposed on the sections, and the number of points crossing axons was measured as a fraction of the total number of points of the grid. Axonal density areas of active and complete demyelination was expressed as a percentage of the axonal density in the NAWM region of interest.
Myelin attenuation was quantified by assessing light transmittance on scanned LFB-stained sections by using Scion Image for Windows (Scion Corporation, Frederick, Maryland). The program was set in RGB mode. Within every region of interest, the light intensity was assessed in 3 random areas. Values obtained from each area were averaged and then divided by the light intensity transmitted in the NAWM region of interest, to assess relative myelin density.
Numbers of GFAP-positive reactive astrocytes were counted per 40× field in 10 microscopic fields to estimate the degree of astrogliosis. Cell density was determined likewise by counting the total number of nuclei in HE-stained sections.
Statistical Analysis
A 2-sided unpaired t test was performed to compare in vivo MRS metabolite concentrations and the quantitative parameters MTR, ADC, and FA among the white matter lesion center, the lesion edge, and the NAWM in patients and white matter in control subjects. Likewise, a 2-sided unpaired t test was performed to compare MTR, ADC, and FA values in vivo and in postmortem brain tissue (fresh and fixed). The significance level was P < .01.
Analysis of correlations among all parameters in the postmortem samples was performed by using the Statistical Package for the Social Sciences program, Version 12.0 (SPSS, Chicago, Illinois). Pearson correlation coefficients to investigate correlations of histopathologic parameters (axonal density, myelin density, cellular density, and degree of astrocytosis) with MR imaging parameters (ADC, FA, and MTR) in the same regions of interest were calculated directly. The variables were normally distributed (Levene test for normality) or normalized with a log-transformation. P values < .01 were considered significant.
Equations to estimate histopathology from MR imaging parameters were calculated by linear regression analysis.
Results
In Vivo MR Imaging Parameters
Illustrations of proton MR spectra, MTR, ADC, and FA maps that were obtained in living patients with X-ALD are shown in Fig 1. Quantified metabolite concentrations and results of DTI and MTI examinations are shown in Table 2. The lesion center showed statistically significant marked reductions in MTR, FA, and concentrations of tNAA and tCr and significant increases in ADC and concentrations of mIns and Lac compared with NAWM. The lesion edge showed similar significant, though less pronounced, changes in MTR, ADC, FA, tNAA, and mIns. tCr was normal. Both Cho and Lac were significantly higher than in the center of the lesion and in the NAWM. In NAWM of the patients, MR imaging parameters were not significantly different from those in the cerebral white matter of controls, though all parameters showed a trend toward being slightly abnormal. The difference was significant for FA only.
Fig 1.
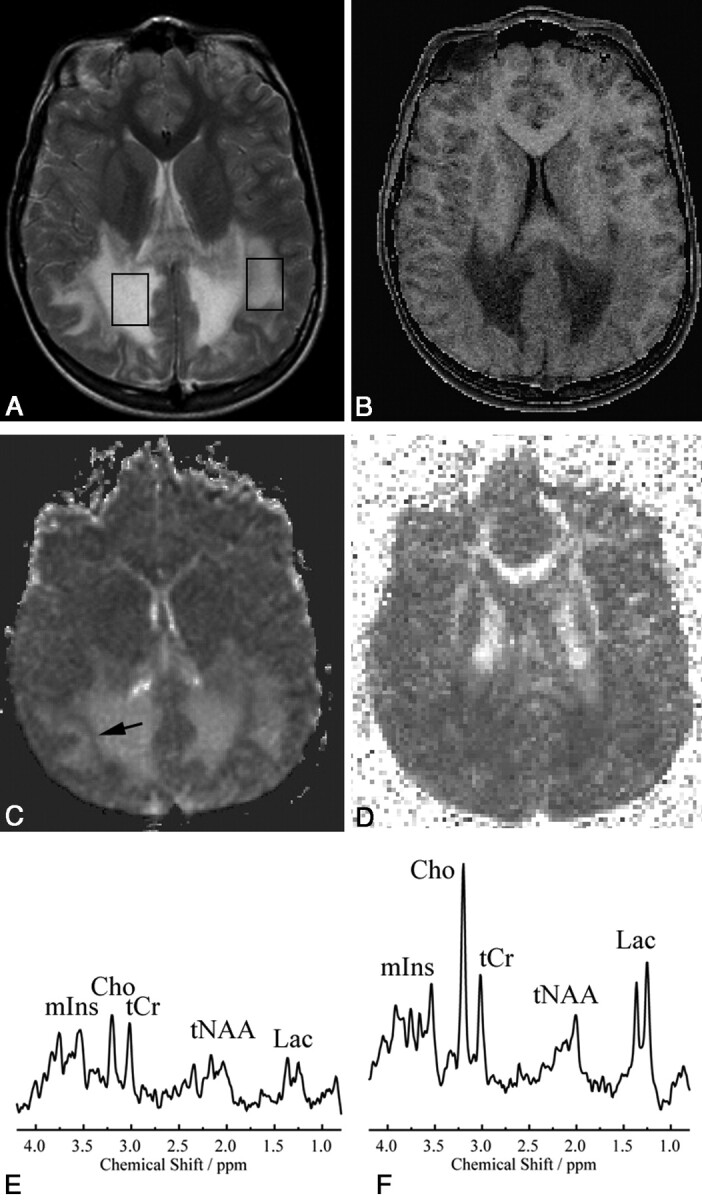
VOI localizations for MRS (STEAM: TR, 6000 ms; TE, 20 ms; mixing time, 10 ms; 64 accumulations) are shown on a transverse T2-weighted MR image (TR, 3000 ms; TE, 120 ms; 1 signal intensity acquired) (A) with MTR (B), ADC (C), and FA (D) maps of the same section and corresponding spectra (E and F) in a patient with X-ALD. The VOI placed in the center of the white matter lesion (right hemisphere) shows a very low MTR, high ADC, low FA, very low tNAA, low tCr, high mIns and Cho, and high Lac. The VOI at the edge of the lesion shows similar but less pronounced changes; Cho and Lac are higher here than in the center of the lesion. Also note the band of low ADC (arrow in C) toward the edge of the lesion.
Table 2:
Metabolite concentrations in cerebral white matter of 7 patients with X-ALD and 14 controls (in vivo)
| Center of Lesion (mean) | Edge of Lesion (mean) | NAWM (mean) | Controls (mean) | |
|---|---|---|---|---|
| MTR (%) | 11.5 ± 3.3a | 23.0 ± 1.5a | 29.0 ± 2.5 | 31.8 ± 1.5 |
| ADC (10−3 mm2/s) | 2.1 ± 0.4a | 1.2 ± 0.5a | 0.83 ± 0.05 | 0.81 ± 0.07 |
| FA | 0.20 ± 0.04a | 0.30 ± 0.05a | 0.43 ± 0.02 | 0.37 ± 0.04a |
| tCr (mmol/L) | 2.7 ± 0.9a | 4.3 ± 0.5 | 4.8 ± 1.0 | 4.5 ± 0.6 |
| tNAA (mmol/L) | 1.9 ± 1.8a | 4.9 ± 1.9a | 7.2 ± 0.9 | 7.7 ± 1.0 |
| Cho (mmol/L) | 1.4 ± 0.9 | 1.9 ± 0.3b | 1.5 ± 0.4 | 1.3 ± 0.2 |
| mIns (mmol/L) | 5.0 ± 1.5a | 4.8 ± 0.6a | 4.2 ± 1.1 | 3.6 ± 0.3 |
| Lac (mmol/L) | 1.8 ± 2.0a | 2.3 ± 2.5b | 0.5 ± 0.6 | 0.2 ± 0.3 |
Significantly different from NAWM (P< .01).
Significantly different from NAWM and center of lesion (P< .01).
Changes of MTR, ADC, and FA Values after Postmortem Examination and Fixation
Five control brains were examined directly after postmortem examination and after at least 5 weeks of formalin fixation. Table 3 summarizes the results. A slight reduction in MTR (not reaching the level of significance) compared with in vivo MTR values was observed after postmortem examination; a more pronounced statistically significant reduction was seen after fixation. ADC values were significantly reduced after postmortem examination compared with in vivo values and were reduced further after formalin fixation. FA values after formalin fixation were comparable with the FA values in living controls, but they were significantly lower immediately after postmortem examination.
Table 3:
MTR, ADC, and FA values in cerebral white matter of 14 healthy control subjects (in vivo) and in 5 postmortem control brains immediately after postmortem (fresh) and after formalin fixation (fixed)
| In Vivo (mean) | Postmortem, Fresh (mean) | Postmortem, Fixed (mean) | |
|---|---|---|---|
| MTR (%) | 32.0 ± 1.5 | 30.6 ± 0.8 | 25.0 ± 0.5a |
| ADC (10−3 mm2/s) | 0.80 ± 0.07 | 0.25 ± 0.06a | 0.18 ± 0.05a |
| FA | 0.43 ± 0.02 | 0.22 ± 0.05a | 0.37 ± 0.04 |
Significantly different from in vivo (P < .01).
One patient with X-ALD was examined shortly before death, directly after postmortem, and after 5 weeks of formalin fixation. In all stages, the differences in MTR, ADC, and FA values between different white matter areas showed a similar trend toward the in vivo differences (Fig 2 and Table 4). In the lesion center, MTR was lower, ADC was higher, and FA was lower than at the lesion edge and in NAWM.
Fig 2.

A 3D-FLAIR image (TR/TE/TI, 6500/120/2200 ms) (A) and MTR (B), ADC (C), and FA (D) maps at the same position of postmortem X-ALD brain show that differences in MR imaging parameters are retained with postmortem MR imaging tissue, with a low MTR, high ADC, and low FA toward the center of the lesion.
Table 4:
MTR, ADC, and FA values in cerebral white matter of 1 patient with X-ALD in vivo, immediately after postmortem (fresh), and after formalin fixation (fixed)
| In Vivo | Postmortem, Fresh | Postmortem, Fixed | |
|---|---|---|---|
| MTR (%) | |||
| Center of lesion | 9 | 10 | 8 |
| Edge of lesion | 22 | 18 | 15 |
| NAWM | 29 | 31 | 28 |
| ADC (10−3 mm2/s) | |||
| Center of lesion | 2.3 | 1.40 | 1.20 |
| Edge of lesion | 1.2 | 0.70 | 0.56 |
| NAWM | 0.9 | 0.50 | 0.22 |
| FA | |||
| Center of lesion | 0.22 | 0.04 | 0.10 |
| Edge of lesion | 0.36 | 0.12 | 0.22 |
| NAWM | 0.50 | 0.12 | 0.29 |
Histopathologic Parameters
In all 15 patients with X-ALD, histopathologic evaluation of the edge of the lesion showed perivascular inflammatory cells with myelin destruction by macrophages and many reactive astrocytes. The lesion center showed an attenuated mesh of glial fibrils, with scattered astrocytes and almost complete absence of axons, myelin sheaths, and oligodendroglia. In the NAWM, no evident histologic abnormalities were seen. MR imaging and histopathology of postmortem brain sections are illustrated in Fig 3.
Fig 3.

A−D, Correlation of histopathology with MR imaging in a postmortem X-ALD brain is illustrated. On the whole-mount (HE-stained) section (B), which is matched with the corresponding MR image, a 3D-FLAIR image (A), the 3 different histologic areas are identified and shown in the boxes from left to right: NAWM (D), active demyelination (E and F), and complete demyelination (C). The LFB-stained section shows attenuated myelin staining in the NAWM (D). E and F, GFAP-stained sections show intense inflammation with many interstitial macrophages with reactive astrocytes (E) and severe perivascular inflammation (lymphocytes and macrophages) toward the edge with the chronic lesion (F). Bodian silver−stained section (C) shows very low axonal attenuation in the chronic lesion areas. (B, × 15 magnification; C–F, × 75 magnification)
Pearson Correlations between all MR Imaging Parameters and Histopathologic Parameters
The Pearson correlation coefficients (r values) based on all measurements are given in Table 5. The r values of the correlations differed. Strong correlations were found between the histopathologic and MR imaging parameters themselves; for instance, a strong correlation was found between myelin density and axonal density (0.952). Medium-to-strong correlations were found between the MR imaging parameters and histopathologic parameters, also illustrated by scatterplots in On-line Fig 1 and by the r values in Table 5.
Table 5:
Pearson correlations (r values) for all measurements on formalin-fixed brain tissue of patients with X-ALDa
| ADC (*103) | FA | MTR (%) | Cells (40× field) | Axonal Density (%) | Myelin Density (%) | Astrocytes (40× field) | |
|---|---|---|---|---|---|---|---|
| ADC (*103) | 1 | ||||||
| FA | −0.772 | 1 | |||||
| MTR (%) | −0.728 | 0.837 | 1 | ||||
| Cells (40× field) | −0.560 | 0.655 | 0.666 | 1 | |||
| Axonal density (%) | −0.740 | 0.778 | 0.749 | 0.728 | 1 | ||
| Myelin density (%) | −0.637 | 0.766 | 0.727 | 0.764 | 0.952 | 1 | |
| Astrocytes (40× field) | 0.712 | −0.707 | −0.687 | −0.646 | −0.830 | −0.828 | 1 |
All correlations satisfy the criterion of an associated P value < .01. A negative correlation is indicated with a minus sign. All correlation coefficients were >0.5.
Prediction of Histopathology by MR Imaging Parameters
Linear regression analysis showed that FA was the best (positive) predictor with respect to myelin density (myelin density = −13.7 + 143.9 × FA; R2 = 0.587) and that MTR was the best (positive) predictor with respect to cell density (cell density = 5.3 + 4.0 × MTR; R2 = 0.440).
Linear regression analysis showed that a combination of ADC (negative predictor for axonal density and positive predictor for astrogliosis) and FA (positive predictor for axonal density and negative predictor for astrogliosis) was the best predictor with respect to axonal density (axonal density = 43.3 + 93.9 × FA − 46.2 × ADC; R2 = 0.654) and astrogliosis (astrogliosis = 6.3 − 7.2 × FA + 9.3 × ADC; R2 = 0.568).
In addition, the linear regression analysis showed that ADC and FA combined were sufficient as predictors of all histopathologic parameters (cell density = 35.2 + 63.3 × FA − 11.4 × ADC; R2 = 0.436; myelin density = 1.9 + 136.1 × FA − 16.9 × ADC; R2 = 0.592; for prediction of astrogliosis and axonal density see previous paragraph). Adding MTR did not have additional predictive value (ie, in addition to ADC and FA) with respect to all histopathologic parameters.
Discussion
Effects of Death and Formalin Fixation on MTR, ADC, and FA Values
Cerebral white matter diffusion parameters and MTR were studied in vivo in healthy individuals, in control brains within 6 hours after death, and after at least 5 weeks of formalin fixation. We also studied 1 patient with X-ALD in a similar fashion. In unfixed postmortem white matter, MTR values were essentially unchanged, ADC values were greatly reduced, and FA was reduced by ∼50% compared with in vivo values. Formalin fixation led to an approximately 20% reduction in MTR and a further decrease in ADC, whereas FA rose to values close to in vivo values.
The differences in MR imaging parameters between in vivo and fresh postmortem white matter are explained by differences in temperature, unavoidable effects of periagonal problems (especially hypoxia-ischemia), and immediate postmortem decay. In contrast to the in vivo brain temperature of ∼37°C, postmortem brains are at room temperature (20°–22°C). MTR is practically unaffected by the effects of dying, early postmortem decay,5,16 or temperature.17 In contrast, diffusivity is significantly affected by the effects of dying and early postmortem decay18 and also decreases with decreasing temperature.18 In a study of freshly prepared gel-immobilized erythrocyte ghost samples, a temperature decrease from 37° to 20°C was associated with a decrease in ADC of approximately 30%.19 The drop in the FA of fresh postmortem tissue has been suggested to reflect a change in membrane permeability due to beginning autolysis of tissue.20 Our findings are in line with these previous studies.5,16–20
Formalin fixation has additional effects. Like Schmierer et al,18 we found that formalin fixation leads to a mild reduction in MTR and causes a mild further reduction of water diffusivity. The FA after fixation is close to the FA in vivo, which implies that directional diffusion is reduced proportionally for all directions, suggesting that tissue architecture is preserved after fixation.
In 1 patient with X-ALD, we studied the MR imaging parameters in areas with different degrees of white matter abnormality in vivo, within 6 hours after death, and after formalin fixation. We found that the differences in MR imaging parameters were retained in all situations, with a very low MTR, high ADC, and low FA in the lesion center and similar but less pronounced changes at the lesion edge. These results indicate that though the exact values of the MR imaging parameters are influenced by the condition of the brain, they remain applicable and interpretable.
Most studies on the influence of postmortem changes and pathology on MR imaging parameters have been performed on small-size samples (cell cultures, rat nervous tissue, small MS lesions, and spinal cord).5,16–20 Our study used fresh and formalin-fixed human brains and brain sections and focused on large white matter areas. As such, the study is an important contribution to insight into the influence of autolysis, room temperature, formalin fixation, and pathology on MR imaging parameters in human brains at 1.5T. The results of this study are applicable to more routine scanning of postmortem brains, which is sometimes performed in clinical situations.
Prediction of Histopathology by MR Imaging Parameters
We performed MR spectroscopy in a group of living patients with X-ALD. Our MR spectroscopy findings are in agreement with previous reports.21–23 In the center of lesions, we found decreased tNAA, low tCr, elevated mIns, and elevated Lac. At the edge of the lesions, MRS showed an increase in Cho, some increase in mIns, a more pronounced Lac elevation, and less severe decreases in NAA and tCr. The decrease in tNAA can be ascribed to axonal damage and loss, which is more severe in the center than at the edge of the lesion. The increase in Cho is related to enhanced membrane turnover associated with active demyelination and probably also to accumulation of myelin breakdown products, both mainly occurring at the edge of the lesion. The high mIns reflects astrogliosis.24 Elevated Lac is seen in areas of inflammation with infiltrating macrophages, mainly seen in the edge of the lesion. Although in the NAWM of the patients, MRS metabolite concentrations were not significantly different from those in the cerebral white matter of controls, there was a trend toward being slightly abnormal, with a lower concentration of tNAA and higher concentrations of Cho, tCr, mIns, and Lac. Two multisection proton MRS imaging studies have reported similar abnormalities in white matter that has a normal appearance on conventional images in X-ALD.25,26 The finding of a lower tNAA in NAWM indicates slight axonal damage, whereas the increases in concentrations of Cho, tCr, mIns, and Lac may represent slightly enhanced myelin turnover and astrocytic reaction, insufficient to lead to signal-intensity alterations on conventional MR imaging.
We did not obtain MRS after death because spectra are known to change rapidly due to postmortem decay,27 obviating the possibility of directly correlating metabolites with histopathologic parameters. However, in the 2 patients with X-ALD in whom we were able to perform a postmortem examination, histopathology confirmed active demyelination and inflammation in the edge of the lesion and almost complete loss of axons and myelin with dense gliosis in the center of the lesion.
Within the abnormal white matter, both at the edge and the center, both in vivo and postmortem, ADC (a measure of water diffusivity irrespective of direction) was increased, while FA (a measure of the degree of diffusion anisotropy) was decreased, both indicating damage to the tissue matrix. The MTR was decreased, indicating a reduced capacity of the macromolecule-bound protons in brain tissue to exchange magnetization with the surrounding protons in free water, reflecting damage and loss of myelin sheaths and axonal membranes.28
We found a progression in abnormality of ADC, FA, and MTR from NAWM to lesion periphery to lesion core, indicating primarily a correlation between these parameters and severity of the tissue damage. In contrast, the MRS alterations seen at the lesion edge were different from those seen in the center of the lesion, reflecting the different histopathologic processes. Two earlier MRS studies1,29 also stressed the value of spectroscopy regarding pathologic specificity in white matter lesions. In a single-voxel MRS study, combined with DTI and MTI, to investigate whether these techniques could discriminate different types of white matter pathology, tCr was the best discriminant parameter, followed by Cho, MTR, mIns, ADC, Lac, and tNAA.1 A multivoxel MRS study demonstrated that metabolite ratios were similar for leukoencephalopathies, with a similar pathophysiology, and that these ratios may help in the classification of white matter abnormalities.29
Apart from ADC, FA, and MTR being general measures for tissue damage, we searched for more specific correlations between them and histopathologic parameters (myelin density, axonal density, degree of gliosis, and cell density). We studied all parameters in the same brain sections. A problem for correlating individual MR imaging parameters with individual histopathologic parameters is that pathologic changes are interdependent. X-ALD is a primarily demyelinating disease, but myelin loss inevitably leads to loss of axons and the resulting tissue damage inevitably leads to astrogliosis. Both inflammation and astrogliosis lead to increased cell density. The strong correlations we observed among the histopathologic parameters themselves, especially myelin density and axonal density, hampered assessment of the specificity of the MR imaging parameters for histopathologic parameters. Nevertheless, the prediction of histopathologic parameters in the white matter abnormality was reliable by using DTI parameters (ADC and FA) only; adding MTR did not improve this prediction significantly. MTR has been used to monitor remyelination in patients with MS because it is believed to be a specific quantitative marker for myelin density.30,31 Our results do not support this notion. Most likely, the MTR in these studies reflects the degree of tissue integrity and is only an indirect measure of remyelination.
Conclusions
We have demonstrated that differences in quantitative MR imaging parameters, present in living patients and related to the severity of white matter pathology, are retained in postmortem brain tissue. We have shown that MR imaging parameters correlate with white matter histopathologic parameters. Quantitative MR imaging parameters can be used to monitor disease progression and the effects of therapy in demyelinating disorders.
Acknowledgments
We thank the Brain and Tissue Bank for Developmental Disorders at the University of Maryland, Baltimore, for providing us with formalin-fixed brain tissue of patients with X-ALD. We thank J. Finsterbusch, MD, Hamburg, for providing us with the diffusion-weighted single-shot STEAM sequence.
Abbreviations
- ADC
apparent diffusion coefficient
- Cho
choline-containing compounds
- DTI
diffusion tensor imaging
- EPI
echo-planar imaging
- FA
fractional anisotropy
- FLAIR
fluid-attenuated inversion recovery
- GFAP
glial fibrillary acidic protein
- HE
hematoxylin-eosin
- Lac
lactate
- LFB
Luxol fast blue
- mIns
myo-inositol
- MRS
MR spectroscopy
- MS
multiple sclerosis
- MT
magnetization transfer
- MTI
magnetization transfer imaging
- MTR
magnetization transfer ratio
- NAWM
normal-appearing white matter
- n.d.
not done
- STEAM
short echo time stimulated echo acquisition mode
- tCr
total creatine (creatine and phosphocreatine)
- tNAA
total N-acetylaspartate (N-acetylaspartate and N-acetylaspartylglutamate)
- VOI
volume of interest
- X-ALD
X-linked adrenoleukodystrophy
Footnotes
This work was supported by the Dutch Organization for Scientific Research (NWO, grant 903-42-097) and the Optimix Foundation for Scientific Research.
indicates article with supplemental on-line figure.
References
- 1. Van der Voorn JP, Pouwels PJ, Hart AA, et al. Childhood white matter disorders: quantitative MR imaging and spectroscopy. Radiology 2006;241:510–17 [DOI] [PubMed] [Google Scholar]
- 2. Van der Knaap MS, Valk J. MR of adrenoleukodystrophy: histopathologic correlations. AJNR Am J Neuroradiol 1989;10:S12–14 [PMC free article] [PubMed] [Google Scholar]
- 3. Powers JM. Demyelination in peroxisomal diseases. J Neurol Sci 2005;15:206–07. Epub 2004 Dec 2 [DOI] [PubMed] [Google Scholar]
- 4. Schmierer K, Tozer DJ, Scaravilli F, et al. Quantitative magnetization transfer imaging in postmortem multiple sclerosis brain. J Magn Reson Imaging 2007;26:41–51 [DOI] [PMC free article] [PubMed] [Google Scholar]
- 5. van Waesberghe JH, Kamphorst W, De Groot CJ, et al. Axonal loss in multiple sclerosis lesions: magnetic resonance imaging insights into substrates of disability. Ann Neurol 1999;46:747–54 [DOI] [PubMed] [Google Scholar]
- 6. Bitsch A, Bruhn H, Vougioukas V, et al. Inflammatory CNS demyelination: histopathologic correlation with in vivo quantitative proton MR spectroscopy. AJNR Am J Neuroradiol 1999;20:1619–27 [PMC free article] [PubMed] [Google Scholar]
- 7. Schmierer K, Wheeler-Kingshott CA, Boulby PA, et al. Diffusion tensor imaging of post mortem multiple sclerosis brain. Neuroimage 2007;35:467–77. Epub 2006 Dec 16 [DOI] [PMC free article] [PubMed] [Google Scholar]
- 8. Seewann A, Vrenken H, van der Valk P, et al. Diffusely abnormal white matter in chronic multiple sclerosis: imaging and histopathologic analysis. Arch Neurol 2009;66:601–09 [DOI] [PubMed] [Google Scholar]
- 9. Provencher SW. Estimation of metabolite concentrations from localized in vivo proton MR spectra. Magn Reson Med 1993;30:672–79 [DOI] [PubMed] [Google Scholar]
- 10. Pouwels PJ, Brockmann K, Kruse B, et al. Regional age dependence of human brain metabolites from infancy to adulthood as detected by quantitative localized proton MRS. Pediatr Res 1999;46:474–85 [DOI] [PubMed] [Google Scholar]
- 11. Jones DK, Horsfield MA, Simmons A. Optimal strategies for measuring diffusion in anisotropic systems by magnetic resonance imaging. Magn Reson Med 1999;42:515–25 [PubMed] [Google Scholar]
- 12. Geurts JJ, Bö L, Pouwels PJ, et al. Cortical lesions in multiple sclerosis: combined postmortem MR imaging and histopathology. AJNR Am J Neuroradiol 2005;26:572–77 [PMC free article] [PubMed] [Google Scholar]
- 13. Le Bihan D, Poupon C, Amadon A, et al. Artifacts and pitfalls in diffusion MRI. J Magn Reson Imaging 2006;24:478–88 [DOI] [PubMed] [Google Scholar]
- 14. Koch MA, Glauche V, Finsterbusch J, et al. Distortion-free diffusion tensor imaging of cranial nerves and of inferior temporal and orbitofrontal white matter. Neuroimage 2002;17:497–506 [DOI] [PubMed] [Google Scholar]
- 15. Vrenken H, Pouwels PJ, Geurts JJ, et al. Altered diffusion tensor in multiple sclerosis normal-appearing brain tissue: cortical diffusion changes seem related to clinical deterioration. J Magn Reson Imaging 2006;23:628–36 [DOI] [PubMed] [Google Scholar]
- 16. Mottershead JP, Schmierer K, Clemence M, et al. High field MRI correlates of myelin content and axonal density in multiple sclerosis: a post-mortem study of the spinal cord. Neurology 2003;250:1293–301 [DOI] [PubMed] [Google Scholar]
- 17. Graham SJ, Stanisz GJ, Kecojevic A, et al. Analysis of changes in MR properties of tissues after heat treatment. Magn Reson Med 1999;42:1061–71 [DOI] [PubMed] [Google Scholar]
- 18. Schmierer K, Wheeler-Kingshott CA, Tozer DJ, et al. Quantitative magnetic resonance of postmortem multiple sclerosis brain before and after fixation. Magn Reson Med 2008;59:268–77 [DOI] [PMC free article] [PubMed] [Google Scholar]
- 19. Thelwall PE, Shepherd TM, Stanisz GJ, et al. Effects of temperature and aldehyde fixation on tissue water diffusion properties, studied in an erythrocyte ghost tissue model. Magn Reson Med 2006;56:282–89 [DOI] [PubMed] [Google Scholar]
- 20. Shepherd TM, Flint JJ, Thelwall PE, et al. Postmortem interval alters the water relaxation and diffusion properties of rat nervous tissue: implications for MRI studies of human autopsy samples. Neuroimage 2009;44:820–26 [DOI] [PMC free article] [PubMed] [Google Scholar]
- 21. Van der Knaap MS. Magnetic resonance in childhood white-matter disorders. Dev Med Child Neurol 2001;43:705–12 [DOI] [PubMed] [Google Scholar]
- 22. Pouwels PJ, Kruse B, Korenke GC. Quantitative proton magnetic resonance spectroscopy of childhood adrenoleukodystrophy. Neuropediatrics 1998;29:254–64 [DOI] [PubMed] [Google Scholar]
- 23. Confort-Gouny S, Vion-Dury J, Chabrol B, et al. Localised proton magnetic resonance spectroscopy in X-linked adrenoleukodystrophy. Neuroradiology 1995;37:568–75 [DOI] [PubMed] [Google Scholar]
- 24. Hattingen E, Raab P, Franz K, et al. Myo-inositol: a marker of reactive astrogliosis in glial tumors? NMR Biomed 2008;21:233–41 [DOI] [PubMed] [Google Scholar]
- 25. Eichler FS, Itoh R, Barker PB, et al. Proton MR spectroscopic and diffusion tensor brain MR imaging in X-linked adrenoleukodystrophy: initial experience. Radiology 2002;225:245–52 [DOI] [PubMed] [Google Scholar]
- 26. Eichler FS, Barker PB, Cox C, et al. Proton MR spectroscopic imaging predicts lesion progression on MRI in X-linked adrenoleukodystrophy. Neurology 2002;58:901–07 [DOI] [PubMed] [Google Scholar]
- 27. Ith M, Bigler P, Scheurer E, et al. Observation and identification of metabolites emerging during postmortem decomposition of brain tissue by means of in situ 1H-magnetic resonance spectroscopy. Magn Reson Med 2005;48:915–20 [DOI] [PubMed] [Google Scholar]
- 28. Symms M, Jager HR, Schmierer K, et al. A review of structural magnetic resonance neuroimaging. J Neurol Neurosurg Psychiatry 2004;75:1235–44 [DOI] [PMC free article] [PubMed] [Google Scholar]
- 29. Bizzi A, Castellit G, Bugiani M, et al. Classification of childhood white matter disorders using proton MR spectroscopic imaging. AJNR Am J Neuroradiol 29;1270–75 [DOI] [PMC free article] [PubMed] [Google Scholar]
- 30. Schmierer K, Scaravilli F, Altmann DR, et al. Magnetization transfer ratio and myelin in postmortem multiple sclerosis brain. Ann Neurol 2004;56:407–15 [DOI] [PubMed] [Google Scholar]
- 31. Horsfield MA, Barker GJ, Barkhof F, et al. Guidelines for using quantitative magnetization transfer magnetic resonance imaging for monitoring treatment of multiple sclerosis. J Magn Res Imaging 2003;17:389–97 [DOI] [PubMed] [Google Scholar]