


More on the eternal question: what can we use to differentiate preoperatively glioblastomas, metastases, and lymphomas? Here, the authors investigated whether diffusion tensor imaging and gadolinium perfusion studies could be used for this purpose. They evaluated 26 GBMs, 25 brain metastases, and 16 primary cerebral lymphomas with these techniques. Basically, GBMs showed lower fractional anisotropy and higher perfusion patterns. The best predictive data obtained were the apparent diffusion coefficients from enhancing tumor regions and the perfusion (cerebral blood volume) from the peritumoral regions. Although this is probably something that we all use on a daily basis, it is nice to see it reported in such an organized and careful fashion.
Abstract
BACKGROUND AND PURPOSE:
Glioblastomas, brain metastases, and PCLs may have similar enhancement patterns on MR imaging, making the differential diagnosis difficult or even impossible. The purpose of this study was to determine whether a combination of DTI and DSC can assist in the differentiation of glioblastomas, solitary brain metastases, and PCLs.
MATERIALS AND METHODS:
Twenty-six glioblastomas, 25 brain metastases, and 16 PCLs were retrospectively identified. DTI metrics, including FA, ADC, CL, CP, CS, and rCBV were measured from the enhancing, immediate peritumoral and distant peritumoral regions. A 2-level decision tree was designed, and a multivariate logistic regression analysis was used at each level to determine the best model for classification.
RESULTS:
From the enhancing region, significantly elevated FA, CL, and CP and decreased CS values were observed in glioblastomas compared with brain metastases and PCLs (P < .001), whereas ADC, rCBV, and rCBVmax values of glioblastomas were significantly higher than those of PCLs (P < .01). The best model to distinguish glioblastomas from nonglioblastomas consisted of ADC, CS (or FA) from the enhancing region, and rCBV from the immediate peritumoral region, resulting in AUC = 0.938. The best predictor to differentiate PCLs from brain metastases comprised ADC from the enhancing region and CP from the immediate peritumoral region with AUC = 0.909.
CONCLUSIONS:
The combination of DTI metrics and rCBV measurement can help in the differentiation of glioblastomas from brain metastases and PCLs.
Glioblastomas, brain metastases, and PCLs are common brain malignancies in adults, which may have similar enhancement patterns on MR imaging. Conventional MR imaging is very limited in making the distinction. Contrast enhancement on T1-weighted images reflects areas of blood-brain barrier breakdown regardless of the pathology. FLAIR imaging can depict a large portion of the tumor but also is nonspecific.1,2 Accurate preoperative diagnosis is often crucial because the management and prognosis of these tumors are substantially different.3–5 For example, patients with glioblastomas are almost always treated by surgical resection,4 while patients with suspected brain metastases without a clinical history of systemic cancer should undergo a complicated systemic staging to determine the site of primary carcinoma and evaluate other distant metastases before any surgical intervention or medical therapy.5 PCLs are managed primarily with chemotherapy or radiation therapy after stereotactic biopsy.3
DTI has been widely reported in brain tumor classification.1,6–9 The ADC value, measured from diffusion-weighted imaging or DTI, has been reported to be inversely correlated with cellularity in tumors.7,8 Prior studies have shown that ADC can help differentiate PCLs from high-grade gliomas1,6–8,10 and brain metastases8; however, other studies have reported a substantial overlap between these tumor types.11,12 DTI also provides diffusion anisotropy information about the tissue, such as FA, CL, CP, and CS. Of these parameters, FA has been most commonly used in the study of brain neoplasms.13,14 In contrast to ADC, the relationship between FA and cellularity has not been substantiated. Toh et al10 reported significantly decreased FA in highly cellular cerebral PCLs compared with glioblastomas, whereas Kinoshita et al14 demonstrated high FA values in PCLs. Our previous study demonstrated that DTI metrics, including ADC, FA, and CP, from the enhancing region of the tumor can differentiate glioblastomas from brain metastases with 92% sensitivity and 100% specificity.9
DSC provides maps of CBV, which correlate with tumor vascularity and allow indirect assessment of tumor angiogenesis.2,15 Vascular proliferation and tumor angiogenesis are among the most important factors in the biologic behavior of malignant brain tumors.16 An increase in the microvascularity and neovascularity of these tumors leads to increased rCBV. It has been reported that PCLs have lower mean rCBV,17–19 or lower rCBVmax values6,20–22 compared with glioblastomas or brain metastases.17 In the peritumoral region, glioblastomas demonstrate elevated rCBV due to tumor infiltration in the normal brain parenchyma in comparison with brain metastases.23
In this study, we hypothesized that a combination of DTI (FA, ADC, CL, CP, and CS) and DSC (rCBV) parameters can assist in better differentiation of glioblastomas, solitary brain metastases, and PCLs. A 2-level decision tree and a multivariate logistic regression analysis were used to determine the best model for tumor classification.
Materials and Methods
Patients
Sixty-seven patients with solitary enhancing lesions based on contrast-enhanced T1-weighted images were retrospectively identified by evaluating reports of brain MR imaging and postsurgical histopathologic studies performed at our institution between September 2007 and August 2009. Patients with nonenhancing or multiple enhancing tumors or a clinical history of any prior therapy to the brain were excluded. The study was approved by the institutional review board and was compliant with Health Insurance Portability and Accountability Act.
Histopathologic diagnosis of the tumor was obtained in all patients by surgical resection or biopsy. The final diagnosis included 26 glioblastomas (13 men, 13 women; mean age, 57.3 ± 15.4 years; range, 19–86 years), 25 brain metastases (14 men, 11 women; mean age, 59.4 ± 12.3 years; range, 45–85 years), and 16 PCLs (7 men, 9 women; mean age, 67.3 ± 12.3 years; range, 42–82 years). Of the 25 patients with brain metastases, the primary sites of cancer consisted of lung (n = 18), breast (n = 5), melanoma (n = 1), and colon (n = 1). Of the 16 patients with PCLs, 12 were immunocompetent and 4 were immunocompromised. All the PCLs were diffuse large B-cell lymphomas.
Data Acquisition
MR imaging studies were performed on a Tim Trio 3T whole-body scanner (Siemens, Erlangen, Germany) by using a 12-channel phased-array head coil. Routine MR pulse sequences included axial T1-weighted 3D MPRAGE (TR/TE/TI, 1760/3.1/950 ms; matrix size, 192 × 256; section thickness, 1 mm; acquisition time, 3 minutes 10 seconds) and axial fast FLAIR (TR/TE/TI, 9420/141/2500 ms; section thickness, 3 mm; acquisition time, 3 minutes 10 seconds) images. DTI data were acquired by using a single-shot spin-echo echo-planar sequence with parallel imaging by using GRAPPA and an acceleration factor of 2. Sequence parameters used were the following: TR/TE, 5000/86 ms; NEX, 3; FOV, 22 × 22 cm2; 3-mm section thickness; 128 × 128 matrix; 40 sections covering the whole brain with an acquisition time of 8 minutes. The diffusion-weighting gradients were applied in 30 isotropically distributed directions by using a b-value of 1000 s/mm2. DSC was performed 5 minutes after a 3-mL preloading dose of intravenous gadodiamide (Omniscan; GE Healthcare, Oslo, Norway). The preloading dose was administered to reduce the effect of contrast agent leakage on CBV measurements. FLAIR images were acquired after the preloading dose of contrast agent. A DSC T2*-weighted gradient-echo echo-planar sequence was obtained during the first pass of the standard dose (0.1 mmol/kg) bolus of intravenous contrast agent. The injection rate was 5 mL/s for all patients and was immediately followed by a bolus injection of saline (total of 20 mL at the same rate). DSC sequence parameters included the following: TR/TE, 2000/45 ms; FOV, 22 × 22 cm2; in-plane resolution, 1.72 × 1.72 × 3 mm3; 20 sections; and acquisition time of 1 minute 38 seconds. Forty-five measurements were acquired allowing acquisition of at least 10 image volumes before bolus arrival. Post-contrast-enhanced T1-weighted MPRAGE images were acquired after completion of the DSC sequence.
Image Processing
The diffusion-weighted images were coregistered to the non-diffusion-weighted (b=0) images to minimize the artifacts induced by eddy currents and/or subject motion by using the method described earlier.9 The corrected raw images were combined to estimate rotationally invariant DTI parameter maps using DTIStudio, Version 3.0 (H. Jiang, S. Mori; Johns Hopkins University, Baltimore, Maryland). Pixel-wise ADC, FA, CL, CP, and CS maps were computed by using the following equations:
where λ1, λ2, and λ3 are the 3 eigenvalues of the diffusion tensor and λ̄ denotes the mean of the 3 eigenvalues. ADC is a measure of the directionally averaged magnitude of diffusion, whereas FA represents the degree of diffusion anisotropy.24 CL, CP, and CS further describe the shape of the diffusion ellipsoid. CL is a measure of linear shape anisotropy, where diffusion is mainly along the direction corresponding to the largest eigenvalue; CP is a measure of planar anisotropy, where diffusion is mainly restricted to the plane spanned by the 2 eigenvectors corresponding to the 2 largest eigenvalues; and CS is a measure of spheric anisotropy (ie, isotropic diffusion).25 CBV maps were reconstructed from the DSC data by using a PWI task card (The Massachusetts General Hospital, Boston, Massachusetts) on a Leonardo workstation (Siemens).
The scalar DTI, CBV maps, and FLAIR images were then coregistered to contrast-enhanced T1-weighted images. A semiautomatic segmentation approach was used to subdivide each lesion into 3 regions: ER, IPR, and DPR, by using contrast-enhanced T1 and FLAIR images following the method described previously.9 Briefly, 1 region of interest was drawn over the FLAIR abnormality on every section to create a 3D composite mask. Similarly, another mask was drawn on the contrast-enhanced T1-weighted images for the contralateral normal WM. ER was defined as the region with enhancement higher than mean + 3 SDs of the signal intensity from the WM. The IPR was chosen as a 4-mm-wide band around the enhancing region. The remaining region of FLAIR abnormality, outside the IPR, was defined as the DPR. The CBV maps were normalized to the contralateral normal-appearing WM to generate rCBV. For CBV measurements, regions of interest were manually adjusted to avoid areas of cerebral blood vessels, calcifications, hemorrhage, and CSF-filled sulci by a neuroradiologist (S.W.). The median values of DTI metrics and rCBV in each region were measured. Because the rCBVmax pixel can be contaminated by noise,26,27 the 90th percentile values were measured from the 3 segmented regions and reported as rCBVmax. Data analysis tools, including image coregistration and segmentation, were implemented by using IDL routines (ITT Visual Information Solutions, Boulder, Colorado).
Statistical Analysis
A Mann Whitney U test was used to test the differences among glioblastomas, brain metastases, and PCLs in terms of median ADC, FA, CL, CP, CS, rCBV, and rCBVmax values in each region of interest (ER, IPR, and DPR). A P value < .05 was considered significant.
A 2-level decision tree was designed to discriminate the 3 types of tumors (Fig 1). At the first level, metastases and PCLs were grouped together as nonglioblastomas and were classified from glioblastomas. At the second level, nonglioblastomas were further subclassified into metastases and PCLs. At both levels, a univariate logistic regression analysis was first used to evaluate the predictive power of individual parameters in each region. The parameters with high predictive power (P < .20, Wald test) were selected and fed into a multivariate logistic regression analysis to determine an optimal LRM for tumor classification. A leave-one-out cross-validation approach was applied to estimate the accuracy of the LRM. AUCs of ROC were computed by using the selected parameters and LRM output. A cutoff value for each parameter was determined by maximizing the sum of sensitivity and specificity. All data analysis was conducted by using the Statistical Package for the Social Sciences for Windows, Version 15.0 (SPSS, Chicago, Illinois).
Fig 1.

Hierarchic tree classification scheme.
Results
Representative images of a patient with glioblastoma are shown in Fig 2. The conventional images look similar among glioblastomas, brain metastases, and PCLs. On contrast-enhanced T1-weighted images, all the tumors showed ring or solid enhancement. FLAIR images demonstrated extensive hyperintense signal-intensity abnormalities. The enhancing part of glioblastomas appeared to have higher anisotropy (FA, CL, and CP) compared with brain metastases and PCLs. On the CBV maps, glioblastomas and brain metastases tended to have higher CBV compared with PCLs. A capsulelike ring surrounding the tumors was observed on the CP maps in 24/26 glioblastomas, 17/25 brain metastases, and 3/16 PCLs.
Fig 2.

A 71-year-old man with a glioblastoma in the left thalamus. A, Axial contrast-enhanced T1-weighted image shows solid enhancement. B, FLAIR image demonstrates hyperintense abnormalities, extending from the thalamus to the occipital lobe (not shown at this section level). C, CBV map demonstrates elevated blood volume of the enhancing part (rCBVmax = 6.52). D, ADC map shows restricted diffusion of the enhancing part (0.75 × 10⁻³/mm2/s). E−G, FA (E), CL (F), and CP (G) from the enhancing part (0.18, 0.15, and 0.15, respectively) are higher than those for brain metastasis (not shown) and PCL (not shown). H, CS from the enhancing portion (0.68) is lower compared with brain metastasis and PCL.
Comparison of Imaging Parameters between Glioblastomas, Brain Metastases, and PCLs
A pair-wise comparison of diffusion and perfusion parameters among these 3 types of tumors by using the segmented regions of interest is shown in Fig 3. A comparison between glioblastomas and metastases did not demonstrate any significant difference in the median ADC values from any of the segmented areas. The median FA values showed significant differences in the ER (P < .001) and IPR (P < .001) but not in the DPR. Similarly, CL and CS values also showed significant differences in the ER (P < .001) and IPR (P < .001). The median CP values showed significant differences in all 3 regions (P < .001 for ER, P < .05 for IPR and DPR). The median rCBV values showed a significant difference only in the IPR (P < .05).
Fig 3.
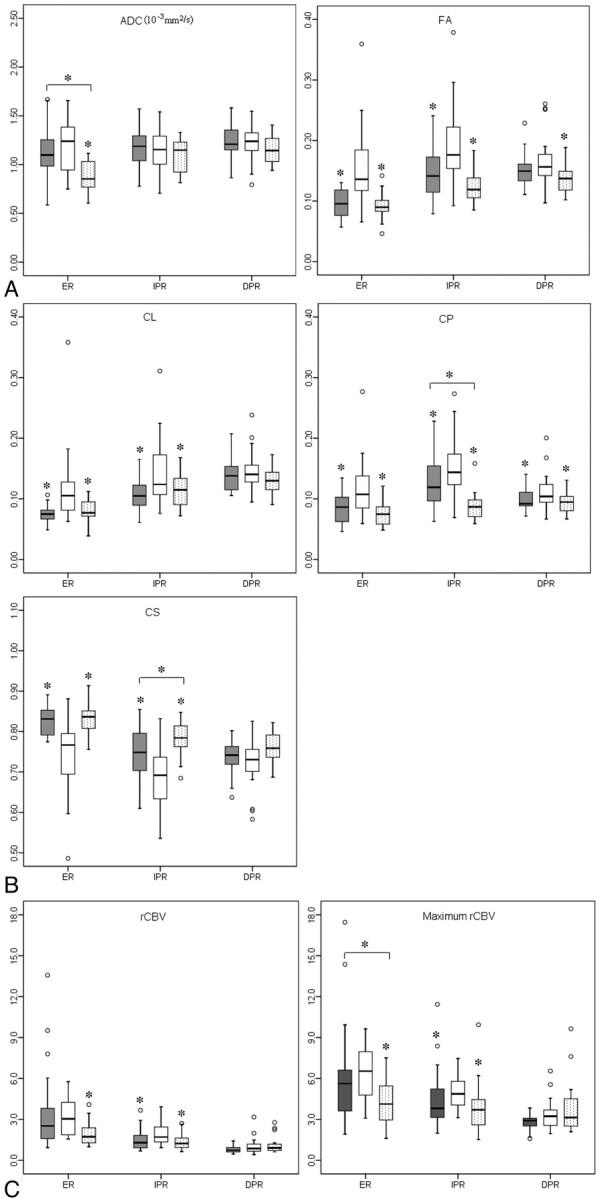
Boxplots of diffusion (A and B) and perfusion (C) characteristics in brain metastases (gray), glioblastomas (white), and PCLs (dotted). The solid line inside the box represents the median value, while the edges represent the 25th and 75th percentiles. Straight line (bar) on each box indicates the range of data distribution. Circles represent outliers (values >1.5 box length from the 75th and 25th percentile). The asterisk above the gray or dotted box indicates a significant difference (P < .05) for glioblastomas versus metastases or glioblastomas versus PCLs, respectively. The asterisk above a horizontal line between gray and dotted boxes indicates a significant difference (P < .05) between metastases and PCLs.
For glioblastomas versus PCLs, the median ADC value showed a significant difference in the ER (P < .001). Both median FA and CP values showed significant differences in all the 3 regions (P < .001 for ER, P < .05 for IPR and DPR). CL and CS demonstrated significant differences in the ER (P < .001) and IPR (P < .05). The median rCBV and rCBVmax showed significant differences in the ER (P < .01) and IPR (P < .01).
For brain metastases versus PCLs, there was a significant difference from the ER in the median ADC value between the 2 tumors (P < .05). However, the median FA and CL values did not show any significant difference in any of the 3 regions. The median CP and CS values showed a significant difference only in the IPR (P < .05). The rCBVmax from the ER showed a significant difference between these 2 tumors (P < .05).
Discrimination Model Based on Statistical Analysis
Glioblastomas versus Nonglioblastomas.
Univariate analysis selected 15 of 21 parameters (7 parameters in 3 regions) as variables with high enough predictive power (P < .20, Wald test). Each parameter was evaluated for its discriminative ability by using ROC analysis (Table 1). FA (AUC = 0.84) from the ER was the single best predictor for classification, followed by CS (AUC = 0.82) from the ER. The selected parameters were then used for a multivariate logistic regression analysis with forward stepwise selection. The results indicated that the best LRM for differentiation, of glioblastomas from nonglioblastomas was achieved with 3 parameters, including ADC and CS from the ER, and rCBV from the IPR as follows:
 |
where β0 = 17.73, β1 = 6.97, β2 = −36.86, and β3 = 1.97. Figure 4A shows the ROC curves for DTI parameters with high predictive power from the ER and the best LRM. The LRM of the 3 parameters (ADCER, CSER, and rCBVIPR) was more accurate than individual parameters alone. The cutoff value for the LRM was 0.45 with sensitivity = 89%, specificity = 93%, and AUC = 0.938. Leave-one-out cross-validation analysis revealed that 89.6% of cases were correctly classified by using the LRM.
Table 1:
Sensitivity and specificity of imaging parameters with high predictive power in differentiation of glioblastomas from nonglioblastomas using ROCa
| Parameter | ROI | Cutoff Value | Sensitivity | Specificity | AUC |
|---|---|---|---|---|---|
| ADC (10−3mm2/s) | ER | 1.16 | 0.62 | 0.81 | 0.68 |
| FA | ER | 0.11 | 0.85 | 0.78 | 0.84 |
| IPR | 0.15 | 0.85 | 0.73 | 0.81 | |
| DPR | 0.15 | 0.62 | 0.63 | 0.63 | |
| CL | ER | 0.10 | 0.62 | 0.93 | 0.79 |
| IPR | 0.12 | 0.69 | 0.63 | 0.70 | |
| CP | ER | 0.08 | 0.85 | 0.56 | 0.78 |
| IPR | 0.12 | 0.81 | 0.66 | 0.76 | |
| DPR | 0.09 | 0.81 | 0.51 | 0.66 | |
| CS | ER | 0.80 | 0.85 | 0.73 | 0.82 |
| IPR | 0.73 | 0.69 | 0.76 | 0.79 | |
| DPR | 0.73 | 0.54 | 0.68 | 0.61 | |
| rCBV | IPR | 1.20 | 0.96 | 0.46 | 0.71 |
| rCBVmax | ER | 6.48 | 0.54 | 0.80 | 0.67 |
| IPR | 3.88 | 0.88 | 0.58 | 0.71 |
P < .20, Wald test.
Fig 4.

ROC curves of the imaging parameters with high predictive power from the enhancing part as well as the LRM for levels 1 (A) and 2 (B) of decision tree steps (Fig 1). LRM of ADC, CS from ER, and rCBV from the IPR were the best predictors for differentiation of glioblastomas from nonglioblastomas with AUC = 0.938 (A), whereas a combination of ADC from the ER and CP from the IPR was the best model for distinguishing lymphomas from metastases with AUC = 0.909 (B).
To evaluate the value of tensor shape measurement and perfusion, we did logistic regression analysis without each of them. The best LRM without tensor shape parameters included ADCER, FAER, and rCBVIPR with AUC = 0.938. The best LRM without DSC parameters consisted of ADCER and CSER with AUC = 0.912. We noticed that either FAER or CSER was selected for the LRM and resulted in almost the same AUC. A scatterplot of FA and CS from ER is shown in Fig 5. FA and CS have a strong negative correlation (r = 0.99).
Fig 5.

Scatterplot of FA and CS from the enhancing region of the glioblastomas (blue square) and nonglioblastomas (purple square). There is a strong negative correlation between FA and CS (r = 0.99).
Brain Metastases versus PCLs.
Eleven of 21 parameters were selected from univariate analysis and evaluated for their discriminative ability by using ROC analysis (Table 2). ADC was the single best classifier with AUC = 0.78. The selected parameters were then fed into a multivariate logistic regression. The best LRM for the probability of brain metastases was achieved with 2 parameters (ADC from ER and CP from the IPR) as follows:
 |
where β0 = −15.62, β1 = 9.84, and β2 = 61.63. Figure 4B shows the ROC curves for DTI parameters with high predictive power from the ER and the best LRM. The LRM of the 2 parameters (ADCER and CPIPR) resulted in sensitivity = 77%, specificity = 94%, AUC = 0.909, and a cutoff value of 0.73. Leave-one-out cross-validation analysis showed that 81.6% of cases were correctly classified by using the LRM of ADCER and CPIPR. The best LRM without tensor shape parameters included ADCER, FAIPR, and rCBVmax with AUC = 0.881. The best LRM without DSC parameters stays the same as including all the parameters, ADCER and CPIPR with AUC = 0.909.
Table 2:
Sensitivity and specificity of imaging parameters with high predictive power in differentiation of brain metastases from PCLs using ROCa
| Parameter | ROI | Cutoff Value | Sensitivity | Specificity | AUC |
|---|---|---|---|---|---|
| ADC (10−3mm2/s) | ER | 0.85 | 0.91 | 0.56 | 0.78 |
| FA | IPR | 0.13 | 0.68 | 0.69 | 0.63 |
| DPR | 0.15 | 0.50 | 0.81 | 0.65 | |
| CL | DPR | 0.13 | 0.77 | 0.50 | 0.62 |
| CP | IPR | 0.11 | 0.64 | 0.94 | 0.76 |
| CS | IPR | 0.76 | 0.68 | 0.81 | 0.67 |
| DPR | 0.74 | 0.55 | 0.75 | 0.63 | |
| rCBV | ER | 2.25 | 0.59 | 0.75 | 0.69 |
| DPR | 0.66 | 0.40 | 0.93 | 0.66 | |
| rCBVmax | ER | 4.61 | 0.73 | 0.69 | 0.70 |
| DPR | 3.19 | 0.82 | 0.50 | 0.63 |
P < .20, Wald test.
The overall classification results from levels 1 and 2 are summarized in Table 3, which shows that the overall accuracy for glioblastomas, brain metastases, and PCLs was 84.6%, 76%, and 75%, respectively.
Table 3:
Overall classification result
| True Histologic Type | Classification |
% Correct | ||
|---|---|---|---|---|
| Glioblastomas | Metastases | PCLs | ||
| Glioblastomas (n = 26) | 22 | 4 | 84.6 | |
| Metastases (n = 25) | 3 | 19 | 3 | 76 |
| PCLs (n = 16) | 4 | 12 | 75 | |
Discussion
In this study, the 3 most common enhancing malignant brain tumors, glioblastomas, brain metastases, and PCLs, were differentiated by using diffusion and perfusion imaging metrics. Significantly elevated FA, CL, and CP and decreased CS values from the ER were observed in glioblastomas compared with brain metastases and PCLs. In addition, ADC, rCBV, and rCBVmax values from the ER of glioblastomas were significantly higher than those of PCLs. The logistic regression analysis indicated that the best model to distinguish glioblastomas from nonglioblastomas consisted of ADC, CS (or FA) from ER, and rCBV from IPR, with an AUC = 0.938. The second level of decision tree demonstrated that the best model to differentiate PCLs from brain metastases comprised ADC from ER and CP from IPR, with AUC = 0.909. These results suggest that the proposed analysis of DTI and perfusion parameters aids in improved differentiation among the 3 tumor types.
ADC and FA from the Enhancing Region of the Tumor
Diffusion-weighted imaging provides information about the mobility of water molecules in tissue. Tumor cellularity has been reported to be a major determinant of ADC values in brain tumors.7,8 Guo et al7 reported that the mean ADC values relative to the normal WM in the PCLs were significantly lower than those in high-grade astrocytomas. Simultaneously, the mean nuclear/cytoplasm ratio in PCLs was significantly higher than that in high-grade astrocytomas, indicating that high cellularity in PCLs contributes to the restricted diffusion. Yamasaki et al8 also reported that ADC values in PCLs were significantly lower than those in glioblastomas and brain metastases. Our result of reduced ADC in PCLs compared with both glioblastomas and brain metastases is concordant with these previously published reports.
In contrast to ADC, both positive13,14 and negative correlations10 have been reported between FA and tumor cellularity. The possible reason for these conflicting reports may be due to the difference in the regions of the tumor analyzed.9,14 Among the tumor types studied, PCLs usually have the highest cellularity, followed by glioblastomas and brain metastases.28–30 Elevated FA from the ER of glioblastomas in comparison with both brain metastases and PCLs in our study indicates that diffusion anisotropy may not directly correlate with tumor cellularity. It has been reported that anisotropy in tumor tissue is affected by several factors including extracellular-to-intracellular space ratio, extracellular matrix, tortuosity, and vascularity.31,32
Shape of Diffusion Tensor in Brain Tumors
The geometric properties of the shape of the diffusion tensor can be described as linear, planar, or spheric diffusion based on diffusivity.25,33,34 While CL specifically highlights the regions of tubular tensors, CP indicates regions of planar tensors. CS suggests isotropic tensor. CL, CP, and CS provide further tensor shape differentiation compared with FA.25,33,35
Anisotropy changes within and surrounding the tumor have been demonstrated in animal studies, indicating that tensor shape is related to the macroscopic organization of tumor cells.36,37 The types of the tumor, the degree of invasiveness, and growth rate will affect the diffusion properties.37 Tensor shape measurements have also been used to characterize pathologic changes in the human brain. As observed in the present study, Zhang et al33 reported decreased CL in brain metastases. Tensor shape measurements have also been used to differentiate subtypes of meningiomas,38,39 to distinguish true from pseudo-WM tracts inside abscess cavities,40 and to characterize epidermoid cysts41,42 and brain tuberculomas.43 In a previous study, we demonstrated elevated FA, CL, and CP from the ER of glioblastomas in comparison with brain metastases.9 Similar to the previous observation, we noted higher anisotropy from ER in glioblastomas compared with both brain metastases and PCLs. These results suggest that tensor shape measurement provides additional information about diffusion characteristics, which may further assist in tumor classification.
A ring with high CP was also observed in most glioblastomas and brain metastases. However, only 3 of 16 PCLs demonstrated the presence of this ring. While the potential reason for the observation of this ring remains speculative, its presence has been reported in meningiomas39 and may reflect compression of surrounding tissue by the tumor.33,39 However, it remains unclear as to why such a phenomenon was not observed in most PCLs in the present study.
rCBV in Malignant Enhancing Tumors
We observed significantly lower rCBV and rCBVmax from the ER in PCLs in comparison with glioblastomas. The rCBVmax also showed a significant difference between PCLs and metastases. Several studies20–22 have reported that DSC perfusion-weighted MR imaging can differentiate glioblastomas and metastases from PCLs on the basis of rCBV or rCBVmax, which is consistent with our finding. Glioblastoma, a World Health Organization grade IV astrocytoma, is characterized by tumor angiogenesis.28 Metastatic tumors spread into the brain via hematogenous routes and hence induce neovascularization as they grow and expand. In contrast to glioblastomas and metastases, tumor neovascularization is absent in PCLs. PCL is well-known for its angiocentric growth pattern, in which the PCL cells tend to cluster around pre-existing brain vessels.29 This can explain the lower rCBV in PCLs observed in our study. Similar to our observation, several prior studies have reported that rCBV from the ER may not be helpful for discrimination between glioblastomas and brain metastases.44,45
In the peritumoral region, elevated rCBV was observed in glioblastomas compared with both metastases and PCLs. This may be due to the difference in the pathophysiology of the peritumoral region of glioblastomas, metastases, and PCLs, of which glioblastomas are more infiltrative compared with metastases and PCLs.23,28,29
Logistic Regression Model for Classification
Individual parameters have a limited role in tumor classification. In our study, the single best predictor for differentiating glioblastomas from nonglioblastomas was FA with AUC = 0.84, sensitivity = 0.85, and specificity = 0.78. To improve the discriminative ability, we proposed a 2-level decision tree for tumor classification. At each level, multivariate logistic regression analysis was applied to determine the best model for this classification. We observed that the combination of ADC, CS (or FA) from the ER, and rCBV from the IPR is the most powerful predictor for differentiating glioblastomas from nonglioblastomas, with sensitivity = 89%, specificity = 93%, and AUC = 0.938. A combination of ADC from the ER and CP from the IPR was the best model to distinguish brain metastases from PCLs, with sensitivity = 77%, specificity = 94%, and AUC = 0.909. Compared with our previous study,9 we incorporated perfusion data in the analysis and included PCL in the differential diagnosis. Thus the present study dealt with a completely different problem because we were trying to classify 3 types of tumors. Most of the earlier studies performed pair-wise comparisons, such as glioblastomas versus metastases6,8,19 or glioblastomas versus PCLs.6–8,10,19 Our approach of using the LRM model is unique in the sense that we designed a 2-level decision tree and were trying to detect glioblastomas from other types of tumors; this distinction is much more challenging in clinical practice. Furthermore, the semiquantitative approach for registration and segmentation used in this study is much more objective and robust. Thus, it is an incremental yet important step for tumor classification.
A limitation of this study is the retrospective analysis of the imaging data. As such, we were unable to exactly match the segmented regions of interest with histology; and the potential reason for elevated FA, CL, and CP in glioblastomas compared with both metastases and PCLs remains speculative. Future studies that directly correlate imaging with histologic observations will be important for more accurate interpretation of imaging parameters.
Conclusions
Our study shows that the combination of ADC, CS (or FA) from ER, and rCBV from the IPR was the best predictor for differentiation of glioblastomas from nonglioblastomas, whereas the LRM of ADC from the ER and CP from the IPR were the best models for distinguishing lymphomas from metastases. Our study indicates that a combination of DTI metrics and rCBV measurement can help in the differentiation of glioblastomas, brain metastases, and PCLs.
Acknowledgments
We thank Ruyun Jin, MD, Biostatistician, Medical Data Research Center, Providence Health & Services, Portland, Oregon for help in statistical analysis.
Abbreviations
- ADC
apparent diffusion coefficient
- AUC
area under the curve
- CBV
cerebral blood volume
- CL
linear anisotropy coefficient
- CP
planar anisotropy coefficient
- CS
spheric anisotropy coefficient
- DPR
distant peritumoral region
- DSC
dynamic susceptibility contrast-enhanced
- DTI
diffusion tensor imaging
- ER
enhancing region
- FA
fractional anisotropy
- FLAIR
fluid-attenuated inversion recovery
- GRAPPA
generalized autocalibrating partially parallel acquisition
- IPR
immediate peritumoral region
- LRM
logistic regression model
- MPRAGE
magnetization-prepared rapid acquisition of gradient echo
- PCL
primary cerebral lymphoma
- PWI
perfusion-weighted imaging
- rCBV
relative cerebral blood volume
- rCBVmax
maximum relative cerebral blood volume
- ROC
receiver operating characteristic analysis
- ROI
region of interest
- WM
white matter
Footnotes
Previously presented in part at: Annual Meeting of International Society for Magnetic Resonance in Medicine, May 1–7, 2010; Stockholm, Sweden.
References
- 1. Al-Okaili RN, Krejza J, Woo JH, et al. Intraaxial brain masses: MR imaging-based diagnostic strategy—initial experience. Radiology 2007;243:539–50 [DOI] [PubMed] [Google Scholar]
- 2. Cha S. Neuroimaging in neuro-oncology. Neurotherapeutics 2009;6:465–77 [DOI] [PMC free article] [PubMed] [Google Scholar]
- 3. Batchelor T, Loeffler JS. Primary CNS lymphoma. J Clin Oncol 2006;24:1281–88 [DOI] [PubMed] [Google Scholar]
- 4. Giese A, Westphal M. Treatment of malignant glioma: a problem beyond the margins of resection. J Cancer Res Clin Oncol 2001;127:217–25 [DOI] [PubMed] [Google Scholar]
- 5. Soffietti R, Ruda R, Mutani R. Management of brain metastases. J Neurol 2002;249:1357–69 [DOI] [PubMed] [Google Scholar]
- 6. Calli C, Kitis O, Yunten N, et al. Perfusion and diffusion MR imaging in enhancing malignant cerebral tumors. Eur J Radiol 2006;58:394–403 [DOI] [PubMed] [Google Scholar]
- 7. Guo AC, Cummings TJ, Dash RC, et al. Lymphomas and high-grade astrocytomas: comparison of water diffusibility and histologic characteristics. Radiology 2002;224:177–83 [DOI] [PubMed] [Google Scholar]
- 8. Yamasaki F, Kurisu K, Satoh K, et al. Apparent diffusion coefficient of human brain tumors at MR imaging. Radiology 2005;235:985–91 [DOI] [PubMed] [Google Scholar]
- 9. Wang S, Kim S, Chawla S, et al. Differentiation between glioblastomas and solitary brain metastases using diffusion tensor imaging. Neuroimage 2009;44:653–60 [DOI] [PMC free article] [PubMed] [Google Scholar]
- 10. Toh CH, Castillo M, Wong AM, et al. Primary cerebral lymphoma and glioblastoma multiforme: differences in diffusion characteristics evaluated with diffusion tensor imaging. AJNR Am J Neuroradiol 2008;29:471–75 [DOI] [PMC free article] [PubMed] [Google Scholar]
- 11. Batra A, Tripathi RP. Atypical diffusion-weighted magnetic resonance findings in glioblastoma multiforme. Australas Radiol 2004;48:388–91 [DOI] [PubMed] [Google Scholar]
- 12. Toh CH, Chen YL, Hsieh TC, et al. Glioblastoma multiforme with diffusion-weighted magnetic resonance imaging characteristics mimicking primary brain lymphoma: case report. J Neurosurg 2006;105:132–35 [DOI] [PubMed] [Google Scholar]
- 13. Beppu T, Inoue T, Shibata Y, et al. Measurement of fractional anisotropy using diffusion tensor MRI in supratentorial astrocytic tumors. J Neurooncol 2003;63:109–16 [DOI] [PubMed] [Google Scholar]
- 14. Kinoshita M, Hashimoto N, Goto T, et al. Fractional anisotropy and tumor cell density of the tumor core show positive correlation in diffusion tensor magnetic resonance imaging of malignant brain tumors. Neuroimage 2008;43:29–35 [DOI] [PubMed] [Google Scholar]
- 15. Aronen HJ, Gazit IE, Louis DN, et al. Cerebral blood volume maps of gliomas: comparison with tumor grade and histologic findings. Radiology 1994;191:41–51 [DOI] [PubMed] [Google Scholar]
- 16. Chaudhry IH, O'Donovan DG, Brenchley PE, et al. Vascular endothelial growth factor expression correlates with tumour grade and vascularity in gliomas. Histopathology 2001;39:409–15 [DOI] [PubMed] [Google Scholar]
- 17. Hakyemez B, Erdogan C, Bolca N, et al. Evaluation of different cerebral mass lesions by perfusion-weighted MR imaging. J Magn Reson Imaging 2006;24:817–24 [DOI] [PubMed] [Google Scholar]
- 18. Kim EY, Kim SS. Magnetic resonance findings of primary central nervous system T-cell lymphoma in immunocompetent patients. Acta Radiol 2005;46:187–92 [DOI] [PubMed] [Google Scholar]
- 19. Weber MA, Zoubaa S, Schlieter M, et al. Diagnostic performance of spectroscopic and perfusion MRI for distinction of brain tumors. Neurology 2006;66:1899–906 [DOI] [PubMed] [Google Scholar]
- 20. Hartmann M, Heiland S, Harting I, et al. Distinguishing of primary cerebral lymphoma from high-grade glioma with perfusion-weighted magnetic resonance imaging. Neurosci Lett 2003;338:119–22 [DOI] [PubMed] [Google Scholar]
- 21. Lee IH, Kim ST, Kim HJ, et al. Analysis of perfusion weighted image of CNS lymphoma. Eur J Radiol 2010;67;48–51 [DOI] [PubMed] [Google Scholar]
- 22. Liao W, Liu Y, Wang X, et al. Differentiation of primary central nervous system lymphoma and high-grade glioma with dynamic susceptibility contrast-enhanced perfusion magnetic resonance imaging. Acta Radiol 2009;50:217–25 [DOI] [PubMed] [Google Scholar]
- 23. Law M, Cha S, Knopp EA, et al. High-grade gliomas and solitary metastases: differentiation by using perfusion and proton spectroscopic MR imaging. Radiology 2002;222:715–21 [DOI] [PubMed] [Google Scholar]
- 24. Basser PJ, Pierpaoli C. Microstructural and physiological features of tissues elucidated by quantitative-diffusion-tensor MRI. J Magn Reson B 1996;111:209–19 [DOI] [PubMed] [Google Scholar]
- 25. Westin CF, Maier SE, Mamata H, et al. Processing and visualization for diffusion tensor MRI. Med Image Anal 2002;6:93–108 [DOI] [PubMed] [Google Scholar]
- 26. ten Dam VH, van den Heuvel DM, de Craen AJ, et al. Decline in total cerebral blood flow is linked with increase in periventricular but not deep white matter hyperintensities. Radiology 2007;243:198–203 [DOI] [PubMed] [Google Scholar]
- 27. Zaro-Weber O, Moeller-Hartmann W, Heiss WD, et al. The performance of MRI-based cerebral blood flow measurements in acute and subacute stroke compared with 15O-water positron emission tomography: identification of penumbral flow. Stroke 2009;40:2413–21. Epub 2009 May 21 [DOI] [PubMed] [Google Scholar]
- 28. Rees JH, Smirniotopoulos JG, Jones RV, et al. Glioblastoma multiforme: radiologic-pathologic correlation. Radiographics 1996;16:1413–38 [DOI] [PubMed] [Google Scholar]
- 29. Koeller KK, Smirniotopoulos JG, Jones RV. Primary central nervous system lymphoma: radiologic-pathologic correlation. Radiographics 1997;17:1497–526 [DOI] [PubMed] [Google Scholar]
- 30. Hayashida Y, Hirai T, Morishita S, et al. Diffusion-weighted imaging of metastatic brain tumors: comparison with histologic type and tumor cellularity. AJNR Am J Neuroradiol 2006;27:1419–25 [PMC free article] [PubMed] [Google Scholar]
- 31. Vargova L, Homola A, Zamecnik J, et al. Diffusion parameters of the extracellular space in human gliomas. Glia 2003;42:77–88 [DOI] [PubMed] [Google Scholar]
- 32. Zamecnik J. The extracellular space and matrix of gliomas. Acta Neuropathol 2005;110:435–42 [DOI] [PubMed] [Google Scholar]
- 33. Zhang S, Bastin ME, Laidlaw DH, et al. Visualization and analysis of white matter structural asymmetry in diffusion tensor MRI data. Magn Reson Med 2004;51:140–47 [DOI] [PubMed] [Google Scholar]
- 34. Alexander AL, Hasan K, Kindlmann G, et al. A geometric analysis of diffusion tensor measurements of the human brain. Magn Reson Med 2000;44:283–91 [DOI] [PubMed] [Google Scholar]
- 35. Zhang J, van Zijl PC, Mori S. Image contrast using the secondary and tertiary eigenvectors in diffusion tensor imaging. Magn Reson Med 2006;55:439–49 [DOI] [PubMed] [Google Scholar]
- 36. Kim S, Pickup S, Hsu O, et al. Diffusion tensor MRI in rat models of invasive and well-demarcated brain tumors. NMR Biomed 2008;21:208–16 [DOI] [PubMed] [Google Scholar]
- 37. Lope-Piedrafita S, Garcia-Martin ML, Galons JP, et al. Longitudinal diffusion tensor imaging in a rat brain glioma model. NMR Biomed 2008;21:799–808 [DOI] [PMC free article] [PubMed] [Google Scholar]
- 38. Toh CH, Castillo M, Wong AM, et al. Differentiation between classic and atypical meningiomas with use of diffusion tensor imaging. AJNR Am J Neuroradiol 2008;29:1630–35 [DOI] [PMC free article] [PubMed] [Google Scholar]
- 39. Tropine A, Dellani PD, Glaser M, et al. Differentiation of fibroblastic meningiomas from other benign subtypes using diffusion tensor imaging. J Magn Reson Imaging 2007;25:703–08 [DOI] [PubMed] [Google Scholar]
- 40. Kumar M, Gupta RK, Nath K, et al. Can we differentiate true white matter fibers from pseudofibers inside a brain abscess cavity using geometrical diffusion tensor imaging metrics?. NMR Biomed 2007;21:581–88 [DOI] [PubMed] [Google Scholar]
- 41. Jolapara M, Kesavadas C, Radhakrishnan VV, et al. Diffusion tensor mode in imaging of intracranial epidermoid cysts: one step ahead of fractional anisotropy. Neuroradiology 2009;51:123–29 [DOI] [PubMed] [Google Scholar]
- 42. Santhosh K, Thomas B, Radhakrishnan VV, et al. Diffusion tensor and tensor metrics imaging in intracranial epidermoid cysts. J Magn Reson Imaging 2009;29:967–70 [DOI] [PubMed] [Google Scholar]
- 43. Gupta RK, Haris M, Husain N, et al. DTI derived indices correlate with immunohistochemistry obtained matrix metalloproteinase (MMP-9) expression in cellular fraction of brain tuberculoma. J Neurol Sci 2008;275:78–85 [DOI] [PubMed] [Google Scholar]
- 44. Cho SK, Na DG, Ryoo JW, et al. Perfusion MR imaging: clinical utility for the differential diagnosis of various brain tumors. Korean J Radiol 2002;3:171–79 [DOI] [PMC free article] [PubMed] [Google Scholar]
- 45. Kremer S, Grand S, Remy C, et al. Cerebral blood volume mapping by MR imaging in the initial evaluation of brain tumors. J Neuroradiol 2002;29:105–13 [PubMed] [Google Scholar]