Abstract
BACKGROUND AND PURPOSE:
Previous studies have quantified CSF flow in patients with Chiari I at the foramen magnum with single-axial or single-sagittal PCMR. The goal of this study was to measure CSF velocities at multiple cervical spinal levels in patients with Chiari I malformation.
MATERIALS AND METHODS:
In a patient registry, consecutive patients without surgery who had PCMR flow images in 5–8 axial planes between the foramen magnum and C4 were identified. Four contiguous regions were defined from the foramen magnum to C4. In each region, the fastest positive flow (PSV) and fastest negative flow (PDV) were tabulated. Changes in peak velocity by cervical spinal level and age and sex were tested for significance with linear mixed-effects models.
RESULTS:
In 17 patients studied, PSV increased progressively and significantly from the foramen magnum to C4. PDVs increased slightly from the foramen magnum to C3. The changes in velocity over the 4 regions tended to be smaller in the 13 patients with tonsilar ectopia than in the 4 patients without it. Age and sex had an effect on peak velocities.
CONCLUSIONS:
Peak diastolic and systolic CSF velocities are significantly greater below than at the foramen magnum.
The evaluation of patients with the Chiari I malformation may include the performance of PCMR. These studies have visualized and partially quantified cyclical CSF flow in patients with Chiari I malformation.1–13 Investigators using axial-imaging-plane PCMR have measured CSF velocities in the subarachnoid space at the foramen magnum. Other investigators, using sagittal PCMR, have demonstrated CSF oscillatory flow in the midline over multiple cervical spinal levels, with limited accuracy, because of introvoxel dephasing. These published PCMR studies incompletely characterize CSF flow in the Chiari malformation.
CSF velocities do not peak at the foramen magnum but below it,14,15 according to published studies applying CFD to CSF flow. In 1 study, CFD in an idealized model of the subarachnoid space showed greater peak velocities below rather than at the foramen magnum, both for systolic flow (away from the cranial vault) and diastolic flow (toward the cranial vault).14 In another study, CFD in subject-specific models of the subarachnoid space showed greater velocities below the foramen magnum than in it.15
The goal of this study was to measure CSF peak velocities at the foramen magnum and in the upper cervical spinal canal in patients with the Chiari I malformation. One hypothesis tested was that peak CSF velocities are greater below the foramen magnum than at it, as studies with CFD have shown.
Materials and Methods
Patients
The institutional review board approved this study and waived the requirement for informed consent for the retrospective review of MR images and patient data recorded in a spreadsheet. The study conformed to the Health Insurance Portability and Accountability Act guidelines. Patients referred for MR imaging and PCMR CSF flow studies between October 2008 and June 2009, when the imaging protocol included multisection axial PCMR, were retrospectively reviewed. Data collected from the CSF flow studies and from MR images were incorporated into a spreadsheet without patient names or other identifiers. Patients with previous spinal surgery were excluded.
MR Imaging
The MR imaging examinations included localizer images, T1-weighted sagittal spin-echo (TR/TE, 500/20 ms) images, T2-weighted sagittal fast spin-echo (TR/TE, 2000/90 ms) images, and axial long and short TE images of the spine. For the flow study, an axial section was defined at the foramen magnum and at 4–7 successive locations 1 cm apart below the first section. A commercial PCMR flow-quantification sequence (Fast Cine PC; GE Healthcare, Milwaukee, Wisconsin) was used. Parameters included the following: TR/TE, 20/5 ms; 20° flip angle; 5-mm section thickness; 180-mm FOV; 256 × 256 matrix; and 10-cm/s encoding velocity. Fourteen image frames were acquired throughout the cardiac cycle. These acquisitions were initiated by the R wave from a chest electrocardiographic electrode or by peripheral gating.
One investigator (V.H.) reviewed the anatomic images in each study and measured the distance that the tonsils extended below the foramen magnum. If the tonsils extended >5 mm below the foramen magnum, the patient was classified as having tonsillar ectopia. The investigator evaluated the images to identify any other abnormalities in the posterior fossa and spinal canal and any previous surgery on the spinal column or head, which were exclusion criteria for this study. The investigator also examined the images for the presence of syrinx or hydromyelia.
Assessment of CSF flow
A technologist, by using commercially available software (ReportCard 3.0, GE Healthcare), selected a region of interest that included the subarachnoid space and excluded areas of apparent blood vessels in the subarachnoid space. This region of interest was then applied to each of the 14 phases acquired in the PCMR. The technologist also defined a region of interest in relationship to cervical spinal musculature (“background”), which the program used to correct the velocities for phase shifts introduced by eddy currents. The program plotted the velocities for each voxel in each of the 14 phases and tabulated the peak positive (caudad flow or “systolic velocity”) and negative velocity (craniad flow or “diastolic velocity”) for each phase.
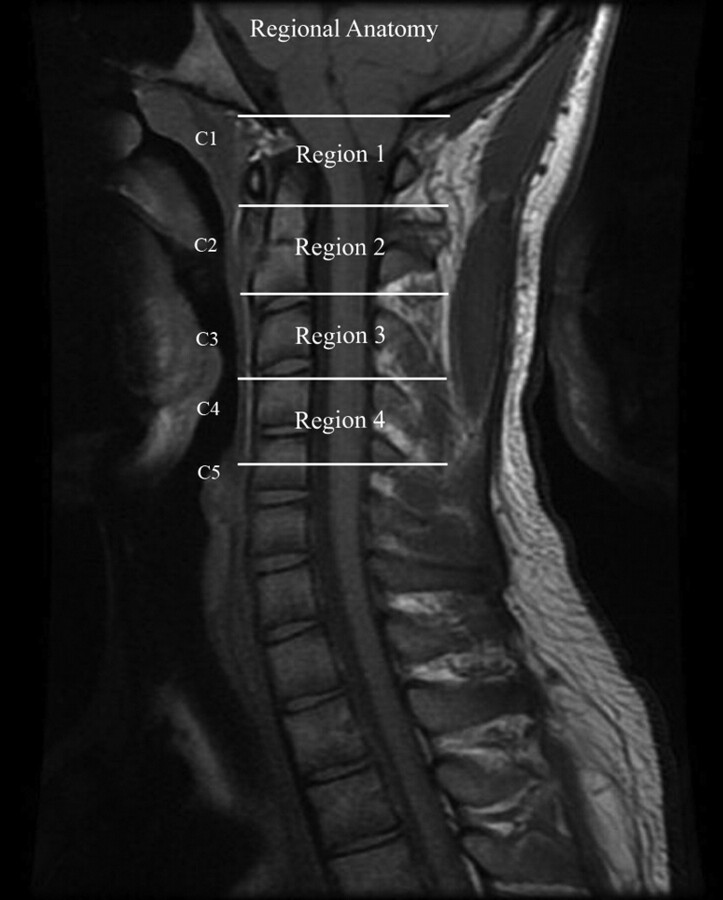
The cervical spinal canal was divided into 4 regions to encompass the anatomic locations of the sections obtained (Fig 1 ). Region 1 included the foramen magnum and upper C2; region 2, the mid C2 to the C2-C3 disk; region 3, the body of C3 to the C3-C4 disk; and region 4, the body of C4. One investigator (S.S.) then reviewed each flow study and assigned sections to each of the 4 regions.
Fig 1.
The 4 regions in which CSF flow was measured in this study are designated by lines placed on an MR image of the lower foramen magnum and the cervical spinal canal.
One investigator (S.S.), using commercially available software (ReportCard, GE Healthcare) to display the image for each of the 14 phases, identified the location of the largest systolic and diastolic flow jets in the section, placed a region of interest to encompass the subarachnoid space and another to encompass the background, and recalculated the velocities for each voxel in each phase. Using the automatic display of the location of the highest positive velocity in the subarachnoid space at each of the 14 phases, the investigator confirmed that the peak velocity displayed by the program corresponded to a conspicuous flow jet. The largest maximal velocity during the systolic phase of CSF flow was recorded as the PSV. If the maximal velocity corresponded to phase artifacts or a possible blood vessel, a velocity from another voxel that did correspond to the jet was recorded. To confirm the location of the peak negative velocities, we reviewed the phases during which flow was mostly negative in ReportCard. The cross-hair tool was then used to locate maximal negative velocities and to confirm their conformance to a diastolic flow jet. The maximal negative velocity during the diastolic phase of CSF flow was recorded as the PDV. As with the systolic velocities, if the maximal velocity corresponded to phase artifacts or a possible blood vessel, a velocity from another voxel that corresponded to the jet was recorded.
To ensure that peak CSF velocities measured within a region of interest conformed to a flow jet, we drew a small region of interest to encompass a jet, and the velocities in this region of interest were compared with those for the entire subarachnoid space. Locations of ghosting artifacts were identified to ensure that peak velocities were not affected by these artifacts. Confounding effects of blood flow were avoided by excluding voxels that failed to show the to-and-fro flow pattern expected for CSF. Aliasing was recognized by identifying voxels with an inappropriate sign within a flow jet on the flow plots. Aliased velocities were corrected by subtracting 10 from the absolute value of the aliased flow and adding 10. Peak systolic and diastolic velocities were plotted for the 4 regions for all patients and separately for patients with and without tonsillar ectopia. Additionally, velocities were plotted separately for patients 10 years or younger, and for females and males.
Statistical Analysis
Continuous variables were summarized as mean ± 1 SD. Fisher exact tests and Kruskal-Wallis tests were used for differences between patients with and without tonsillar ectopia in categoric and continuous variables, respectively. Linear mixed-effects models16 were used to assess the impact of region (foramen magnum, C2, C3, C4) and classification (with and without tonsillar ectopia) on peak velocity. Peak systolic and diastolic velocities were analyzed separately. First, a baseline model, including region and classification as fixed effects and a random intercept term with region nested within patient, was fitted. Variables considered for inclusion were then added to this model sequentially. If the model fit improved significantly, as judged by an F-test, the model was updated to include that variable. The candidate variables were, in order, the following: region-classification interaction, sex, age (continuous), age (categoric, 10 years or younger versus older than 10 years only if the continuous age term was not significant), and the presence of a syrinx. Two linear contrasts tested for the effect of classification and for foramen magnum versus the rest of the regions. Residuals were examined to assess model assumptions. Parameter estimates are reported as estimates (SE). Effects were considered significant if P was <.05 (2-sided). Parameter estimates were reported as point estimates (SE). The aspect ratio in statistical graphics was chosen so that, on average, line segments were at 45° (Cleveland 45° banking rule). Statistical graphics and analyses were obtained in R, Version 2.10.0 (www.R-project.org)17 and the R nlme (Linear and Nonlinear Mixed Effects Models) package (http://cran.r-project.org/web/packages/nlme/index.html).17,18
Results
Patients
In the time period for this work, 24 CSF flow studies were performed in 22 patients. Technically satisfactory PCMR studies and ReportCard velocity tabulations were available in each case. Patients included 11 males and 11 females. Ages ranged from 1.5 to 60 years (average age, 28).
MR Imaging
Seven MR imaging studies showed a cranio-occipital decompression, an exclusion criterion for the study. After we excluded the 7 studies, each qualifying patient had 1 study each. Of the 17 remaining studies, 13 had tonsillar herniation of ≥5 mm (average, 11.1 mm; range, 5–28 mm). Four patients had <5 mm of tonsilar ectopia. One with probable idiopathic syringomyelia had a thoracic cord syrinx. One had aqueductal stenosis and no tonsilar ectopia. Two had tonsillar ectopia of <5 mm (average, 1.7 mm) and symptoms typical of Chiari I malformation. No malformations of the posterior fossa or spine were identified in the study subjects except the Chiari I malformations. Syringomyelia was identified in 2 patients. Of the patients with tonsillar ectopia, 9 were females, ranging in age from 12 to 60 years, and 8 were males with ages ranging from 1.5 to 42 years. These patients averaged 24.9 ± 19.4 years of age (range, 1.5–60 years), not significantly different from those without tonsillar ectopia (33.3 ± 16.3 years; P = .336). Of the 17 patients, 4 (all males) were 10 years of age or younger.
Assessment of PCMR results
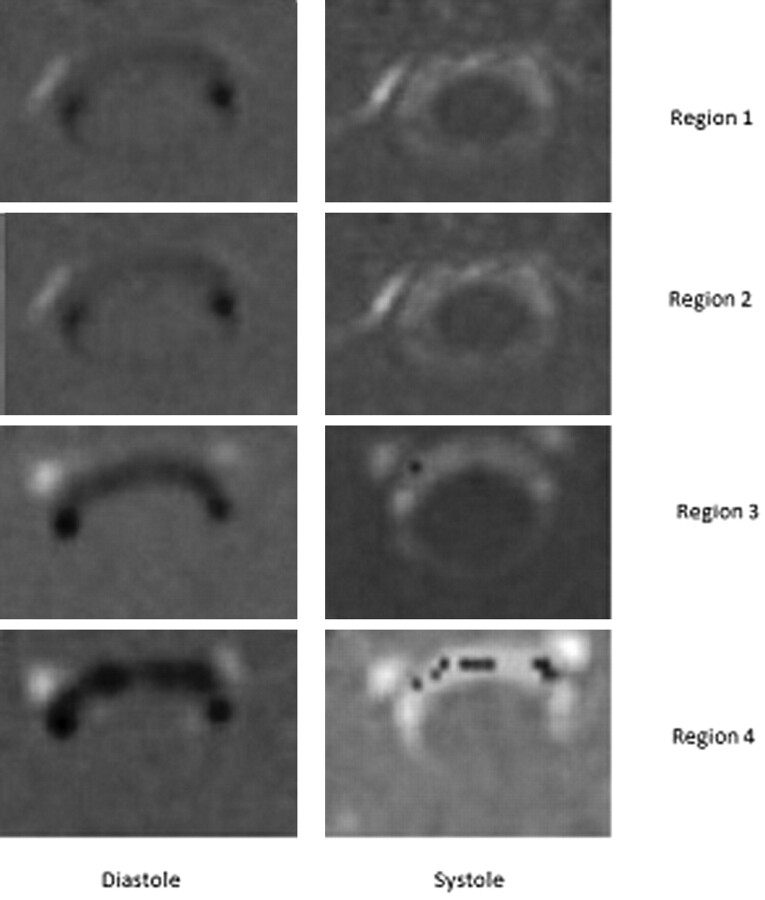
Flow studies were acquired for regions 1 through 4 in 8 patients, for regions 1 through 3 in 5 patients, and for regions 1 and 2 in 4 patients. The peak flow velocities recorded in the technologist's initial analysis differed from the more detailed analysis performed by the investigator by 25% on average for the systolic velocity and 19% for the diastolic velocity. In all cases with a larger than average difference, confounding blood flow was identified as the cause. Flow images showed that the highest velocities during systole or diastole were located in the anterior subarachnoid space (Fig 2 ). Flow jets, when present, occupied the subarachnoid space anterolateral to the spinal cord (Fig 2).
Fig 2.
PCMR axial flow images from diastole (left column) and systole (right column) in each of the 4 regions in a patient with tonsilar ectopia. Systolic flow (away from the head) has a positive (bright) signal intensity, and diastolic flow (toward the head) has a dark signal intensity. Flow patterns have greater inhomogeneity and higher velocities as the distance from the foramen magnum increases. PDVs in this patient are respectively 3.7, 2.9, 7.0, and 8.0 cm/s in regions 1 though 4; PSVs are 5.2, 5.6, 6.8, and 10.4 cm/s. In systolic flow images in regions 3 and 4, paradoxical negative signal intensity indicative of aliased flow is noted in the regions of high positive flow.
For all patients collectively, PSV averaged 5.6 ± 2.6 cm/s in region 1 and 7.5 ± 2.4 cm/s in region 4 and increased progressively from region 1 to region 4 (Fig 3 ). Relative to the foramen magnum, region 4 had significantly higher PSV (P = .001) and region 3 had marginally significantly higher PSV (P = .050) in the baseline statistical model. PDV for all patients averaged 3.5 ± 1.5 cm/s in region 1 and 4.7 ± 1.9 cm/s in region 4 and appeared to peak in region 3 at 5.0 ± 1.4 cm/s (Fig 3). Flow was significantly faster in regions 2 and 3 than in the foramen magnum (P = .041 and P = .011, respectively) but not in region 4 (P = .152).
Fig 3.
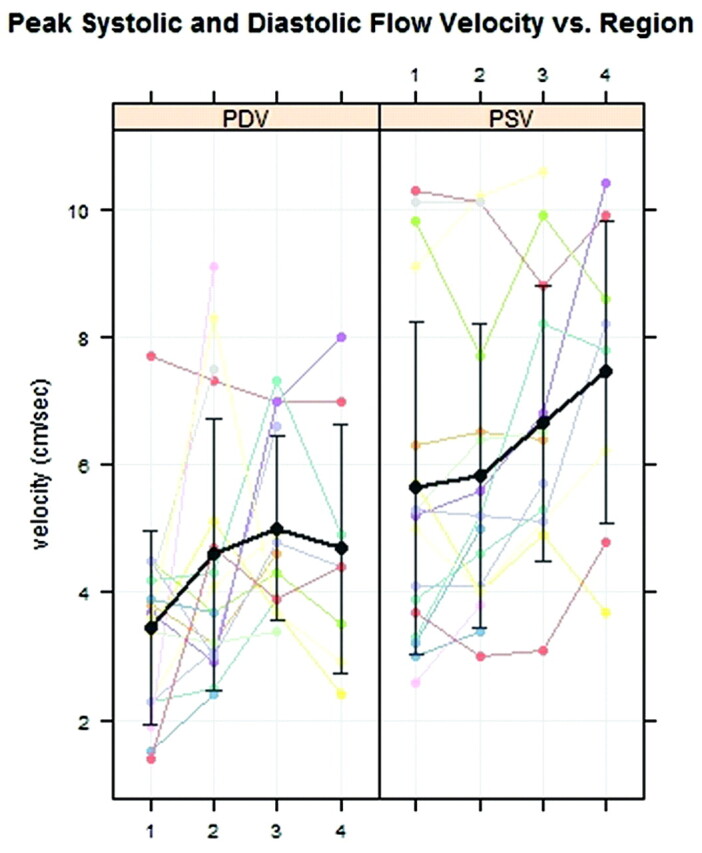
PDV and PSV at regions 1 through 4 in 17 patients with multilevel CSF flow studies. The average PSV (black line) increases progressively over the 4 regions. The average PDV (black line) increases over the first 3 regions. Error bars display 1 SD.
When plotted separately, the PSV for the patients with and without tonsillar ectopia had different patterns (P = .001) (Fig 4 ). The average PSVs in region 1 were higher for the patients with than for those without tonsillar ectopia (6.0 ± 2.9 versus 4.4 ± 1.0 cm/s). For the patients without tonsilar ectopia, average PSV increased progressively from region 1 to region 4 more steeply than for patients with tonsillar ectopia. In patients with tonsillar ectopia, average PDV increased between region 1 and region 2 and then diminished in regions 3 and 4. In patients without tonsillar ectopia, PDV appeared greater in regions 3 and 4 than in regions 1 and 2. For patients with tonsillar ectopia, PDV in the foramen magnum averaged 3.4 ± 1.7 and 3.7 ± 1.0 cm/s, respectively (Fig 4).
Fig 4.
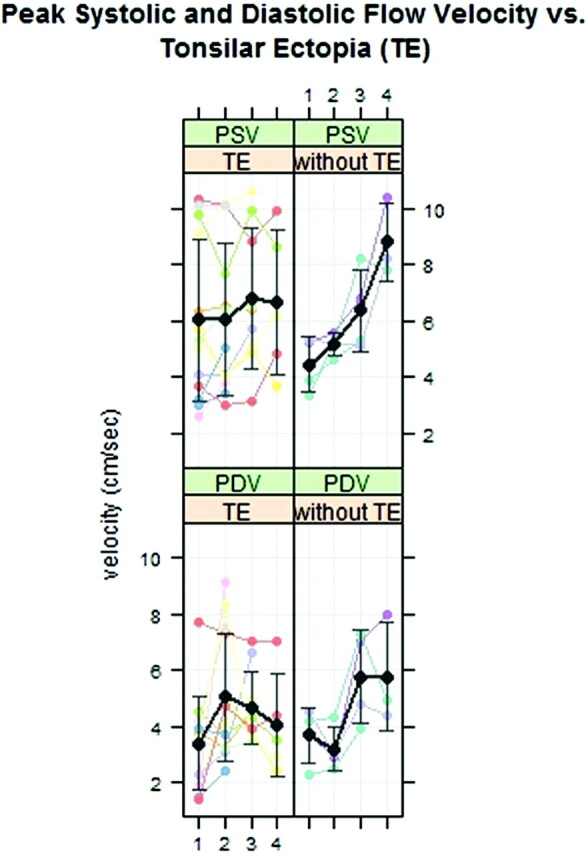
PSVs and PDVs in 14 patients with and 4 without tonsillar ectopia. The black lines and error bars show respectively the mean and SD. The effect of level on peak velocity differs for the 2 groups.
In comparison of velocities for the groups younger than and older than 10 years of age, differences were evident. PSVs exceeded 9 cm/s for the 4 regions in the younger group (Fig 5 ). For the older and the younger patients, PDV velocities appeared similar. The P values for age group difference were significant for PSV (P < .001) but not for PDV (P = .36).
Fig 5.
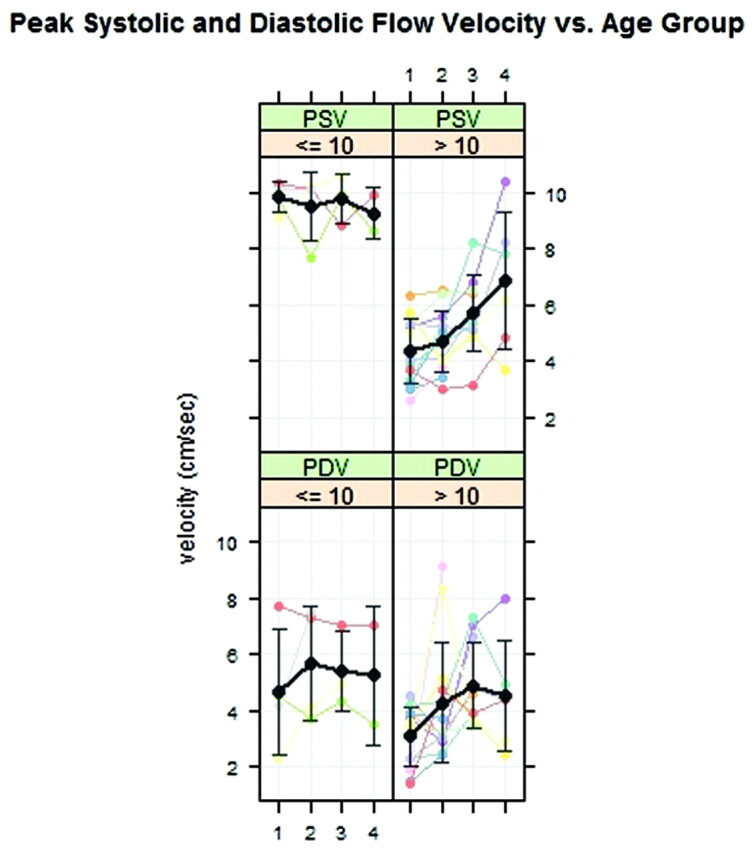
PSVs and PDVs for patients 10 years of age or younger and patients older than 10 years of age plotted by region. Average PSV (black line) is faster in the younger patients. Error bars show an SD. The gray lines and error bars show the mean and SD.
In the comparison of velocities for the male and female groups, differences were evident (Fig 6 ). For the male patients, the PSVs in region 1 were higher than those in the females (7.3 ± 2.8 versus 4.2 ± 1.3 cm/s, P < .001). In males and females, PDVs in the foramen magnum averaged 4.3 ± 1.6 and 2.7 ± 1.0 cm/s, respectively (P = .062).
Fig 6.
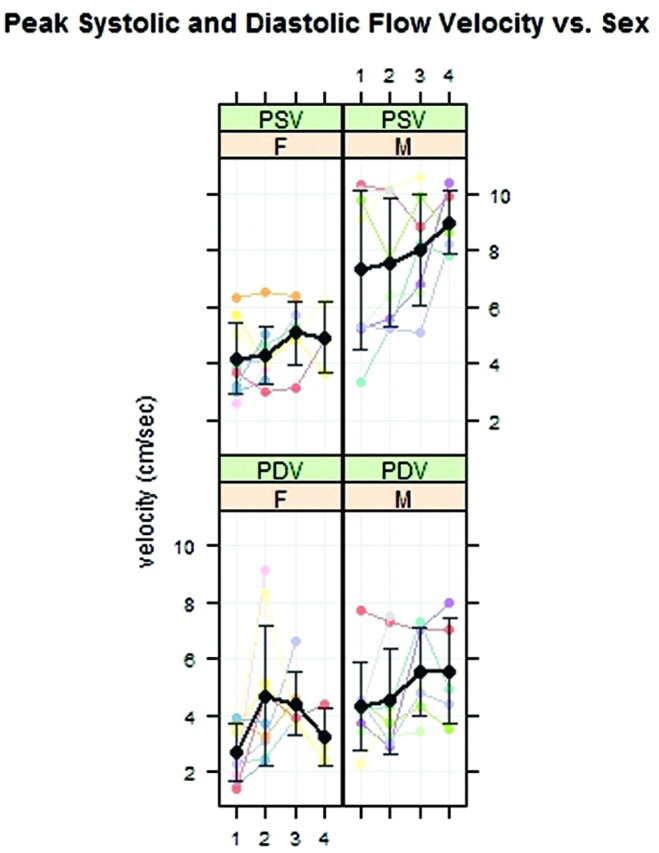
PSVs and PDVs for males and females plotted by region. PSV on average (black line) is faster in males than in females.
Multivariate Analyses
Relative to the foramen magnum, PSV (SE) increased by 0.73 (0.88), 1.93 (0.64), and 4.09 (0.64) cm/s in regions 2 through 4, respectively (P = .27, .006, and <.001, respectively). The effect of age was marginally significant (P = .053), with flow in males higher by 1.36 (0.63) cm/s than in females over all regions combined. Sex was marginally significant (P = .052). The presence of syrinx was not significant (P = .10). The region interaction with classification (with and without tonsillar ectopia) was statistically significant (P = .001).
For PDV, none of the main effects of the regions were significant (P ≥ .122 for regions 2 and 3), though the PDV at region 3, with velocities exceeding those of the foramen magnum by 2.08 (1.02) cm/s, was marginally significant (P = .052). The region by classification interaction was marginally significant (P = .051) and added to the baseline model to facilitate comparison with the model for PSV. Neither sex (P = .062) nor age older than 10 years (P = .36) nor syrinx (P = .30) was significant. For PDV, there were no significant differences due to classification (P = .42). PDV at the foramen magnum was not significantly different from PDV in the lower 3 regions combined (P = .142).
Discussion
This study demonstrates that in a group of patients referred for CSF flow imaging, peak CSF systolic velocity increased progressively between the foramen magnum and the C4 region, and PDV reached a maximum at C3. In the patients 10 years of age and younger, PSVs appeared greater than those in patients older than 10 years of age, while diastolic velocities did not differ greatly between these 2 age groups. Sex may also be a factor in CSF flow velocities.
The CSF velocities in the foramen magnum in this study agree with previously published results. In this study, peak systolic and diastolic velocities at the foramen magnum in patients with tonsillar ectopia (6.0 and 3.4 cm/s respectively) agree reasonably well, considering the sample size, with values calculated by similar methods in a group of patients with Chiari I malformation (5.3 and 2.8 cm/s)9; peak systolic and diastolic velocities in patients without tonsillar ectopia (4.4 and 3.7 cm/s) compare well with those in healthy subjects in a previous report (4.5 and 3.3 cm/s).9 The observed increase in CSF velocities between the foramen magnum and the upper cervical spinal canal agrees with the results of CFD.14,15 CFD in an idealized model of the normal subarachnoid space showed that peak velocities increased from between 2 and 3 cm/s at the foramen magnum to approximately 8 cm/s at a level 6 cm below the craniovertebral junction, which is comparable with region 4 in our study.14 CFD in subject-specific models of the normal subarachnoid space showed greater velocities below than at the foramen magnum.14 The greater velocity in younger patients compared with patients older than 10 years agrees with a previous report.7
This study has limitations. We cannot exclude a selection bias due to the inclusion of only patients referred for PCMR. Because the length of the cervical spine varied between individuals, we elected to use anatomic regions rather than section levels to index the CSF velocities. We stratified results by age to avoid a bias due to this variable. The patients in this study without tonsillar herniation were not healthy subjects but patients referred for imaging. One patient without tonsillar ectopia had probable idiopathic syringomyelia, which has been reported to have abnormal CSF flow velocities.12 Our small sample size limited our statistical power to detect differences. Despite this, we were able to find significant effects of level in our regression models. Prospective studies of CSF flow in patients and in controls with the methodology in this study would be valuable in confirming our results.
The measurement of CSF flow is subject to error and bias. Peak velocities in the ranges measured in this study may have systematic and random errors of 20%.19 We elected to use peak CSF velocity, which provides a measure of flow inhomogeneity, rather than volume flow. The measurement of peak velocity is less accurate because of the role of noise in an individual voxel measurement. The error due to artifacts and confounding effects of arterial flow in this case was minimized by the additional analyses to ensure that the peak velocity detected in a jet agreed with other measurements within the jet. The additional analyses, performed manually, admit the possibility of an investigator bias.
The volume and velocity of oscillatory CSF flow result from changes in brain volume during the cardiac cycle (Monro-Kellie doctrine). Oscillatory CSF flow depends on many variables. The faster velocities in children may result from greater cyclical changes in brain volumes or smaller dimensions of the cervical spine. The explanation for CSF velocities increasing below the foramen magnum needs more study. The variation of subarachnoid space dimension or inertial effects in flowing CSF may have a role. The cause of sex differences in CSF flow needs more study. Cervical spine anatomy or the relative magnitude of brain volume changes hypothetically may cause sex differences.
Conclusions
The study shows that CSF velocities vary significantly by level in the cervical spinal canal. Tonsil position, age, sex, and other factors may affect oscillatory CSF flow in the upper cervical spinal canal. In future studies, multilevel CSF flow studies may improve our understanding of CSF flow and facilitate selecting patients for treatment. The study adds additional validation to CFD studies of CSF flow, which indicate greater CSF velocities below the foramen magnum.
Abbreviations
- CFD
computational fluid dynamics
- PCMR
phase contrast MR imaging
- PDV
peak diastolic velocity
- PSV
peak systolic velocity
- SE
standard error
Footnotes
Victor Haughton received support from the Center for Biomedical Computing, Simula, Lysaker, Norway.
References
- 1. Meadows J, Kraut M, Guarnieri M, et al. Asymptomatic Chiari type I malformations identified on magnetic resonance imaging. J Neurosurg 2000; 92: 920– 26 [DOI] [PubMed] [Google Scholar]
- 2. Friede RL, Roessmann U. Chronic tonsillar herniation: an attempt at classifying chronic herniations at the foramen magnum. Acta Neuropathol 1976; 34: 219– 35 [DOI] [PubMed] [Google Scholar]
- 3. Heiss JD, Patronas NHL, DeVroom HL, et al. Elucidating the pathophysiology of syringomyelia. J Neurosurg 1999; 91: 532– 62 [DOI] [PubMed] [Google Scholar]
- 4. Hofmann E, Warmuth-Metz M, Bendszus M, et al. Phase-contrast MR imaging of the cervical CSF and spinal cord: volumetric motion analysis in patients with Chiari I malformation. AJNR Am J Neuroradiol 2000; 21: 151– 58 [PMC free article] [PubMed] [Google Scholar]
- 5. Dolar MT, Haughton V, Iskandar BJ, et al. Effects of craniocervical decompression on peak CSF velocities in symptomatic patients with Chiari I malformation. AJNR Am J Neuroradiol 2004; 25: 142– 45 [PMC free article] [PubMed] [Google Scholar]
- 6. Iskandar BJ, Quigley M, Haughton V. Foramen magnum cerebrospinal fluid flow characteristics in children with Chiari I malformation before and after craniocervical decompression. J Neurosurg 2004; 101: 169– 78 [DOI] [PubMed] [Google Scholar]
- 7. Pinna G, Alessandrini F, Alfieri A, et al. Cerebrospinal fluid flow dynamics study in Chiari I malformation: implications for syrinx formation. Neurosurg Focus 2000; 8: E3 [DOI] [PubMed] [Google Scholar]
- 8. Iskandar BJ, Haughton V. Age-related variations in peak cerebrospinal fluid velocities in the foramen magnum. J Neurosurg 2005; 103: 508– 11 [DOI] [PubMed] [Google Scholar]
- 9. Oldfield EH, Muraszko K, Shawker TH, et al. Pathophysiology of syringomyelia associated with Chiari I malformation of the cerebellar tonsils: implications for diagnosis and treatment. J Neurosurg 1994; 80: 3– 15 [DOI] [PubMed] [Google Scholar]
- 10. Quigley MF, Iskandar BJ, Quigley MA, et al. Cerebrospinal fluid flow in foramen magnum: temporal and spatial patterns at MR imaging in volunteers and in patients with Chiari I malformation. Radiology 2004; 232: 229– 36 [DOI] [PubMed] [Google Scholar]
- 11. Bhadelia RA, Bogdan AR, Wolpert SM, et al. Cerebrospinal fluid flow waveforms: analysis in patients with Chiari I malformation by means of gated phase-contrast MR imaging velocity measurements. Radiology 1995; 196: 195– 202 [DOI] [PubMed] [Google Scholar]
- 12. Hofkes SK, Iskandar BJ, Turski PA, et al. Differentiation between symptomatic Chiari I malformation and asymptomatic tonsilar ectopia by using cerebrospinal fluid flow imaging: initial estimate of imaging accuracy. Radiology 2007; 245: 532– 40. Epub 2007 Sep 21 [DOI] [PubMed] [Google Scholar]
- 13. Haughton VM, Korosec FR, Medow JE, et al. Peak systolic and diastolic CSF velocity in the foramen magnum in adult patients with Chiari I malformations and in normal control subjects. AJNR Am J Neuroradiol 2003; 24: 169– 76 [PMC free article] [PubMed] [Google Scholar]
- 14. Linge SO, Haughton V, Løvgren AE, et al. CSF flow dynamics at the craniovertebral junction studied with an idealized model of the subarachnoid space and computational flow analysis. AJNR Am J Neuroradiol 2010; 31: 185– 92 [DOI] [PMC free article] [PubMed] [Google Scholar]
- 15. Roldan A, Wieben O, Haughton V, et al. Characterization of CSF hydrodynamics in the presence and absence of tonsilar ectopia by means of computational flow analysis. AJNR Am J Neuroradiol 2009; 30: 941– 46 [DOI] [PMC free article] [PubMed] [Google Scholar]
- 16. R Development Core Team. R: A Language and Environment for Statistical Computing. 2009. Vienna, Austria: R Foundation for Statistical Computing; [Google Scholar]
- 17. Pinheiro JC, Bates DM, DebRoy S, et al. nlme: Linear and Nonlinear Mixed Effects Models. R package, Version 3. 2010.1–97. http://cran.r-project.org/web/packages/nlme/index.html. Accessed May 15, 2011
- 18. Pinheiro JC, Bates DM. Mixed-Effects Models in S and S-PLUS. 2000New York: Springer-Verlag; [Google Scholar]
- 19. Wentland AL, Wieben O, Korosec FR, et al. Accuracy and reproducibility of phase-contrast MR imaging measurements for CSF flow. AJNR Am J Neuroradiol 2010; 31: 1331– 36. Epub 2010 Mar 4 [DOI] [PMC free article] [PubMed] [Google Scholar]


