Abstract
Background
Diabetes has been identified as a risk factor for intubation and mortality in patients with coronavirus disease 2019 (COVID‐19), caused by the novel severe acute respiratory syndrome coronavirus 2 (SARS‐CoV‐2). We seek to examine the impact of clinical variables such as glycosylated hemoglobin (HbA1c) on mortality and need for intubation, as well as demographic variables such as age, sex, and race on persons with type 2 diabetes and COVID‐19.
Methods
Analyses were conducted on 4413 patients with an International Classification of Diseases and Related Health Problems (ICD‐10) diagnosis of type 2 diabetes and COVID‐19. Survival analysis was conducted using Kaplan‐Meier curves and the log‐rank test to compare subgroup analyses.
Results
In this multivariate analysis, male gender, older age, and hyperglycemia at admission were associated with increased mortality and intubation, but this was not seen for race, ethnicity, insurance type, or HbA1c. Based on Kaplan‐Meier analysis, having comorbid conditions such as hypertension, chronic kidney disease, and coronary artery disease was associated with a statistically significant increased risk of mortality.
Conclusions
Glycemic levels at admission have a greater impact on health outcomes than HbA1c. Older men and those with comorbid disease are also at greater risk for mortality. Further longitudinal studies need to be done to evaluate the impact of COVID‐19 on type 2 diabetes.
Keywords: COVID‐19, glycemic control, mortality, type 2 diabetes, urban population
Highlights
Admission serum or point‐of‐care glucose is a greater predictor of mortality than glycosylated hemoglobin in persons with type 2 diabetes and coronavirus disease 2019 (COVID‐19).
Those with diabetes and COVID‐19 who were intubated had a higher morality than those who were not intubated.
Older age, male gender, and history of chronic kidney disease, hypertension, or coronary artery disease increased the risk of mortality. Race and insurance type had no impact on mortality.
摘要
背景
糖尿病已被确定为由新型严重急性呼吸综合征冠状病毒2型(SARS‐CoV‐2)引起的2019年新型冠状病毒肺炎患者气管插管和死亡的危险因素。我们试图检查临床变量如糖化血红蛋白(HbA1c)对死亡率和插管需求的影响, 以及人口统计学变量如年龄、性别和种族对2型糖尿病和新型冠状病毒肺炎患者的影响。
方法
对4413例符合国际疾病和相关健康问题的分类(ICD‐10)分类诊断为2型糖尿病和新型冠状病毒肺炎的患者进行分析。生存分析采用Kaplan‐Meier曲线和对数秩检验进行亚组分析比较。
结果
在这项多变量分析中, 男性、高龄和入院时高血糖与死亡率和气管插管增加相关, 但与种族、民族、保险类型或糖化血红蛋白无关。根据Kaplan‐Meier分析, 患有高血压、慢性肾脏疾病和冠心病等并存疾病与死亡风险在统计学上显著增加相关。
结论
入院时的血糖水平比糖化血红蛋白对健康结局的影响更大。老年男性和合并疾病的患者死亡风险也更大。需要做进一步的纵向研究来评估新型冠状病毒肺炎对2型糖尿病的影响。
Keywords: 新冠肺炎, 血糖控制, 死亡率, 2型糖尿病, 城市人口
1. BACKGROUND
The relationship between coronavirus disease 2019 (COVID‐19), caused by the novel severe acute respiratory syndrome coronavirus 2 (SARS‐CoV‐2), and diabetes has been described as bidirectional. 1 Persons with diabetes are susceptible to developing SARS from COVID‐19. 2 Proposed mechanisms for these findings are alterations in immune response and downregulation of angiotensin‐converting enzyme 2, allowing for increased levels of angiotensin II to significantly worsen respiratory disease. 3 , 4 , 5 It has been postulated that among persons with diabetes there are more severe cases of COVID‐19 due to further immunodeficiency, including decreased T cell response, increased viral binding/entry, and permeable respiratory epithelium. 5
COVID‐19 also has transient effects in the pancreas, causing islet cell damage as seen with other coronaviruses which cause SARS. 3 This pancreatic damage can lead to severe hyperglycemia, including diabetic ketoacidosis (DKA). In persons with or without diabetes, presenting with COVID‐19 and hyperglycemia (>10 mmol/L or 180 mg/dL) increased the chances of in‐hospital mortality for those who become critically ill. 6 In a sample of 2041 patients in Wuhan, 42.7% of patients presented with hyperglycemia and only 13.4% of them had diabetes. 7 In a multicenter sample in the United States, those with diabetes or stress hyperglycemia were nearly five times as likely to die as those with euglycemia. 8
Diabetes is also an identifiable risk factor for increased likelihood of intubation and mortality in persons with COVID‐19. In a cohort of patients with COVID‐19 in Chicago, diabetes was found to be the only comorbid condition associated with intubation (odds ratio [OR], 1.64; 95% CI, 1.02‐2.66). 9 Those with diabetes and elevated C‐reactive protein (CRP) have been found to have a worse prognosis and greater risk of mortality. 10 Persons with diabetes may develop more severe COVID‐19 complications, such as acute cardiac injury or acute respiratory distress syndrome. 11 They also have a 1.7 greater chance of dying as compared with those with COVID‐19 without diabetes. 11 Severe cases of COVID‐19 requiring hospitalization has disproportionately impacted those who identify as Black, Hispanic, or Native American, but it is unclear if this inequality is seen in in persons with diabetes. 12 , 13 As a result, we propose to further examine the association between health outcomes in persons with COVID‐19 and diabetes in a multiracial cohort of persons in the New York metropolitan area with type 2 diabetes, as previous studies of persons with COVID‐19 and diabetes have not identified race or reported a small number of ethnic minorities. 8 , 11 , 14 , 15
We propose that having poorly controlled diabetes as represented by a glycosylated hemoglobin (HbA1c) level greater than 9% is associated with poorer health outcomes when compared with those with an HbA1c less than 9%. In this multiracial cohort of persons with type 2 diabetes and COVID‐19, we examine the primary health outcomes of mortality and delivery of mechanical ventilation, as well as the secondary outcomes of stroke, pulmonary embolus, and myocardial infarction (MI).
2. METHODS
2.1. Participants
Analyses were conducted on patients with an International Classification of Diseases and Related Health Problems (ICD‐10) diagnosis of type 2 diabetes (E11) and COVID‐19 (defined as a positive polymerase chain reaction [PCR] test) admitted to any Northwell Health System hospital in the New York area between 1 January and 31 May 2020 (Figure 1).
FIGURE 1.
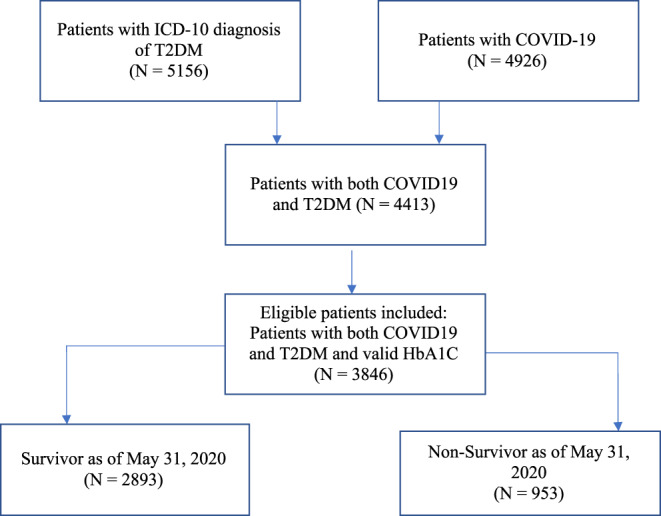
Consort diagram of patient recruitment process
2.2. Statistical analysis
A total of 4413 HbA1c data points were pulled on the patient level (results from 1 January 2020 to 1 June 2020). The HbA1c data which were the closest to the date of positive diagnosis of COVID‐19 on the patient level were utilized. All HbA1c data that were 3 months older than the patient's admission for COVID‐19 were excluded. Length of hospitalization was determined based on the first admission date until discharge date before 1 June 2020; for patients readmitted, only the first admission date was considered in the analyses.
Survival analysis was conducted using Kaplan‐Meier curves and the log‐rank test to compare subgroup analyses. Baseline patient characteristics and tests of categorical and continuous variables were analyzed. A Pearson chi‐square test was conducted to compare differences between groups, and the rank sum test was applied for continuous variables. Both univariate and multivariate Cox regression models were applied to examine the hazard ratios (HR) and their 95% CI. Multivariate models were conducted for demographic variables and comorbidities using the variables that strongly associated with mortality at univariable analyses. All statistical analyses were conducted in software R (version 3.6; R core team, Vienna, Austria). A significance level of P < .05 (2‐tailed test) was used to test for statistical significance.
3. RESULTS
3.1. Baseline characteristics
A total of 3846 patients with COVID‐19 and type 2 diabetes were included in the final analysis (Table 1). Of them, 2291 (59.6%) were men, with a median age of 68 years (interquartile range 59, 77), and 99% were privately or publicly insured. The majority of patients in the sample were non‐White (67.3%, n = 2719), with 27.1% (n = 943) being African American and 24.9% (n = 847) multiracial or other. Patients were hospitalized for a median of 10 days with a median length of stay, acuity of admission, comorbidities, emergency department visits (LACE) score of 12.2 and a median Charlson comorbidity index (CCI) of 4, indicating a high risk of readmission and a decreased 10‐year survival expectation, respectively. Patients were categorized into groups of interest by HbA1c: ≥ 9% (n = 1029, 26.8%) and <9% (n = 2817, 73.2%).
TABLE 1.
Baseline characteristics of COVID‐19 patients with diagnosis of type 2 diabetes mellitus
| Total | Alive | Expired | P value | ||||
|---|---|---|---|---|---|---|---|
| Characteristics | 3846 | 2893 | 953 | ||||
| Age, y | |||||||
| Median (IQR) | 68 | (59, 77) | 66 | (58, 75) | 73 | (64, 81) | <.0001 |
| Gender (n [%]) | |||||||
| Male | 2291 | 59.57% | 1657 | 57.28% | 634 | 66.53% | <.001 |
| Race (n [%]) | .057 | ||||||
| African American/Black | 943 | 27.10% | 718 | 24.82% | 225 | 23.61% | |
| Asian | 361 | 10.40% | 247 | 8.54% | 114 | 11.96% | |
| Declined | 14 | 0.40% | 10 | 0.35% | 4 | 0.42% | |
| Native American/Alaskan | 23 | 0.70% | 19 | 0.66% | 4 | 0.42% | |
| Native Hawaiian/Pacific Islander | 5 | 0.10% | 5 | 0.17% | 0 | 0.00% | |
| Other/multiracial | 867 | 24.90% | 656 | 22.68% | 211 | 22.14% | |
| Unknown | 146 | 4.20% | 111 | 3.84% | 35 | 3.67% | |
| White | 1127 | 32.30% | 817 | 28.24% | 310 | 32.53% | |
| Ethnicity | .205 | ||||||
| Declined | 253 | 6.58% | 187 | 6.46% | 66 | 6.93% | |
| Hispanic or Latino | 662 | 17.21% | 510 | 17.63% | 152 | 15.95% | |
| Not Hispanic or Latino | 2438 | 63.39% | 1793 | 61.98% | 645 | 67.68% | |
| Unknown | 133 | 3.46% | 93 | 3.21% | 40 | 4.20% | |
| Insurance | .081 | ||||||
| Private | 1671 | 43.45% | 1266 | 43.76% | 405 | 42.50% | |
| Public | 1792 | 46.59% | 1299 | 44.90% | 493 | 51.73% | |
| Self‐pay | 23 | 0.60% | 18 | 0.62% | 5 | 0.52% | |
| Smoking status | < .001 | ||||||
| Former smoker | 111 | 2.89% | 15 | 0.52% | 96 | 10.07% | |
| Nonsmoker | 2904 | 75.51% | 2307 | 79.74% | 597 | 62.64% | |
| Smoker | 261 | 6.79% | 218 | 7.54% | 43 | 4.51% | |
Abbreviations: COVID‐19, coronavirus disease 2019; IQR, interquartile range.
3.2. Mortality and ventilator requirement
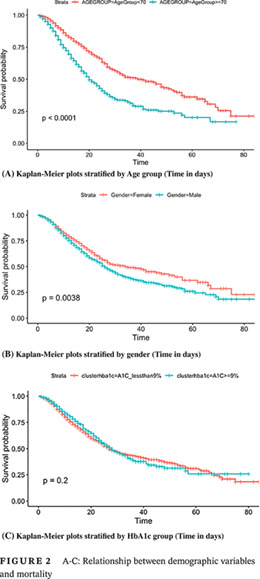
Mortality was greater among older patients (median age 72.0 years vs 65.0 years, P < .0001) and male gender (66.5% vs 57.2%, P < .0001) (Figure 2A,B), as well as those who required mechanical ventilation. Of the 946 (24.6%) patients requiring mechanical ventilation, the majority died (64.6% or 612 patients). Interestingly, there was no significant association between race or ethnicity and mortality (P = .057, P = .275; Table 1). Insurance status was also not associated with mortality.
FIGURE 2.
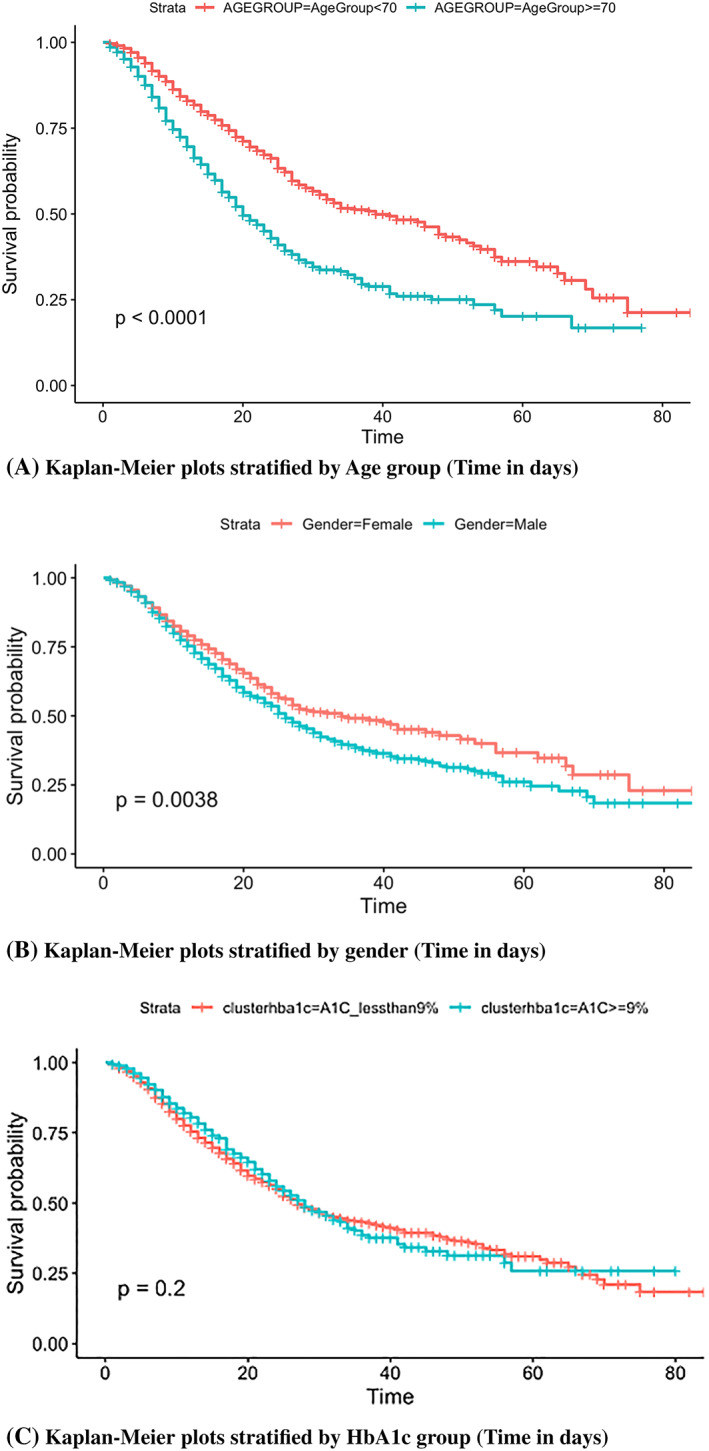
A‐C: Relationship between demographic variables and mortality
3.3. HbA1c, glucose levels, and mortality
Patients were stratified into two groups based on the HbA1c greater or less than 9% (75 mmol/mol) at their first admission, after they were confirmed COVID‐19 positive. The majority of patients had an HbA1c less than 9% (n = 2817, 73.2%), whereas those with an HbA1c ≥9% were in the minority (n = 1029, 26.8%). Log‐rank testing suggested that those with an HbA1c greater than 9% at admission did not have a significantly different survival rate compared with those with an HbA1c less than 9% (log‐rank test, P = .2) (Figure 3C).
FIGURE 3.
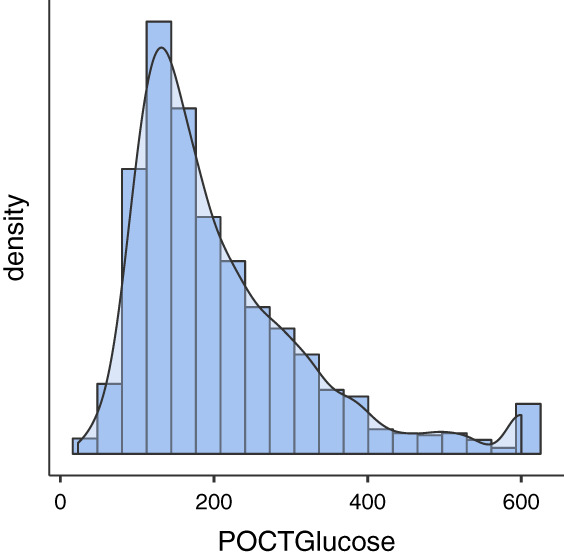
Distribution of glucose values for all patients in the raw data set
Within 24 hours of admission, those with elevated serum and point‐of‐care (POC) glucose were found to have a greater risk of mortality. Target inpatient diabetes glucose ranges from 100 to 180 mg/dL. 16 On average, those who survived had a lower admission POC glucose (165, range: 138‐238) compared with those who expired (195, range: 136‐279) (P < .0001). Of note, 464 persons were missing POC glucose within 24 hours of admission. It is also noteworthy that there were patients who had POC glucose readings as high as 600, but the majority of the values clustered about 200 (Figure 3). The same trend was evident for serum glucose levels: The average level was higher for those who expired (192, range: 140‐281) compared with those who survived (171, range: 128‐250) (P < .001). Only 29 patients were missing serum glucose as ordering a comprehensive metabolic panel was part of the admission protocol.
3.4. Comorbidity conditions
Patients with comorbid medical conditions were also examined to detect the differences in mortality. Nonsurvivors had more comorbid medical conditions such as chronic obstructive pulmonary disease (COPD) (OR = 1.63; 95% CI: [1.3, 2.06], 13.4% vs 8%; P < .001), chronic heart failure (OR = 1.40; 95% CI: [1.15, 1.71], 18.2% vs 13.1%; P < .001), coronary artery disease (CAD) (OR = 1.43; 95% CI: [1.22, 1.69], 32.7% vs 24.6%; P < .001), chronic kidney disease (CKD) (OR = 1.60; 95% CI: [1.32, −1.94], 20.1% vs 13.1%; P < .001), hypertension (OR = 1.23; 95% CI: [0.93, 1.61], 87% vs 82%; P = .002), and MI (OR = 1.69; 95% CI: [1.32‐2.16], 11.75% vs 7.5%; P < .001). Figure 4 presents all Kaplan‐Meier survival curves with log‐rank significance levels smaller than .005 (Figure 4A‐E). Kaplan‐Meier curves provide the probability of survival given the days in hospital while comparing two groups of patients with and without each comorbidity condition.
FIGURE 4.
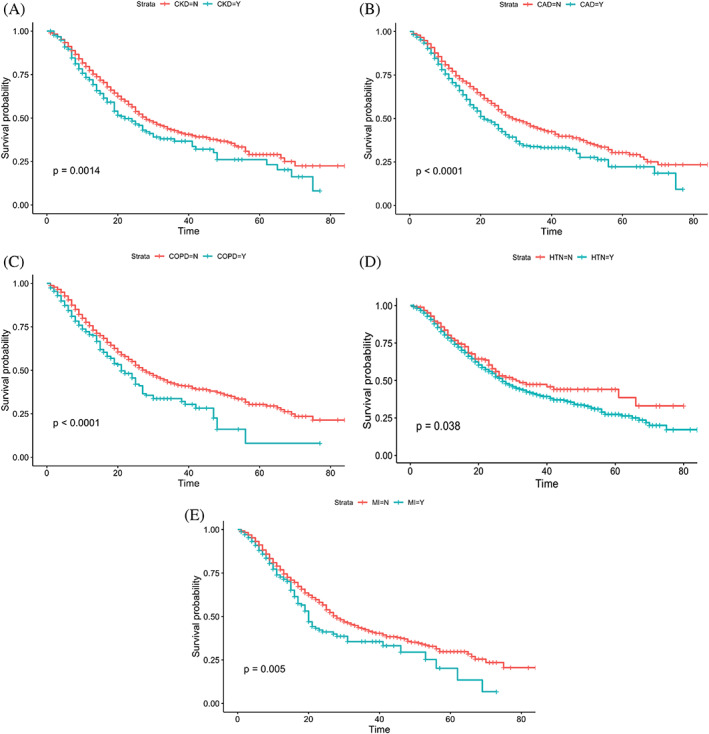
The probability of survival in those with type 2 diabetes, COVID‐19 and comorbid conditions
3.5. Association between demographics, comorbidities, ventilation use, and mortality
Univariate analysis indicated that age, male gender, CKD, CAD, ventilation use, congestive heart failure, COPD, and MI were associated with higher mortality (Table 2). Furthermore, multivariable Cox regression analysis suggested that age (HR 0.76, 95% CI: [1.86, 2.47]), male sex (HR 1.17, 95% CI: [1.04, 1.34]), ventilation use (HR 2.54, 95% CI: [2.2, 2.93]) and COPD (HR 1.23, 95% CI: [1.00‐1.4]), and MI (HR 1.12, 95% CI: [0.91, 1.39]) were significant predictors for mortality (Table 2).
TABLE 2.
Univariable and multivariable analyses of various indicators for mortality
| Univariate cox regression HR (95% CI) | P value | Multivariable analysis HR (95% CI) | P value | |
|---|---|---|---|---|
| Age (Age >=70 y versus <70 y) | 1.9 (1.7‐2.2) | <0.001 | 0.76(1.86,2.47) | <0.001 |
| Gender (male versus female) | 1.2 (1.1‐1.4) | <0.001 | 1.17( 1.0,1.34) | 0.033 |
| Race | 0.02 (0.96‐1.5) | 0.28 | ||
| HbA1C>9% or not | 0.91 (0.78‐1.1) | 0.20 | ||
| On Ventilation (Yes or no) | 2.3 (2‐2.6) | <0.001 | 2.54( 2.2, 2.93) | <0.001 |
| Comorbidity | ||||
| Asthma (yes or no) | 1 (0.81‐1.2) | 0.99 | ||
| Cancer (yes or no) | 1.1 (0.96‐1.4) | 0.14 | ||
| CAD (yes or no) | 1.3 (1.2‐1.5) | <0.001 | ||
| CKD (yes or no) | 1.3 (1.1‐1.5) | <0.001 | ||
| CHF (yes or no) | 1.2 (1‐1.4) | 0.02 | ||
| COPD (yes or no) | 1.4 (1.1‐1.7) | <0.001 | 1.23(1.0,1.5) | 0.049 |
| DKA (yes or no) | 1 (0.75‐1.3) | 0.99 | ||
| MI (yes or no) | 1.3 (1.1‐1.6) | 0.01 | 1.12(0.91,1.39) | 0.004 |
| Stroke (yes or no) | 0.95 (0.8‐1.1) | 0.58 | ||
| Hyperlipidemia (yes or no) | 1 (0.88‐1.1) | 0.95 | ||
| Intracranial bleed or Hemorrhagic Stroke (yes or no) | 0.56 (0.28‐1.1) | 0.10 | ||
| Ischemic Stroke (yes or no) | 0.64 (0.45‐0.92) | 0.02 | ||
| VTE including PE (yes or no) | 0.4 (0.3‐0.54) | <0.001 |
4. DISCUSSION
Roughly 50% of Americans have a HbA1c greater than 7%, so it would be expected that many of those who were hospitalized would have elevated HbA1c. 17 Surprisingly only 27% of the sample had HbA1c greater than 9%. Although COVID‐19 directly effects the pancreas, the acuity of the disease likely only played a small role in HbA1c, as it is a 3‐month average of glycemic control. As a result, the admitting serum glucose, not HbA1c, was a greater predictor of the need for intubation or mortality. This is different from what has been previously seen in the diabetes population without COVID‐19, as admission HbA1c has been found to be a good predictor of inpatient glycemic control, with those less than 7% faring better than those who with 9% or higher. 18
4.1. Impact of age, race, and sex
In this sample, age and sex, but not race, were associated with increased mortality in persons with type 2 diabetes and COVID‐19. As previously reported by Shi et al, we found that older age and male sex increases inpatient COVID‐19‐related mortality in persons with diabetes 14 ; however, their study used age and sex‐matched controls without diabetes as their control group. In our study, all persons had diabetes, and we compared survivors with nonsurvivors. In a sample of mostly Black or Hispanic patients in the Bronx with COVID‐19 and a 40% prevalence of diabetes, male gender and increasing age were predictors for in‐hospital mortality. 19 As noted in our study, there was no association between race/ethnicity and mortality. In our sample, the majority of the patients who died were White, followed by Black/African American, but this was not statistically significant. This result was probably due to the fact that White patients were the most prevalent group in the study.
4.2. Impact of hyperglycemia on outcomes
Hyperglycemia in persons with diabetes occurs for several reasons including: (a) pancreatic destruction, (b) lack of exercise due to poor respiratory function and need to quarantine, 20 and (c) the use of steroids for COVID‐19 therapy. Elevated blood glucose levels are also associated with elevated levels of components of the cytokine storm, 21 such as neutrophils, interleukin‐6, CRP, and lactic dehydrogenase. 11 In our sample, those with a higher white cell count were more likely to die. Although the result was statistically significant, it was not clinically significant: 8.05 vs 7.57 (P = .008).
Many patients presented with severe hyperglycemia, including DKA. The yearly in‐hospital rate of death from DKA in persons with diabetes declined from 1.1% in 2000 to 0.4% in 2014. 22 In this patient sample of persons with type 2 diabetes and COVID‐19, there was no association between DKA and mortality (P = .99). In a small sample of patients in North London, from 1 to 31 March 2020, 35 patients presented with DKA, most of whom were of African descent and had type 2 diabetes. 23 In a cohort from Wuhan of 658 patients, 42 had ketosis. Among those 42 patients, 15 had diabetes but only 3 of them had DKA. 24 This difference is not surprising as African Americans and Hispanics have been found to have higher rates of ketosis‐prone type 2 diabetes compared with Whites or Asians. 25 In addition, African Americans have been found to have lower β‐cell function after DKA when compared with Hispanics with ketosis‐prone type 2 diabetes. 26 In this sample, neither race nor ethnicity predicted DKA (P = .41), but Black/African Americans (n = 58, 30.53%) had the greatest rate of DKA, nearly four times greater than Asians (n = 5, 7.89%).
Patients with DKA required medical staff to have contact with them every 1 to 2 hours for blood glucose monitoring. This was difficult as minimizing contact with persons with COVID‐19 was paramount; thus, blood sugar testing was reduced to two to three times per day for noncritical type 2 diabetes and 2 hours for critically ill patients on insulin infusions. 27 In some institutions, continuous glucose monitors have been used to mitigate this. 28
4.3. Limitations
There are several limitations of this study. First, this study was retrospective in nature. We compared those who survived with those who did not without any propensity matching, which limits the comparability of the two groups. Also, there was no comparison with persons without diabetes. Second, diagnoses were based on ICD‐10 codes, as opposed to reviewing all lab values or imaging, which could have led to over‐ or underreporting of disease states. Third, the glycemic values used can potentially be erroneous as HbA1c and POC glucose values can be falsely elevated or lowered by comorbid conditions such as anemia or hypertriglyceridemia. 29 , 30 In addition, there are ethnic variations noted in persons of African descent in whom HbA1c values can be higher than in other populations. 29 Fourth, we were unable to obtain diabetes history indicators, such as duration of diabetes and medications used. We also were not able to obtain body mass index data as they were not recorded in the majority of the charts. Last, we only used the index admission and included those who were discharged by 1 June 2020. The limitation of using the index admission is that some of these patients were readmitted and may have died during the readmission visit. To avoid the potential of missing a death, we only included patients discharged by our cutoff date 1 June 2020. This would be only a minor limitation as very few patients were hospitalized with COVID‐19 in our health system after late May 2020.
5. CONCLUSIONS
This study adds to the literature by exploring the impact of variables such as age, race, gender, and comorbid conditions on the mortality and need for ventilator in patients with COVID‐19 and type 2 diabetes. In addition, we explored the effect of HbA1c on mortality. Surprisingly, HbA1c did not predict mortality, but as seen in previous studies, male gender, older age, and admission hyperglycemia were associated with increased mortality. Further studies need to be conducted prospectively in persons with diabetes and COVID‐19 as they are at increased risk of developing more severe illness from COVID‐19 requiring hospitalization and intubation.
DISCLOSURES
The authors do not have any financial disclosures to report, nor any conflicts of interest. Data were pulled and cleaned by Dr Qiu and Dr Yan. Data were analyzed by Dr Xu. The manuscript was prepared by Drs Myers, Kim, Zu, and Pekmezaris. This study was approved by our institutional review board. Informed consent was not required as patient‐specific data were not used.
ACKNOWLEDGEMENTS
We would like to thank our chairman Dr Thomas McGinn and the COVID‐19 Consortium led by Dr Karina Davidson for providing us with the support to pull and analyze the data. We also thank Dr Lubaina Presswala. No funding received.
Myers AK, Kim TS, Zhu X, Liu Y, Qiu M, Pekmezaris R. Predictors of mortality in a multiracial urban cohort of persons with type 2 diabetes and novel coronavirus 19 . Journal of Diabetes. 2021;13:430–438. 10.1111/1753-0407.13158
REFERENCES
- 1. Rubino F, Amiel SA, Zimmet P, et al. New‐onset diabetes in Covid‐19. N Engl J Med. 2020;383:789‐790. [DOI] [PMC free article] [PubMed] [Google Scholar]
- 2. Iacobellis G, Penaherrera CA, Bermudez LE, Mizrachi EB. Admission hyperglycemia and radiological findings of SARS‐CoV2 in patients with and without diabetes. Diabetes Res Clin Pract. 2020;164:108185. [DOI] [PMC free article] [PubMed] [Google Scholar]
- 3. Yang J‐K, Lin S‐S, Ji X‐J, Guo L‐M. Binding of SARS coronavirus to its receptor damages islets and causes acute diabetes. Acta Diabetol. 2010;47:193‐199. [DOI] [PMC free article] [PubMed] [Google Scholar]
- 4. Drucker DJ. Coronavirus infections and type 2 diabetes—shared pathways with therapeutic implications. Endocr Rev. 2020;41:457‐470. [DOI] [PMC free article] [PubMed] [Google Scholar]
- 5. Muniyappa R, Gubbi S. COVID‐19 pandemic, coronaviruses, and diabetes mellitus. Am J Physiol‐Endocrinol Metab. 2020;318:E736‐E741. [DOI] [PMC free article] [PubMed] [Google Scholar]
- 6. Wang S, Ma P, Zhang S, et al. Fasting blood glucose at admission is an independent predictor for 28‐day mortality in patients with COVID‐19 without previous diagnosis of diabetes: a multi‐Centre retrospective study. Diabetologia. 2020;63:2102‐2111. [DOI] [PMC free article] [PubMed] [Google Scholar]
- 7. Wu J, Huang J, Zhu G, et al. Elevation of blood glucose level predicts worse outcomes in hospitalized patients with COVID‐19: a retrospective cohort study. BMJ Open Diabetes Res Care. 2020;8:e001476. [DOI] [PMC free article] [PubMed] [Google Scholar]
- 8. Bode B, Garrett V, Messler J, et al. Glycemic characteristics and clinical outcomes of COVID‐19 patients hospitalized in the United States. J Diabetes Sci Technol. 2020;14:813‐821. [DOI] [PMC free article] [PubMed] [Google Scholar]
- 9. Hur K, Price CPE, Gray EL, et al. Factors associated with intubation and prolonged intubation in hospitalized patients with COVID‐19. Otolaryngol Head Neck Surg. 2020;163:170‐178. [DOI] [PMC free article] [PubMed] [Google Scholar]
- 10. Chen Y, Yang D, Cheng B, et al. Clinical characteristics and outcomes of patients with diabetes and COVID‐19 in association with glucose‐lowering medication. Diabetes Care. 2020;43(7):1399‐1407. [DOI] [PubMed] [Google Scholar]
- 11. Zhu L, She Z‐G, Cheng X, et al. Association of blood glucose control and outcomes in patients with COVID‐19 and pre‐existing type 2 diabetes. Cell Metab. 2020;31:1068‐1077. [DOI] [PMC free article] [PubMed] [Google Scholar]
- 12. Sequist TD. The disproportionate impact of Covid‐19 on communities of color. Nejm Catal Innov Care Deliv. 2020;1:4. [Google Scholar]
- 13. van Dorn A, Cooney RE, Sabin ML. COVID‐19 exacerbating inequalities in the US. Lancet. 2020;395:1243‐1244. [DOI] [PMC free article] [PubMed] [Google Scholar]
- 14. Shi Q, Zhang X, Jiang F, et al. Clinical characteristics and risk factors for mortality of COVID‐19 patients with diabetes in Wuhan, China: a two‐center, retrospective study. Diabetes Care. 2020;43(7):1382‐1391. [DOI] [PubMed] [Google Scholar]
- 15. Holman N, Knighton P, Kar P, et al. Risk factors for COVID‐19‐related mortality in people with type 1 and type 2 diabetes in England: a population‐based cohort study. Lancet Diabetes Endocrinol. 2020;8:823‐833. [DOI] [PMC free article] [PubMed] [Google Scholar]
- 16. American Diabetes Association . 15. Diabetes Care in the Hospital: standards of medical Care in Diabetes—2020. Diabetes Care. 2020;43(Supplement 1):S193‐S202. [DOI] [PubMed] [Google Scholar]
- 17. Centers for Disease Control Prevention (CDC) . National Diabetes Statistics Report 2014. Atlanta: Centers for Disease Control Prevention; 2014. http://www.cdc.gov/diabetes/data/statistics/2014statisticsreport.html. Accessed 9 August 2020. [Google Scholar]
- 18. Pasquel FJ, Gomez‐Huelgas R, Anzola I, et al. Predictive value of admission hemoglobin a 1c on inpatient glycemic control and response to insulin therapy in medicine and surgery patients with type 2 diabetes: table 1. Diabetes Care. 2015;38:e202‐e203. [DOI] [PMC free article] [PubMed] [Google Scholar]
- 19. Palaiodimos L, Kokkinidis DG, Li W, et al. Severe obesity, increasing age and male sex are independently associated with worse in‐hospital outcomes, and higher in‐hospital mortality, in a cohort of patients with COVID‐19 in the Bronx, New York. Metabolism. 2020;108:154262. [DOI] [PMC free article] [PubMed] [Google Scholar]
- 20. Zhou J, Tan J. Letter to the editor: diabetes patients with COVID‐19 need better blood glucose management in Wuhan, China. Metabolism. 2020;107:154216. [DOI] [PMC free article] [PubMed] [Google Scholar]
- 21. Mehta P, McAuley DF, Brown M, Sanchez E, Tattersall RS, Manson JJ. COVID‐19: consider cytokine storm syndromes and immunosuppression. Lancet. 2020;395:1033‐1034. [DOI] [PMC free article] [PubMed] [Google Scholar]
- 22. Benoit SR, Zhang Y, Geiss LS, Gregg EW, Albright A. Trends in diabetic ketoacidosis hospitalizations and in‐hospital mortality—United States, 2000–2014. Morb Mortal Wkly Rep. 2018;67:362‐365. [DOI] [PMC free article] [PubMed] [Google Scholar]
- 23. Armeni E, Aziz U, Qamar S, et al. Protracted ketonaemia in hyperglycaemic emergencies in COVID‐19: a retrospective case series. Lancet Diabetes Endocrinol. 2020;8:660‐663. [DOI] [PMC free article] [PubMed] [Google Scholar]
- 24. Li J, Wang X, Chen J, Zuo X, Zhang H, Deng A. COVID‐19 infection may cause ketosis and ketoacidosis. Diabetes Obes Metab. 2020;22(10):1935‐1941. [DOI] [PMC free article] [PubMed] [Google Scholar]
- 25. Smiley D, Chandra P, Umpierrez GE. Update on diagnosis, pathogenesis and management of ketosis‐prone type 2 diabetes mellitus. Diabetes Manag. 2011;1:589‐600. [DOI] [PMC free article] [PubMed] [Google Scholar]
- 26. Maldonado MR, Otiniano ME, Lee R, Rodriguez L, Balasubramanyam A. Characteristics of ketosis‐prone diabetes in a multiethnic indigent community. Ethn Dis. 2004;14:243‐249. [PubMed] [Google Scholar]
- 27. Zhou K, Al‐Jaghbeer MJ, Lansang MC. Hyperglycemia management in hospitalized patients with COVID‐19. Cleveland Clinic Journal of Medicine. 2020. 10.3949/ccjm.87a.ccc012. [DOI] [PubMed] [Google Scholar]
- 28. Shehav‐Zaltzman G, Segal G, Konvalina N, Tirosh A. Remote glucose monitoring of hospitalized, quarantined patients with diabetes and COVID‐19. Diabetes Care. 2020;43:e75‐e76. [DOI] [PMC free article] [PubMed] [Google Scholar]
- 29. Malkani S, Mordes JP. Implications of using hemoglobin A1C for diagnosing diabetes mellitus. Am J Med. 2011;124:395‐401. [DOI] [PMC free article] [PubMed] [Google Scholar]
- 30. Rebel A, Rice MA, Fahy BG. The accuracy of point‐of‐care glucose measurements. J Diabetes Sci Technol. 2012;6:396‐411. [DOI] [PMC free article] [PubMed] [Google Scholar]


