Abstract
This article summarises developments in the Australian economy in 2020. It describes the economic growth and labour market ramifications associated with COVID‐19, and the fiscal and monetary policies implemented to help counter its effects. COVID‐19 has resulted in considerable slack in an economy that was weak pre‐pandemic. While current policies are appropriately focused on stimulating demand and supporting employment, existing challenges such as weak growth in productivity, gross domestic product and real wages are also likely to remain relevant post‐pandemic.
1. Introduction
In March 2020, the Federal Government responded to the global COVID‐19 pandemic by closing the borders to people seeking to enter Australia and implementing a number of restrictions to limit contact between people domestically. Social distancing practices were introduced along with the closure of non‐essential businesses.
As these measures and the pandemic itself would invariably lead to income and job losses, the Government also introduced a range of fiscal policies, most notably the JobKeeper wage subsidy and the JobSeeker supplement schemes. The Reserve Bank of Australia (RBA) also moved swiftly, cutting its target rate twice in March, bringing the cash rate down from 0.75 per cent to a record low of 0.25 per cent as well as introducing a range of measures to support economic activity.
Despite the expansionary macroeconomic policies, the closure of international borders had immediate negative repercussions on the flow of overseas students and international tourism. The education sector responded by adopting online teaching, although it has still suffered severe income losses. The hospitality sector was heavily affected, both from the demise of tourism and the loss of domestic business due to closures. Job loss in this sector was a staggering 31.4 per cent between February and May (371,000 jobs).
In the first half of 2020, the unemployment rate rose from 5.2 per cent in March to a high of 7.4 per cent in June, but it would have been much higher without the rapid policy responses to support jobs (for example, Borland and Charlton (2020) estimated a counterfactual of around 10 per cent). Consumption expenditure also fell, by 1.3 and 12.5 per cent in the March and June quarters respectively. In all, growth in Gross Domestic Product (GDP) was negative in two consecutive quarters (−0.3 and −7.0 per cent), placing the economy officially in recession after a run of 29 years of continuous growth.
An economic recovery emerged in the second half of 2020, with GDP rebounding by 3.3 per cent in the September quarter, although it remained 3.8 per cent lower over the year. An important contributing factor was the 7.9 per cent increase in household consumption, although this heavily reflected the easing of COVID‐19 restrictions. Another sign of the recovery was that employment in October was 3.4 per cent higher than in June.
The rebound reflects the flattening of the coronavirus curve and the subsequent opening of the economy, together with the effects of stimulatory fiscal and monetary policies. The fiscal measures announced in the Federal Budget, handed down on 6 October, included further stimulatory measures, with the RBA also cutting the cash rate further to 0.1 per cent in November (in addition to introducing quantitative easing).
The outlook for the Australian economy in 2020–21 remains uncertain, with only moderate growth expected for output, household consumption and domestic final demand, given their recent falls (Table 1). Consumer inflation and wage growth are likely to continue to be weak.
Table 1.
Indicators of Australian Activity (%)
| 2021a | ||||
|---|---|---|---|---|
| 2020b | MI c | Lowd | Highd | |
| GDP | −3.0 | 3.2 | 1.6 | 4.7 |
| Consumption | −5.5 | 5.0 | 1.4 | 8.3 |
| Domestic final demand | −3.2 | 3.0 | ||
| Unemployment ratee | 7.0 | 6.8 | 5.9 | 8.8 |
| Employment | −1.0 | 2.0 | ||
| Wage cost index | 1.5 | 1.2 | 0.4 | 2.0 |
| Headline inflation | 0.8 | 1.2 | 0.7 | 2.1 |
| 90‐day bill ratee | 0.1 | 0.2 | 0.0 | 0.3 |
| 10‐year bond ratee | 0.9 | 1.1 | 0.6 | 1.9 |
Notes: (a)Year‐average growth forecasts. (b) Estimates.
(c) MI denotes Melbourne Institute.
(d) Based on published forecasts in Consensus, December 2020.
(e) As at end of year.
Source: Melbourne Institute and Consensus Forecasts.
This article is being made freely available through PubMed Central as part of the COVID-19 public health emergency response. It can be used for unrestricted research re-use and analysis in any form or by any means with acknowledgement of the original source, for the duration of the public health emergency.
Section 2 provides a brief summary of international developments while Section 3 summarises developments in the Australian economy. We describe the economic changes in jobs and growth in the first half of 2020, the policies implemented, and the rebound in labour markets, consumption and savings in the September quarter of 2020. The final section contains our concluding remarks.
2. International Influences
Global economic growth plummeted in the March quarter of 2020, with many countries implementing lockdowns and social distancing policies to combat the spread of the coronavirus. China recorded a 10 per cent fall in its GDP and more than 5 per cent falls were reported in Spain (−5.2), Italy (−5.5) and France (−5.9). Many countries also saw large contractions in GDP growth in the second quarter. The United States recorded a −9.0 per cent quarterly GDP growth, and large falls were reported in Italy (−13 per cent), Japan (−7.9 per cent) and France (−13.8 per cent).
Massive fiscal support schemes were implemented in many advanced economies to cushion the downturn in their domestic economic conditions. In the United States, the Federal Government implemented several rounds of fiscal stimulus and relief packages, worth about 13 per cent of GDP1; fiscal packages in Japan, Canada and Australia amounted to around 21, 16 and 14 per cent of GDP respectively (Figure 1). Further fiscal policy responses are likely in some nations.
Figure 1.
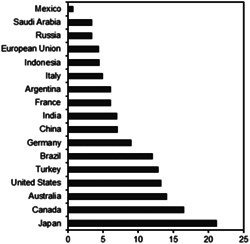
COVID‐19 Fiscal Stimulus Packages as a Share of GDP as of October 2020 (%) Source: Statista, IMF.
Meanwhile, the Chinese economy recorded a strong rebound, with 11.7 per cent quarterly growth in the second quarter. This was driven mainly by higher industrial production (Figure 2) and public investment. Growth in the September quarter was more modest, but overall in 2020 China is projected, by the International Monetary Fund (IMF), to grow by 1.9 per cent, making it likely to be the only major economy in the world to grow.
Figure 2.
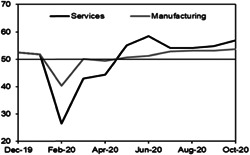
China Caixin PMI (Index) Note: 50 indicates no change. Sources: Caixin, IHS Markit.
The economic recovery in the United States gained momentum in the second half of 2020 (despite rising numbers of confirmed COVID‐19 cases) leading the IMF to project a smaller contraction in US GDP in 2020 in its October World Economic Outlook (WEO) (4.3 per cent), compared to the 8 per cent anticipated in the June WEO. Recovery in the Euro Area may be slower, largely due to the re‐escalation of the pandemic and smaller fiscal stimuli. The IMF projects Euro Area activity to fall by 8.3 per cent in 2020. For developing countries (excluding China), the anticipated decline in economic activity is around 3.3 per cent.
Overall, the IMF expects global growth in 2020 to be −4.4 per cent, the worst on record since World War II. In general, prospects for a global recovery are likely to be slow, uneven and fraught with uncertainty. The IMF forecasts the world economy to recover in 2021, growing by 5.2 per cent, but warns that an ‘unusually large’ degree of uncertainty exists (Table 2).
Table 2.
Forecasts of Real GDP Growth (%)
| World | Advanced Economies | Developing Economies | US | Euro | China | |
|---|---|---|---|---|---|---|
| 2015 | 3.5 | 2.3 | 4.3 | 2.9 | 2.1 | 6.9 |
| 2016 | 3.4 | 1.7 | 4.6 | 1.6 | 1.9 | 6.7 |
| 2017 | 3.8 | 2.5 | 4.8 | 2.4 | 2.4 | 6.8 |
| 2018 | 3.6 | 2.3 | 4.5 | 2.9 | 2.0 | 6.6 |
| 2019 | 2.8 | 1.7 | 3.7 | 2.2 | 1.3 | 6.1 |
| 2020a | −3.0 | −6.1 | −1.0 | −5.9 | −7.5 | 1.2 |
| 2020b | −4.9 | −8.0 | −3.0 | −8.0 | −10.2 | 1.0 |
| 2020 | −4.4 | −5.8 | −3.3 | −4.3 | −8.3 | 1.9 |
| 2021 | 5.2 | 3.9 | 6.0 | 3.1 | 5.2 | 8.2 |
Notes: (a) Denotes the forecasts made in April WEO.
(b) Denotes the forecasts made in June WEO Update.
Source: IMF, World Economic Outlook, October 2020. Shaded years indicate forecasts.
This article is being made freely available through PubMed Central as part of the COVID-19 public health emergency response. It can be used for unrestricted research re-use and analysis in any form or by any means with acknowledgement of the original source, for the duration of the public health emergency.
At this stage, it is difficult to judge the long‐term implications of COVID‐19, in particular, its implications for productivity growth. Dieppe (2020) discusses potential channels, both negative and positive. The negative channels include, for example, less capital deepening and international trade due to concerns about sustainability of the global value chain; and loss of human capital due to disruptions to schooling and labour markets. Alternatively, gains may be related to the adoption of new technologies, for example, automation and digital technologies; and online delivery of education.
2.1. Impact on Australia: Trade in Goods and Services
The closure of international borders caused a sharp fall in the movement of people (especially short‐term visitors, which includes tourists and international students) to Australia. According to the Australian Bureau of Statistics (ABS), there was a decrease of approximately 4.1 million short‐term visitor arrivals during April and September 2020 compared to the same period last year (a drop of 99.5 per cent, Figure 3).
Figure 3.
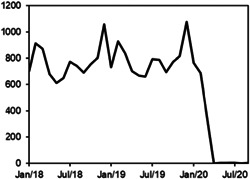
Short‐Term Visitors to Australia (‘000s) Source: Australian Bureau of Statistics.
Two sectors, tourism and higher education, were the most affected, as both rely on international visitors and students.2 In 2019, education exports contributed A$40 billion, which is more than 40 per cent of the total value of exports in services (ABS 2020). Tourism employed around one in 19 Australians in 2019 and contributed 3.1 per cent to Australiaʼs total GDP ($60.8 billion) in 2018–19 (DFAT 2020).
Given that international travel restrictions are likely to remain in place until late 2021, the magnitude of the economic loss for these two sectors will be highly correlated with the duration of cross‐border restrictions. Furthermore, the negative effects are likely to be compounded as there are strong negative repercussions for the rest of the domestic economy, including rising unemployment, weak consumption expenditure and housing demand (especially in the rental market).
Overall, Australia has been negatively affected by the decline in world trade for both goods and services. In the first half of 2020, global goods trade fell by a historically large 18.5 per cent over the year to June (WTO 2020). However, as revealed in the June quarter National Accounts, although Australian export volumes contracted by 11 per cent, imports fell by a greater amount, reflecting weak domestic demand. On balance, net exports contributed 2.5 percentage points to June quarter GDP growth. In the September quarter, although imports rebounded, export volumes continued to fall, reflecting ongoing travel bans and weaker demand for resources. As such, net exports subtracted 1.9 percentage points from the September quarter GDP growth.
2.2. Net Migration and Population Growth
The immediate economic burden of the sharp declines in net exports of services is, to a large extent, borne by sectors that are most exposed to international trade and the mobility of people (for example, tourists). However, the longer‐term implication of the pandemic is on population growth in Australia.
Compared to 2018–19, net overseas immigration is expected to fall by more than 30 per cent in 2019–20 and to turn negative (that is, net migrant departures) in 2020–21 and 2021–22 (Figure 4). This will have a direct impact on Australiaʼs population growth. The Parliamentary Budget Office (PBO) estimates population growth to slow from 1.2 per cent in 2019–20 to 0.2 per cent in 2020–21 and 0.4 per cent in 2021–22—the lowest growth on record for 100 years (PBO 2020b).
Figure 4.
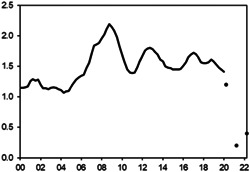
Australiaʼs Annual Population Growth Rate (at the End of Each Quarter, %) Source: Australian Bureau of Statistics (black dots are forecasts).
The drop in population growth will have significant impacts on the Australian economy mainly because Australiaʼs migration policy favours skilled working‐age migrants. Moreover, there is considerable evidence supporting the positive role of migrants in sustaining strong economic growth over the long term (Treasury and Department of Home Affairs 2018). The expected sharp contraction in net overseas migration will inevitably lead to a smaller working‐age population over the medium term. This, in turn, is likely to affect the participation rate, shift the age structure of the population, and potentially drag down Australiaʼs GDP growth for many years.
3. GDP, Domestic Demand and Consumption
COVID‐19, lockdowns and the closure of borders have had a massive negative pervasive impact on Australiaʼs economic performance in 2020. Overall, GDP plummeted by a record 7 per cent in the June quarter following a small fall of 0.3 per cent in the March quarter. Australia entered its first technical recession since 1991 (Figure 5).
Figure 5.
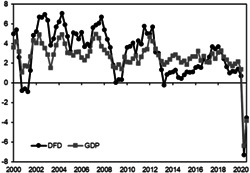
Real GDP and Domestic Final Demand Growth (Year‐Ended, %) Source: Australian Bureau of Statistics.
Consumption also plummeted in the June quarter, with quarterly growth falling by nearly 13 per cent. However, with the relaxation of social distancing measures, consumption rebounded partially in the September 2020 quarter (+7.9 per cent). In annual terms, consumption growth was negative in 2019–20, falling by 2.6 per cent relative to the previous fiscal year (Figure 6).
Figure 6.
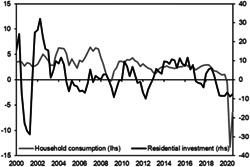
Real Household Consumption and Residential Investment Growths (Year‐Ended, %) Source: Australian Bureau of Statistics.
It is important to note that, unlike the Global Financial Crisis (GFC), the pandemic hit Australia during a period of already weak economic conditions. GDP growth was below trend, with household consumption growth below 2 per cent for every quarter from March 2019 to June 2020.
The inflation rate was below the 2–3 per cent target band, with real wage growth below 1 per cent, and little evidence of price and wage inflationary pressures. Also, while the unemployment rate was hovering below 6 per cent, underemployment was approximately 8.5 per cent, indicating slack in the economy.
3.1. Changes in Labour Markets
The COVID‐19 pandemic had a significant adverse impact on Australian labour markets over the course of 2020. This impact was reflected in two phases—the collapse in labour markets during the lockdown from late March to the end of May, then the slow improvements in re‐hiring and job creation as restrictions were relaxed.
Following the national lockdown, which began in late March, the unemployment rate jumped from 5.2 per cent in March to 6.4 per cent in April; it hit a high of 7.5 per cent in July. The participation rate fell from 65.9 per cent in March to 63.6 per cent in April, and bottomed out at 62.7 per cent in May (Figure 7).
Figure 7.
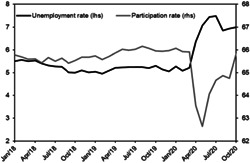
Unemployment and Participation Rates (%) Source: Australian Bureau of Statistics.
Between March and May, the economy lost a net of 871,000 jobs and year‐ended employment growth fell from 1.7 per cent in March to −3.3 per cent in April and −5.7 per cent in May, while the under‐utilisation rate rose from 14.0 per cent in March to 20.2 per cent in May. The corresponding change in aggregate monthly hours worked was a fall of 10.4 per cent; equivalently a loss of around 185 million hours worked (in April and May).
As most of the country emerged from the lockdown in June, a net of 648,500 jobs were added between June and October (recovering nearly 75 per cent of the job loss between March and May), increasing monthly hours worked by 7.4 per cent. Year‐ended employment growth improved to –1.0 per cent in October and the participation rate recovered to its pre‐pandemic level of 65.8 per cent. The unemployment rate declined from 7.5 per cent in July to 6.8 per cent in August, but has since ticked up to 7.0 per cent in October due to a strong increase in the participation rate. Meanwhile, the utilisation rate has gradually declined from its peak of 20.2 per cent in May to 17.4 per cent in October.
3.2. A Very Different Type of Recession
The impact of the COVID‐19 health shock, and the resultant pandemic‐induced recession on Australian labour markets is markedly different from the impacts associated with the two previous major downturns: the 1990s recession and the GFC. Figure 8 plots the evolution of the employment‐to‐population ratio, a useful summary statistic of the state of the labour market. For ease of comparison, the ratio is normalised to one in the month prior to the downturns (namely, December 1990, September 2008 and March 2020 respectively).
Figure 8.
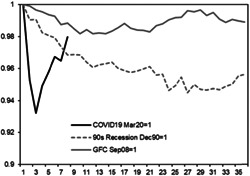
Employment to Population Ratio during Three Major Downturns (Index) Source: Australian Bureau of Statistics, authors’ calculations.
During the 1990s recession (triggered in part by the collapse in asset prices following booms fuelled by excessive borrowings in the 1980s; see Macfarlane 2006), the employment‐to‐population ratio declined gradually, and it took nearly three years for the ratio to flatten out and rise slightly. At its trough, the ratio was 5 per cent below the pre‐1990s recession level.
In contrast, despite being the biggest global economic shock since the Great Crash and the Great Depression in the 1930s, the GFC did not have a strong negative and sustained impact on Australian labour markets. The employment‐to‐population ratio fell to a low of just 2 per cent below its pre‐GFC level.
This recent downturn resulted in a sharp fall in the employment‐to‐population ratio in the first few months following the onset of the COVID‐19 pandemic. The ratio fell sharply to nearly 7 per cent below the pre‐pandemic level but rebounded sharply and quickly in the following months. Economic policies, such as the JobKeeper scheme, have played an important role in mitigating the downturn, and in facilitating the rebound.
3.3. Impacts Across Age Groups, Industries
Not surprisingly, the industries relying crucially on in‐person contact and unrestricted movement, that is, hospitality and transport, were the worst hit during the pandemic (Figure 9). Specifically, Accommodation & Food Services lost a net of 277,000 jobs between February and May, followed by Transport, Postal & Warehousing (98,000 jobs), Arts & Recreation Services (93,000 jobs) and Retail Trade (83,000 jobs). These job losses translated into declines in hours worked, over the same period; for example, hours worked in Accommodation & Food Services was almost halved (an equivalent loss of 11 million hours worked per week).
Figure 9.
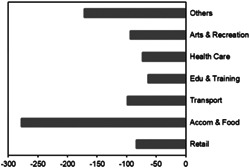
Feb–May Job Losses by Industry (‘000s) Source: Australian Bureau of Statistics.
The impact of job losses was not evenly distributed across the age groups. The youngest (15–24) age group suffered the biggest loss of 335,000 jobs between February and May (a fall of 17.1 per cent in employed persons), as these individuals were mainly employed in the hospitality and retail sectors. Although this age group has always had the highest unemployment rate across the age groups, its unemployment rate rose substantially by 4.7 percentage points (from 11.6 per cent in March to 16.3 per cent in July), while the corresponding rise in the national unemployment rate was 2.3 percentage points (from 5.2 to 7.5 per cent).
The pandemic also affected female employees more than males. Between March and May, a net of 470,000 female employees lost their jobs, compared to a net loss of 401,000 of male employees. Over the same period, the female participation rate fell by 3.6 percentage points to 57.5 per cent, while the male participation rate fell by 2.9 percentage points to 68.0 per cent.
3.4. Fiscal and Monetary Policies
Both fiscal and monetary policies acted quickly to support demand. Prior to the Budget, the Treasurer announced a change in fiscal strategy, namely that there would be no attempt to stabilise the debt‐to‐GDP ratio until the unemployment rate was ‘comfortably beneath 6 per centʼ, when there would be a return to focusing on fiscal repair (Frydenberg 2020a). As the RBA now estimates the Non‐Accelerating Inflation Rate of Unemployment (NAIRU) to be around 4.75 per cent (see Ellis 2019 and related references for more discussion about the computation of this estimate), this would be undertaking a fiscal contraction when slack still exists in the economy.
The first fiscal response to COVID‐19 was announced in mid‐March, with further announcements later that month. In brief, the key components included:
the JobKeeper scheme—a wage subsidy so employers may maintain their employees despite adverse impacts of the crisis;
a Coronavirus Supplement to those receiving a wide range of welfare payments (for example, JobSeeker, which replaced Newstart, the unemployment benefits scheme). Eligibility criteria and assets tests for some payments were relaxed;
a sequence of four lump‐sum support payments to those receiving income support or holding concessions cards. The eligibility for these differs across the payments (see Treasury 2020);
allowing individuals to make early withdrawals from their superannuation;
accelerated depreciation deductions to encourage business investment; and
a payment to small and medium‐sized firms to help cash flow.
On 21 July, the Government announced how the JobSeeker supplement, which benefited around 2.2 million eligible Australians, will be phased out (Treasury 2020).3 Overall, Treasury estimates the JobKeeper scheme to support 1.4 million workers in the December 2020 quarter and 1.0 million workers in the March 2021 quarter (Frydenberg 2020b). By October 2020, the JobKeeper payments totalled around A$60 billion—the largest fiscal and labour market intervention in Australiaʼs history.
Notwithstanding the cost of this, the Federal Budget, handed down on 6 October, included more schemes to aid recovery of the labour markets and to boost demand:
extending JobKeeper, and changing the eligibility criteria;
a JobMaker employment subsidy to encourage firms to hire new employees under 35 years old;
a wage subsidy to encourage apprenticeships;
further increased investment deductibility;
bringing forward previously announced personal tax cuts;
allowing some businesses to claim losses against prior years, to help improve cash flow;
increased infrastructure investment, particularly ‘shovel ready’ projects;
reversing previously announced cuts to research and development tax incentives; and,
grants to encourage ‘modern manufacturing’.
Labour market conditions in Australia might have been worse had it not been for the schemes to support and keep people at work (see, for example, Bishop and Day 2020). The Hiring Credit, JobTrainer Fund and Supporting Apprentices and Trainees are specifically to provide direct support for employers, young workers and job seekers.4
It is clear that the Government is providing an extremely large stimulus to the economy. The 2020–21 Federal Budget anticipated that the underlying cash deficit would reach 11 per cent of GDP, which is much larger than what occurred in previous recessions.
The large deficit results in a substantial increase in net debt. It is expected to increase from 24.8 per cent in 2019‐20 and peak at around 43.8 per cent in 2023–24 (which is low by international standards) (Figure 10). This large increase in indebtedness is appropriate at a time when Australia has faced its sharpest decline in economic activity in decades. Moreover, servicing Australiaʼs debt in the near to medium term will be assisted by the extraordinarily low level of interest rates.
Figure 10.
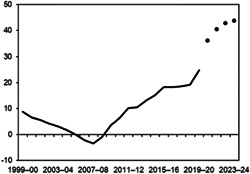
Australian Government Net Debt as a Share of GDP (%) Source: Parliamentary Budget Office PBO (2020a) (black dots are estimates).
3.5. Monetary Policy
Monetary policy also responded rapidly to COVID‐19. However, an important aspect to note is that the initial conditions were distinctly different to the GFC. Prior to the GFC the economy was operating above capacity, inflation was well above target and the cash rate stood at 7.25 per cent. In contrast, prior to COVID‐19, the economy was weak. As a result, the RBA had commenced an easing cycle in mid‐2019.
A further complicating factor is that the RBA estimates that, since 2007, the neutral rate, namely the interest rate which is neither expansionary nor contractionary, has shifted down (McCririck and Rees 2017; Guttmann, Lason and Rickards 2020). This means there was limited room to adopt further conventional monetary policy at the onset of COVID‐19 as the cash rate was already at a historic low of 0.5 per cent. Thus, in mid‐March, at an out‐of‐cycle meeting, the RBA Governor (Lowe 2020a) announced a four‐pronged response:
the cash rate was eased to 0.25 per cent and forward guidance that it would not be raised until ‘… progress is being made …’ in returning inflation to target and achieving full employment;
targeting the 3‐year government bond yield to be 0.25 per cent through the secondary market (that is, not directly from the Government);
a term funding facility (TFF) for the banking system, so as to promote lending to small and medium‐sized business; and
paying 10 basis points on exchange settlement balances (accounts that banks have at the RBA), so as to help facilitate some of the other policies.
This response was rapid and has resulted in the Reserve Bankʼs balance sheet dramatically increasing in size. These policies were maintained until the September meeting, when the Term Funding scheme was expanded.
The aim of the forward guidance is to encourage expenditure sooner based on the expectations that interest rates will remain low for longer. The stance of policy was subsequently clarified by the Governor of the RBA in October (Lowe 2020b), which made the forward guidance more explicit, by stating that [the bank board] did not expect that the cash rate would be tightened for at least 3 years.5 This approach has subsequently been maintained.
In November the Governor announced a second major package of policies (Lowe 2020c). These included:
reducing the cash rate to 0.1 per cent;
reducing the target for 3‐year government bond yields to 0.1 per cent;
reducing the interest rate on the TFF; and
a $100 billion purchase of longer maturity government bonds over the next six months, namely the adoption of quantitative easing, by fixing the quantity purchased rather than targeting the price (interest rate).
In summary, the RBA has dramatically changed how it conducts monetary policy, to be more stimulatory in response to COVID‐19. However, with its conventional interest rate tool exhausted and considerable unconventional policies enacted, fiscal policy has taken on a central role.6
3.6. Expectations of Job Recovery
In general, labour market conditions in Australia have improved since May, though the pace of improvement has slowed since August: the employment to population ratio lifted moderately by 0.6 percentage points between August and October, after an increase of 2.4 percentage points between May and August. Labour market conditions are expected to improve further over the course of 2021 as economic activity recovers and state borders open.
It is pertinent to note that labour force participation was likely supported by the Child Care Subsidy for the early education and childcare sectors. The measures include the Relief Package (April–July), Transition Package (July–September) and Recovery Package (September–January). (https://www.dese.gov.au/covid-19/childcare). Between May and October, the female participation rate rose by 3.4 percentage points while the male participation rate increased by 2.9 percentage points. Furthermore, a net of 343,800 female workers were hired during the period compared to a net of 304,600 male workers.
Figure 11 plots the Westpac‐Melbourne Institute Consumer Unemployment Expectations Indexes in the major states, with a higher (lower) value indicating rising pessimism (optimism) among consumers about future job prospects. The Indexes peaked in April and in August, coinciding with the first wave of infections across the country and the second wave of infections in Victoria. However, the Indexes have returned to their pre‐pandemic levels, suggesting that consumers across the major states are more optimistic about labour market conditions in 2021 than they were in April or August 2020.
Figure 11.
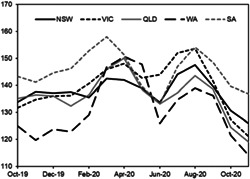
Unemployment Expectation by State (3‐month Moving Average, Index) Source: Melbourne Institute.
3.7. Consumption, Wages and Savings
Consumption rebounded sharply in the September quarter, although this is reflective of the easing of COVID‐19 restrictions across much of Australia (Melbourne being the exception).
Looking forward, the path of consumption growth will depend critically on the growth of real wages and the role of precautionary savings. Wage growth has been weak for several years, deteriorating further in 2020. In 2019–20, wages grew by 2.1 per cent, down on an already weak growth rate of 2.3 per cent in 2018–19. In September 2020, private sector annual wage growth was only 1.2 per cent (at its lowest rate in over 20 years) (Figure 12).
Figure 12.
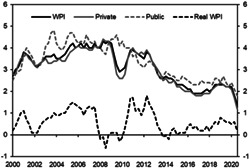
Wage Price Index Growth (Year‐Ended, %) Source: Australian Bureau of Statistics.
In line with weak wages growth, inflation has persistently failed to meet the lower bound of the Reserve Bankʼs 2–3 per cent target band. Although some of the weakness in inflation during 2020 was the result of one‐off factors (for example, the presence of negative June quarter inflation due largely to COVID‐19 policy changes regarding childcare costs), the presence of low growth is a longer‐term feature of the inflation data (as is the presence of low wages growth) observed well before COVID‐19.
Overall, both inflation and wage growth are likely to remain weak over the next few years. In the presence of high levels of unemployment, low wage growth may persist, or even deteriorate further, notwithstanding packages such as JobKeeper and JobMaker, thereby posing a significant risk for consumption growth prospects going forward.
Meanwhile, the savings rate spiked to 22 per cent during the June quarter when household consumption fell by more than 13 per cent from its March value. The results suggest that the combined presence of lockdowns and social distancing reduced consumption opportunities, likely yielding an artificial increase in the savings rate (which fell to 18.9 per cent in the September quarter).
Figure 13 shows that, in fiscal year terms, the savings ratio is currently at levels observed in 2012 following the GFC (although the spike observed in June 2020 is the highest on record). The period of declining savings rates prior to the recent spike may be associated with continued weakness in wages growth and possibly influenced by the presence of relatively high taxes eroding already small income (wage) gains.
Figure 13.
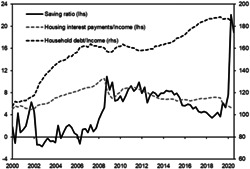
Household Saving Ratio and Debt to Income Ratio (%) Source: Australian Bureau of Statistics.
Despite the Federal Government bringing forward promised tax cuts (with the income thresholds for the 19 per cent and 32.5 per cent marginal tax rates rising to $45,000 and $120,000 respectively), the fundamental problem of low wage growth persists. Accordingly, in the presence of low interest rates and the continued absence of any substantial wage growth, savings rates may fall from their currently high values, notwithstanding any precautionary savings that will likely be taking place now as a result of the uncertainty around the effects of COVID‐19.
With falling interest rates, in 2020 we also observed a reversal of the steady increase in the ratio of housing interest payments to disposable income. Housing payment obligations fell heavily across 2019–20, with the ratio of housing interest payments to disposable income averaging only 5.8. At the same time, weak residential investment and falling (albeit moderately) house prices are associated with a fall in the household debt to income ratio, which fell from approximately 187 in March 2020 to 185 in June 2020. Together with the provision of temporary mortgage repayment deferrals by most Australian lenders, this mitigates some of the financial stress associated with the repayment of household debt.
Unsurprisingly, given the presence of lockdown conditions in 2020, annual growth in residential investment declined by 9 per cent in 2019–20. As with weaker household consumption, however, the presence of weaker residential investment is not entirely attributable to COVID‐19. Despite the presence of low borrowing costs, annual growth in residential investment has been negative for every quarter since March 2019. Furthermore, expectations play an important role in housing markets. Consequently, construction activity tends to be volatile and sensitive to uncertainty and may not rebound by much in 2021.
4. Concluding Remarks
Australia is a small open economy and is materially affected by developments abroad—through trade in goods and services, financial factors and the international movement of people. COVID‐19, lockdowns and the closure of borders have had a massive negative and pervasive impact on Australiaʼs economic performance in 2020. Australia entered its first technical recession since 1991, and the underemployment rate soared to 7.5 per cent.
The economy rebounded in the September quarter, partly as a natural consequence of the easing of restrictions, but also due to the quick implementation of monetary and fiscal policies to keep people employed and to stimulate demand. Monetary policy has included many unconventional instruments and the RBA has been explicit about operating to maintain low interest rates for several years. Fiscal policy has been multi‐faceted and has included the JobKeeper/JobSeeker boost/JobMaker schemes along with other stimulatory packages. The JobKeeper package, in particular, supported households while preserving employer–employee matches (position‐specific skills) that may otherwise have been lost, thereby helping to prevent the scarring of the labour force.
Although Australia appears to be on the road to recovery, the extent of spare capacity that exists in the economy—as demonstrated by the elevated unemployment rate—is large. While the fall and rebound in employment were sharp, the pace of the recovery may be slow, uneven and prolonged.
There are several further challenges facing Australia. First, while vaccines have been developed and distribution has commenced in the United Kingdom, it is uncertain when and how it will be distributed elsewhere in the world. The recurrence of COVID‐19 in many countries, the reimposition of social distancing and business hibernation suggest that the direct impacts of this pandemic may be around until mid‐ to late 2021. Accordingly, while the IMF forecasts that the world economy will recover and grow by 5.2 per cent in 2021, this comes with a warning that the uncertainty surrounding the projection is ‘unusually large’. It also means that Australian borders are likely to remain shut well into 2021, and therefore the extremely challenging conditions for the tourism and higher education sectors will likely continue.
Second, the lower population growth for Australia resulting from COVID‐19 may well persist for a considerable period. This has serious implications for the economic outlook as it will simultaneously reduce growth in demand for housing and goods and services, as well as growth in the labour force (potentially of skilled working‐age migrants). This reinforces the importance of boosting participation in the labour force.
Third, growth in household consumption, which accounts for 60 per cent of GDP, is critical, given that the considerable economic uncertainty which exists may dampen any upswing in business investment. While consumption may rebound in the near term, in the medium term its growth is likely to be hampered by lacklustre growth in real wages. One factor contributing to this has been Australiaʼs tepid productivity performance.
Fourth, political and trade relations with China have deteriorated. This presents a material downside risk as mainland China is Australiaʼs most important export destination—in 2019 it accounted for around 38 and 19 per cent of Australiaʼs merchandise goods and service exports respectively.7
COVID‐19 has resulted in considerable slack in the economy and current macroeconomic policies are appropriately focused on stimulating demand and supporting employment. However, the economy was weak pre‐pandemic, and some of the medium‐term challenges that it faced, such as weak productivity growth, are likely to also be relevant post‐pandemic. As the recovery progresses, these issues also deserve attention to ensure we ultimately return to a stronger economy.
Endnotes
Among them, the largest one was the Coronavirus Aid, Relief and Economic Security Act (“CARES Act”), which was estimated at USD2.3 trillion and aims to provide tax rebates, unemployment benefits, food to individuals, and loans and guarantees to businesses affected.
In June 2020, the number of visitors was estimated to have fallen by 28 per cent, which corresponds to a 25 per cent (approximately A$11 billion) decline in tourism‐related spending in Australia (Tourism Research Australia: International Visitors Survey 2020). The overall decline was expected to be 60–80 per cent in 2020. In April–August, there was a decrease of about 252,000 international students, equivalent to 40 per cent of the total number of international students last year.
For example, for a single person with no children, the Coronavirus Supplement was $275 per week from March, it was cut to $125 in September and it will be cut to $75 per week in December, expiring at the end of March 2021. JobKeeper will run until late March 2021.
Treasury estimates that the Supporting Apprentice and Trainees wage subsidy scheme (worth A$2.8 billion) will enable businesses to keep around an estimated 180,000 apprentices and trainees; that the JobMaker Hiring Credit will support 450,000 young Australians to find jobs and the JobTrainer Fund will help young job‐seekers to access an estimated 340,000 places to improve their skills (Treasury 2020).
The explicit statement about duration in forward guidance is in line with research showing that, during the GFC, providing an explicit time frame in the forward guidance by the United States Federal Reserve had a marked impact on the survey‐based measures of interest rate expectations relative to more vague statements (see Swanson and Williams 2014).
The exchange rate is another important channel to effect change, but it actually appreciated, in part reflecting the increase in the terms of trade, which rose by 0.7 per cent in the September quarter to be 1.5 per cent above their March quarter value. The recent surge in iron ore prices, if sustained, will support a further improvement in the terms of trade.
For comparison, the United States accounted for 3.9 and 10 per cent of goods and service exports respectively.
References
- ABS 2020, ‘International trade: Supplementary information’, Calendar Year, viewed November 2020, <https://www.abs.gov.au/statistics/economy/international-trade/international-trade-supplementary-information-calendar-year/latest-release>
- Bishop, J. and Day, I. 2020, ‘How many jobs did jobkeepers keep?’ RBA Research Discussion Paper RDP 2020‐07.
- Borland, J. and Charlton, A. 2020, ‘The Australian labour market and early impact of COVID‐19: An assessment’, The Australian Economic Review, vol. 53, no. 3, pp. 297–324. [Google Scholar]
- Dieppe, A. ed, 2020, Global Productivity: Trends, Drivers, and Policies, World Bank Group, viewed November 2020, <https://www.worldbank.org/en/research/publication/global-productivity>
- DFAT 2020, International Tourism Engagement, viewed 10 November 2020, <https://www.dfat.gov.au/trade/services-and-digital-trade/international-tourism-engagement>
- Ellis, L. 2019, ‘Watching the invisibles’, 2019 Freebairn lecture, University of Melbourne, viewed November 2019, <https://www.rba.gov.au/speeches/2019/sp-ag-2019-06-12-2.html>
- Frydenberg, J. 2020a, ‘Fiscal strategy update’, speech to the Australian Chamber of Commerce and Industry, Canberra, viewed November 2020. <https://ministers.treasury.gov.au/ministers/josh-frydenberg-2018/speeches/speech-australian-chamber-commerce-and-industry-canberra>
- Frydenberg, J. 2020b, ‘JobKeeper 2.0 only right’, Opinion piece, viewed November 2020. <https://joshfrydenberg.com.au/latest-news/jobkeeper-2-0-only-right/>
- Guttmann, R. , Lawson, D. and Rickards, P. 2020, ‘The economic effects of low interest rates and unconventional monetary policy’, RBA Bulletin, September.
- Lowe, P. 2020a, Statement by the Governor, Phillip Lowe: Monetary Policy Decision, viewed March 2020, <https://www.rba.gov.au/media-releases/2020/mr-20-08.html>
- Lowe, P. 2020b, ‘The recovery from a uneven recession’, address to Citi's XII Annual Australia and New Zealand Investment Conference, 15 October, viewed November 2020. <https://www.rba.gov.au/speeches/2020/sp-gov-2020-10-15.html>
- Lowe, P. 2020c, Statement by the Governor, Phillip Lowe: Monetary Policy Decision, viewed November 2020, <https://www.rba.gov.au/media‐releases/2020/mr‐20‐28.html>
- Macfarlane, I. 2006, The Boyer Lectures 2006, The Search for Stability. Sydney, ABC Books. [Google Scholar]
- McCririck, R. and Rees, D. 2017, The Neutral Interest Rate, Reserve Bank of Australia, Bulletin September Quarter 2017, https://rba.gov.au/publications/bulletin/2017/sep/pdf/bu‐0917‐reserve‐bank‐bulletin.pdf#page=12.
- Parliamentary Budget Office (PBO) 2020a, 2020–21 Budget Snapshot, viewed November 2020, <https://www.aph.gov.au/About_Parliament/Parliamentary_Departments/Parliamentary_Budget_Office/Publications/Chart_packs/2020-21_Budget_Snapshot>
- Parliamentary Budget Office (PBO) 2020b, ‘Budget review 2020–21’, Research Paper Series, 2020–21, October.
- Tourism Research Australia 2020, International Visitors Survey Results. https://www.tra.gov.au/International/International‐tourism‐results/overview
- Swanson, E. T. and Williams, J. C. 2014, ‘Measuring the effect of the zero lower bound on medium‐ and longer‐term interest rates’’, American Economic Review, American Economic Association, vol. 104, no. 10, pp. 3154–85. [Google Scholar]
- Treasury 2020, ‘Economic recovery plan for Australia: Covid19 response – supporting Australians through the crisis’, Budget 2020–2021. <https://budget.gov.au/2020‐21/content/download/glossy_covid_19.pdf>
- Treasury and Department of Home Affairs 2018, Shaping A Nation: Population Growth and Immigration Over Time, Treasury Research Institute External and Joint Papers, <https://research.treasury.gov.au/external‐paper/shaping‐a‐nation>
- WTO 2020, Trade Falls Steeply in First Half of 2020, viewed November 2020, <https://www.wto.org/english/news_e/pres20_e/pr858_e.htm>


