Abstract
Data on excess deaths in Russia in 2020 paint a much bleaker picture of the Covid-19 death toll than the official daily updated number, argues Dmitry Kobak


In the dashboards that update each day with the cumulative total of Covid-19 cases and deaths across different countries, Russia appears to have fared less poorly than many of its European neighbours and other large nations. At the time of writing (1 January 2021), Russia reports 57,600 deaths (all numbers in the text have been rounded), equivalent to 0.04% of the country's population – far smaller a proportion than in many badly hit countries such as Peru (0.12%), Spain (0.11%), the UK (0.11%), and USA (0.11%). But, in this case, appearances are deceptive.
Besides this daily updated number of Covid-19 deaths, which is included in all international summaries, Russia publishes monthly reports on population dynamics, including the number of Covid-related deaths. These monthly reports appear with a lag of several weeks, and so the last available release at the time of writing covers the month of November. If we add up the monthly summaries from April to November, we see that Russia has had 58,900 deaths from confirmed Covid-19, 12,000 deaths from suspected Covid-19, 11,300 deaths influenced by Covid-19, and 33,800 deaths from unrelated causes in people diagnosed with Covid-19. Based on these numbers, it is 116,000 deaths that should be categorised as Covid-related according to World Health Organization (WHO) guidelines (which recommend counting all deaths in “probable or confirmed” Covid-19 cases, “unless there is a clear alternative cause of death that cannot be related to Covid disease (e.g. trauma)”; bit.ly/34k5P3g). Yet, as of the end of November, Russia's reported death count for Covid-19 in the international dashboards was only 40,500, meaning that the actual number of Covid-related deaths, according to the WHO definition, was almost three times as large.
Russia, of course, is not the only country that has several different ways of counting Covid-related deaths (bit.ly/3p0ILyn). For example, at the time of writing, the UK reports 74,100 deaths through the daily updated numbers, but there are 82,600 deaths “with Covid-19 on the death certificate” (bit.ly/38e5foN). The difference between these two numbers is, however, much smaller than what we see in Russia.
Worse still, Russia's 116,000 Covid-related deaths may not be a reliable estimate of mortality from this disease. It is well understood that the number of confirmed cases cannot be meaningfully compared between countries and even across time because it strongly depends on test availability and testing policy. The same is true for the number of deaths, albeit perhaps to a lesser extent: some Covid-19 deaths may go undiagnosed and unreported due to the shortage of tests, or possibly for other reasons as well. An emerging academic consensus is that the most objective way to compare death toll in different countries is via excess mortality.1–3
A grim result
Excess mortality refers to the number of deaths from all causes that exceeds the prepandemic average. In Russia, the number of deaths from all causes is announced in the same monthly releases in which the different types of Covid-related deaths are reported.
Computing excess mortality in Russia from April to November (see “Estimating excess mortality”, page 19, for details) yields a grim result of 264,100 excess deaths (95% interval: [232,000, 296,200]) – see Figure 1. The yearly number of deaths in Russia has been monotonically decreasing over the last decade, and our estimate accounts for that by projecting the linear yearly trend from 2015–2019 into 2020, using that as a baseline to measure the excess mortality; predictive uncertainty gives the standard error. Alternatively, simple subtraction of 2019 deaths from 2020 deaths yields 242,600 excess deaths, while subtraction of the 2017–2019 average yields 230,800 excess deaths. Here we use 264,100 as the most reliable point estimate of excess deaths, meaning that our estimate of excess mortality is 6.5 times as large as the 40,500 deaths reported in the international dashboards during the same period. This estimate of excess mortality from April to November corresponds to 0.18% of the country's population.
Figure 1.
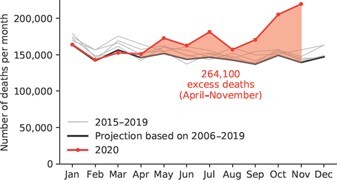
Number of monthly deaths in 2015–2019 (grey lines), projected number of deaths for 2020 based on the previous years (black line), and the actual number of deaths in 2020 (red line). The difference between the black and the red curves gives the excess morality (red shading).
Can excess mortality be taken as an estimate of the true Covid-19 mortality in Russia? Some say that it cannot, arguing that lockdown measures that were introduced in most Russian regions at the end of March may have decreased the baseline mortality from causes such as violence or traffic accidents, so the true Covid-19 mortality might be greater than the excess mortality. Or perhaps lockdown measures increased the baseline mortality due to people's lack of exercise, or through causes related to economic hardship, or because more people died from chronic conditions as routine treatments were postponed or delayed, so the true Covid-19 mortality might be lower than the excess mortality. Either scenario seems plausible. However, comparisons of mortality data between Russia's regions strongly suggest that none of these possible lockdown-related reasons had a noticeable effect on excess mortality.
All mortality figures, including those released monthly, are available for each of the 85 Russian federal regions. By the end of November, excess mortality was above zero in every one of them. Monthly data clearly show the wave of the epidemic as it propagates through the country (see Figure 2 and 2, page 18). The epidemic started in Moscow, St. Petersburg, and the North Caucasus (Dagestan and Chechnya), where overall mortality increased over the baseline by more than 25% in May. Many neighbouring regions (such as Tver Oblast, Kursk Oblast, and Vladimir Oblast) saw similar increases in mortality in June. Regions in the Ural area (such as Sverdlovsk Oblast, Chelyabinsk Oblast, and Bashkortostan) followed suit in July. Regions in Siberia (such as Novosibirsk Oblast, Kemerovo Oblast, and Altai Krai) first saw increases in mortality of more than 25% in October, and regions in the far east (such as Khabarovsk Krai and Primorsky Krai) saw the same in November.
Figure 2.
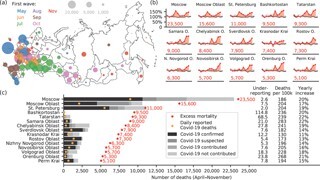
(a) Excess mortality (April to November 2020) in each of the 85 Russian federal regions. The area of each bubble corresponds to the number of excess deaths. The colour corresponds to the month when excess mortality exceeded the baseline by more than 25% for the first time (see legend). See also an animation and further figures at github.com/dkobak/excess-mortality. (b) Time series of excess mortality in the 15 regions with the highest overall excess mortality. (c) Number of Covid-19 deaths (April to November 2020) for the same 15 regions as in (b) measured in six different ways: excess mortality (red dots), daily reported Covid-19 deaths (orange dots), and four categories of monthly reported Covid-related deaths (shades of grey). Columns on the right: Underreporting = ratio of excess mortality to the daily reported deaths; Deaths per 100k = number of excess deaths per 100,000 population; Yearly increase = increase in mortality relative to baseline value for the entire 2020. Among the regions not shown here, the largest yearly increases were in Chechnya (37%) and Dagestan (30%).
As stated previously, lockdown measures were introduced in most regions at the same time at the end of March (bit.ly/34lMYFa), and these ran during April and May. This means that many federal regions implemented, and eventually lifted, a strict lockdown regime long before the epidemic reached them. In such regions, overall mortality was mostly unaffected during lockdown: it neither went up nor down, and excess mortality fluctuated around zero. Bashkortostan, for example, showed near zero excess mortality throughout the first half of the year, including the lockdown months of April and May, until a sudden sharp rise in July. This suggests that the lockdown measures on their own, without a local Covid-19 outbreak, did not noticeably influence mortality in Russia.
To assess the contribution that non-Covid causes may have made to excess mortality during an epidemic outbreak, we turn to Moscow and St. Petersburg, two regions with arguably the most reliable reporting of Covid-19 mortality. In both cases, excess mortality is very close to the total Covid-related mortality from the monthly reports (Figure 2). This suggests that excess mortality can be almost entirely explained by Covid-19 deaths. Mortality from other, non-Covid-related reasons may have also increased – for example, due to the lack of available medical personnel – but the data from these two regions suggest that this had only a minor effect compared to the Covid-related mortality.
If this is the case in Moscow and St. Petersburg, the same should be true in other regions as well. But that is not what one sees in the data (Figure 2). In most other regions, excess mortality vastly outnumbers the reported Covid-19 mortality, both in the numbers updated each day and in the later monthly reports of Covid-related deaths. The ratios of excess mortality to daily-reported deaths are very different between regions. Moderate, single-digit ratios could possibly be explained by insufficient testing capacity. But many regions have excess deaths at more than 20 times the daily reported numbers, up to 30 times in Chechnya, 70 times in Tatarstan, and 110 times in Bashkortostan. This can hardly have a benign explanation and suggests concealment and/or misreporting of Covid-19 deaths. Indeed, there are media reports discussing overflowing hospitals, packed morgues, and deliberate misdiagnosing of Covid-19 as pneumonia (bit.ly/3ar7XKF; cnn.it/3r5u3rH). It may not be a coincidence that Chechnya, Tatarstan and Bashkortostan are among the regions for which there is also statistical evidence of data manipulation in election results.4,5
Russia in context
It is not at all unique to Russia that excess mortality is greater than the daily reported numbers of Covid-19 deaths. Several media teams, such as those of the Financial Times, The Economist and the New York Times, have been tracking excess mortality across many countries during the pandemic. Using their latest estimates to compute the ratio of excess deaths to daily reported deaths gives numbers in the range of 0.9 to 3.2 (Figure 3). Note that, ideally, this ratio should be below 1: excess mortality should be smaller than Covid-19 mortality because the latter, according to the WHO guidelines, can include deaths with – but not due to – Covid-19. The ratio of 6.5 that we obtained for Russia is the largest ratio across all countries for which we have data, meaning that the daily reported death count for Russia may well be one of the least reliable indicators of the true epidemiological situation across all countries.
Figure 3.
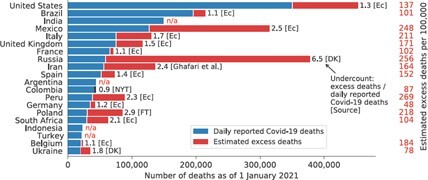
Twenty countries with the highest official daily reported number of Covid-19 deaths as of 1 January 2021. Blue bars are daily reported Covid-19 deaths; red bars are estimated excess deaths as of the same date (daily reported number multiplied by the undercount coefficient). Undercount coefficients are shown near the end of each bar together with the source: Ec = The Economist (econ.st/2LKJtlc); NYT = New York Times (nyti.ms/3gUMAT9); FT = Financial Times (on.ft.com/3bC0Uz3); Ghafari et al. (bit.ly/3nu1dPv); DK = this article. The undercount coefficient for Ukraine was computed as described here for Russia, using excess mortality for April–October 2020. Among the countries that are not shown here, the highest undercount coefficient, apart from Russia's, was Bolivia's (3.2). “n/a” denotes countries for which we could not find an estimate of excess mortality. On the right: estimated excess deaths per 100,000 inhabitants.
Excess mortality is a lagged indicator, with different lags in different countries. We can, however, use the latest daily report from each country and multiply it by the relevant ratio to estimate, albeit very approximately, what the true Covid-19 death toll might be at that time (Figure 3). For Russia, this gives approximately 380,000 deaths (as of 1 January 2021), corresponding to 0.26% of the population. This is the second highest absolute number of estimated excess deaths in the world after only the USA (over 400,000), and one of the highest numbers per capita: similar to Mexico, Ecuador, Bolivia and Peru (0.25% to 0.28%) and well ahead of all European and North American countries. (Note that these Latin American countries have much younger populations than those of Europe, North America, and Russia, so the same number of deaths per capita in Peru and Russia may indicate substantially higher Covid-19 prevalence in Peru; bit.ly/3b4ojcp.)
Despite all of this, Russian officials have proudly talked about the country's “low” Covid-19 mortality and the “low” apparent case fatality rate. In June, the president's press secretary said that the “low” death toll in Russia was supposedly due to better health care than in other countries: “Have you ever thought about the possibility of Russia's health care system being more effective?”, he asked CNN (cnn.it/2LMJMvR). This rhetorical question could not have been more misleading, as our analysis shows. ■
Estimating excess mortality
The baseline for 2020 excess mortality computations was estimated as follows. Based on the monthly death numbers in 2006–2019, we computed the average monthly number of deaths for each year. This number decreased monotonically apart from a peak in 2010 associated with a summer heat wave that year (go.nature.com/3oILoFj) and a jump upwards in 2015 after Crimea was added to the official Russian numbers. We fitted a linear trend to the 2015–2019 values and extrapolated it to 2020 to obtain the predicted baseline value for 2020 (together with the predictive standard deviation): 147,000 ± 2,000 (Figure 4). Separately, we computed monthly deviations from the average and took the median across all 2006–2019 years to estimate the seasonal variation. Adding the projected average monthly death number to the seasonal variation gives the baseline for 2020. This was done for the entire country as well as for each of the federal regions separately. Our procedure is similar to the approaches used by the Financial Times, the New York Times and The Economist, which also account for linear trends in recent years. The monthly mortality observed in January to March 2020, before the Covid-19 outbreak in Russia, is very close to the predicted baseline (Figure 1), providing support for the baseline estimation. Note that we include Crimea in our analysis despite its contested status because the official statistics in Russia include Crimea.
Figure 4.
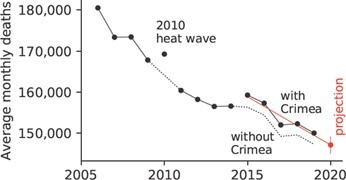
Average monthly deaths in Russia, with and without Crimea. Linear trend and projection for 2020 shown in red.
Postscript
On 28 December 2020, while this article was in preparation, Russian officials suddenly admitted, without any explanation, that most of the excess mortality recorded in Russia between January and November (which was 229,700, they said) was “due to” Covid-19 (bit.ly/394Oa1j). However, all the official data remain unmodified.
Note
Data and code are available at github.com/dkobak/excess-mortality, together with links to data sources, additional figures and animations, and regularly updated data. The author thanks Maxim Pshenichnikov for discussions and Sergey Shpilkin for scraping and sharing the time series data on regional daily reported Covid-19 deaths.
Disclosure statement
The author declares no conflicts of interest.
References
- 1. Kontis, V., Bennett, J. E., Rashid, T. et al. (2020) Magnitude, demographics and dynamics of the effect of the first wave of the COVID-19 pandemic on all-cause mortality in 21 industrialized countries. Nature Medicine, 26, 1919–1928. [DOI] [PMC free article] [PubMed] [Google Scholar]
- 2. Beaney, T., Clarke, J. M., Jain, V., Golestaneh, A. K., Lyons, G., Salman, D., and Majeed, A. (2020) Excess mortality: the gold standard in measuring the impact of COVID-19 worldwide? Journal of the Royal Society of Medicine, 113(9), 329–334. [DOI] [PMC free article] [PubMed] [Google Scholar]
- 3. Leon, D. A., Shkolnikov, V. M., Smeeth, L., Magnus, P., Pechholdová, M. and Jarvis, C. I. (2020) COVID-19: A need for real-time monitoring of weekly excess deaths. The Lancet, 395(10234), E81. [DOI] [PMC free article] [PubMed] [Google Scholar]
- 4. Kobak, D., Shpilkin, S. and Pshenichnikov, M. S. (2016) Integer percentages as electoral falsification fingerprints. Annals of Applied Statistics, 10(1) 54–73. [Google Scholar]
- 5. Kobak, D., Shpilkin, S. and Pshenichnikov, M. S. (2016) Statistical fingerprints of electoral fraud? Significance, 13(4), 20–23. [Google Scholar]


