

Abstract
There have been a limited number of studies on coronavirus disease 2019 (COVID‐19) in children. In this study, we aimed to investigate the demographic, clinical, and laboratory features of COVID‐19 and to identify the role of mean platelet volume (MPV) in predicting the prognosis in children. A single‐center retrospective study, including 251 confirmed and 65 suspected COVID‐19 cases, was conducted between March 11, 2020, and December 11, 2020. In the confirmed COVID‐19 group, 48 (19.1%) patients were asymptomatic, 183 (72.9%) mild, 16 (6.4%) moderate, 1 (0.4%) severe, and 3 were (1.2%) critically ill. Confirmed COVID‐19 patients had significantly lower mean values of white blood cell (WBC), absolute neutrophil count, absolute lymphocyte count, platelet, and hemoglobin (p < .001). However, there was no significant difference in MPV levels between the two groups (p = .894). C‐reactive protein (CRP), procalcitonin, fibrinogen, and NT‐pro‐BNP mean values were significantly lower in confirmed COVID‐19 cases than suspected cases (p < .001). A total of 55 (21.9%) patients required hospitalization due to COVID‐19, and MPV, WBC, CRP, procalcitonin, D‐dimer, and NT‐pro‐BNP were statistically higher in hospitalized patients than those in outpatients. The multivariate analysis of confirmed COVID‐19 cases according to the severity of disease showed that lymphopenia and higher levels of fibrinogen significantly associated with severe clinical symptoms. Decision tree analysis showed that the most powerful predictor of hospitalization due to COVID‐19 was the D‐dimer (p < .001). MPV values are not associated with COVID‐19 disease severity. However, MPV can be used with other parameters such as WBC, CRP, procalcitonin, D‐dimer, and NT‐pro‐BNP to predict hospitalization.
Keywords: COVID‐19, lymphopenia, mean platelet volume, pediatrics
1. INTRODUCTION
In December 2019, severe acute respiratory syndrome coronavirus 2 (SARS‐CoV‐2) emerged in Wuhan, China. 1 , 2 The first case of coronavirus disease 2019 (COVID‐19) was reported on March 11, 2020, in Turkey. 3 Reports on COVID‐19 primarily focus on adults, but COVID‐19 cases are also seen in pediatric patients. 4 , 5 COVID‐19 often presents as an asymptomatic or milder disease in children and has a better prognosis than adults; however, it should be kept in mind that it may be severe in infants under 1 year of age and children with chronic diseases. 6 In children, the milder presentation of COVID‐19 can be explained by the fact that children have a different immune response to the SARS‐CoV‐2 virus than adults and the common viruses in the mucosa of the respiratory system limit the growth of SARS‐CoV‐2 with virus interactions. 6 , 7
Several studies showed that the hyperinflammatory response induced by SARS‐CoV‐2 is a major cause of disease severity and death in infected patients. 8 , 9 Higher levels of inflammatory markers in blood including C‐reactive protein (CRP), ferritin, D‐dimer, an increased neutrophil‐to‐lymphocyte ratio (NLR), increased levels of several inflammatory cytokines, and chemokines have been associated with disease severity. 9 , 10 Lower platelet count and increased level of D‐dimer are associated with coagulation abnormalities leading to organ failure and death in patients with severe COVID‐19. 8 Recently, it has been reported that platelets have important functions in inflammation, and mean platelet volume (MPV), which is a parameter evaluated in complete blood count (CBC), can be used as an inflammatory marker in some inflammatory diseases. 11 MPV shows the size of platelets and it is correlated with platelet activation and function, and usually increases in patients with thrombosis. 12 Inflammatory mediators, such as interleukin‐6, which usually increases in acute or chronic conditions, may affect the bone marrow by changing the whole megakaryocytic platelet axis causing higher MPV levels. 11 , 12 MPV can give information on the course and prognosis in several pathological conditions, such as cardiovascular, respiratory, and rheumatological diseases. 12 , 13 , 14 , 15 , 16 , 17 , 18
Significant differences in MPV levels have also been shown in respiratory diseases accompanied by inflammatory conditions. 14 , 15 , 16 , 17 , 18 In a recent study by Canpolat et al., 14 MPV has been shown to have higher levels in premature infants with respiratory distress syndrome (RDS) than infants without RDS. In another study, Nakoa et al. 15 reported that patients with tonsillitis and peritonsillar abscess have lower levels of MPV. Renshaw et al. 16 showed that decreased MPV levels are associated with respiratory syncytial virus infection. It has also been shown that children with acute bronchiolitis have higher levels of MPV than controls, and patients with active tuberculosis have lower MPV levels as compared with patients having latent infection. 18 , 19
MPV has been considered to be an inflammatory biomarker in several diseases; however, there have been a limited number of studies on MPV and its potential role in predicting the severity of COVID‐19 in children. In this study, the demographic, clinical, and laboratory features of COVID‐19 and the role of MPV in predicting the prognosis in children have been investigated. D‐dimer was found to be the most powerful predictor of hospitalization due to COVID‐19. MPV can be a valuable parameter in predicting patients requiring hospitalization, along with other parameters such as white blood cell count, CRP, procalcitonin, D‐dimer, and NT‐pro‐BNP.
2. MATERIALS AND METHODS
2.1. Study design and study population
A single‐center retrospective study was conducted between March 11, 2020, and December 11, 2020, in Ege University Children's Hospital, which is a tertiary level hospital in the west part of Turkey. COVID‐19 was diagnosed according to the Turkey Ministry of Health COVID‐19 Guideline and confirmed cases were defined as the cases in which SARS‐CoV‐2 was detected by molecular methods from throat swab specimens. 3 The patients with two consecutive negative real‐time reverse transcriptional polymerase chain reaction (RT‐PCR) tests with at least 48‐h intervals were removed of isolation and classified as suspected COVID‐19 patients. Turkish Ministry of Health COVID‐19 Guideline defined the suspected case if the patient had a fever and at least one of the following symptoms: cough, respiratory distress with contact or travel history, or requirement of hospitalization. 3
The confirmed case group consisted of 251 children with a positive SARS‐CoV‐2 RT‐PCR and the suspected case group consisted of 65 children. The exclusion criterion for the control group involved an underlying disease such as respiratory or cardiovascular disease. The scheme of the study design has been shown in Figure 1. A clinical scoring system was used to identify clinical classifications of illness severity in confirmed COVID‐19 patients. 20 , 21
Figure 1.
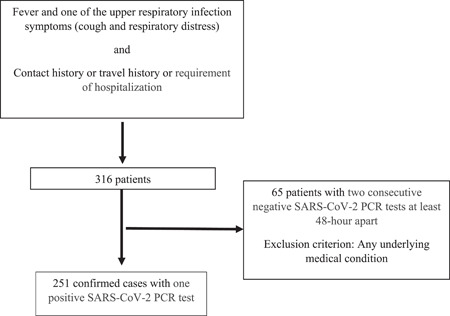
Scheme of the study design. SARS‐CoV‐2, severe acute respiratory syndrome coronavirus 2
2.2. Data collection
A standardized form was used to collect epidemiological data, laboratory findings, and clinical symptoms of the patients. Laboratory analysis on admission, including WBC, absolute neutrophil count (ANC), absolute lymphocyte count (ALC), hemoglobin (Hb), platelet count (PLT), MPV, CRP, procalcitonin (PCT), D‐dimer, fibrinogen, and N‐terminal proBrain Natriuretic Peptide (NT‐pro‐BNP) values, was also recorded. Thrombocytopenia was defined as a blood platelet count less than 150 × 109/L, neutropenia was defined as ANC less than 1500/mm3, and lymphopenia was defined as absolute lymphocyte count less than 1500/mm3. NLR was calculated from a CBC test by dividing the ANC by the absolute lymphocyte count.
CBC was performed on Sysmex XN‐3100™ Automated Hematology System (Sysmex). MPV, which is one of the platelet indices (MPV (fL) = plateletcrit/platelet count), was calculated obligatorily by the Sysmex XN system. The reference range for MPV was between 7.8 and 11 fL. Fibrinogen was measured by the modified Clauss method (Multifibren®U; Siemens Healthcare Diagnostics) on Siemens BCS®XP Systems automated coagulation analyzer (Siemens Healthcare GmbH). D‐dimer was measured by particle‐enhanced, immunoturbidimetric assay (Innovance®D‐dimer) on Siemens BCS®XP Systems automated coagulation analyzer (Siemens Healthcare GmbH). CRP was measured immunoturbidimetrically (CRPL4, Tina‐quant CRP IV) in human serum on Cobas c systems (Roche Diagnostics GmbH). Elecsys® BRAHMS Procalcitonin was measured by electrochemiluminescence immunoassay on the automated Roche Elecsys Modular and Cobase immunoassay analyzer system (Roche Diagnostics GmbH).
Throat swab samples were collected from all suspected patients on admission. Diagnosis of COVID‐19 infection is made by determining the ribonucleic acid (RNA) of the SARS‐CoV‐2 virus in the RT‐PCR method in respiratory samples. Coyote Bioscience, which is used to detect RNA of the virus in our Molecular Virology laboratories, adopts the RT‐PCR method combined with fluorescence probes to detect the conserved region of ORFIab and N gene of SARS‐CoV‐2.
2.3. Statistical analysis
Statistical analysis was performed with SPSS statistical package (version 25 for Windows). Data were expressed as means ± SD or medians (interquartile range) for continuous variables or percentages for categorical variables. Group comparisons were made using the Student's t test for normally distributed data and the χ 2 test for categorical data. The Mann–Whitney U test was used to compare differences in nonparametric data between the groups. Differences and correlations were considered significant at p < .05. Univariate and multivariate analyses of predictors for illness severity were performed using the logistics regression. All variables with a p value of less than .05 were included in the multivariate analysis, and the results of this regression analyses were reported as adjusted odds ratio with a 95% confidence interval. Significant predictors for hospitalization due to COVID‐19, as retrieved from SPSS analysis, were also evaluated with the MedCalc program. Also, MedCalc program was also used to determine the area under the curve (AUC), sensitivity, specificity, and positive and negative predictive values. Decision tree models were generated using the exhaustive χ 2 automatic interaction detector algorithm.
3. RESULTS
The study groups consisted of 251 patients with confirmed and 65 suspected COVID‐19 cases. In confirmed COVID‐19 patients, the median age was 8.92 ± 6.01 years and 55.5% of them were male. In total, 183 (72.9%) patients were previously healthy. The most common underlying disease in confirmed COVID‐19 patients was chronic pulmonary disease (4.4%), followed by neurologic disease (3.6%) and bone marrow/solid organ transplantation (3.2%). The most common symptom was fever (57%), followed by cough (23.9%) and myalgia (14.7%). When patients were classified according to the clinical severity of the disease, 48 (19.1%) patients were asymptomatic, 183 (72.9%) mild, 16 (6.4%) moderate, 1 (0.4%) severe, and 3 (1.2%) critically ill in the group including confirmed COVID‐19 patients. Also, 55 (21.9%) patients were hospitalized in the confirmed COVID‐19 group. In this group, 19 patients used antibiotics, 15 patients hydroxychloroquine, and 8 patients favipiravir. Out of 251 patients, only 6 (2.4%) patients required oxygen support and 3 (1.2%) patients respiratory support. No patient died, but 3 (1.2%) patients were transferred to the pediatric intensive care unit (Table 1).
Table 1.
Demographic and clinical characteristics of patients groups with confirmed COVID‐19 patients
| Confirmed COVID‐19 group, n = 251 | |
|---|---|
| Age, years, mean ± SD | 8.92 ± 6.01 |
| Age distribution, n (%) | |
| <1 year | 34 (13.5) |
| 1–<6 years | 61 (24.3) |
| 6–<10 years | 38 (15.1) |
| 10–<15 years | 61 (24.3) |
| ≥15 years | 57 (22.5) |
| Gender, male, n (%) | 139 (55.5) |
| Underlying diseases, n (%) | |
| Previously healthy | 183 (72.9) |
| Chronic pulmonary disease | 11 (4.4) |
| Neurologic disease | 9 (3.6) |
| Bone marrow/solid organ transplantation | 8 (3.2) |
| Metabolic disease | 7 (2.8) |
| Hematologic–oncologic malignancy | 6 (2.4) |
| Rheumatologic disease | 6 (2.4) |
| Endocrine disorder | 5 (2) |
| Primary immune deficiency | 5 (2) |
| Nephrological disease | 3 (1.2) |
| Cardiovascular disease | 2 (1.8) |
| Others | 6 (2.4) |
| Signs and symptoms, n (%) | |
| Fever | 143 (57) |
| Cough | 60 (23.9) |
| Myalgia | 37 (14.7) |
| Dyspnea | 20 (8) |
| Sore throat | 20 (8) |
| Abdominal pain | 15 (6) |
| Headache | 11 (4.4) |
| Runny nose | 11 (4.4) |
| Diarrhea | 9 (7.4) |
| Fatigue | 9 (3.6) |
| Vomiting | 7 (2.8) |
| Anosmia | 5 (2) |
| Othersa | 7 (2.8) |
| Clinical classifications of illness severity, n (%) | |
| Asymptomatic | 48 (19.1) |
| Mild | 183 (72.9) |
| Modarate | 16 (6.4) |
| Severe | 1 (0.4) |
| Critical | 3 (1.2) |
| Hospitalization, n (%) | 55 (21.9) |
| Total length of hospital stay, days, mean ± SD | 7.59 ± 8.36 |
| Treatment, n (%) | |
| Hydroxychloroquine | 15 (6) |
| Antibiotic treatmentb | 19 (7.6) |
| Favipiravir | 8 (3.2) |
| Corticosteroid | 3 (1.2) |
| Salbutamol | 3 (1.2) |
| Oxygen support, n (%) | 6 (2.4) |
| PICU admission, n (%) | 3 (1.2) |
| Mechanical ventilator, n (%) | 3 (1.2) |
| Mortality, n (%) | 0 (0) |
Abbreviations: COVID‐19, coronavirus disease 2019; PICU: pediatric intensive care unit.
Other symptoms: Febrile convulsion in three patients, conjunctivitis in one patient, rash in one patient, chest pain in one patient, epistaxis in one patient, nausea in one patient.
Antibiotic treatment: Azithromycin + ceftriaxone used in three patients, ceftriaxone used in six pateints, meropenem used in six patients, piperacillin–tazobactam used in three patients, ciprofloxacin used in one patient.
In suspected COVID‐19 patients, the median age was 3.60 ± 4.51 years and 55.4% of them were male. The median age was lower in the suspected COVID‐19 patients' group than the confirmed COVID‐19 group (p < .001). There was no statistical difference in the gender of groups (p = .999). When laboratory findings were evaluated, there was no statistical difference in MPV levels between the groups (p = .894). COVID‐19 patients had significantly lower mean values of WBC, ANC, ALC, and PLT, and higher mean values of Hb than suspected COVID‐19 patients (p < .001). In total, 65 (25.9%) confirmed COVID‐19 patients had lymphopenia, 36 (14.3%) neutropenia, and 11 (4.4%) thrombocytopenia. COVID‐19‐confirmed patients had significantly more common neutropenia and lymphopenia than suspected cases (p values are .002 and <.001). CRP, PCT, fibrinogen, and NT‐pro‐BNP mean values were significantly lower in confirmed COVID‐19 cases than suspected cases (p < .001). There was no significant difference in mean values of D‐dimer between confirmed and suspected COVID‐19 patients (p = .179) In the confirmed COVID‐19 group, 37.5% of patients had increased CRP and 70.1% had increased procalcitonin. The mean value of NLR was not statistically different between the groups (p = .159) (Table 2).
Table 2.
Demographic and laboratory characteristics of the confirmed and suspected COVID‐19 patient groups
| Variables | Confirmed COVID‐19 patients | Suspected COVID‐19 patients | p Value |
|---|---|---|---|
| Patients, n | 251 | 65 | |
| Age, years, (mean ± SD) | 8.92 ± 6.01 | 3.60 ± 4.51 | <.001 |
| Gender, male, n (%) | 139 (55.4) | 36 (55.4) | .999 |
| Laboratory findings | |||
| MPV (mean ± SD), fL | 9.93 ± 1.04 | 10.0 ± 0.91 | .894 |
| PLT (mean ± SD)/mm3 | 283,565 ± 77,434 | 338,823 ± 93,611 | <.001 |
| WBC (mean ± SD)/mm3 | 10,067 ± 5841 | 13,092 ± 6465 | <.001 |
| ANC (mean ± SD)/mm3 | 6139 ± 5527 | 6322 ± 3889 | <.001 |
| ALC (mean ± SD)/mm3 | 2825 ± 2254 | 4932 ± 3771 | <.001 |
| Hb (mean ± SD), g/dL | 12.5 ± 1.84 | 11.3 ± 1.74 | <.001 |
| CRP (mean ± SD), mg/L | 30.1 ± 47.2 | 36.6 ± 35.6 | <.001 |
| PCT (mean ± SD), µg/L | 0.84 ± 2.18 | 3.19 ± 11.7 | <.001 |
| D‐dimer (mean ± SD), µg/L | 1434 ± 1337 | 989 ± 814 | .179 |
| Fibrinogen (mean ± SD), mg/dl | 352 ± 126 | 401 ± 92.3 | <.001 |
| NT‐pro‐BNP (mean ± SD), ng/L | 186.7 ± 411.3 | 824 ± 1531 | <.001 |
| Lymphopenia n (%) | 65 (25.9) | 4 (6.2) | <.001 |
| (<1500/mm3) | |||
| Neutropenia, n (%) | 36 (14.3) | 1 (1.5) | .002 |
| (<1500/mm3) | |||
| Thrombocytopenia, n (%) | 11 (4.4) | 0 (0) | .129 |
| (<150,000/mm3) | |||
| NLR (mean ± SD) | 4.71 ± 6.31 | 3.4 ± 5.38 | .159 |
| Increased CRP, n (%) | 94 (37.5) | 47 (72.3) | <.001 |
| (>5 mg/L) | |||
| Increased Procalcitonin | 176 (70.1) | 27 (41.5) | <.001 |
| (>0.5) µg/L |
Note: The bold values indicate statistical analysis differences and correlations were considered significant at p < .05.
Abbreviations: ALC, absolute lymphocyte count; ANC, absolute neutrophil count; COVID‐19, coronavirus disease 2019; CRP, C‐reactive protein; Hb, hemoglobin; MPV, mean platelet volume; NLR, neutrophil‐to‐lymphocyte ratio; NT‐pro‐BNP, N‐terminal‐pro‐brain natriuretic peptide; PCT, procalcitonin; PLT, platelet count; WBC, white blood cell.
The comparison of demographic characteristics and laboratory findings of confirmed COVID‐19 cases according to the degree of illness severity did not show statistical differences in the median age and gender between the groups. There were also no statistical differences in the mean WBC, ANC, ALC, Hb, PLT, MPV, D‐dimer, NLR, PCT, and NT‐pro‐BNP values between the groups (p > .05). The mean values of CRP and fibrinogen were statistically higher in severe (moderate to critical) patients than nonsevere (asymptomatic to mild) patients (p values are .004 and .004). Severe COVID‐19 patients had significantly more common lymphopenia and thrombocytopenia than nonsevere patients (p values are .042 and <.001). When a multivariate logistic regression analysis was performed for potential predictors for COVID‐19 illness severity, there was no statistical difference between the groups in mean values of CRP and thrombocytopenia (p > .05). The mean values of fibrinogen were statistically higher in severe patients than nonsevere patients and lymphopenia were statistically more common in severe patients than non‐severe patients (p values were .017 and .031, respectively) (Table 3).
Table 3.
The comparison of demographic and laboratory characteristics of confirmed COVID‐19 patients according to clinical classification of illness severity
| Univariate analysis | Multivariate analysis | ||||
|---|---|---|---|---|---|
| Variables | nonseverea | severeb | p Value | p Value | Odds ratio (95% confidence interval) |
| Patients, n (%) | 231 (92) | 20 (8) | |||
| Age, years, mean ± SD | 7.57 ± 7.0 | 15.1 ± 2.1 | .140 | ||
| Gender, male, n (%) | 131 (56.7) | 8 (40) | .149 | ||
| Laboratory findings | |||||
| MPV (mean ± SD), fL | 10.2 ± 0.9 | 10.3 ± 1.0 | .060 | .739 | .890 (0.372–2.126) |
| PLT (mean ± SD)/mm3 | 281,750 ± 90,857 | 225,000 ± 80,876 | .289 | ||
| WBC (mean ± SD)/mm3 | 9490 ± 6368 | 13,073 ± 7502 | .886 | ||
| ANC (mean ± SD)/mm3 | 5046 ± 4697 | 11,550 ± 7687 | .364 | ||
| ALC (mean ± SD)/mm3 | 3277 ± 2407 | 726 ± 61 | .098 | ||
| Hb (mean ± SD), g/dl | 12.6 ± 2.0 | 11.5 ± 2.4 | .302 | ||
| CRP (mean ± SD), mg/L | 26.9 ± 50.8 | 78.2 ± 67.4 | .004 | .372 | 0.985 (0.954–1.018) |
| PCT (mean ± SD), µg/L | 0.3 ± 0.8 | 3.5 ± 5.6 | .068 | ||
| D‐dimer (mean ± SD), µg/L | 1251 ± 1169 | 2500 ± 2006 | .068 | ||
| Fibrinogen (mean ± SD), mg/dl | 350 ± 119.3 | 444 ± 212.3 | .004 | .017 | 1.013 (1.002–1.023) |
| NT‐pro‐BNP (mean ± SD), ng/L | 267.2 ± 367.9 | 73.4 ± 54.9 | .130 | ||
| NLR (mean ± SD) | 2.6 ± 3.7 | 15.3 ± 9.3 | .155 | ||
| Lymphopenia n (%) (<1500/mm3) | 56 (24.2) | 9 (45) | .042 | .031 | 7.562 (1.206–47.416) |
| Neutropenia, n (%) (<1500/mm3) | 32 (13.9) | 4 (20) | .452 | ||
| Thrombocytopenia, n (%) (<150,000/mm3) | 7 (3) | 4 (20) | .000 | .176 | 12.505 (0.324–483.398) |
Note: The bold values indicate statistical analysis differences and correlations were considered significant at p < .05.
Abbreviations: ALC, absolute lymphocyte count; ANC, absolute neutrophil count; COVID‐19, coronavirus disease 2019; CRP, C‐reactive protein; Hb, Hemoglobin; MPV, mean platelet volume; NLR, neutrophil‐to‐lymphocyte ratio; NT‐pro‐BNP, N‐terminal‐pro‐brain natriuretic peptide; PCT, procalcitonin; PLT, platelet count; WBC, white blood cell.
Nonsevere: asymptomatic to mild.
Severe: moderate to critical.
When demographic characteristics of hospitalized COVID‐19 patients and outpatients with confirmed COVID‐19 were compared, there was no statistical difference between the two groups in terms of age and gender (p > .05). The mean values of MPV, WBC, CRP, PCT, D‐dimer, and NT‐pro‐BNP were statistically higher in hospitalized patients with confirmed COVID‐19, and they showed thrombocytopenia more often than the outpatient group (p values are .011, .004, .003, <.001, <.001, and <.001, respectively) (Table 4). Receiver operating characteristic curve analysis was performed to evaluate the prediction values for MPV, WBC, CRP, PCT, D‐dimer, and NT‐pro‐BNP. This analysis suggested that the MPV level cut‐off point for predicting hospitalization due to COVID‐19 was 9.8 fL, with a sensitivity and specificity of 60% and 58%, respectively. D‐dimer showed the highest AUC value for predicting the patients who required hospitalization due to COVID‐19 (Table 5). The AUC values were 0.612, 0.628, 0.630, 0.760, 0.776, and 0.774 for MPV, WBC, CRP, PCT, D‐dimer, and NT‐pro‐BNP, respectively. The AUC values were shown in Figure 2.
Table 4.
Demographic and laboratory characteristics of the outpatient and hospitalized COVID‐19 patients
| Variables | Confirmed COVID‐19 outpatients | Confirmed COVID‐19 hospitalized patients | p Value |
|---|---|---|---|
| Patients, n | 196 | 55 | |
| Age, years, (mean ± SD) | 8.92 ± 6.01 | 3.60 ± 4.51 | .198 |
| Gender, male, n (%) | 109 (55.6) | 30 (54.5) | .888 |
| Laboratory findings | |||
| MPV (mean ± SD), fL | 9.65 ± 1.02 | 10.1 ± 1.04 | .011 |
| PLT (mean ± SD)/mm3 | 260,909 ± 60,609 | 304,333 ± 87,572 | .777 |
| WBC (mean ± SD)/mm3 | 7150 ± 2389 | 12,741 ± 6836 | .004 |
| ANC (mean ± SD)/mm3 | 3807 ± 2024 | 8277 ± 6851 | .060 |
| ALC (mean ± SD)/mm3 | 2366 ± 1318 | 3246 ± 2860 | .878 |
| Hb (mean ± SD), g/dl | 12.9 ± 1.34 | 12.1 ± 2.17 | .017 |
| CRP (mean ± SD), mg/L | 8.5 ± 6.6 | 49.8 ± 59.4 | .003 |
| Procalcitonin (mean ± SD), µg/L | 0.09 ± 0.02 | 1.52 ± 2.91 | <.001 |
| D‐dimer (mean ± SD), µg/L | 601 ± 304.8 | 2197 ± 1471.1 | <.001 |
| Fibrinogen (mean ± SD), mg/dl | 325.6 ± 71.1 | 377.9 ± 161.3 | .125 |
| NT‐pro‐BNP (mean ± SD), ng/L | 43.9 ± 52.3 | 388.5 ± 583.9 | <.001 |
| Lymphopenia n (%) | 50 (25.5) | 15 (27.3) | .792 |
| (<1500/mm3) | |||
| Neutropenia, n (%) | 28 (14.3) | 8 (14.5) | .961 |
| (<1500/mm3) | |||
| Thrombocytopenia, n (%) | 4 (2) | 7 (12.7) | .003 |
| (<150,000/mm3) | |||
| NLR (mean ± SD) | 2.23 ± 1.74 | 6.98 ± 8.07 | .274 |
Note: The bold values indicate statistical analysis differences and correlations were considered significant at p < .05.
Abbreviations: ALC, absolute lymphocyte count; ANC, absolute neutrophil count; COVID‐19, coronavirus disease 2019; CRP, C‐reactive protein; Hb, Hemoglobin; MPV, mean platelet volume; NLR, neutrophil‐to‐lymphocyte ratio; NT‐pro‐BNP, N‐terminal‐pro‐brain natriuretic peptide; PCT, procalcitonin; PLT, platelet count; WBC, white blood cell.
Table 5.
Sensitivity, specificity, positive predictive value, negative predictive value, and results of the receiver operating characteristic curve for MPV, CRP, PCT, WBC, D‐dimer and NT‐pro‐BNP in hospitalized confirmed COVID‐19 patients
| Cut‐off value | Sensitivity (%) | Specificity (%) | PPV | NPV | Youden's index | AUC (95% CI) | SE | p |
|---|---|---|---|---|---|---|---|---|
| MPV >9.8 fL | 60.00 | 58.67 | 28.9 | 83.9 | 0.1867 | 0.612 (0.549–0.673) | 0.0430 | .0093 |
| CRP >30.79 mg/L | 29.09 | 95.88 | 30.3 | 84.3 | 0.2497 | 0.630 (0,566–0.690) | 0.0459 | .0047 |
| PCT >0.13 µg/L | 70.00 | 84.62 | 58.3 | 90.2 | 0.5462 | 0.760 (0.655–0.846) | 0.0780 | .0009 |
| WBC >8520/mm3 | 47.27 | 76.02 | 27.6 | 83.7 | 0.2329 | 0.628 (0,565–0.688) | 0.0448 | .0042 |
| D‐dimer >621 µg/L | 67.50 | 79.63 | 71.1 | 76.1 | 0.4713 | 0.776 (0.678–0.856) | 0.0515 | <.0001 |
| NT‐pro‐BNP >57 ng/L | 72.4 | 80.4 | 72.4 | 80.5 | 0.5290 | 0.774 (0.658–0.865) | 0.0629 | <.0001 |
Abbreviations: ALC, absolute lymphocyte count; ANC, absolute neutrophil count; COVID‐19, coronavirus disease 2019; CRP, C‐reactive protein; Hb, Hemoglobin; MPV, mean platelet volume; NLR, neutrophil‐to‐lymphocyte ratio; NT‐pro‐BNP, N‐terminal‐pro‐brain natriuretic peptide; PCT, procalcitonin; PLT, platelet count; WBC, white blood cell.
Figure 2.
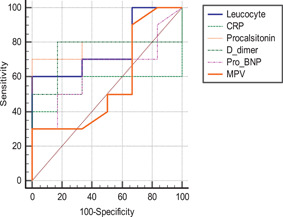
ROC curves of WBC, CRP, procalcitonin, D‐dimer, NT‐pro‐BNP, and MPV in predicting hospitalization due to COVID‐19. COVID‐19, coronavirus disease 2019; CRP, C‐reactive protein; MPV, mean platelet volume; NT‐pro‐BNP, N‐terminal‐pro‐brain natriuretic peptide; ROC, receiver operating characteristic curve; WBC, white blood cell
Decision tree analysis of the predictors of hospitalization due to COVID‐19 is shown in Figure 3. Of the total confirmed COVID‐19 patients, 21.9% (n = 55) were hospitalized, whereas 78.1% (n = 196) of them were followed up in the outpatient clinic. Decision tree analysis showed that the most powerful predictor of hospitalization due to COVID‐19 was the cut‐off value of D‐dimer (p < .001); 27 patients (71.1%) who had a D‐dimer mean value of more than 621 µg/L were hospitalized. However, 185 patients (86.9%) who had a mean value of D‐dimer ≤621 µg/L were followed up in the outpatient clinic. Among the patients having the mean value of D‐dimer ≤621 µg/L, the strongest predictor of being outpatient was the mean value of CRP ≤30.7 mg/L (p = .013). Of 136 patients who had the mean value of CRP ≤30.7 mg/L, the most powerful predictor of being outpatient was the mean value of MPV ≤10.2 f/L (p = .015).
Figure 3.
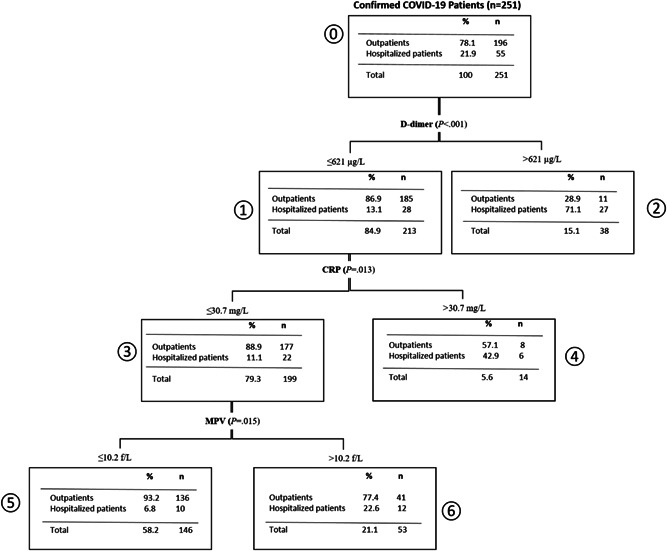
Decision tree analysis of the predictors of hospitalization due to COVID‐19. COVID‐19, coronavirus disease 2019; CRP, C‐reactive protein, MPV, mean platelet volume
4. DISCUSSION
COVID‐19 may cause severe pneumonia, acute RDS, and even death in adult patients. 20 , 22 Studies on COVID‐19 focus primarily on adults due to the low infection rates in children. 5 Dong et al. 20 evaluated 728 pediatric patients with confirmed COVID‐19 in China; the median age of their patients was 7 years. Of the total number of patients, 56.6% were male and more than 90% of all patients had asymptomatic, mild, or moderate disease. The median age and the gender distribution in our study were found to be similar to Dong et al.'s 20 study. In accordance with Dong et al. 20 and previous studies conducted on pediatric patients, 98.4% of our patients had asymptomatic, mild, or moderate COVID‐19. 6 , 7 , 21
In COVID‐19, the white blood cell count can be normal or reduced with a decreased lymphocyte count. 22 , 23 In our study, when CBC parameters of the groups were evaluated, COVID‐19 patients had significantly lower mean values of white blood cell, neutrophil, lymphocyte, and platelet counts, and higher mean values of Hb levels than suspected COVID‐19 patients. In a recent study, Pan et al. 24 evaluated CBC parameters of adult patients diagnosed with confirmed COVID‐19 and community‐acquired pneumonia (CAP). They reported that COVID‐19 patients had lower mean values of white blood cell, neutrophil, lymphocyte, and platelet counts, and higher mean values of Hb than CAP patients.
Previous studies reported that CRP and PCT levels can be normal or elevated in children with COVID‐19. In severe and critical cases, D‐dimer levels are usually higher. 23 , 25 In our study, CRP, PCT, and fibrinogen mean values were significantly lower in confirmed COVID‐19 cases than suspected cases. It has been considered that bacterial infections in some of our suspected patients can be the reason for higher mean values of CRP and PCT than confirmed COVID‐19 patients. In Turkey, Cura et al. 26 evaluated 220 pediatric COVID‐19 cases and reported that 17.8% of patients had increased CRP, 2.3% increased PCT, 8.4% neutropenia, 13.5% lymphopenia, and 0.9% had thrombocytopenia. In our study, 14.3% of confirmed COVID‐19 patients had neutropenia, 25.9% patients lymphopenia, and 4.4% thrombocytopenia. In our study, the ratios of patients having increased CRP, increased PCT, neutropenia, lymphopenia, and thrombocytopenia were higher than those found in previously reported cases. In another study, Lu et al. 27 reported a series of 171 pediatric cases of COVID‐19; 26.3% of their patients had leukopenia and only 3.5% of them developed lymphopenia.
In a recent study, Liu et al. 22 evaluated 383 adult patients and reported that thrombocytopenia on admission was associated with mortality in COVID‐19. In their study, evaluation of MPV values revealed that patients with thrombocytopenia had higher levels of MPV than those without thrombocytopenia. Yun et al. 10 investigated 32 COVID‐19‐confirmed and 2337 COVID‐19‐negative adult patients, showing that patients with COVID‐19 had significantly higher levels of MPV. Guclu et al. 28 evaluated 215 adult patients and reported that MPV differences between the first and third days of hospitalization were significant parameters in patients with COVID‐19 in predicting mortality, and a 1 unit increase in MPV causes 1.76 times increase in the mortality rate. In our study, there were no statistical differences in MPV levels between the groups when they were compared according to the severity of the disease.
Comparison of MPV values and mortality could not be made because there were no deaths. However, in our study, hospitalized patients due to confirmed COVID‐19 had significantly higher mean values of MPV, WBC, CRP–PCT, and D‐dimer than those in confirmed COVID‐19 outpatients. Decision tree analysis showed that the most powerful predictor of hospitalization due to COVID‐19 was the cut‐off value of D‐dimer above 621 µg/L. These findings suggest that the higher mean values of MPV, WBC, CRP, procalcitonin, and D‐dimer can be predictive values for the patients requiring hospitalization due to COVID‐19.
The first limitation of our study is its retrospective nature. Second, it is a single‐center study, and a limited numbers of patients could be evaluated. Third, we evaluated MPV values on admission and MPV may change over the disease course, and if so, we may not have documented this change.
In conclusion, our study showed that MPV values are not a good predictor for COVID‐19 illness severity. However, MPV can be used with other parameters such as WBC, CRP, PCT, D‐dimer, and NT‐pro‐BNP to predict hospitalization. There are limited studies about children with COVID‐19, and further studies evaluating the laboratory analysis and decision strategies of illness severity and hospitalization are urgently needed in children with COVID‐19.
CONFLICT OF INTERESTS
The authors declare that there are no conflict of interests.
AUTHOR CONTRIBUTIONS
Gizem Guner Ozenen: collected and analyzed the data, and wrote the manuscript. Zumrut Sahbudak Bal: designed the study, analyzed the data, and revised the final manuscript. Zuhal Umit, Nimet Melis Bilen, Sema Yildirim Arslan, Eylem Ulas Saz, and Ali Yurtseven: collected the data. Barutcuoglu Burcu: supervised the biochemistry aspect of the study. Ruchan Sertoz: supervised the virology aspect of the study. Ferda Ozkinay and Zafer: Kurugol reviewed and revised the final manuscript. All authors approved the final manuscript as submitted.
PEER REVIEW
The peer review history for this article is available at https://publons.com/publon/10.1002/jmv.26902
Guner Ozenen G, Sahbudak Bal Z, Umit Z, et al. Demographic, clinical, and laboratory features of COVID‐19 in children: The role of mean platelet volume in predicting hospitalization and severity. J Med Virol. 2021;93:3227‐3237. 10.1002/jmv.26902
DATA AVAILABILITY STATEMENT
The data that support the findings of this study are available from the corresponding author upon reasonable request.
REFERENCES
- 1. Zhou P, Yang XL, Wang XG, et al. A pneumonia outbreak associated with a new coronavirus of probable bat origin. Nature. 2020;579(7798):270‐273. [DOI] [PMC free article] [PubMed] [Google Scholar]
- 2. Huang C, Wang Y, Li X, et al. Clinical features of patients infected with 2019 novel coronavirus in Wuhan, China. Lancet. 2020; 395(10223):497‐506. [DOI] [PMC free article] [PubMed] [Google Scholar]
- 3. Turkey Ministry of Health , General Directorate of Public Health. COVID‐19 Guide (April 14, 2020). https://covid19bilgi.saglik.gov.tr/depo/rehberler/covid-19_rehberi.pdf. Access date: 03.05.2020.
- 4. Jiang F, Deng L, Zhang L, Cai Y, Cheung CW, Xia Z. Review of the clinical characteristics of coronavirus disease 2019 (COVID‐19). J Gen Intern Med. 2020;35(5):1545‐1549. [DOI] [PMC free article] [PubMed] [Google Scholar]
- 5. Choi SH, Kim HW, Kang JM, Kim DH, Cho EY. Epidemiology and clinical features of coronavirus disease 2019 in children. Clin Exp Pediatr. 2020;63(4):125‐132. [DOI] [PMC free article] [PubMed] [Google Scholar]
- 6. Castagnoli R, Votto M, Licari A, et al. Severe acute respiratory syndrome coronavirus 2(SARS‐CoV‐2) infection in children and adolescents: a systematic review. JAMA Pediatr. 2020;174:882. [DOI] [PubMed] [Google Scholar]
- 7. Ludvigsson JF. Systematic review of COVID‐19 in children shows milder cases and a better prognosis than adults. Acta Paediatr. 2020;109(6):1088‐1095. [DOI] [PMC free article] [PubMed] [Google Scholar]
- 8. Merad M, Martin JC. Pathological inflammation in patients with COVID‐19: a key role for monocytes and macrophages [published online ahead of print, 2020 May 6]. Nat Rev Immunol. 2020;10:1‐8. [DOI] [PMC free article] [PubMed] [Google Scholar]
- 9. Kermali M, Khalsa RK, Pillai K, Ismail Z, Harky A. The role of biomarkers in diagnosis of COVID‐19—a systematic review [published online ahead of print, 2020 May 13]. Life Sci. 2020;254:117788. [DOI] [PMC free article] [PubMed] [Google Scholar]
- 10. Yun H, Sun Z, Wu J, Tang A, Hu M, Xiang Z. Laboratory data analysis of novel coronavirus (COVID‐19) screening in 2510 patients [published online ahead of print, 2020 Apr 18]. Clin Chim Acta. 2020;507(94):97. [DOI] [PMC free article] [PubMed] [Google Scholar]
- 11. Noris P, Melazzini F, Balduini CL. New roles for mean platelet volume measurement in the clinical practice? Platelets. 2016;27(7):607‐612. [DOI] [PubMed] [Google Scholar]
- 12. Korniluk A, Koper‐Lenkiewicz OM, Kamińska J, Kemona H, Dymicka‐Piekarska V. Mean platelet volume (MPV): new perspectives for an old marker in the course and prognosis of inflammatory conditions. Mediators Inflamm. 2019;2019:9213074. [DOI] [PMC free article] [PubMed] [Google Scholar]
- 13. Shi X, Li WC, Mo LJ, et al. Altered mean platelet volume in children with Henoch‐Schonlein purpura and its association with disease activity. Ann Clin Biochem. 2018;55(3):368‐372. [DOI] [PubMed] [Google Scholar]
- 14. Canpolat FE, Yurdakök M, Armangil D, Yiğit S. Mean platelet volume in neonatal respiratory distress syndrome. Pediatr Int. 2009;51(2):314‐316. [DOI] [PubMed] [Google Scholar]
- 15. Nakao Y, Tanigawa T, Kano F, et al. Diagnostic role of mean platelet volume in tonsillitis with and without peritonsillar abscess. J Laryngol Otol. 2018;132(7):615‐618. [DOI] [PubMed] [Google Scholar]
- 16. Renshaw AA, Drago B, Toraya N, Gould EW. Respiratory syncytial virus infection is strongly correlated with decreased mean platelet volume. Int J Infect Dis. 2013;17(9):e678‐e680. [DOI] [PubMed] [Google Scholar]
- 17. Sun WX, Zhang JR, Cao ZG, Li Y, Wang RT. A decreased mean platelet volume is associated with stable and exacerbated asthma. Respiration. 2014;88(1):31‐37. [DOI] [PubMed] [Google Scholar]
- 18. Gunluoglu G, Yazar EE, Veske NS, Seyhan EC, Altin S. Mean platelet volume as an inflammation marker in active pulmonary tuberculosis. Multidiscip Respir Med. 2014;9(1):11. [DOI] [PMC free article] [PubMed] [Google Scholar]
- 19. Gökçe Ş, Kurugöl Z, Suner A. The role of mean platelet volume in the early detection of acute bronchiolitis: a prospective study. Clin Respir J. 2018;12(10):2513‐2518. [DOI] [PubMed] [Google Scholar]
- 20. Dong Y, Mo X, Hu Y, et al. Epidemiology of COVID‐19 among children in China. Pediatrics. 2020;145(6):e20200702. [DOI] [PubMed] [Google Scholar]
- 21. Carlotti APCP, de Carvalho WP, Johnston C, Rodriguez IS, Delgado AF. AF. COVID‐19 Diagnostic and Management Protocol for Pediatric Patients. Clinics (Sao Paulo). 2020;75:e1894. [DOI] [PMC free article] [PubMed] [Google Scholar]
- 22. Liu Y, Sun W, Guo Y, et al. Association between platelet parameters and mortality in coronavirus disease 2019: retrospective cohort study. Platelets. 2020;31(4):490‐496. [DOI] [PMC free article] [PubMed] [Google Scholar]
- 23. Chen ZM, Fu JF, Shu Q, et al. Diagnosis and treatment recommendations for pediatric respiratory infection caused by the 2019 novel coronavirus. World J Pediatr. 2020;16(3):240‐246. [DOI] [PMC free article] [PubMed] [Google Scholar]
- 24. Pan Y, Ye G, Zeng X, et al. Can routine laboratory tests discriminate SARS‐CoV‐2‐infected pneumonia from other causes of community‐acquired pneumonia? Clin Transl Med. 2020;10(1):161‐168. [DOI] [PMC free article] [PubMed] [Google Scholar]
- 25. Cui X, Zhang T, Zheng J, et al. Children with coronavirus disease 2019: a review of demographic, clinical, laboratory, and imaging features in pediatric patients [published online ahead of print, 2020 May 17]. J Med Virol. 2020. 10.1002/jmv.26023 [DOI] [PMC free article] [PubMed] [Google Scholar]
- 26. Cura Yayla BC, Özsürekçi Y, Aykaç K, et al. Characteristics and management of children with COVID‐19 in Turkey. Balkan Med J. 2020;37(6):341‐347. [DOI] [PMC free article] [PubMed] [Google Scholar]
- 27. Lu X, Zhang L, Du H, et al. SARS‐CoV‐2 infection in children. N Engl J Med. 2020;382(17):1663‐1665. [DOI] [PMC free article] [PubMed] [Google Scholar]
- 28. Güçlü E, Kocayiğit H, Okan HD, et al. Effect of COVID‐19 on platelet count and its indices. Rev Assoc Med Bras (1992). 2020;66(8):1122‐1127. [DOI] [PubMed] [Google Scholar]
Associated Data
This section collects any data citations, data availability statements, or supplementary materials included in this article.
Data Availability Statement
The data that support the findings of this study are available from the corresponding author upon reasonable request.