

Abstract
Background
Blood groups and anti‐A isohemagglutinin may be involved in susceptibility to SARS‐CoV‐2 infection.
Materials and Methods
We retrospectively studied 268 COVID‐19 convalescent plasma donors and 162 COVID‐19 inpatients (total 430 subjects, confirmed by RT‐PCR) and 2,212 healthy volunteer first‐time blood donors as a control group. These were further divided into two groups: those with anti‐A (blood types O and B) and those without it (types A and AB). Titres of nucleoproteins, and neutralizing SARS‐CoV‐2 antibody were measured in the convalescent plasma donors and inpatients. Multivariate logistic regression and non‐parametric tests were applied.
Results
Persons having types O or B showed less infection prevalence than those of types A or AB (OR = 0·62, 95% CI 0·50–0·78; P < 0·001), but there was no difference when COVID‐19 inpatients were analysed. Immunoglobulins M, G and A were lower in COVID‐19 subjects of types O or B group than those of A or AB (0·16 vs. 0·19; P = 0·03, 2·11 vs. 2·55; P = 0·02, 0·23 vs. 0·32; P = 0·03, respectively).
Conclusion
In this retrospective cohort, COVID‐19 individuals were less likely to belong to blood types O and B, and also had lower SARS‐CoV‐2 antibody titres than A and AB individuals. COVID‐19 severity did not associate with the blood groups.
Keywords: ABO groups, anti‐A, SARS‐CoV‐2
Background
Since December 2019, when the first outbreak of novel coronavirus disease (COVID‐19) occurred in Wuhan, China, over 33 million people have been diagnosed, and over one million people have died worldwide [1]. It is unclear which individual characteristics determine susceptibility and intensity of symptoms. However, age, sex, ethnicity, hypertension, body mass index and haematological biomarkers, such as D‐dimer, thrombocytopenia and lymphopenia [2, 3], have already been associated with a worse outcome.
Recently blood types and anti‐A isohemagglutinin have been associated with susceptibility to the severe acute respiratory syndrome coronavirus 2 (SARS‐CoV‐2) infection [4, 5]. Considering that the first studies reported type A as a risk factor and O as protection, some authors have suggested that anti‐A and not the blood type itself could be responsible for the findings [6].
The human ABO histo‐blood group system has a single gene located on the terminal portion of the long arm of chromosome 9 (9q34.2), with three main alleles; one recessive O and two co‐dominant A and B [7]. Differences in blood group antigen expressions and presence or absence of anti‐A or ‐B provide strong defensive lines against infection [8]. In persons with O blood type, characterized by the absence of A or B antigens, stimulation by microbiota having glycan motifs similar to A or B antigens, leads to a natural production of anti‐A and anti‐B [9]. Type B individuals also produce anti‐A but in lower titres [10]. Interestingly, in 2003, during the SARS‐CoV outbreak in China, the O blood group was considered protective against infection—OR = 0·18 (0·04–0·81) [11]. Later, a cell‐binding assay showed that either a monoclonal or human natural anti‐A could inhibit the SARS‐CoV S protein/ACE2 interaction [12]. At a cellular level, this supports the idea that the type O protection against SARS‐CoV involves the antibodies rather than the antigens.
Based on these findings, our study aimed to analyse the association of SARS‐CoV‐2 infection with the presence of anti‐A (In types O and B) or its absence (in types A and AB), related to the production of antibodies to SARS‐CoV‐2 nucleoprotein (NP; IgA, IgM and IgG) and neutralizing antibodies (nAb).
Methods and materials
Ethics statement
The study was approved by both hospitals’ Institutional Review Boards (IRB) and the Brazilian Commission on Ethics and Research (CONEP) under requests CAAE 32558220.0.0000.0071 and CAAE 30259220.4.2001.5461. All patients and COVID‐19 convalescent plasma donors provided written informed consent.
Subjects
We analysed a retrospective cohort of 430 people with COVID‐19 [268 convalescent plasma donors (CCPD) and 162 inpatients (CIP)] from both hospitals. All patients and plasma donors had a previous diagnosis confirmed by RT‐PCR.
The CCPD group comprised convalescent patients who had had mild symptoms (no hospitalization during their COVID‐19 evolution). Eligibility criteria required a positive diagnostic test by naso‐oropharyngeal swab (NOS) RT‐PCR and resolution of symptoms for at least 14 days. The candidates were then tested for SARS‐COV‐2 by RT‐PCR either on peripheral blood or NOS swab. If the RT‐PCR was negative, the plasma was collected, and antibodies to SARS‐CoV‐2 nucleoprotein (anti‐NP ‐ IgA, IgM and IgG) and neutralizing antibodies (nAb) were measured.
The CIP group was composed of patients with a positive SARS‐CoV‐2 RT‐PCR, who had moderate to severe symptoms and needed hospitalization. Blood type information was available in the electronic chart. Samples for anti‐NP and nAbs were drawn by the time of admission.
In order to avoid blood group bias from repeat donors, given that blood type O (‘universal donor’) is usually over‐represented, our control group (CG) comprised 2212 first‐time voluntary healthy blood donors from Hospital Israelita Albert Einstein blood bank database, who donated whole blood from August to October 2019, before the COVID‐19 outbreak in Brazil.
Subjects of blood types A and AB were grouped as ‘without anti‐A’ (A/AB group), whereas those with O and B were named ‘with anti‐A’ (O/B group).
Samples tests
Blood typing was done by the automated analyser, gel technique, Erytra Eflexis (Grifols, Barcelona, Spain) and IH‐platform (Biorad, Creisser, Switzerland).
RT‐PCR: A real‐time reverse transcriptase polymerase‐chain‐reaction technique confirmed SARS‐CoV‐2 diagnosis from naso‐oropharyngeal swab specimens. Molecular tests were based on Corman et al. [13], with five copies/reaction of sensitivity.
Neutralizing antibodies (nAbs) and anti‐nucleocapsid (anti‐NP) antibodies (IgM, IgG and IgA): We used the cytopathic effect‐based virus neutralization test (CPE‐based VNT), which was carried out with SARS‐CoV‐2 (GenBank: MT350282.1), as previously described [14, 15]. Anti‐NP was determined according to Wendel et al. [15]. Both methods have been described in more detail elsewhere [15].
Data analysis
Age was compared between control, CCPD and CIP groups using the ANOVA test. For sex and blood type analysis we used the chi‐square test. CCPD and CIP groups were classified as COVID‐19 individuals' group and compared to the CG.
For further analysis regarding the presence or absence of ‘circulating anti‐A’ and its association with COVID‐19, we merged our study population into two groups: one ‘with circulating anti‐A’; including types O and B (O/B group)” and another ‘without circulating anti‐A’; including types A and AB (A/AB group).”
For adjusted models, we applied multiple logistic regression. The Mann–Whitney test and Spearman's test were used to compare anti‐A presence/absence and anti‐NP (IgM, IgG and IgA) among groups.
Data were organized in Microsoft Excel 2010 and were analysed using Statistical Package for Social Sciences (SPSS) (Chicago, IL) or GraphPad Prism version 8.0 for Windows, GraphPad Software (La Jolla, CA, USA). A P‐value <0·05 was considered significant.
Results
We had age, sex and blood type of all 430 COVID‐19 individuals (268 CCPD and 162 CIP) and 2212 healthy volunteer blood donors (control group: CG) However, as they were from a retrospective cohort, the anti‐NP and nAbs were available in only 295 of the COVID‐19 persons. Table 1 shows the distribution, mean age, sex and blood type among groups. Although blood type O most frequent among blood donors, type A was more common in the COVID‐19 group. There was no statistical difference in blood type distribution between CCPD and CIP.
Table 1.
Demographic data from subjects included in the study
| Variable | Blood donors (CG) | CCPD | CIP | P |
|---|---|---|---|---|
| (N = 2212) | (N = 268) | (N = 162) | ||
| Age a (years; Mean ± SD) | 37·5 ± 12·0 | 36·8 ± 8·1 | 69·3 ± 15·7 | <0·001 |
| Gender, n (%) b | ||||
| Female | 1004 (45·4) | 103 (38·4) | 59 (36·4) | 0·012 |
| Male | 1208 (54·6) | 165 (61·6) | 103 (63·6) | |
| Blood group, n (%) b | ||||
| A | 785 (35·5) | 128 (47·8) | 70 (43·2) | <0·001 |
| AB | 84 (3·8) | 11 (4·1) | 7 (4·3) | |
| O | 1117 (50·5) | 103 (38·4) | 59 (36·4) | |
| B | 226 (10·2) | 26 (9·7) | 26 (16·1) | |
CCPD, COVID‐19 convalescent plasma donors; CG, control group; CIP, COVID‐19 inpatients; N, number of participants.
ANOVA.
Chi‐Square.
Age and male sex were positively related to COVID‐19 (OR = 1·06, 95% CI: 1·05–1·06; P < 0·001 and OR = 1·27, 95%CI: 1·02–1·59; P = 0·035 respectively). However, the presence of circulating anti‐A (O/B group) showed a protective effect against COVID‐19 (OR = 0·62, 95% CI: 0·50–0·78; P < 0·001), as shown in Table 2.
Table 2.
Multivariate logistic regression for COVID‐19 individuals (n = 430) and blood donors (CG) (n = 2212)
| Variable | OR | 95% CI | P | |
|---|---|---|---|---|
| Lower | Upper | |||
| Age (years) | 1·06 | 1·05 | 1·06 | <0·001 |
| Gender (male) | 1·27 | 1·02 | 1·59 | 0·035 |
| Anti‐A (O/B) | 0·62 | 0·50 | 0·78 | <0·001 |
CG, control group; CI, confidence interval, OR, odds ratio.
Age and male gender were positively related to COVID‐19 (OR = 1·06, 95% CI: 1·05–1·06; P < 0·001 and OR = 1·27, 95%CI: 1·02–1·59; P = 0·035 respectively). The presence of circulating anti‐A (O/B group) showed a protective factor to COVID‐19 (OR = 0·62, 95% CI; 0·50–0·78; P < 0·001).
In order to evaluate the association of circulating anti‐A with COVID‐19 severity, we compared CCPD and CIP to the CG. Belonging to the O/B group was protective only for CCPD, as shown in Fig. 1 (OR = 0·60, 95% CI: 0·45–0·75 P < 0·001).
Fig. 1.
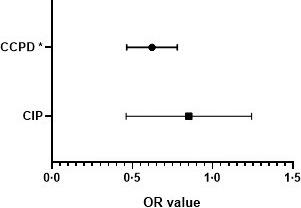
Odds ratio (OR) for CIP and CCPD compared to blood donors (CG), considering O/B vs. A/AB groups. Legend: O/B group was identified as a protective factor only for CCPD (OR = 0·60, 95% CI: 0·45–0·75), whereas for CIP this effect was not identified (OR = 0·85, 95% CI: 0·45–1·25). Multivariate logistic regression; CCPD, COVID‐19 convalescent plasma donors; CIP, COVID‐19 inpatients; *P < 0·001.
As type O persons usually have higher anti‐A titre, we also performed a sub‐analysis for O vs. B blood, as shown in Table 3.
Table 3.
Multivariate logistic regression analysis for O vs. B blood groups, comparing COVID‐19 patients and blood donors (CG)
| Variable | OR | 95% CI | P | |
|---|---|---|---|---|
| Lower | Upper | |||
| Age (years) | 1·05 | 1·04 | 1·06 | <0·001 |
| Gender (male) | 1·34 | 0·99 | 1·82 | 0·062 |
| Anti‐A (O/B) | 0·66 | 0·46 | 0·95 | 0·026 |
CI, confidence interval; OR, odds ratio.
COVID‐19 patients O blood group (n = 103), COVID‐19 patients B blood group (n = 26), Blood donors O group (n = 1117), Blood donors B group (n = 226). Age was positively related to COVID‐19 (OR = 1·05, 95% CI: 1·04–1·06; P < 0·001) and the presence of a higher titre of circulating anti‐A (O group) showed a protective factor to COVID‐19 (OR = 0·66, 95% CI: 0·46–0·95; P = 0·026).
Bold indicates statistical significant values (P < 0·05).
Age was positively related to COVID‐19 (OR = 1·05, 95% CI: 1·04–1·06; P < 0·001). Sex did not show any association to COVID‐19 between these groups. However, a higher titre of circulating anti‐A (O group) was protective against COVID‐19 (OR = 0·66, 95% CI: 0·46–0·95; P = 0·026).
Additionally, we analysed whether anti‐NP was associated with the presence of anti‐A. We included 295 subjects from the COVID‐19 group (148 from O/B group and 147 in the A/AB group). Figure 2 shows the distribution of anti‐NP between the groups. The O/B group showed lower median IgM, IgG and IgA levels than for A/AB (0·16 vs. 0·19; P = 0·03, 2·11 vs. 2·55; P = 0·02, 0·23 vs. 0·32; P = 0·03, respectively).
Fig. 2.
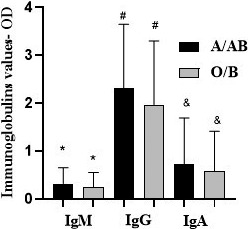
COVID‐19 individuals (n = 295) IgM, IgG, and IgA distribution between A/AB and O/B groups. Legend: O/B group showed an IgM, IgG and IgA median level lower when compared to A/AB (0·16 vs. 0·19; *P = 0·03, 2·11 vs. 2·55; # P = 0·02, 0·23 vs. 0·32; & P = 0·03, respectively).Mann–Whitney test.
Figure 3 shows the nAb distribution analysis. As the samples' value varies from <1:20 to >1:5120, we divided the nAb titres into two groups: <320 and ≥320 (320 as the middle cut‐off point for the reaction range). Patients of types O or B showed a lower trend of neutralizing antibody value and lower frequencies when the titres were higher than 320 (chi‐square test = 6·99, P = 0·008). The results are shown in Table 4.
Fig. 3.
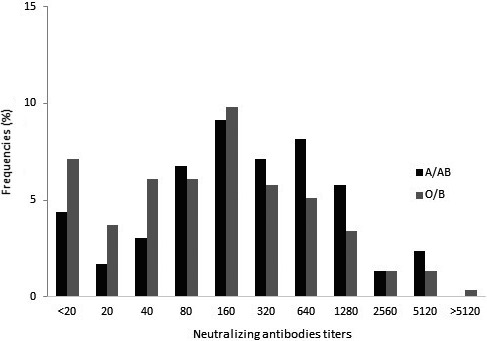
Distribution of the frequencies of COVID‐19 individuals (n = 295) neutralizing antibodies between A/AB and O/B groups. Legend: O/B group showed a neutralizing antibody lower value trend and lower frequencies when the titres were higher than 320.
Table 4.
Distribution of COVID‐19 individuals (n = 295) neutralizing antibody (nAb) titres in two groups: <320 and ≥320
| ABO Group | nAb titres | χ2 | P | OR (95% CI) | |
|---|---|---|---|---|---|
| <320 | ≥320 | ||||
| O/B | 97 (65·5) | 51 (34·5) | 6·99 | 0·008 | 0·53 (0·33‐ 0·85)* |
| A/AB | 74 (50·3) | 73 (49·7) | |||
O/B COVID‐19 individuals had a lower chance of having values ≥320.
0·54 (0·34; 0·87), when adjusted by age and gender.
There was an evident linear correlation between anti‐NP (IgA, IgG and IgM) and nAbs according to the Spearman's correlation test (all P < 0·0001), as shown in Fig. 4. We identified a better correlation between IgG and nAbs for both O/B and A/AB groups (r = 0·687 in O/B and r = 0·640 in A/AB). IgM and IgA did not show such good correlations (O/B group IgA r = 0·593; IgM r = 0·430 and A/AB group IgA r = 0·555; IgM r = 0·457).
Fig. 4.
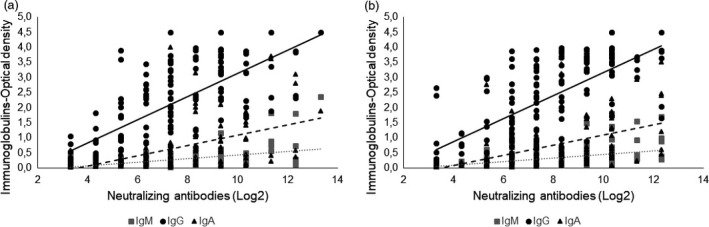
Linear correlation among COVID‐19 individuals (n = 295) immunoglobulins and neutralizing antibody titres (Log2), into the group A/AB (a) and O/B (b). Legend: Spearman correlation for A/AB group (left) and for O/B group (right). A better correlation between IgG and neutralizing antibodies was found in both O/B and A/AB (r = 0·687 in O/B and r = 0·640 in A/AB). IgM and IgA did not show such good correlations (O/B group IgA r = 0·593; IgM r = 0·430 and A/AB group IgA r = 0·555; IgM r = 0·457).
Discussion
The ABO system can be associated with the inflammatory response and has a varied geographical frequency, with growing evidence that it can affect the predisposition to certain diseases, such as thrombosis or H. pylori infection [7]. A meta‐analysis recently determined the odds of SARS‐CoV‐2 positive individuals of having a specific blood type compared with controls. The association of SARS‐CoV‐2 with blood type A was significant with a pooled OR of 1·23 (95%CI: 1·09–1·40), although the random‐effect meta‐analysis revealed a considerable heterogeneity among studies [16]. Despite our first‐time volunteer blood donors being mainly of type O, this was not the most prevalent type among COVID‐19 patients. This finding is similar to previous studies that reported ABO blood group association with SARS‐CoV in 2003 [11] and with SARS‐CoV‐2, in 2020 [4, 17, 18]. One possible mechanism is that blood types A and B have sugars crucial to the O‐glycosidic target, functioning as a possible site for binding the virus to the host [19].
As previously proposed, the presence of anti‐A, and not the blood type, could be associated with the susceptibility to SARS‐CoV‐2 infection [6], although future studies must prove this assumption. Our results are similar, with a statistical difference between groups of patients with anti‐A (B/O) and without anti‐A (A/AB). Moreover, we showed a greater protective effect of type O compared with B subjects, suggesting that anti‐A from the former might be more effective. Our data suggest that higher anti‐A titres could improve the host defence. It is a plausible argument, since type B produces lower titres of anti‐A [10].
Our findings are similar to previously reported studies that group O was associated with a lower risk of infection than non‐O blood types [4]. We did not find any statistically significant difference between CCPD donors and COVID inpatients (CIP), like other studies [18] that did not identify any relationship between blood type and intubation or death rate. In contrast, one study in China found fewer cardiovascular diseases and lesser severity in the O group [17].
Our study's primary limitation is the control group used: voluntary first‐time blood donors from a single hospital. In Brazil, data regarding blood type belong to local centres, and data for the Brazilian population as a whole are unsatisfactory. Few papers show the prevalence of type O among Caucasians, mixed race and Afro‐descendants (46·5%, 53·2% and 47·9%, respectively) followed by A‐type (39·4%, 29·6% and 31·9% respectively) [20]. Our control group was similar to the ABO blood type distribution in Brazil, supporting our findings. Moreover, only voluntary first‐time blood donors were included in the control group to avoid possible bias for over‐representing any blood type in repeat donors.
The ABO type could be involved in the S protein SARS‐CoV and SARS‐CoV‐2 cell‐binding mechanism [12, 19]. Genetic research also has increased in this area. Genome‐wide association analysis in an Italian‐Spanish group showed that A‐positive people are at higher risk of respiratory failure in COVID‐19, due to the rs657152 A/C single nucleotide polymorphism at 9q34.2. Also, some procoagulant markers are associated with genetic variation at the ABO locus, and this region could have a role in modifying genes [21].
Curiously, when we evaluated specific immunoglobulin production, we found a statistically significant difference for IgM, IgG and IgA results, with median values lower in the O/B group. Similarly, neutralizing antibody titres were lower in the O/B group.
This is one of the few studies that analyse a possible correlation between humoral response for SARS‐CoV‐2 and ABO group. In that way, even though we did not observe a statistical difference between the groups CCPD and CIP concerning severity, the profile of increased humoral immune response in A/AB patients is an intriguing question and may be related to other factors, such as the clinical evolution and progression of the disease. Our study did not correlate clinical status and level of IgM, IgG, IgA anti‐NP or nAb titres; thus, this parameter correction for ABO status may be biased.
IgA is an immune barrier and can probably neutralize SARS‐CoV‐2 before the virus reaches and binds to the epithelial cells. This has taken on increased importance recently. IgM and IgG levels have a potential role in the evaluation of severity and prognosis of COVID‐19 [22]. In 37 patients, IgA and IgG levels were markedly higher (P < 0·001) in patients with severe disease compared with mild disease, while there was no difference in IgM level [23]. Additionally, in a two‐year prospective study, IgG antibody and NAb titres were positively correlated in SARS‐CoV [24]. However, we did not find any research correlating IgM and IgA, especially in SARS‐CoV‐2 infections. Future longitudinal studies can show if blood groups interfere with protection antibodies, including the long‐term immune response.
The impact of anti‐A isohemagglutinin titres in the SARS‐CoV‐2 infection and its association with neutralizing antibodies is not clear [25]. In our retrospective study, we could not measure the quantitative effect of anti‐A. Further studies are required to evaluate both anti‐A isohemagglutinin and neutralizing antibody titres, and their role in SARS‐CoV‐2 infection.
Conclusion
Blood types O and B, which produce anti‐A, showed a protective effect against SARS‐CoV‐2 infection. There was no statistical difference between COVID‐19 inpatients and COVID‐19 convalescent plasma donors, suggesting that blood types do not associate with COVID‐19 severity. Moreover, COVID‐19 individuals from types O and B had lower titres of neutralizing antibodies and lower levels of IgM, IgG and IgA anti‐nucleocapsid antibodies than did the types A and AB.
Conflict of interests
The authors declare no conflict of interests.
Author contributions
Conceptualization – VFD, CBB, APHY, SW, JMK; Investigation – VFD, CBB, APHY, NH, JRRP, RFW, RMF, RRGM, GC, AS, RA, PS, DBA, CPS, ELD, MA, VN, SW, JMK. Formal analysis – VFD, CBB, APHY, SW, JMK; Resources – LFLR, LVR; Writing – VFD, CBB, APHY, SW, JMK. Project administration and funding acquisition – LFR, LVR.
Acknowledgements
C.P.S. is funded by Grant 2018/23680‐0 (Fundação de Amparo à Pesquisa do Estado de São Paulo); D.B.A. by Grant 88 887.131387/2016‐00 (Coordenação de Aperfeiçoamento Pessoal de Nível Superior ‐ CAPES), R.R.G.M. by Grant 2017/24769‐2 (Fundação de Amparo à Pesquisa do Estado de São Paulo) and E.L.D. by Grants 2016/20045‐7 and 2020/06409‐1 (Fundação de Amparo à Pesquisa do Estado de São Paulo). This project was partially supported by the initiative ‘Todos Pela Saúde ‐ Fundação Itaú para Educação e Cultura’.
References
- 1. Dong E, Du H, Gardner L. An interactive web‐based dashboard to track COVID‐19 in real time. Lancet Infect Dis 2020;20:533–4. [DOI] [PMC free article] [PubMed] [Google Scholar]
- 2. Frater JL, Zini G, d’Onofrio G, et al. COVID‐19 and the clinical hematology laboratory. Int J Lab Hematol 2020;2:11–8. [DOI] [PMC free article] [PubMed] [Google Scholar]
- 3. Caussy C, Pattou F, Wallet F, et al. Prevalence of obesity among adult inpatients with COVID‐19 in France. Lancet Diabetes Endocrinol 2020;8:562–4 [DOI] [PMC free article] [PubMed] [Google Scholar]
- 4. Zhao J, Yang Y, Huang H‐P, et al. Relationship between the ABO Blood Group and the COVID‐19 susceptibility. medRxiv. Published online 2020;2020.03.11.20031096. 10.1101/2020.03.11.20031096 [DOI] [Google Scholar]
- 5. Zaidi FZ, Zaidi ARZ, Abdullah SM, et al. COVID‐19 and the ABO blood group connection. Transfus Apher Sci 2020;59:102838. [DOI] [PMC free article] [PubMed] [Google Scholar]
- 6. Gérard C, Maggipinto G, Minon J‐M. COVID‐19 & ABO blood group: another viewpoint. Br J Haematol 2020;39:62–3. [DOI] [PMC free article] [PubMed] [Google Scholar]
- 7. Franchini M, Bonfanti C. Evolutionary aspects of ABO blood group in humans. Clin Chim Acta 2015;444:66–71. [DOI] [PubMed] [Google Scholar]
- 8. Yamamoto F, Cid E, Yamamoto M, et al. An integrative evolution theory of histo‐blood group ABO and related genes. Sci Rep 2014;4:1–12. [DOI] [PMC free article] [PubMed] [Google Scholar]
- 9. Breiman A, Ruvën‐Clouet N, Le Pendu J. Harnessing the natural anti‐glycan immune response to limit the transmission of enveloped viruses such as SARS‐CoV‐2. PLoS Pathog 2020;16:e1008556. [DOI] [PMC free article] [PubMed] [Google Scholar]
- 10. Kang SJ, Lim YA, Baik SY. Comparison of ABO antibody titers on the basis of the antibody detection method used. Ann Lab Med 2014;34:300–6. [DOI] [PMC free article] [PubMed] [Google Scholar]
- 11. Cheng Y, Cheng G, Chui CH, et al. ABO blood group and susceptibility to severe acute respiratory syndrome. JAMA. 2005;293:1450–1. [DOI] [PubMed] [Google Scholar]
- 12. Guillon P, Clément M, Sébille V, et al. Inhibition of the interaction between the SARS‐CoV Spike protein and its cellular receptor by anti‐histo‐blood group antibodies. Glycobiology 2008;18:1085–93. [DOI] [PMC free article] [PubMed] [Google Scholar]
- 13. Corman VM, Landt O, Kaiser M, et al. Detection of 2019 ‐nCoV by RT‐PCR. Euro Surveill 2020;25:1–8. [DOI] [PMC free article] [PubMed] [Google Scholar]
- 14. Araujo DB, Machado RRG, Amgarten DE, et al. SARS‐CoV‐2 isolation from the first reported patients in Brazil and establishment of a coordinated task network. Mem Inst Oswaldo Cruz. 2020;115. 10.1590/0074-02760200342 [DOI] [PMC free article] [PubMed] [Google Scholar]
- 15. Wendel S, Kutner JM, Machado R, et al. Screening for SARS‐CoV‐2 antibodies in convalescent plasma in Brazil: preliminary lessons from a voluntary convalescent donor program. Transfusion 2020. 10.1111/trf.16065 [DOI] [PMC free article] [PubMed] [Google Scholar]
- 16. Golinelli D, Boetto E, Maietti E, et al. The association between ABO blood group and SARS‐CoV‐2 infection: a meta‐analysis. PLoS One 2020;15(9):e0239508. [DOI] [PMC free article] [PubMed] [Google Scholar]
- 17. Dai X. ABO blood group predisposes to COVID‐19 severity and cardiovascular diseases. Eur J Prev Cardiol 2020;27:1436–7. [DOI] [PMC free article] [PubMed] [Google Scholar]
- 18. Zietz M, Tatonetti NP. Testing the association between blood type and COVID‐19 infection, intubation, and death. medRxiv 2020;2020.04.08.20058073. 10.1101/2020.04.08.20058073 [DOI] [PMC free article] [PubMed] [Google Scholar]
- 19. Arend P. How SARS‐CoV‐2 (COVID‐19) may invade the human body via ABO(H) blood group‐determining carbohydrates: a. perspective. 2020;2(May):17. 10.20944/PREPRINTS202005.0097.V1 [DOI] [PMC free article] [PubMed]
- 20. Novaretti MCZ, Dorlhiac‐Llacer PE, Chamone DAF. Estudo de grupos sangüíneos em doadores de sangue caucasóides e negróides na cidade de São Paulo. Rev Bras Hematol Hemoter 2000;22:23–32. [Google Scholar]
- 21. Ellinghaus D, Degenhardt F, Bujanda L, et al. Genomewide association study of severe Covid‐19 with respiratory failure. N Engl J Med 2020;383:1522–34. [DOI] [PMC free article] [PubMed] [Google Scholar]
- 22. Hou H, Wang T, Zhang B, et al. Detection of IgM and IgG antibodies in patients with coronavirus disease 2019. Clin Transl Immunol 2020;9:1–8. [DOI] [PMC free article] [PubMed] [Google Scholar]
- 23. Yu H, Sun B, Fang Z, et al. Distinct features of SARS‐CoV‐2‐specific IgA response in COVID‐19 patients. Eur Respir J 2020;56:2001526. [DOI] [PMC free article] [PubMed] [Google Scholar]
- 24. Liu W, Fontanet A, Zhang PH, et al. Two‐year prospective study of the humoral immune response of patients with severe acute respiratory syndrome. J Infect Dis 2006;193:792–5. [DOI] [PMC free article] [PubMed] [Google Scholar]
- 25. Daniele F. Anti‐A Isohemagglutinin titers and SARS‐CoV2 neutralization: implications for children and convalescent plasma selection. Br J Haematol 2020;190:e148–50. [DOI] [PMC free article] [PubMed] [Google Scholar]