

Abstract
Background/Objectives
Frailty has been linked to increased risk of COVID‐19 mortality, but evidence is mainly limited to hospitalized older individuals. This study aimed to assess and compare predictive abilities of different frailty and comorbidity measures for COVID‐19 mortality in a community sample and COVID‐19 inpatients.
Design
Population‐based cohort study.
Setting
Community.
Participants
We analyzed (i) the full sample of 410,199 U.K. Biobank participants in England, aged 49–86 years, and (ii) a subsample of 2812 COVID‐19 inpatients with COVID‐19 data from March 1 to November 30, 2020.
Measurements
Frailty was defined using the physical frailty phenotype (PFP), frailty index (FI), and Hospital Frailty Risk Score (HFRS), and comorbidity using the Charlson Comorbidity Index (CCI). PFP and FI were available at baseline, whereas HFRS and CCI were assessed both at baseline and concurrently with the start of the pandemic. Inpatient COVID‐19 cases were confirmed by PCR and/or hospital records. COVID‐19 mortality was ascertained from death registers.
Results
Overall, 514 individuals died of COVID‐19. In the full sample, all frailty and comorbidity measures were associated with higher COVID‐19 mortality risk after adjusting for age and sex. However, the associations were stronger for the concurrent versus baseline HFRS and CCI, with odds ratios of 20.40 (95% confidence interval = 16.24–25.63) comparing high (>15) to low (<5) concurrent HFRS risk category and 1.53 (1.48–1.59) per point increase in concurrent CCI. Moreover, only the concurrent HFRS or CCI significantly improved predictive ability of a model including age and sex, yielding areas under the receiver operating characteristic curve (AUC) >0.8. When restricting analyses to COVID‐19 inpatients, similar improvement in AUC was not observed.
Conclusion
HFRS and CCI constructed from medical records concurrent with the start of the pandemic can be used in COVID‐19 mortality risk stratification at the population level, but they show limited added value in COVID‐19 inpatients.
Keywords: aging, comorbidity, COVID‐19, frailty, mortality
Key Points
Hospital Frailty Risk Score (HFRS) and Charlson Comorbidity Index (CCI) had good predictive accuracies for COVID‐19 mortality in a community sample, but not in hospitalized COVID‐19 patients, supporting their utility in risk assessment at the population level
Equally accurate predictions were obtained by adding either the concurrent HFRS or CCI to a model with age and sex, yielding areas under the receiver operating characteristic curves >0.8
Stronger associations between HFRS and COVID‐19 mortality were found in the younger‐old (<65 years) compared to older‐old individuals (≥75 years), indicating that the relative risk carried by higher frailty scores is greater at younger ages
Why Does this Paper Matter?
Frailty and comorbidity measures constructed from routinely collected medical records had good predictive abilities for COVID‐19 mortality and provided added value beyond age and sex at the population level, which could aid in mortality risk stratification to mitigate the impact of COVID‐19.
INTRODUCTION
Coronavirus disease 2019 (COVID‐19), caused by the severe acute respiratory syndrome coronavirus 2 (SARS‐CoV‐2), has led to a global pandemic, affecting >100 million individuals and causing ~2 million deaths worldwide as of January 31, 2021. 1 Accumulating evidence has shown that older age, male sex, comorbidities (e.g. diabetes mellitus, hypertension), and laboratory indicators (e.g. elevated levels of d‐dimer, interleukin 6) are risk factors for COVID‐19‐associated mortality. 2 , 3 , 4 However, there are relatively few data available for risk stratification in community samples compared to hospitalized patients. With the continuing spread of the SARS‐CoV‐2 across the world, there is an urgent need to identify the strongest determinants of COVID‐19 mortality to target the high‐risk groups in the general population and mitigate the impact of COVID‐19.
Frailty, characterized as a state of increased vulnerability due to cumulative decline in multiple physiological systems, 5 has consistently shown to be a strong predictor of mortality in the general population. 6 , 7 Various scales have been developed for measuring frailty, some of which require in‐person assessment by a trained healthcare professional. One example is the Clinical Frailty Scale (CFS), 8 that is frequently used in clinical settings. Other widely used measures include the physical frailty phenotype (PFP), which defines frailty as a clinical syndrome associated with unintentional weight loss, exhaustion, slowness, low physical activity, and weakness; 9 and the frailty index (FI), which is a multidimensional measure of frailty and defined as a ratio of accumulated deficits over the total number of deficits considered. 10 The Hospital Frailty Risk Score (HFRS), constructed based on International Statistical Classification of Diseases and Related Health Problems, Tenth Revision (ICD‐10) codes, 11 was developed for frailty risk stratification among older hospitalized patients and has been validated for its ability to predict adverse outcomes in various hospital settings. 12 , 13
A growing number of studies have investigated the association between frailty, frequently measured using the CFS, and mortality among COVID‐19 patients in hospital settings, most of which suggested that frailty may add to the risk prediction in hospitalized patients, 14 , 15 , 16 , 17 although some studies observed only weak, 18 , 19 or even null associations. 20 Some inconsistencies in prior results may partly be owing to the COVID‐19 patients being a non‐random, selected sample with a particularly high prevalence of frailty, 21 potentially causing a selection bias. 22 For community samples, a recently published study in the U.K. Biobank observed that frailty measured using the PFP or FI at baseline assessment during 2006–2010 was associated with elevated risks of COVID‐19‐associated hospitalizations and deaths. 23 However, as these frailty measures were assessed approximately a decade ago before the COVID‐19 pandemic, they may not fully reflect one's current physiological status as frailty can change across the adult lifespan. 24 Moreover, the PFP and FI may be of limited use outside research settings as they cannot be constructed from patients' medical records. Lastly, it has not been studied whether equally accurate predictions can be obtained using easily accessible comorbidity indices, such as the Charlson comorbidity index (CCI). It is thus important to assess whether COVID‐19 mortality can be accurately predicted using concurrent frailty and comorbidity measures, such as the HFRS and CCI that can be derived from medical records at any given time, with minimal computing skills and without the need of advanced statistical programs.
In this study, our overarching goal was to assess whether an easily accessible frailty and/or comorbidity measure could aid in COVID‐19 mortality risk stratification and provide added value beyond demographic predictors, such as age and sex in community settings. Using the large population‐based U.K. Biobank cohort, we aimed to investigate and compare the predictive abilities of frailty, measured using the PFP, FI, and HFRS, and comorbidity measured using the CCI for COVID‐19 mortality in (i) the overall community population and (ii) COVID‐19 inpatients. Such comparisons are currently lacking, yet of importance as selected samples, such as hospitalized COVID‐19 patients are likely to differ in many characteristics from the overall population. Lastly, in keeping with the observations that higher frailty levels carry a relatively greater risk of all‐cause mortality in younger than older ages, 6 , 7 we additionally assessed whether the same holds true for COVID‐19 mortality. As excess mortality due to COVID‐19 may be more pronounced in younger and fitter individuals compared to old and frail, 20 it is essential to identify the factors contributing to the risk.
METHODS
Study population
This is a population‐based cohort study using data from the U.K. Biobank. Between 2006 and 2010, more than 500,000 participants completed a touch‐screen questionnaire, had physical measurements taken, and provided biological samples at one of the 22 assessment centers in England, Scotland or Wales. 25 The U.K. Biobank study was approved by the North West Multi‐Centre Research Ethics Committee. All participants provided written informed consent for data collection, analysis, and record linkage.
Three data sources related to COVID‐19 have been linked to the U.K. Biobank: laboratory test results, inpatient medical records, and death register. SARS‐CoV‐2 polymerase chain reaction (PCR) test results were provided by Public Health England, 26 with data available in England between March 16 and November 30, 2020. Hospital inpatient data were sourced from the Hospital Episode Statistics (HES), containing electronic medical records (i.e., ICD‐10 codes) for all hospital admissions to National Health Service (NHS) hospitals in England up to November 30, 2020. Death register data covered all deaths in the U.K. Biobank population up until November 30, 2020, containing ICD‐10 codes assigned as individuals' primary and contributory causes of death.
Since PCR test results were only available in England, 26 we excluded individuals who had attended baseline assessment in Wales and Scotland. Participants who died before March 1, 2020, requested to withdraw from the study before August 2020, and had missing data on baseline PFP or FI were also excluded. This resulted in a sample size of n = 410,199, which we refer to as the “full sample.” The subgroup of “COVID‐19 inpatients” (n = 2812) consisted of those who were recorded as hospitalized COVID‐19 patients. Analyses were performed analogously in both samples (Figure S1).
COVID‐19 diagnosis and mortality
Participants were considered as “COVID‐19 positive” when meeting at least one of the following criteria: (i) being positive in at least one of the PCR tests; (ii) shown as COVID‐19 inpatients, with ICD‐10 code U07 in hospital admission; and (iii) died of COVID‐19, defined as those with COVID‐19 (ICD‐10 code U07) as the primary or contributory causes of death. Of note, COVID‐19 positive individuals identified using this definition can be considered as severe cases as COVID‐19 testing in the UK was largely restricted to hospitalized individuals during the first phases of the pandemic. Subsequently, we further selected a subsample of “COVID‐19 inpatients,” defined as those with positive PCR test results and with origin of the tests labeled as “inpatient,” and/or those with COVID‐19 shown in the hospital admission records. COVID‐19 mortality, as ascertained from death register, was used as the main outcome in the analyses.
Frailty and comorbidity measures
Frailty was assessed using the PFP, FI, and HFRS, and comorbidity was measured using the CCI. The PFP and FI were available only at baseline during 2006–2010, while the HFRS and CCI were available both at baseline and at the time of the start of the pandemic, with a 2‐year look back period between 2018 and 2020 (Figure S2).
A modified PFP has previously been created by Hanlon et al. for U.K. Biobank participants, 27 based on the five frailty criteria in the original Fried PFP. 9 Weight loss, exhaustion, slowness, and low physical activity were self‐reported from baseline questionnaire, while weakness was assessed by measured grip strength at baseline, where the higher value of the right‐ and left‐hand measurements were used in analysis (Table S1).
The FI has previously been created according to the Rockwood deficit accumulation model 10 and validated by us for U.K. Biobank participants, using 49 self‐reported frailty items assessed at baseline during 2006–2010 that cover a wide range of items for physical and mental well‐being (Table S2). 7 The FI was calculated as the sum of items (deficits) present in an individual divided by the total (e.g., an individual with seven deficits of the 49 would receive an FI of 7/49 = 0.14). The FI was categorized into relatively fit (≤0.03), less fit (>0.03–0.1), least fit (>0.1–0.21), and frail (>0.21). 24
The HFRS and CCI were computed based on ICD‐10 codes from hospital records. 11 , 28 Baseline scores were calculated using diagnoses during 2006–2010, while concurrent scores were calculated using diagnoses in the prior 2 years before the COVID‐19 pandemic (i.e., between March 1, 2018 and February 29, 2020). As previously described by Gilbert et al., each of the 109 frailty‐related ICD‐10 codes were assigned a weight ranging from 0.1 to 7.1, depending on its strength of the association with frailty (Table S3). 11 The HFRS was then calculated by summing all the weighted codes, and categorized into low (<5), intermediate (5‐15) and high (>15) risk of frailty. 11 Similarly, the CCI was derived by summing weighted ICD‐10 codes of 17 comorbidities, with weights ranging from 1 to 6 depending on disease severity and mortality risk (Table S4), 28 and was treated as a continuous variable in all analyses. Individuals who had missing hospital data were likely to be younger and healthier, and never been hospitalized (Table S5). They were thus considered free from frailty and comorbidity, and were coded as 0 for HFRS and CCI.
Other study variables
Demographic characteristics and socioeconomic indicators were collected at baseline during 2006–2010. Education was assessed by the highest self‐reported qualification and categorized into low (no relevant qualifications), intermediate (A levels, O levels/GCSEs, CSEs, NVQ/HND/HNC, other professional qualifications) and high (college or university degree). Annual household income was self‐reported and categorized into four groups (<£18,000, £18,000–30,999, £31,000–51,999, ≥£52,000). Townsend deprivation index was derived from national census data regarding unemployment, car ownership, home ownership, and household overcrowding; higher scores correspond to higher levels of socioeconomic deprivation.
Statistical analyses
Descriptive statistics were calculated for the full sample, COVID‐19 positive individuals, and COVID‐19 inpatients. Due to the apparent over‐representation of frail individuals among COVID‐19 patients, we performed logistic regression to formally ascertain if frailty and comorbidity were determinants for being COVID‐19 positive and COVID‐19 inpatient.
In both samples, odds ratios (OR) with 95% confidence intervals (CI), in multivariate logistic regression models were used to investigate the associations of the different frailty and comorbidity measures with COVID‐19 mortality, adjusted for age (as linear effect, after confirming that the age‐mortality relationship was approximately linear) and sex. Ethnicity, smoking status, and socioeconomic variables were subsequently added into the models to test whether they had an effect on the associations. Areas under the receiver operating characteristic curves (AUC) were used to assess the predictive accuracies of the different measures. Because the HFRS was originally designed for individuals older than 75 years and previous studies have reported age‐varying risks for frailty, 6 , 7 we stratified the analysis by age (<65, 65–74, and ≥75 years) and presented the results in terms of OR, absolute risk, and absolute risk difference, as well as performed an analysis with an interaction term between HFRS and age as continuous variables. With these approaches, we aimed to discern whether the risk carried by higher frailty is age‐varying. As a sensitivity analysis to assess the robustness of our findings, we performed multinomial logistic regression models to account for non‐COVID‐19 deaths as competing risk, where mortality due to COVID‐19 or other causes than COVID‐19 were compared to those who were alive as of November 30, 2020.
Multicollinearity was inspected in all regression models using variance inflation factors. To account for multiple comparisons, the Benjamini‐Hochberg false discovery rate method was applied. 29 All analyses were performed using Stata v16.0 (Stata Corp, College Station, TX) and R v3.6.3 (R Foundation for Statistical Computing, Vienna, Austria).
RESULTS
Sample characteristics
In the full sample of 410,199 participants, the mean age as of January 2020 was 67.6 (standard deviation 8.1) and 55.1% were women (Table 1). During the study period between March 1 and November 30, 2020, 7590 (1.9%) and 2812 (0.7%) individuals were identified as COVID‐19 positive and COVID‐19 inpatient, respectively. The overall mortality rate was 0.8% in the full sample and 19.0% in COVID‐19 inpatients. A total of 514 individuals died of COVID‐19; and among COVID‐19 inpatients who died, 118 (22.1%) died of other causes. The proportions of the oldest age group, men, Black ethnicity, smokers, low education, lowest income and most deprived groups were all higher in COVID‐19 inpatients than in the full sample. The correlations across the different frailty (PFP, FI, and HFRS) and comorbidity (CCI) measures, as well as within the measures across time (baseline vs concurrent HFRS and CCI), were small‐to‐moderate (Spearman's correlations 0.12–0.55) (Table S6). Frailty seemed to be over‐represented among COVID‐19 inpatients compared to the full sample (baseline PFP = 9.2% vs 3.4% frail; baseline FI = 24.9% vs 11.7% frail; concurrent HFRS = 11.4% vs 0.9% high risk). Logistic regression models also showed that all the baseline and concurrent frailty and comorbidity measures were associated with higher risk of being COVID‐19 positive and being COVID‐19 inpatient, after adjusting for age and sex (Table S7).
TABLE 1.
Characteristics of the full sample, COVID‐19 positive cases and COVID‐19 inpatients from the U.K. Biobank
| Characteristic | Full sample (n = 410,199) | COVID‐19 positive (n = 7590) a | COVID‐19 inpatients (n = 2812) a |
|---|---|---|---|
| Deaths, n (%) | 3186 (0.8) | 641 (8.5) | 535 (19.0) |
| COVID‐19 deaths | 514 (0.1) | 514 (6.8) | 417 (14.8) |
| Other deaths | 2672 (0.7) | 127 (1.7) | 118 (4.2) |
| Age (year), mean ± SD | 67.6 ± 8.1 | 65.8 ± 8.8 | 69.2 ± 8.7 |
| Age category, n (%) | |||
| <65 | 152,651 (37.2) | 3703 (48.8) | 909 (32.3) |
| 65–74 | 169,648 (41.4) | 2328 (30.7) | 947 (33.7) |
| ≥75 | 87,900 (21.4) | 1559 (20.5) | 956 (34.0) |
| Sex, n (%) | |||
| Female | 226,018 (55.1) | 3832 (50.5) | 1267 (45.1) |
| Male | 184,181 (44.9) | 3758 (49.5) | 1545 (54.9) |
| Ethnicity, n (%) | |||
| White | 385,357 (94.3) | 6971 (92.1) | 2534 (90.6) |
| Asian | 9731 (2.4) | 290 (3.8) | 117 (4.2) |
| Black | 7277 (1.8) | 174 (2.3) | 93 (3.3) |
| Others | 6441 (1.6) | 133 (1.8) | 54 (1.9) |
| Smoking status, n (%) | |||
| Never | 227,576 (55.7) | 3861 (51.1) | 1235 (44.3) |
| Previous | 141,199 (34.5) | 2819 (37.3) | 1182 (42.4) |
| Current | 40,011 (9.8) | 874 (11.6) | 374 (13.4) |
| Education, n (%) | |||
| Low | 65,293 (16.0) | 1658 (22.1) | 834 (30.1) |
| Intermediate | 207,004 (51.0) | 4086 (54.5) | 1348 (48.6) |
| High | 133,902 (33.0) | 1755 (23.4) | 592 (21.3) |
| Income, n (%) | |||
| <£18,000 | 76,158 (21.7) | 1697 (26.1) | 852 (36.9) |
| £18,000–30,999 | 89,104 (25.3) | 1605 (24.7) | 592 (25.6) |
| £31,000–51,999 | 92,967 (26.4) | 1741 (26.7) | 497 (21.5) |
| ≥£52,000 | 93,379 (26.6) | 1467 (22.5) | 371 (16.1) |
| Townsend deprivation quintile, n (%) | |||
| 1 (least deprived) | 82,356 (20.1) | 1199 (15.8) | 391 (13.9) |
| 2 | 83,744 (20.4) | 1340 (17.7) | 458 (16.3) |
| 3 | 82,668 (20.2) | 1498 (19.8) | 506 (18.0) |
| 4 | 82,102 (20.0) | 1585 (20.9) | 591 (21.0) |
| 5 (most deprived) | 78,850 (19.2) | 1962 (25.9) | 866 (30.8) |
| Baseline PFP b , n (%) | |||
| Non‐frail | 238,641 (58.2) | 3970 (52.3) | 1266 (45.0) |
| Pre‐frail | 157,713 (38.5) | 3202 (42.2) | 1288 (45.8) |
| Frail | 13,845 (3.4) | 418 (5.5) | 258 (9.2) |
| Baseline FI b , n (%) | |||
| Relatively fit | 25,004 (6.1) | 386 (5.1) | 82 (2.9) |
| Less fit | 156,338 (38.1) | 2516 (33.2) | 729 (25.9) |
| Least fit | 181,013 (44.1) | 3397 (44.8) | 1301 (46.3) |
| Frail | 47,844 (11.7) | 1291 (17.0) | 700 (24.9) |
| Baseline HFRS b , n (%) | |||
| Low risk | 402,832 (98.2) | 7348 (96.8) | 2655 (94.4) |
| Intermediate risk | 7120 (1.7) | 228 (3.0) | 145 (5.2) |
| High risk | 247 (0.1) | 14 (0.2) | 12 (0.4) |
| Baseline CCI b , mean ± SD | 0.15 ± 0.56 | 0.22 ± 0.68 | 0.36 ± 0.87 |
| Concurrent HFRS b , n (%) | |||
| Low risk | 390,818 (95.3) | 6679 (88.0) | 2153 (76.6) |
| Intermediate risk | 15,556 (3.8) | 493 (6.5) | 339 (12.1) |
| High risk | 3825 (0.9) | 418 (5.5) | 320 (11.4) |
| Concurrent CCI b , mean ± SD | 0.30 ± 0.90 | 0.57 ± 1.33 | 1.11 ± 1.82 |
Abbreviations: CCI, Charlson Comorbidity Index; FI, frailty index; HFRS, Hospital Frailty Risk Score; PFP, physical frailty phenotype; SD, standard deviation.
The COVID‐19 positive and COVID‐19 inpatient subsamples are nested within the full sample.
Baseline PFP, FI, HFRS, and CCI were calculated using data at the U.K. Biobank baseline, and concurrent HFRS and CCI using data at the time of the COVID‐19 pandemic.
Frailty and comorbidity in predicting COVID‐19 mortality
In the full sample, all baseline measures—PFP, FI, HFRS, and CCI were significantly associated with higher odds of COVID‐19 mortality after adjusting for age and sex (Table 2). Nevertheless, the concurrent measures of HFRS (OR for high vs low risk = 20.40; 95% CI = 16.24–25.63) and CCI (OR per point increase = 1.53; 95% CI = 1.48–1.59) exhibited stronger associations with COVID‐19 mortality compared to the baseline measures. The AUC for the model including only age and sex was 0.77; adding any of the baseline measures (PFP, FI, HFRS, or CCI) to this model resulted only in slightly improved AUCs of 0.78–0.79. However, adding either the concurrent HFRS or CCI yielded a greater improvement in AUC (0.83; all p < 0.05 for pairwise comparisons) (Figure 1A and Table S8).
TABLE 2.
Associations of the different frailty and comorbidity measures with COVID‐19 mortality in the full sample and COVID‐19 inpatients
| Model a | COVID‐19 mortality OR (95% CI) | |
|---|---|---|
| Full sample (n = 410,199) | COVID‐19 inpatients (n = 2812) b | |
| Baseline PFP c | ||
| Non‐frail | 1 | 1 |
| Pre‐frail | 1.68 (1.40–2.02) * | 1.06 (0.84–1.33) |
| Frail | 4.28 (3.17–5.78) * | 1.34 (0.93–1.92) |
| Baseline FI c | ||
| Relatively fit | 1 | 1 |
| Less fit | 1.64 (0.88–3.04) | 1.13 (0.53–2.40) |
| Least fit | 2.32 (1.27–4.26) * | 1.00 (0.48–2.09) |
| Frail | 5.21 (2.82–9.63) * | 1.32 (0.63–2.79) |
| Baseline HFRS c | ||
| Low risk | 1 | 1 |
| Intermediate risk | 2.17 (1.45–3.25) * | 0.71 (0.42–1.19) |
| High risk | 4.89 (1.21–19.86) * | 0.53 (0.07–4.21) |
| Baseline CCI c | ||
| Continuous | 1.45 (1.34–1.56) * | 1.18 (1.06–1.32) * |
| Concurrent HFRS c | ||
| Low risk | 1 | 1 |
| Intermediate risk | 5.17 (4.09–6.52) * | 1.53 (1.13–2.05) * |
| High risk | 20.40 (16.24–25.63) * | 1.41 (1.04–1.90) * |
| Concurrent CCI c | ||
| Continuous | 1.53 (1.48–1.59) * | 1.17 (1.11–1.23) * |
Abbreviations: CCI, Charlson Comorbidity Index; CI, confidence interval; FI, frailty index; HFRS, Hospital Frailty Risk Score; OR, odds ratio; PFP, physical frailty phenotype.
Significant with a false discovery rate corrected significance level at 0.032.
All models were adjusted for age (continuous) and sex.
The COVID‐19 inpatient subsample is nested within the full sample.
Baseline PFP, FI, HFRS, and CCI were calculated using data at the U.K. Biobank baseline, and concurrent HFRS and CCI using data at the time of the COVID‐19 pandemic.
FIGURE 1.
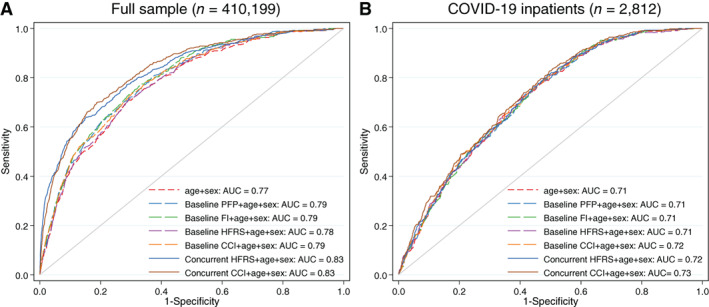
Receiver operating characteristic curves for the different frailty and comorbidity measures in predicting COVID‐19 mortality in (A) the full sample and (B) COVID‐19 inpatients. The COVID‐19 inpatient subsample is nested within the full sample. Baseline PFP, FI, HFRS, and CCI were calculated using data at the U.K. Biobank baseline, and concurrent HFRS and CCI using data at the time of the COVID‐19 pandemic. AUCs with 95% confidence intervals are listed in Table S8. Abbreviations: AUC, area under the receiver operating characteristic curves; CCI, Charlson Comorbidity Index; FI, frailty index; HFRS, Hospital Frailty Risk Score; PFP, physical frailty phenotype
After restricting the sample to COVID‐19 inpatients, all of these associations were attenuated, and the predictive accuracies decreased. In this sample, all the baseline and concurrent measures had limited added predictive value on top of age and sex, as indicated by similar AUCs of 0.71–0.73 across all models (Figure 1B and Table S8).
To further assess whether the predictiveness of concurrent HFRS and CCI for COVID‐19 mortality would change after controlling for potential confounders, we additionally adjusted for ethnicity, smoking and socioeconomic variables, and observed that the associations and AUCs remained essentially unchanged in both samples (Table 3).
TABLE 3.
Multivariate adjusted associations of the concurrent frailty and comorbidity measures with COVID‐19 mortality in the full sample and COVID‐19 inpatients
| Variable a | COVID‐19 mortality OR (95% CI) | |
|---|---|---|
| Full sample (n = 410,199) | COVID‐19 inpatients (n = 2812) b | |
| Concurrent HFRS c | ||
| Low risk | 1 | 1 |
| Intermediate risk | 2.76 (2.05–3.71)* | 0.98 (0.67–1.44) |
| High risk | 8.42 (6.08–11.66)* | 0.80 (0.53–1.20) |
| Concurrent CCI c | 1.23 (1.16–1.30)* | 1.16 (1.08–1.25)* |
| Age | 1.11 (1.09–1.13)* | 1.11 (1.09–1.13)* |
| Male sex | 2.12 (1.71–2.63)* | 1.48 (1.13–1.94)* |
| Ethnicity | ||
| White | 1 | 1 |
| Asian | 2.04 (1.15–3.60)* | 1.12 (0.53–2.37) |
| Black | 3.93 (2.38–6.50)* | 4.35 (2.28–8.29)* |
| Others | 1.06 (0.39–2.87) | 0.68 (0.20–2.33) |
| Smoking status | ||
| Never | 1 | 1 |
| Previous | 1.55 (1.24–1.94)* | 1.37 (1.03–1.82)* |
| Current | 1.64 (1.19–2.26)* | 1.29 (0.86–1.93) |
| Education | ||
| High | 1 | 1 |
| Intermediate | 1.27 (0.96–1.66) | 0.96 (0.68–1.36) |
| Low | 1.49 (1.09–2.02)* | 0.93 (0.63–1.38) |
| Income | ||
| >£52,000 | 1 | 1 |
| £31,000–51,999 | 1.34 (0.89–2.02) | 1.12 (0.68–1.85) |
| £18,000–30,999 | 1.29 (0.86–1.92) | 1.05 (0.64–1.72) |
| <£18,000 | 1.85 (1.24–2.76)* | 1.19 (0.72–1.96) |
| Townsend deprivation quintile | ||
| 1 (least deprived) | 1 | 1 |
| 2 | 0.88 (0.62–1.26) | 0.89 (0.57–1.40) |
| 3 | 0.98 (0.69–1.39) | 0.71 (0.45–1.11) |
| 4 | 1.16 (0.83–1.63) | 0.85 (0.55–1.31) |
| 5 (most deprived) | 1.62 (1.17–2.24)* | 1.10 (0.73–1.67) |
| AUC (95% CI) | 0.87 (0.86–0.89) | 0.75 (0.73–0.78) |
Abbreviations: AUC, area under the receiver operating characteristic curves; CCI, Charlson Comorbidity Index; CI, confidence interval; HFRS, Hospital Frailty Risk Score; OR, odds ratio.
Significant with a false discovery rate corrected significance level at 0.021.
The multivariate logistic regression models were adjusted for frailty (concurrent HFRS), comorbidity (concurrent CCI), age (continuous), sex, ethnicity, smoking status, education, income, and deprivation.
The COVID‐19 inpatient subsample is nested within the full sample.
Concurrent HFRS and CCI were calculated using data at the time of the COVID‐19 pandemic.
There was a significant interaction between concurrent HFRS and age in both the full sample (p interaction = 0.007) and COVID‐19 inpatients (p interaction = 0.014), so that the relative risk of COVID‐19 mortality carried by higher frailty was greater in younger‐old (<65 years) compared to older‐old individuals (>75 years) (Figure 2A,B). However, the absolute baseline risk of COVID‐19 mortality was higher in the older age groups (Figure 2C,D); therefore, the absolute risk difference slightly increased with age in the full sample (Figure 2E,F). We also observed greater absolute risk of COVID‐19 mortality in men compared to women at all ages and across the HFRS categories (Figure 2C–F).
FIGURE 2.
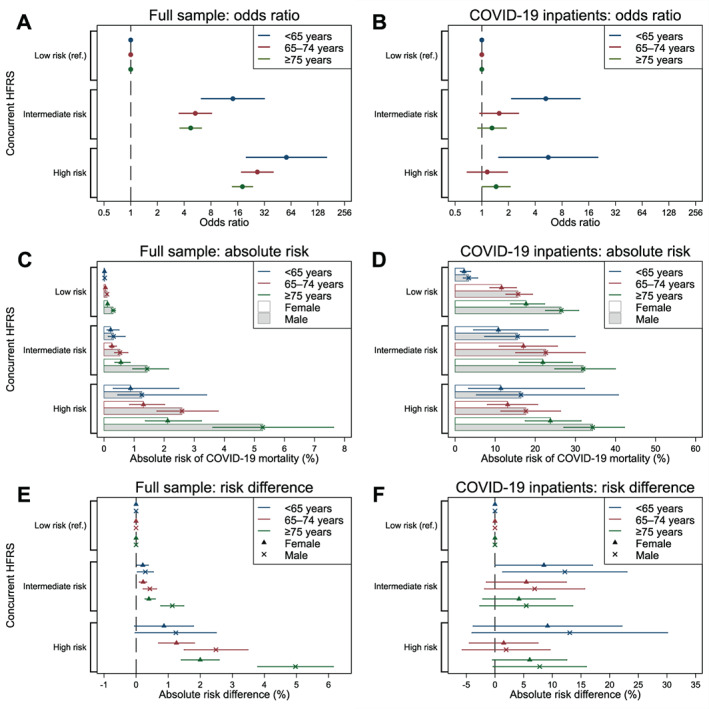
Associations between the concurrent HFRS and COVID‐19 mortality stratified by age. (A) Odds ratios in the full sample; (B) odds ratios in COVID‐19 inpatients; (C) absolute risks among males and females in the full sample; (D) absolute risks among males and females in COVID‐19 inpatients; (E) risk differences among males and females in the full sample; (F) risk differences among males and females in COVID‐19 inpatients. The COVID‐19 inpatient subsample is nested within the full sample. Models were adjusted for sex. Error bars indicate 95% confidence intervals. Concurrent HFRS was calculated using data at the time of the COVID‐19 pandemic. Abbreviation: HFRS, Hospital Frailty Risk Score
Sensitivity analysis
The associations of the different frailty and comorbidity measures with COVID‐19 mortality were largely similar as in the main analyses when accounting for competing risk by deaths due to other causes than COVID‐19 (Table S9).
DISCUSSION
Using data from the U.K. Biobank, we found that recent measurements of HFRS and CCI, constructed from medical records on ICD‐10 codes concurrent with the start of the pandemic, were viable and independent predictors of COVID‐19 mortality and added predictive value on top of age and sex in the overall community population. Equally accurate predictions could be obtained by including either the concurrent HFRS or CCI to a model with age and sex; addition of either one resulted in an improvement of AUC of more than 5%. The associations persisted even after adjusting for ethnicity, smoking, and socioeconomic variables. However, among COVID‐19 inpatients who had an over‐representation of frail individuals, none of the baseline or concurrent measures improved the predictive accuracy of a model including age and sex. Stronger associations between HFRS and COVID‐19 mortality were seen among younger‐old (<65 years) than older‐old individuals (≥75 years), indicating that the HFRS may be applicable for predicting mortality risk in younger adults as well.
To the best of our knowledge, this is the first study that has utilized the HFRS as a frailty measure for COVID‐19 mortality prediction in the community population. While it has previously been shown that a PFP or FI was associated with higher risk of COVID‐19 mortality in the full sample of the U.K. Biobank, 23 both measures were assessed at baseline ~10 years ago, which may affect their predictive accuracies. By way of how the PFP and FI are constructed (in‐person testing and a 49‐item questionnaire, respectively), they may also be less feasible in clinical decision‐making or to be implemented in population risk stratification during the current COVID‐19 pandemic. Adding to the existing literature, we found that the U.K. Biobank baseline measures of frailty (PFP, FI, and HFRS) had similar predictive accuracies for COVID‐19 mortality, even though they had relatively low correlations with each other. This finding is congruent with a recent paper showing a low agreement between the electronic frailty index (eFI) and HFRS, yet both measures predicted mortality equally well. 30 Moreover, consistent with a previous study showing that frailty is a good predictor of mortality for only up to 10 years, 31 we found that the concurrent HFRS, based on ICD‐10 codes in the past 2 years before the start of the pandemic, was a stronger predictor than any of the baseline measures for COVID‐19 mortality. The concurrent CCI, a measure of comorbidity computed by ICD‐10 codes, was likewise an accurate predictor of COVID‐19 mortality, which is in line with prior research showing a positive association between comorbidity and COVID‐19 deaths. 16 , 19 Our results thus suggest that the recency of the frailty measurement, rather than the definition of frailty used, is more important for accurate prediction of COVID‐19 mortality.
However, the predictive accuracies of frailty and comorbidity for COVID‐19 mortality reduced after restricting the analyses to a subsample of COVID‐19 inpatients. It has been argued that using non‐random samples may induce selection bias in COVID‐19‐related studies. 22 In our COVID‐19 inpatient subsample, we found an over‐representation of the most frail individuals. Moreover, consistent with a previous study, we confirmed that frailty and comorbidities are independent determinants of COVID‐19 positivity. 32 Such an over‐representation of frailty may partly explain the inconsistencies in the frailty‐mortality associations among hospitalized COVID‐19 patients. 18 , 19 , 20 In a relatively frail sample, such as the COVID‐19 inpatient group in our study, the mortality risk may be more related to other factors, such as viral load and host immune characteristics. 18 , 33 Indeed, none of our models in COVID‐19 inpatients yielded a good predictive accuracy of AUC > 0.8, even when smoking, ethnicity, and socioeconomic variables were included. More research is thus warranted to identify the most accurate predictors for mortality among COVID‐19 inpatients.
Given that the HFRS was initially developed for older individuals, we stratified the analysis by age and observed a more pronounced association between HFRS and COVID‐19 mortality among younger adults <65 years. A similar pattern has also been reported previously, with higher frailty being more strongly associated with all‐cause and cause‐specific mortality at midlife than in the oldest ages. 6 These indicate that although the absolute risk of death is higher with advancing age, frailty carries a relatively greater risk at younger ages, highlighting the importance of frailty screening in younger individuals in prevention for COVID‐19‐related mortality.
The large sample of U.K. Biobank participants with linkage to COVID‐19 data enabled us to study the associations among the overall population and to examine the potential effects of sample selection. Nevertheless, there are several limitations to this study. Firstly, the HFRS was originally designed for hospitalized individuals rather than the general population, and the fact that it was assessed based on chronic ICD‐10 diagnoses makes it more similar to a comorbidity measure, possibly missing certain aspects of frailty, such as functional status and psychosocial well‐being. 11 Due to the absence of relevant data in the U.K. Biobank cohort, we were also unable to calculate a concurrent PFP or FI, and that the FI was largely based on comorbidities, leaving functional items under‐represented. Alternatively, future research may utilize frailty measures based on routine primary care data, such as the eFI, 34 for assessing its predictive ability for COVID‐19 mortality. Secondly, we modeled the outcome, COVID‐19 mortality, as binary rather than time‐to‐event outcome because we could not ascertain the exact date of confirmed COVID‐19 infection for several positive cases. However, as the follow‐up time was limited, it could be considered essentially complete for most participants (i.e., minimal drop out due to migration and other deaths). Finally, U.K. Biobank is not a nationally representative sample, with generally healthier and less socioeconomically deprived participants than the U.K. average, 35 thereby reducing the generalizability of our findings.
In conclusion, HFRS and CCI, measures of frailty and comorbidity that can be constructed using routinely collected medical records, predicted COVID‐19 mortality in the overall community sample and improved predictive accuracy on top of age and sex, with similar added values with the addition of either one of these measures. Nevertheless, similar effects of added value were not seen in COVID‐19 inpatients. Together, our results suggest that identification of frail individuals in the general population may be a viable strategy for COVID‐19 mortality risk stratification.
FINANCIAL DISCLOSURE
This work was supported by the Swedish Research Council (2018‐02077, 2019‐01272), the Loo & Hans Osterman Foundation, the Strategic Research Program in Epidemiology at Karolinska Institutet and the Karolinska Institutet Foundations.
CONFLICT OF INTEREST
The authors have no conflicts.
AUTHORS' CONTRIBUTIONS
Jonathan K. L. Mak, Ralf Kuja‐Halkola, and Juulia Jylhävä contributed to the study concept and design; Yunzhang Wang, Sara Hägg, and Juulia Jylhävä were responsible for acquisition of data; Jonathan K. L. Mak, Ralf Kuja‐Halkola, and Juulia Jylhävä analyzed and interpreted the data; Jonathan K. L. Mak and Juulia Jylhävä drafted the manuscript; Ralf Kuja‐Halkola, Yunzhang Wang, and Sara Hägg critically revised the manuscript for important intellectual content. All authors read and approved the final manuscript.
SPONSOR'S ROLE
The funders had no role in study design, data collection and interpretation, or preparation of the manuscript.
Supporting information
Figure S1: Flowchart of selection of the study samples from the U.K. Biobank.
Figure S2: Assessment timeline in the U.K. Biobank.
Table S1: List of the five frailty criteria for construction of the physical frailty phenotype.
Table S2: List of the 49 frailty items and scoring for construction of the frailty index.
Table S3: List of the 109 ICD‐10 codes and assigned weights for construction of the Hospital Frailty Risk Score.
Table S4: List of the 17 comorbidities, assigned weights and associated ICD‐10 codes for construction of Charlson Comorbidity Index.
Table S5: Characteristics of individuals with and without hospital data.
Table S6: Spearman's rank correlation coefficients among different frailty and comorbidity measures.
Table S7: Associations of the different frailty and comorbidity measures with being COVID‐19 positive and COVID‐19 inpatient.
Table S8: Predictive accuracies of age, sex, frailty and comorbidity measures for COVID‐19 mortality in the full sample and COVID‐19 inpatients.
Table S9: Associations of the different frailty and comorbidity measures with mortality due to COVID‐19 and other causes in the full sample and COVID‐19 inpatients.
ACKNOWLEDGMENTS
This research was conducted using the U.K. Biobank resource, as part of the registered project 22224. This study was accomplished within the context of the Swedish National Graduate School for Competitive Science on Ageing and Health (SWEAH) funded by the Swedish Research Council.
Mak JKL, Kuja‐Halkola R, Wang Y, Hägg S, Jylhävä J. Frailty and comorbidity in predicting community COVID‐19 mortality in the U.K. Biobank: The effect of sampling. J Am Geriatr Soc. 2021;69:1128–1139. 10.1111/jgs.17089
This manuscript has been published as a preprint on MedRxiv (https://doi.org/10.1101/2020.10.22.20217489).
Funding information Karolinska Institutet Foundations; Loo & Hans Osterman Foundation; Strategic Research Program in Epidemiology at Karolinska Institutet; Vetenskapsrådet, Grant/Award Numbers: 2018‐02077, 2019‐01272
REFERENCES
- 1. Dong E, Du H, Gardner L. An interactive web‐based dashboard to track COVID‐19 in real time. Lancet Infect Dis. 2020;20(5):533‐534. 10.1016/S1473-3099(20)30120-1. [DOI] [PMC free article] [PubMed] [Google Scholar]
- 2. Noor FM, Islam MM. Prevalence and associated risk factors of mortality among COVID‐19 patients: a meta‐analysis. J Community Health. 2020;45(6):1270‐1282. 10.1007/s10900-020-00920-x. [DOI] [PMC free article] [PubMed] [Google Scholar]
- 3. Lu L, Zhong W, Bian Z, et al. A comparison of mortality‐related risk factors of COVID‐19, SARS, and MERS: a systematic review and meta‐analysis: mortality‐related risk factors of COVID‐19, SARS, and MERS. J Infect. 2020;81(4):e18‐e25. 10.1016/j.jinf.2020.07.002. [DOI] [PMC free article] [PubMed] [Google Scholar]
- 4. Zhou F, Yu T, Du R, et al. Clinical course and risk factors for mortality of adult inpatients with COVID‐19 in Wuhan, China: a retrospective cohort study. Lancet. 2020;395(10229):1054‐1062. 10.1016/S0140-6736(20)30566-3. [DOI] [PMC free article] [PubMed] [Google Scholar]
- 5. Clegg A, Young J, Iliffe S, Rikkert MO, Rockwood K. Frailty in elderly people. Lancet. 2013;381(9868):752‐762. 10.1016/S0140-6736(12)62167-9. [DOI] [PMC free article] [PubMed] [Google Scholar]
- 6. Li X, Ploner A, Karlsson IK, et al. The frailty index is a predictor of cause‐specific mortality independent of familial effects from midlife onwards: a large cohort study. BMC Med. 2019;17(1):94. 10.1186/s12916-019-1331-8. [DOI] [PMC free article] [PubMed] [Google Scholar]
- 7. Williams DM, Jylhävä J, Pedersen NL, Hägg SA. Frailty index for UK biobank participants. J Gerontol ‐ Ser A Biol Sci Med Sci. 2019;74(4):582‐587. 10.1093/gerona/gly094. [DOI] [PMC free article] [PubMed] [Google Scholar]
- 8. Rockwood K, Song X, MacKnight C, et al. A global clinical measure of fitness and frailty in elderly people. CMAJ. 2005;173(5):489‐495. 10.1503/cmaj.050051. [DOI] [PMC free article] [PubMed] [Google Scholar]
- 9. Fried LP, Tangen CM, Walston J, et al. Frailty in older adults: evidence for a phenotype. J Gerontol ‐ Ser A Biol Sci Med Sci. 2001;56(3):M146‐M157. 10.1093/gerona/56.3.m146. [DOI] [PubMed] [Google Scholar]
- 10. Searle SD, Mitnitski A, Gahbauer EA, Gill TM, Rockwood K. A standard procedure for creating a frailty index. BMC Geriatr. 2008;8(1):24. 10.1186/1471-2318-8-24. [DOI] [PMC free article] [PubMed] [Google Scholar]
- 11. Gilbert T, Neuburger J, Kraindler J, et al. Development and validation of a hospital frailty risk score focusing on older people in acute care settings using electronic hospital records: an observational study. Lancet. 2018;391(10132):1775‐1782. 10.1016/S0140-6736(18)30668-8. [DOI] [PMC free article] [PubMed] [Google Scholar]
- 12. Kundi H, Wadhera RK, Strom JB, et al. Association of frailty with 30‐day outcomes for acute myocardial infarction, heart failure, and pneumonia among elderly adults. JAMA Cardiol. 2019;4(11):1084‐1091. 10.1001/jamacardio.2019.3511. [DOI] [PMC free article] [PubMed] [Google Scholar]
- 13. McAlister F, Van Walraven C. External validation of the hospital frailty risk score and comparison with the hospital‐patient one‐year mortality risk score to predict outcomes in elderly hospitalised patients: a retrospective cohort study. BMJ Qual Saf. 2019;28(4):284‐288. 10.1136/bmjqs-2018-008661. [DOI] [PubMed] [Google Scholar]
- 14. Hewitt J, Carter B, Vilches‐Moraga A, et al. The effect of frailty on survival in patients with COVID‐19 (COPE): a multicentre, European, observational cohort study. Lancet Public Health. 2020;5(8):e444‐e451. 10.1016/S2468-2667(20)30146-8. [DOI] [PMC free article] [PubMed] [Google Scholar]
- 15. Aw D, Woodrow L, Ogliari G, Harwood R. Association of frailty with mortality in older inpatients with Covid‐19: a cohort study. Age Ageing. 2020;49(6):1‐8. 10.1093/ageing/afaa184. [DOI] [PMC free article] [PubMed] [Google Scholar]
- 16. Hägg S, Jylhävä J, Wang Y, et al. Age, frailty and comorbidity as prognostic factors for short‐term outcomes in patients with COVID‐19 in geriatric care. J Am Med Dir Assoc. 2020;21(11):1555–1559.e2.doi: 10.1016/j.jamda.2020.08.014 [DOI] [PMC free article] [PubMed] [Google Scholar]
- 17. Kundi H, Çetin EHÖ, Canpolat U, et al. The role of frailty on adverse outcomes among older patients with COVID‐19. J Infect. 2020;81(6):944‐951. 10.1016/j.jinf.2020.09.029. [DOI] [PMC free article] [PubMed] [Google Scholar]
- 18. De Smet R, Mellaerts B, Vandewinckele H, et al. Frailty and mortality in hospitalized older adults with COVID‐19: retrospective observational study. J Am Med Dir Assoc. 2020;21(7):928‐932.e1.doi: 10.1016/j.jamda.2020.06.008 [DOI] [PMC free article] [PubMed] [Google Scholar]
- 19. Owen RK, Conroy SP, Taub N, et al. Comparing associations between frailty and mortality in hospitalised older adults with or without COVID‐19 infection: a retrospective observational study using electronic health records. Age Ageing. 2020. 10.1093/ageing/afaa167. [Epub ahead of print]. [DOI] [PMC free article] [PubMed] [Google Scholar]
- 20. Miles A, Webb TE, Mcloughlin BC, et al. Outcomes from COVID‐19 across the range of frailty: excess mortality in fitter older people. Eur Geriatr Med. 2020;11(5):851‐855. 10.1007/s41999-020-00354-7. [DOI] [PMC free article] [PubMed] [Google Scholar]
- 21. Collins JT, Short R, Carter B, et al. The clinical frailty scale: estimating the prevalence of frailty in older patients hospitalised with COVID‐19. The COPE study. Geriatr (Basel, Switzerland). 2020;5(3):58. 10.3390/geriatrics5030058 [DOI] [PMC free article] [PubMed] [Google Scholar]
- 22. Griffith G, Morris TT, Tudball M, et al. Collider bias undermines our understanding of COVID‐19 disease risk and severity. Nat Commun. 2020;11(1):5749. 10.1101/2020.05.04.20090506. [DOI] [PMC free article] [PubMed] [Google Scholar]
- 23. Petermann‐Rocha F, Hanlon P, Gray SR, et al. Comparison of two different frailty measurements and risk of hospitalisation or death from COVID‐19: findings from UK biobank. BMC Med. 2020;18(1):355. 10.1186/s12916-020-01822-4. [DOI] [PMC free article] [PubMed] [Google Scholar]
- 24. Rockwood K, Song X, Mitnitski A. Changes in relative fitness and frailty across the adult lifespan: evidence from the Canadian National Population Health Survey. CMAJ. 2011;183(8):E487‐E494. 10.1503/cmaj.101271. [DOI] [PMC free article] [PubMed] [Google Scholar]
- 25. Sudlow C, Gallacher J, Allen N, et al. UK biobank: an open access resource for identifying the causes of a wide range of complex diseases of middle and old age. PLoS Med. 2015;12(3):e1001779. 10.1371/journal.pmed.1001779. [DOI] [PMC free article] [PubMed] [Google Scholar]
- 26. Armstrong J, Rudkin JK, Allen N, et al. Dynamic linkage of covid‐19 test results between public health England's second generation surveillance system and UKbiobank. Microb Genom. 2020;6(7):1‐9. 10.1099/mgen.0.000397. [DOI] [PMC free article] [PubMed] [Google Scholar]
- 27. Hanlon P, Nicholl BI, Jani BD, Lee D, McQueenie R, Mair FS. Frailty and pre‐frailty in middle‐aged and older adults and its association with multimorbidity and mortality: a prospective analysis of 493 737 UK biobank participants. Lancet Public Health. 2018;3(7):e323‐e332. 10.1016/S2468-2667(18)30091-4. [DOI] [PMC free article] [PubMed] [Google Scholar]
- 28. Charlson ME, Pompei P, Ales KL, MacKenzie CR. A new method of classifying prognostic comorbidity in longitudinal studies: development and validation. J Chronic Dis. 1987;40(5):373‐383. 10.1016/0021-9681(87)90171-8. [DOI] [PubMed] [Google Scholar]
- 29. Benjamini Y, Hochberg Y. Controlling the false discovery rate: a practical and powerful approach to multiple testing. J R Stat Soc Ser B. 1995;57(1):289‐300. 10.1111/j.2517-6161.1995.tb02031.x. [DOI] [Google Scholar]
- 30. Hollinghurst J, Housley G, Watkins A, Clegg A, Gilbert T, Conroy SP. A comparison of two national frailty scoring systems. Age Ageing. 2020. 10.1093/ageing/afaa252. [Epub ahead of print]. [DOI] [PMC free article] [PubMed] [Google Scholar]
- 31. Thompson MQ, Theou O, Tucker GR, Adams RJ, Visvanathan R. Recurrent measurement of frailty is important for mortality prediction: findings from the north West Adelaide health study. J Am Geriatr Soc. 2019;67(11):2311‐2317. 10.1111/jgs.16066. [DOI] [PubMed] [Google Scholar]
- 32. Woolford SJ, D'Angelo S, Curtis EM, et al. COVID‐19 and associations with frailty and multimorbidity: a prospective analysis of UK biobank participants. Aging Clin Exp Res. 2020;32(9):1897‐1905. 10.1007/s40520-020-01653-6. [DOI] [PMC free article] [PubMed] [Google Scholar]
- 33. Ji D, Zhang D, Xu J, et al. Prediction for progression risk in patients with COVID‐19 pneumonia: the CALL score. Clin Infect Dis. 2020;71(6):1393‐1399. 10.1093/cid/ciaa414. [DOI] [PMC free article] [PubMed] [Google Scholar]
- 34. Clegg A, Bates C, Young J, et al. Development and validation of an electronic frailty index using routine primary care electronic health record data. Age Ageing. 2016;45(3):353‐360. 10.1093/ageing/afw039. [DOI] [PMC free article] [PubMed] [Google Scholar]
- 35. Fry A, Littlejohns TJ, Sudlow C, et al. Comparison of Sociodemographic and health‐related characteristics of UK biobank participants with those of the general population. Am J Epidemiol. 2017;186(9):1026‐1034. 10.1093/aje/kwx246. [DOI] [PMC free article] [PubMed] [Google Scholar]
Associated Data
This section collects any data citations, data availability statements, or supplementary materials included in this article.
Supplementary Materials
Figure S1: Flowchart of selection of the study samples from the U.K. Biobank.
Figure S2: Assessment timeline in the U.K. Biobank.
Table S1: List of the five frailty criteria for construction of the physical frailty phenotype.
Table S2: List of the 49 frailty items and scoring for construction of the frailty index.
Table S3: List of the 109 ICD‐10 codes and assigned weights for construction of the Hospital Frailty Risk Score.
Table S4: List of the 17 comorbidities, assigned weights and associated ICD‐10 codes for construction of Charlson Comorbidity Index.
Table S5: Characteristics of individuals with and without hospital data.
Table S6: Spearman's rank correlation coefficients among different frailty and comorbidity measures.
Table S7: Associations of the different frailty and comorbidity measures with being COVID‐19 positive and COVID‐19 inpatient.
Table S8: Predictive accuracies of age, sex, frailty and comorbidity measures for COVID‐19 mortality in the full sample and COVID‐19 inpatients.
Table S9: Associations of the different frailty and comorbidity measures with mortality due to COVID‐19 and other causes in the full sample and COVID‐19 inpatients.