

Abstract
Mass cytometry (CyTOF) represents one of the most powerful tools in immune phenotyping, allowing high throughput quantification of over 40 parameters at single‐cell resolution. However, wide deployment of CyTOF‐based immune phenotyping studies are limited by complex experimental workflows and the need for specialized CyTOF equipment and technical expertise. Furthermore, differences in cell isolation and enrichment protocols, antibody reagent preparation, sample staining, and data acquisition protocols can all introduce technical variation that can confound integrative analyses of large data‐sets of samples processed across multiple labs. Here, we present a streamlined whole blood CyTOF workflow which addresses many of these sources of experimental variation and facilitates wider adoption of CyTOF immune monitoring across sites with limited technical expertise or sample‐processing resources or equipment. Our workflow utilizes commercially available reagents including the Fluidigm MaxPar Direct Immune Profiling Assay (MDIPA), a dry tube 30‐marker immunophenotyping panel, and SmartTube Proteomic Stabilizer, which allows for simple and reliable fixation and cryopreservation of whole blood samples. We validate a workflow that allows for streamlined staining of whole blood samples with minimal processing requirements or expertise at the site of sample collection, followed by shipment to a central CyTOF core facility for batched downstream processing and data acquisition. We apply this workflow to characterize 184 whole blood samples collected longitudinally from a cohort of 72 hospitalized COVID‐19 patients and healthy controls, highlighting dynamic disease‐associated changes in circulating immune cell frequency and phenotype.
Keywords: COVID‐19, CyTOF, human whole blood immunophenotyping, mass cytometry
1. INTRODUCTION
High dimensional cytometry is a powerful approach to characterize the immune system to identify immunological mechanisms and correlates of disease progression. Mass cytometry allows for an evaluation of over 40 parameters in a single sample, thereby enabling comprehensive characterization of immune cells in limited samples. However, the need for large numbers of reagents, long sample processing workflows and expensive and complicated CyTOF hardware present challenges that limit wide adoption of mass cytometry assays. These challenges are further amplified in studies involving clinical sample collection at multiple sites that may differ in their available sample processing resources and levels of technical expertise.
To address these challenges, we have optimized a standardized, streamlined sample processing workflow to allow whole blood to be easily stained, stabilized, preserved, and transferred to a central CyTOF core for final processing and data acquisition. This whole blood sample processing workflow leverages the commercially available Fluidigm MaxPar Direct Immune Profiling Assay (MDIPA), which incorporates a dry tube containing a 30‐marker broad immunophenotyping panel. Pre‐mixed dry antibody panels offer significant advantages over a conventional liquid antibody for flow cytometry workflows by significantly reducing the processing time, technical variation and potential errors associated with pipetting multiple individual antibodies, and these advantages are amplified when using larger antibody panels. 1 Applying this assay to whole blood rather than PBMCs offers further sample sparing advantages by allowing the assay to be performed with only 270 μl of whole blood, eliminating the labor and technical variation associated with PBMC isolation, and allowing analysis of granulocyte subsets that are otherwise removed by density centrifugation. The MDIPA workflow has previously been found to show excellent intra‐ and inter‐site reproducibility using both whole blood and PBMCs. 2 Despite these advantages, the standard MDIPA protocol as provided by Fluidigm still requires approximately 2 h of upfront sample processing time including several centrifugation steps, followed by an overnight incubation and suggests data acquisition within 48 h of sample staining. This workflow generally limits sample collection to labs that have the necessary technical expertise and resources for sample processing and on‐site mass cytometry instrumentation.
To facilitate broader adoption of this assay in studies involving multiple clinical sample collection sites we have adapted this dry MDIPA antibody panel as part of a protocol utilizing commercially available SmartTube proteomic stabilizer to significantly reduce sample processing time and hardware requirements at the site of sample collection (Figure S1). By minimizing initial sample processing requirements and transferring downstream processing steps to a central core, this workflow facilitates robust, highly standardized CyTOF immune monitoring in studies involving multiple clinical sites that cannot accommodate complex sample processing workflows and that do not have their own mass cytometry instrumentation. We further demonstrate the application of this workflow to study a large number of blood samples collected from hospitalized COVID‐19 patients, highlighting its utility in facilitating large‐scale standardized immune monitoring initiatives.
2. METHODS
2.1. Subjects
Samples were collected from consented healthy donors and longitudinally from hospitalized COVID‐19 patients under protocols approved by the Mount Sinai Institutional Review Board and Institutional Biosafety Committee as part of a large institutional COVID‐19 biobanking and analysis effort. 3 Demographics of the patient cohort are shown in Table 1. Patient COVID‐19 disease severity was based primarily on respiratory symptoms and need for supplemental oxygen therapy. Laboratory values for cardiovascular, renal, and hepatic function were also considered and adjusted for according to patient weight, age, and biological sex. The need for renal replacement therapy was also considered. This severity scoring system accounts for similar variables as SOFA, MODs, and APACHE II. ECMO was not used in this cohort.
TABLE 1.
Patient cohort characteristics
| Healthy donors | Hospitalized COVID‐19 patients a | ||
|---|---|---|---|
| Moderate disease b | Severe disease c | ||
| Number of subjects | 24 | 41 | 31 |
| Mean age (range), years | 35 (22–61) | 56 (31–90) | 61 (20–90) |
| Sex—Male:Female | 8:16 | 22:19 | 17:14 |
Hospitalized patients with confirmed SARS‐Cov‐2 PCR and serology results.
Moderate disease defined based on clinical chart review with a minimum criteria of SpO2 < 94% and/or pneumonia on imaging.
Severe disease defined based on clinical chart review with a minimum criteria defined as requiring respiratory support based on non‐invasive ventilation or mechanical ventilation.
2.2. Whole blood staining
Fresh whole blood samples used for CyTOF analysis were collected in either heparin, EDTA, or sodium citrate CPT tubes (BD Biosciences, Franklin Lakes, NJ) as indicated for specific experiments. When processing whole blood samples from COVID‐19 patients, initial staining and processing was performed under BSL2+ conditions, as per current CDC guidelines. Whole blood samples were stained by adding 270 μl blood directly to a MDIPA tube containing the lyophilized antibody panel (Table 2), mixing and incubating for 30 min at room temperature. For the conventional MDIPA workflow, stained blood samples were fixed and red blood cells were lysed using Cal‐lyse buffer (Thermo Fisher Scientific, Waltham, MA) as per Fluidigm's recommended protocols. The samples were washed with Cell Staining Buffer (Fluidigm, San Francisco, CA), fixed and permeabilized using Fix Perm buffer (Fluidigm), and stained with 125 nM Iridium DNA intercalator. Formaldehyde fixation has been found to effectively inactivate SARS‐CoV‐2, 4 so post‐fixed samples can subsequently be handled under less stringent BSL conditions.
TABLE 2.
Antibody information
| Fluidigm MDIPA panel | Additional antibodies used | ||||||||||
|---|---|---|---|---|---|---|---|---|---|---|---|
| Target | Clone | Source | Isotope | Target | Clone | Source | Isotope | Target | Clone | Source | Isotope |
| CD45 | HI30 | Fluidigm | 89 Y | CD45 | HI30 | Fluidigm | 89 Y | CD161 | HP‐3G10 | Biolegend | 171 Yb |
| CCR6 | G034E3 | Fluidigm | 141 Pr | CD57 | HNK‐1 | Biolegend | 113 In | CD39 | A1 | Biolegend | 172 Yb |
| CD123 | 6H6 | Fluidigm | 143 Nd | CD11c | Bu15 | Biolegend | 115 In | CXCR3 | REA232 | Miltenyi | 173 Yb |
| CD19 | HIB19 | Fluidigm | 144 Nd | CD33 | WM53 | Biolegend | 141 Pr | HLADR | REA805 | Miltenyi | 174 Yb |
| CD4 | RPA‐T4 | Fluidigm | 145 Nd | CD19 | REA675 | Miltenyi | 142 Nd | PD‐1 | EH12.2H7 | Fluidigm | 175 Lu |
| CD8a | RPA‐T8 | Fluidigm | 146 Nd | CD45RA | REA562 | Miltenyi | 143 Nd | CCR4 | 205,410 | R&D Systems | 176 Yb |
| CD11c | Bu15 | Fluidigm | 147 Sm | CD141 | Phx01 | Biolegend | 144 Nd | CD61 | VI‐PL2 | Fluidigm | 209 Bi |
| CD16 | 3G8 | Fluidigm | 148 Nd | CD4 | REA623 | Miltenyi | 145 Nd | CD11b | M1/70 | Biolegend | 113 In |
| CD45RO | UCHL1 | Fluidigm | 149 Sm | CD8 | REA734 | Miltenyi | 146 Nd | CD10 | H10a | Biolegend | 144 Nd |
| CD45RA | HI100 | Fluidigm | 150 Nd | CD20 | 2H7 | Biolegend | 147 Sm | TIGIT | MBSA43 | Fluidigm | 153 Eu |
| CD161 | HP‐3G10 | Fluidigm | 151 Eu | CD16 | REA423 | Miltenyi | 148 Nd | CD86 | IT2.2 | Biolegend | 154 Sm |
| CCR4 | L291H4 | Fluidigm | 152 Sm | CD127 | A019D5 | Fluidigm | 149 Sm | CD26 | BA5b | Biolegend | 154 Sm |
| CD25 | BC96 | Fluidigm | 153 Eu | CD1c | REA694 | Miltenyi | 150 Nd | CD80 | 2D10 | Biolegend | 162 Dy |
| CD27 | O323 | Fluidigm | 154 Sm | CD123 | REA918 | Miltenyi | 151 Eu | IgA | polyclonal | SouthernBiotech | 162 Dy |
| CD57 | HCD57 | Fluidigm | 155 Gd | CD66b | REA306 | Miltenyi | 152 Sm | CD5 | UCHT2 | Biolegend | 163 Dy |
| CXCR3 | G025H7 | Fluidigm | 156 Gd | CD62L | DREG56 | Fluidigm | 153 Eu | CD40 | HB14 | Biolegend | 164 Dy |
| CXCR5 | J252D4 | Fluidigm | 158 Gd | ICOS | C398.4A | Biolegend | 154 Sm | LOX‐1 | 331,212 | R&D Systems | 165 Ho |
| CD28 | CD28.2 | Fluidigm | 160 Gd | CD27 | REA499 | Miltenyi | 155 Gd | 41BB | 4B4‐1 | Biolegend | 165 Ho |
| CD38 | HB‐7 | Fluidigm | 161 Dy | PD‐L1 | 29E.2A3 | Biolegend | 156 Gd | CD169 | 7–239 | Biolegend | 166 Er |
| CD56 | NCAM16.2 | Fluidigm | 163 Dy | CCR6 | G034E3 | Biolegend | 158 Gd | Beta7 | REA441 | Miltenyi | 169 Tm |
| TCRgd | B1 | Fluidigm | 164 Dy | CD169 | 7–239 | Biolegend | 159 Tb | OX40 | BerAct‐35 | Biolegend | 169 Tm |
| CD294 | BM16 | Fluidigm | 166 Er | CD14 | REA599 | Miltenyi | 160 Gd | CD95 | DX2 | Biolegend | 171 Yb |
| CCR7 | G043H7 | Fluidigm | 167 Er | CD56 | REA196 | Miltenyi | 161 Dy | LAG3 | 11C3C65 | Biolegend | 172 Yb |
| CD14 | 63D3 | Fluidigm | 168 Er | gdTCR | REA591 | Miltenyi | 162 Dy | CD73 | AD2 | Biolegend | 173 Yb |
| CD3 | UCHT1 | Fluidigm | 170 Er | CXCR5 | REA103 | Miltenyi | 163 Dy | DNAM‐1 | 11A8 | Biolegend | 173 Yb |
| CD20 | 2H7 | Fluidigm | 171 Yb | CD69 | FN50 | Biolegend | 164 Dy | CD29 | TS2/16 | Biolegend | 175 Lu |
| CD66b | G10F5 | Fluidigm | 172 Yb | CD88 | S5/1 | Biolegend | 165 Ho | CD54 | HCD54 | Biolegend | 176 Yb |
| HLADR | LN3 | Fluidigm | 173 Yb | CD25 | M‐A251 | Biolegend | 166 Er | IgM | MHM‐88 | Biolegend | 176 Yb |
| IgD | IA6‐2 | Fluidigm | 174 Yb | CCR7 | G043H7 | Biolegend | 167 Er | TIM3 | F38‐2E2 | Biolegend | 176 Yb |
| CD127 | A019D5 | Fluidigm | 176 Yb | CD3 | REA613 | Miltenyi | 168 Er | NKG2A | REA110 | Miltenyi | 176 Yb |
| CD71 | CY1G4 | Biolegend | 169 Tm | NKG2C | REA205 | Miltenyi | 158 Gd | ||||
| CD38 | REA671 | Miltenyi | 170 Er | CD64 | 10.1 | Biolegend | 165Ho | ||||
For our alternative protocol, 300 μl of the MDIPA‐stained blood was fixed and stabilized by addition of 420 μl of Prot1 stabilizer (SmartTube Inc., San Carlos, CA). After incubation for 10 min at room temperature the samples were transferred to labeled cryovials and immediately transferred to −80°C for long term storage and/or shipment. As per communications with the manufacturer, the effective concertation of formaldehyde in the Prot1‐stabilized samples is >2%, which is expected to effectively neutralize active SARS‐CoV‐2. 4 Samples were subsequently thawed using the SmartTube Prot 1 Thaw/Erythrocyte Lysis protocol according to the manufacturer's instructions. After subsequent washing in Cell Staining Buffer, samples were simultaneously fixed with 2.4% PFA in PBS with 0.08% saponin and 125 nM Iridium (Ir) intercalator for 30 minutes at room temperature, after which samples were washed and stored in Cell Staining Buffer (supplemented with 125 nM Ir) until acquisition. To facilitate data acquisition and doublet removal, multiple samples were barcoded using Fluidigm Pd barcoding kits and then washed and pooled for data acquisition. If stained samples could not be acquired within 48 h of staining completion, we found that storage of the samples at −80°C was optimal to preserve staining quality. 5
In experiments to evaluate the performance of additional antibody clones (Table 2) pre‐ and post‐Prot1 fixation, replicate aliquots of the same blood samples were either stained as fresh whole blood and then fixed and frozen or were fixed and frozen as unstained aliquots and then thawed and lysed as described above. The thawed samples were then resuspended in a volume of Cell Staining Buffer equal to the volume of the original blood aliquot for staining. SmartTube fixation and thaw/lyse results in partial permeabilization of cells and, consistent with prior results, 6 we found that addition of 100 U/ml of heparin was critical to prevent non‐specific staining of eosinophils when adding antibodies to SmartTube‐fixed whole blood. However, this was not found to be necessary when staining fresh whole blood.
It is important to note that the standard SmartTube thawing protocol as per the manufacturer's instructions worked well for all healthy donor samples used in our initial validation experiments; however, when applying this protocol to blood collected from hospitalized COVID‐19 patients we observed several instances in which the stabilized samples appeared to be partially clotted and exhibited high amounts of debris after thawing and lysis, which we suspect may be related to polymerized fibrin or other plasma factors related to COVID‐19 disease‐associated coagulopathy. If not addressed, this debris contributed to overall poor sample and staining quality and in some cases precluded analysis of samples. We found that following the red blood cell lysis washes with three additional large volume washes using ~10 ml of PBS + 0.2% BSA with centrifugation at 250 rcf and followed by filtration through a 70 micron filter depleted the majority of this debris and permitted effective analysis of blood samples that would otherwise have been discarded.
2.3. Data acquisition and processing
Immediately prior to data acquisition, samples were washed with Cell Staining buffer and Cell Acquisition Solution (Fluidigm) and resuspended at a concentration of 1 million cells per ml in Cell Acquisition Solution containing a 1:20 dilution of EQ Normalization beads (Fluidigm). The samples were then acquired on a Helios Mass Cytometer equipped with a wide‐bore sample injector at an event rate of <400 events per second. After acquisition, repeat acquisitions of the same sample were concatenated and normalized using the Fluidigm software, and barcoded samples were de‐multiplexed using the Zunder single cell debarcoder 7 or the Astrolabe Diagnostics platform.
2.4. Data analysis
For initial protocol optimization experiments, debarcoded files were uploaded to Cytobank for analysis. Immune cells were identified based on Ir‐193 DNA intensity and CD45 expression; Ce140+ normalization beads, CD45‐low/Ir‐193‐low debris and cross‐sample and Gaussian ion‐cloud multiplets were excluded from subsequent downstream analysis. Major immune cell types were defined by manual gating (Figure S2A), and the cell frequencies and median marker intensities of each subset were exported for downstream statistical analyses and visualized as heatmaps using Clustergrammer. 8 In some cases, immune cell populations were also identified using automated approaches including Fluidigm's MaxPar PathSetter software and the Astrolabe Diagnostics platform, the results of which largely correlated well with our manual gating approaches (Figure S2B). However, we found that manual gating was most effective in accurately identifying specific cell populations in the presence of variable marker intensity, as in the case of our fixation experiments. In addition, when analyzing larger numbers of whole blood samples stained with the MDIPA panel, we observed some instances of aberrant off‐target CD19 staining on non‐B cells, which occurred to a varying degree across subjects but was particularly notable in some samples. We have determined that this artifact is caused by donor‐specific serum factors interacting with specific reagents in specific lots of the MDIPA. 9 While these artifacts could lead to erroneous data interpretation and negatively impact unbiased clustering approaches, they could easily be overcome in manual gating analyses by avoiding CD19 as an exclusion parameter for non‐B cells and instead using CD20, which did not show any evidence of artifactual staining.
After gating the data, the impact of each tested condition on relative staining quality was evaluated in two ways: (1) overall correlations were determined by calculating the Pearson's correlation coefficients for the median expression of each marker across each defined immune subset; and (2) a staining index was calculated using defined populations showing the highest and lowest expression levels of each marker: SI = (Medianpos − Medianneg)/2 × Std.Devneg.
The analysis of the large cohort of 184 patient samples shown in Figures 5 and 6 was performed using computational analysis pipelines implemented using open source algorithms in Python and R. First, the debarcoded FCS files were individually down‐sampled using Mini‐Batch K‐Means clustering to yield 1000 clusters per sample. These highly granular clusters were then re‐clustered on a per‐sample basis using the SCANPY 10 implementation of the Leiden community detection algorithm. 11 This approach overcomes the computational limitations of implementing the Leiden algorithm directly on millions of individual cells, while still ensuring sufficiently high‐resolution and internally homogenous communities that can be mapped back to granular cell‐type definitions. The Leiden communities from each individual sample were then meta‐clustered using Leiden to generate consensus meta‐clusters across the entire sample set. The consensus meta‐clusters were then annotated to established cell type definitions based on the cosine similarity of each cluster to median marker reference datasets generated from representative manually gated samples stained with the same panel. The final cell type annotations were mapped back to the single cell level and evaluated for accuracy using conventional biaxial plots and heatmaps. The cell type annotations and high dimensional phenotype were visualized using Uniform Manifold Approximation and Projection for Dimension Reduction (UMAP) 12 , 13 and plotted with the plotnine package.
The cell counts, frequencies and median marker expression levels of the annotated cell subsets, excluding debris and known cell–cell multiplets, were exported for downstream statistical analyses. To identify the drivers of variance that account for the changes observed in cell frequencies, we derived the percentage of variance from each covariate (i.e., age, timepoint, severity) that explained changes in cell‐type frequencies by using the algorithm variancePartition. 14 , 15 Next, to more precisely identify changes in cellular populations we performed differential abundance analysis using the limma package. 16 Briefly, the annotated cell frequencies were used as input into a linear model fit using Severity as the outcome variable. Additionally, we modeled within‐patient variability by correlating biological replicates per cell type into a consensus correlation, which is a robust average of the individual correlations and allows us to adjust the linear model for individuals. Since all samples were stained using a fixed starting blood volume of 270 μl, to verify the observations using cell frequencies, we used the total CD45+ cell numbers as input, adjusted for sample size, and log2 normalized the cell frequencies before using linear modeling. Finally, the results were adjusted for multiple observations using the Benjamini‐Hochberg method, and the figures were produced with the ggplot2 package, 15 to represent fold change and false discovery rate (FDR). We performed one analysis evaluating the relative frequencies of more broadly defined cell subsets as a percentage of all CD45+ immune cells, and a second analysis where neutrophils were excluded and the frequencies of more granularly defined subsets were evaluated as a percentage of all non‐neutrophils.
3. RESULTS
3.1. SmartTube stabilization prior to MDIPA staining negatively impacts several antibodies
SmartTube proteomic stabilizer allows whole blood to be fixed and preserved with the addition of a single buffer followed by a 10‐min incubation, after which blood can be transferred to long‐term storage at −80°C and shipped to a remote core for downstream sample staining and processing. This workflow offers the advantage of a very rapid workflow that entails minimal sample processing at the site of collection, and has previously been effectively used to facilitate complex immune monitoring studies. 17 , 18 However, a limitation of this workflow is that the whole blood stabilization entails fixation, which is expected to impact some antibody epitopes. We evaluated this by taking two parallel aliquots of whole blood, processing one with the conventional MDIPA workflow, and fixing and freezing the second with SmartTube Prot1 stabilizer, followed by staining with the MDIPA panel. The data were analyzed by manual gating all major immune cell subsets and evaluating expression patterns of all 30 markers across all the gated populations (Figure 1A). We found that staining of some markers was preserved post‐fixation, while others were significantly compromised in comparison to the conventional MDIPA workflow as shown by a significant reduction in the correlation between marker expression across populations (Figure 1B). Notably, most chemokine receptors were dramatically affected, in many cases showing high non‐specific background staining resulting in an inability to distinguish true positive and negative populations, and an overall loss of staining index (Figure 1C). These results are consistent with our prior observations of the effect of formaldehyde fixation on chemokine receptor expression. 19 We also observed a reduced staining index for CD25 and CD127, two markers used to resolve CD4+ T regulatory cells. Thus, while immediate SmartTube fixation offers advantages in rapid blood processing, it is not compatible with all the antibodies used in the MDIPA panel.
FIGURE 1.
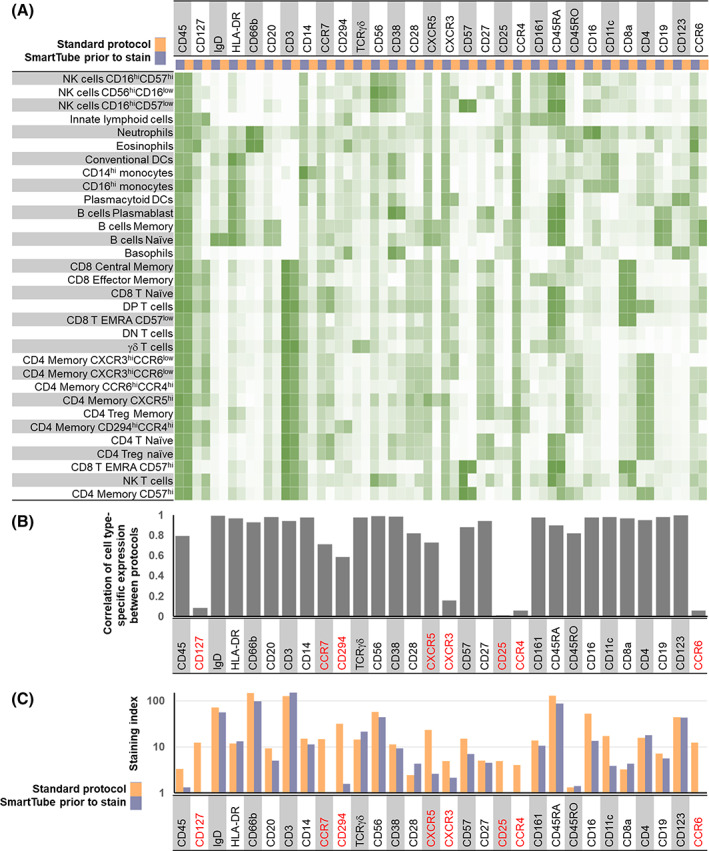
Application of the MDIPA panel to whole blood post‐SmartTube fixation negatively impacts resolution of some markers in the panel. Parallel aliquots of whole blood from the same heparin collection tube were stained using the conventional MDIPA workflow or post‐SmartTube fixation. (A) Heatmap of median marker expression of each marker on manually gated immune subsets using the two workflows. (B) Pearson's coefficient of the correlation of the expression of each marker across all subsets using the two workflows. (C) Staining index of each marker using the two workflows [Color figure can be viewed at wileyonlinelibrary.com]
3.2. SmartTube stabilization following staining faithfully preserves all antibody expression patterns and results in comparable cell frequencies to the conventional MDIPA workflow
We next evaluated a workflow where whole blood was first stained with the MDIPA panel and then fixed and frozen with the SmartTube stabilizer, which entails less than 45 min of upfront sample processing time with no centrifugation requirements. After a single addition of a relatively small amount of fixation and stabilizing buffer (1.4‐fold dilution of the starting blood volume), samples can be frozen and shipped to a remote site for subsequent processing. However, the fact that the cells were being fixed without much dilution of the staining antibodies raised the potential concern of elevated staining background and reduced staining quality due to cross linking of free antibodies to the cells. To evaluate this, we stained parallel aliquots of blood from three donors using the MDIPA antibody panel, after which one aliquot was processed according to the standard MDIPA protocol, while the other was fixed, frozen with SmartTube Prot1 and subsequently processed following the SmartTube thaw/lyse protocol. The data were manually gated and markers were compared across populations as in Figure 1. When evaluating marker expression between these two protocols, we found that the SmartTube workflow resulted in nearly identical staining patterns to the conventional MDIPA workflow (Figure 2). Almost all markers showed correlations of over 98% between the two protocols, and in many cases staining indexes were slightly higher with the SmartTube workflow indicating better resolution of cell populations (Figure 2B,C). In addition, we found that the SmartTube‐based workflow resulted in an approximately 35% greater recovery of CD45+ cells from the same starting volume of blood (Figure 3A). Overall relative cell population frequencies were highly correlated between both protocols (Figure 3B), and both protocols were able to clearly show consistent inter‐individual differences in the frequency of CD4 T cell memory subsets defined by differential chemokine receptor staining (Figure 3C).
FIGURE 2.
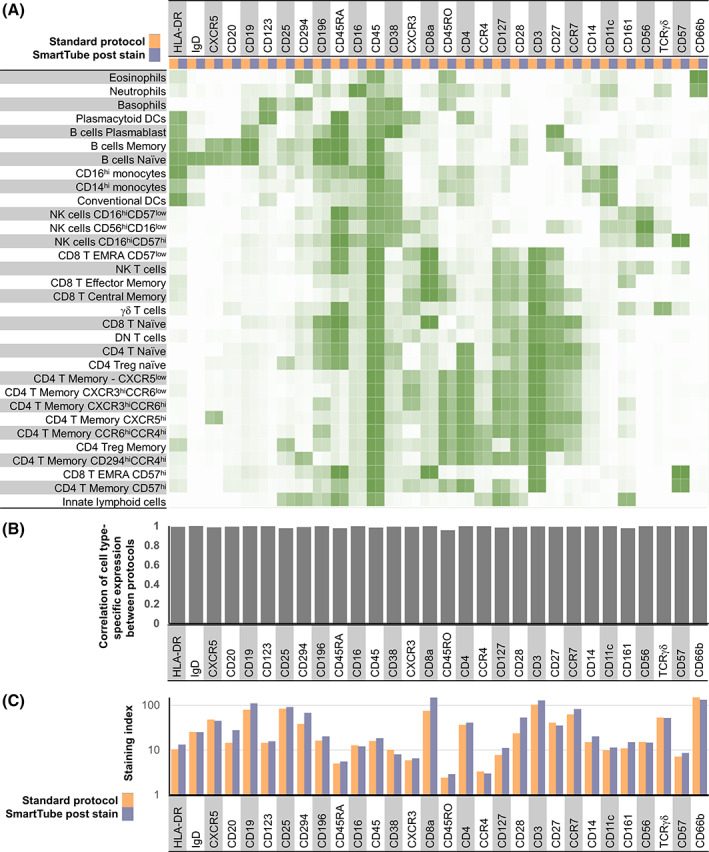
SmartTube‐fixation of MDIPA‐stained blood accurately reproduces staining patterns obtained with the conventional MDIPA workflow. Parallel aliquots of whole blood from the same heparin collection tube were stained using MDIPA panel and subsequently processed using the conventional MDIPA workflow or the modified SmartTube workflow. (A) Heatmap of median marker expression of each marker on manually gated immune subsets using the two workflows. (B) Pearson's coefficient of the correlation of the expression of each marker across all subsets using the two workflows. (C) Staining index of each marker using the two workflows [Color figure can be viewed at wileyonlinelibrary.com]
FIGURE 3.
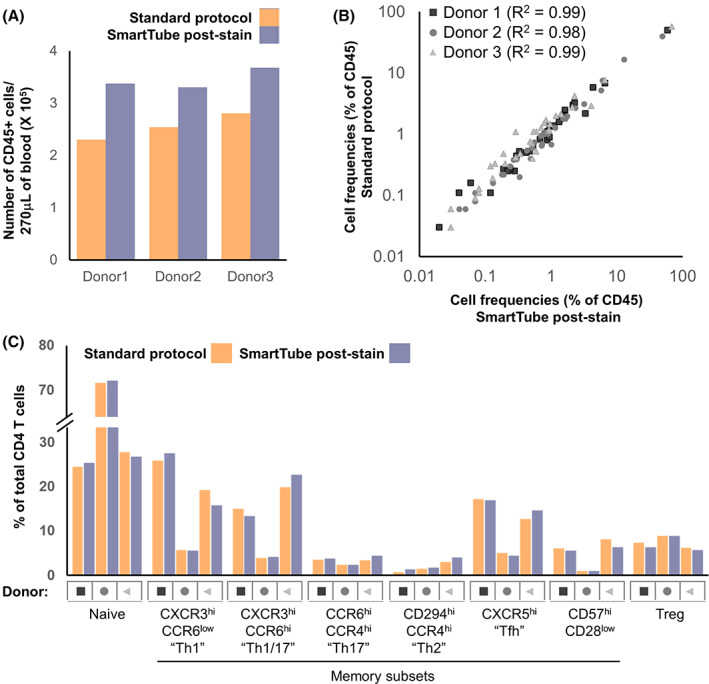
SmartTube‐fixation of MDIPA‐stained blood improves recovery and accurately reproduces cell frequencies obtained with the conventional MDIPA workflow. Parallel aliquots of whole blood from three donors were stained and analyzed as in Figure 3. (A) Overall recovery of CD45+ cells using the two workflows. (B) Correlation of overall cell frequencies for each gated cell type across all three donors. (C) Frequency of CD4+ memory T helper subsets defined by chemokine receptor expression using the two workflows [Color figure can be viewed at wileyonlinelibrary.com]
3.3. The SmartTube‐based workflow can be applied to whole blood collected in multiple tube types
Accurate immunophenotyping requires active steps to identify and minimize potential sources of non‐specific antibody staining. One well‐known source of non‐specific antibody staining is binding by Fc‐receptors. While this can be mitigated using Fc‐blocking reagents, this is generally not needed in whole blood staining workflows since endogenous serum antibodies effectively occupy and block Fc‐receptors. Another source of non‐specific antibody staining that is more specific to CyTOF whole blood workflows is a charge‐based interaction between cationic granule proteins which can result in non‐specific antibody binding by eosinophils. This non‐specific interaction can be effectively blocked using heparin, a strongly anionic compound. 6 While this problem primarily presents when performing intracellular staining on fixed whole blood, we were concerned that SmartTube fixation of the blood with relatively minimal antibody dilution may result in non‐specific binding of MDIPA antibodies. The majority of our initial tests were conducted using blood collected in sodium heparin vacutainers, which would be expected to prevent any such issues; however, we wanted to evaluate whether higher levels of non‐specific eosinophil antibody binding would occur when staining non‐heparinized blood and, if so, whether heparin supplementation could mitigate such artifacts. To evaluate this, we collected and stained three aliquots of blood collected from the same individual in either a sodium heparin tube, an EDTA tube, or a sodium citrate CPT tube. Samples were stained with the MDIPA panel and fixed with SmartTube stabilizer and analyzed as described above. We found that overall staining quality was very similar between the tube types, with no evidence of elevated eosinophil background staining in EDTA and citrate CPT tubes relative to heparin tubes (Figure S3A). Cell‐type specific marker expression patterns (Figure S3B‐C) and frequencies (Figure S3D) were highly correlated between the blood samples collected in all three tube types. However, we did observe some changes in relative staining intensity for some markers, most notably CD8a, which showed an almost 10‐fold reduction in staining intensity in blood collected in EDTA tubes relative to that collected heparin tubes (Figure S3C). Furthermore, supplementing additional heparin into the EDTA tubes did not have any measurable impact on staining quality (Figure S4). Overall, these data show that while staining quality is optimal in heparin tubes, overall staining patterns and relative population frequencies (data not shown) are largely preserved across tube types, indicating that this SmartTube stabilization workflow is broadly applicable to perform CyTOF immunophenotyping on blood samples collected in multiple tube types.
In addition to collection tube type, we also considered delays in the time between sample collection and staining as another factor that could potentially impact immunophenotyping results. While fresh whole blood samples should ideally be processed immediately, this may pose practical challenges in some circumstances. To evaluate the potential impact that delayed processing may have on immune cell frequencies and phenotype, aliquots of blood collected in a CPT tube were stained with the MDIPA panel immediately upon collection, or after storage for 4 and 9 h on a bench at room temperature. The samples were fixed with SmartTube stabilizer and analyzed as described above. Overall immune cellular phenotype and marker expression patterns were largely preserved across both time points relative to baseline (Figure S5). We did observe a relative reduction in the frequency of neutrophils and eosinophils and a corresponding increase in mononuclear cell frequencies which was apparent after even 4 h of storage. However, the frequencies of more granular immune subsets as a proportion of total mononuclear cells was largely preserved at 4 h, with all relative frequencies remaining within ~10% of those found in the baseline samples. Greater deviations were seen by 9 h, with an apparent increase in the relative frequencies of plasmablasts, dendritic cells and monocytes, and a corresponding decrease in the relative frequency of T cell subsets. Together, these results suggest that reliable immunophenotyping results can be expected from blood samples processed within 4 h of collection.
3.4. Whole blood stained with the core 30‐marker MDIPA can be stained with additional fixation‐resistant antibodies at a central processing site to facilitate more in‐depth analyses of specific subsets
The 30 marker MDIPA panel offers a consistent set of core markers to identify almost all major circulating immune cell types and allows for robust and highly standardized immune profiling. However, the current range of available metal isotopes allows for supplementation of this core panel with at least 16 additional antibodies to facilitate deeper characterization of specific cell types of interest. While additional markers can certainly be added to the whole blood at the time of MDIPA staining, this presents an additional need for reagents at the collection site and adds complication to the highly streamlined workflow of mixing blood with a single lyophilized reagent. As an alternative, additional markers can instead be added to the MDIPA‐stained blood as part of downstream sample processing at the central lab. However, as described in Figure 1, a caveat of staining blood post‐SmartTube fixation is that some antibody epitopes are compromised by this fixation process, so supplemental add‐ins must be limited to epitopes that are preserved post fixation. Prior work has already identified multiple antibody epitopes that are sensitive and resistant to formaldehyde fixation, and we further validated and expanded upon these results by systematically testing the performance of several relevant immune profiling antibodies on aliquots of the same blood sample pre‐ and post‐SmartTube fixation. To better evaluate the impact of fixation on some dynamic activation markers (e.g., CD86 and PD‐L1), we first stimulated whole blood with Phytohaemagglutinin (PHA) to induce marker upregulation. Fresh and stimulated whole blood samples were then stained with a set of phenotyping markers, after which parallel aliquots were stained with a range of additional markers either prior to or after Prot1 stabilization. Major immune cell subsets were defined based on the core phenotyping markers, and cell‐type specific marker expression patterns for each of the tested antibodies was evaluated on the paired pre‐ and post‐fixation. While the majority of antibodies showed highly correlated expression patterns, some showed extremely low correlations indicating a severe impact of fixation (Figure 4A). In most cases, the low correlations reflected a loss of detectable expression post‐fixation which was the case for NKG2A, NKG2C, CD88, and CD40; however, in the case of IgA and IgM, expression was only detectable on the post‐fixed samples (Figure 4B,C). This is likely due to interference from soluble serum IgA and IgM antibodies in fresh whole blood, which are effectively washed away during the Prot1 fixation and lysing protocol. Even amongst antibodies that showed highly correlated expression patterns between the pre‐ and post‐fixed samples, we observed some that showed a reduced staining index post fixation (e.g., CD71) and others that showed increased staining index (e.g., CD29). However, some of these differences could be minimized by re‐titration of the antibodies on the fixed blood samples, and all of these antibodies ultimately represent reasonable potential candidates to supplement MDIPA‐stained blood samples at the site of central downstream processing.
FIGURE 4.
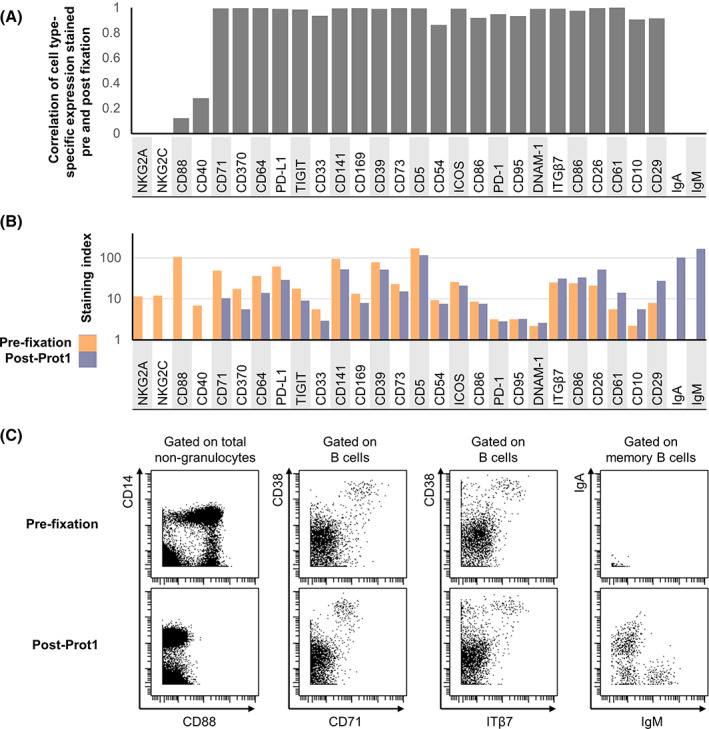
Evaluation of fixation‐stable markers to supplement the core MDIPA panel on SmartTube‐fixed whole blood. Aliquots of whole blood were stained with several panels of antibodies either prior to or following SmartTube fixation to evaluate the fixation sensitivity of different antibody clones. Each panel shared a core set of fixation‐stable markers, which were used to gate major immune cell subsets. (A) Pearson's coefficient of the correlation in the staining pattern of each antibody across the defined immune cell subsets when stained on fresh blood or post‐SmartTube fixation. (B) Staining index of each antibody when stained on fresh blood or post‐SmartTube fixation. (C) Representative biaxial plots highlighting staining patterns for antibodies where SmartTube fixation resulted in complete signal loss (CD88), reduced but still resolvable signal (CD71) or improved signal (ITß7, IgM, and IgA) [Color figure can be viewed at wileyonlinelibrary.com]
3.5. Application of the MDIPA‐SmartTube workflow to characterize immune dysregulation in hospitalized COVID‐19 patients
Our optimized MDIPA‐SmartTube protocol offers a highly standardized and streamlined workflow to perform comprehensive immune monitoring of whole blood samples. This approach is particularly well suited to large‐scale and multi‐center studies where blood samples are being processed under BSL2+/3 conditions by non‐specialist technicians. The minimal blood volumes required also allow for a relatively rapid comprehensive assessment of circulating immune cell composition and phenotype, while still allowing for the majority of collected blood to be used for PBMC isolation for biobanking efforts. This sample‐sparing aspect is also useful in settings where limited blood collection volumes, or underlying clinical conditions such as lymphopenia, may limit the number of PBMCs that can be successfully isolated and banked for immunophenotyping studies. Furthermore, the final concentration of formaldehyde in SmartTube Prot1 fixative is >2.5%, which has been shown to neutralize active virus 4 and thus allows subsequent processing of the blood to be safely performed under less stringent BSL conditions. These advantages make this workflow particularly well‐suited to standardized large‐scale immune monitoring of COVID‐19 patients. We have integrated this workflow as part of a large centralized COVID‐19 sample collection and biobanking effort at the Mount Sinai Health System, in which the initial whole blood processing and staining was performed by a large team of volunteers with no prior CyTOF expertise. 3 Here we present data from a subset of this hospitalized cohort as a demonstration of the power of this assay in resolving changes in circulating immune cell frequency and phenotype associated with COVID‐19 disease status and severity.
Whole blood samples were collected from 24 healthy donors and 72 hospitalized patients with PCR‐confirmed cases of COVID‐19 disease. Of these, 41 patients fit the criteria for moderate disease severity based on SpO2 < 94% or pneumonia based on imaging, and 31 fit the criteria for severe disease based on requirement for respiratory support using either non‐invasive or mechanical ventilation. Aliquots of blood from CPT‐Citrate tubes were stained with the MDIPA panel and then stabilized and cryopreserved with Prot1 stabilizer as described above. The stabilized blood samples were then thawed, barcoded using a combinatorial Pd‐barcoding system and then pooled and stained with a panel of fixation‐resistant antibodies. This barcoding approach offers the additional advantage of further streamlining downstream sample processing and minimizing any technical variability in subsequent staining acquisition so as to maximize the ability to accurately resolve subtle differences in protein expression. As discussed in the methods, we found that blood samples from some COVID‐19 patients exhibit high amount of debris, which we believe may be polymerized fibrin and other factors related to disease‐associated coagulopathy, and that it was important to perform additional washes and filtration post‐thaw to maximize sample recovery and ensure optimal data quality.
The resulting data from 184 samples were analyzed by Leiden community detection on a per sample basis followed by meta‐clustering across all samples. The resulting consensus Leiden meta‐clusters were annotated based on median marker similarity to reference manually gated datasets. These cell type annotations were mapped back to single cell level and evaluated for accuracy at the single cell level, single sample cluster level, and overall cluster level. The median marker expression for each of the annotated cell types is shown in Figure S6. Visualizing the aggregated annotated data using UMAP showed well resolved structure consistent with the cell type annotations and highlighted clear differences in cell type composition and phenotype between the healthy controls and the hospitalized COVID‐19 patients (Figure 5A). When evaluating relative frequencies of broadly defined cell populations, the most notable change in the COVID‐19 patients was an elevated frequency of neutrophils, which was further increased in patients with more severe disease (Figure 5B), consistent with other reports. 20 , 21 , 22 In addition, there was a significant reduction in overall lymphocytes, particularly T cells and NK cells, which was also further exacerbated in patients with more severe disease.
FIGURE 5.
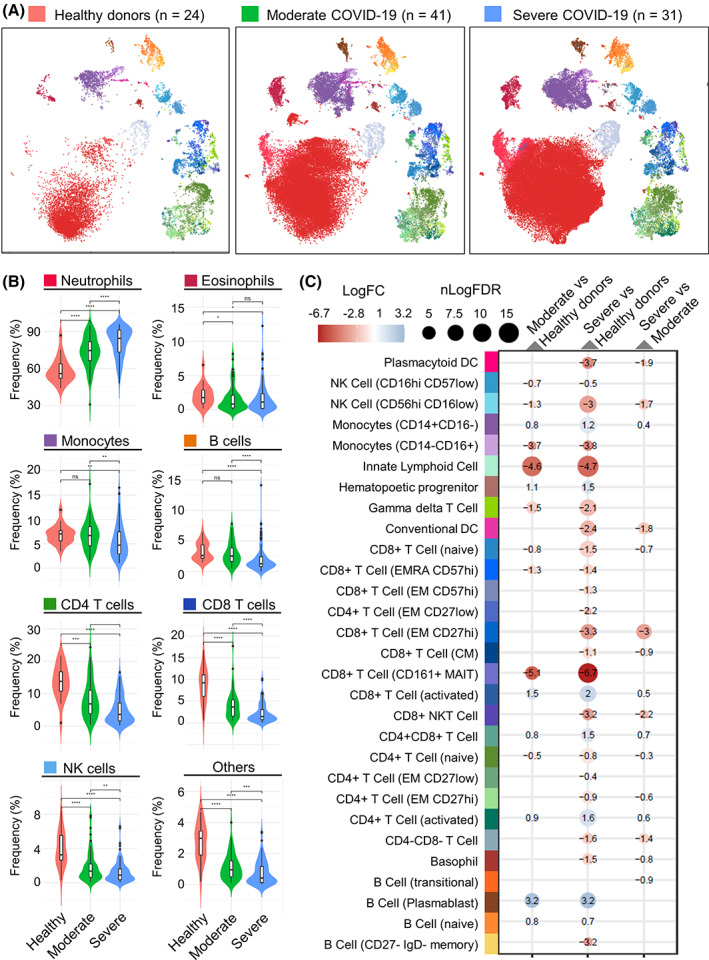
Application of the SmartTube MDIPA workflow to immune monitoring of COVID‐19 patients. A total of 184 whole blood aliquots were collected from 24 healthy donors and 72 hospitalized COVID‐19 patients (61 samples from 41 patients with moderate disease and 102 samples from 31 patients with severe disease) and stained with the MDIPA‐SmartTube workflow as described above. Samples were clustered and meta‐clustered with using the Leiden community detection algorithm and the meta‐clusters were aggregated and annotated to define cell subsets. (A) UMAP plots showing the phenotypic distribution of cells in aggregated samples across the three subject groups with colors representing annotated immune cell subsets. To allow effective visualization of the large volume of data, each point on each UMAP represents a K‐means down‐sampled cluster from each of the analyzed samples (1000 clusters per sample). (B) Violin plots showing the changes in relative frequency of major immune cell subsets as a percentage of all CD45+ cells across the three cohorts. Cell type colors are broadly aligned to the UMAP plots in A, and asterisks indicate statistically significant differences between groups based on Wilcoxon signed‐rank tests. (C) Integrated heatmap/dotplot showing fold change and false discovery rate (FDR) between the three cohorts of more granularly‐defined immune cell subsets as a percentage of non‐neutrophils. The only cell types shown are those that passed FDR threshold in one of the comparisons. Cell type colors are exactly aligned to the UMAP plots in A [Color figure can be viewed at wileyonlinelibrary.com]
Given that the high abundance of neutrophils was a major driver of relative cell frequency, we evaluated differences in more granularly‐defined immune cell subsets as a percentage of non‐neutrophils. Differential abundance analysis adjusting for covariates highlighted several differences relating to both COVID status and disease severity (Figure 5C). Expanding on the overall reduction in T cells, this analysis showed reduction in several T cell subsets including naïve CD4+ and CD8+ T cells, γδ T cell, and most dramatically CD161+ MAIT‐like CD8+ T cells. We also observed reductions in CD56hi CD16low NK cells and Innate Lymphoid Cells. Reciprocally, we observed elevated frequencies of CD16low monocytes, plasmablasts and CD38 + HLADR+ activated CD4+ and CD8+ T cells, though the magnitude of the changes in these latter subsets varied considerably between patients (Figure S7), consistent with other reports. 23 In most cases, the most dramatic and significant fold changes were observed when comparing healthy controls to either of the hospitalized COVID‐19 cohorts. Differences in relation to disease severity between the moderate and severe patients were more limited, though we noted a reduced frequency of conventional and plasmacytoid dendritic cells in severe disease, and a slight increase in the frequency of activated T cells.
In addition to changes in overall cell type frequencies, we also observed profound changes in the phenotype of circulating myeloid cells, and longitudinal sampling indicated that some of these changes were highly dynamic. For example, we also observed a striking increase in expression of CD169 (sialoadhesin) on monocytes in a subset of both moderate and severe COVID‐19 patients (Figure 6A). CD169 is constitutively expressed on subsets of tissue resident macrophages 20 and is induced on circulating monocytes by type I interferon signaling. 21 Elevated CD169 expression has been reported on circulating monocytes in patients with systemic sclerosis, 21 acute HIV infection 22 , 23 and acute zika‐virus infection. 24 Expression of CD169 on monocytes in COVID‐19 patients may therefore offer a cellular biomarker of acute type I IFN signaling. However, longitudinal sampling showed that CD169 expression was initially elevated in both moderate and severe patients and that expression was highly dynamic and typically decreased rapidly in the space of a few days in all patients (Figure 6B), consistent with other reports. 24 , 25 Given that patients likely present to the hospital at different times relative to their initial date of infection, differences in CD169 may likely reflect differences in timing from onset of infection, which in many cases is difficult to accurately determine, suggesting caution in over‐interpreting CD169 expression in relation to disease severity.
FIGURE 6.
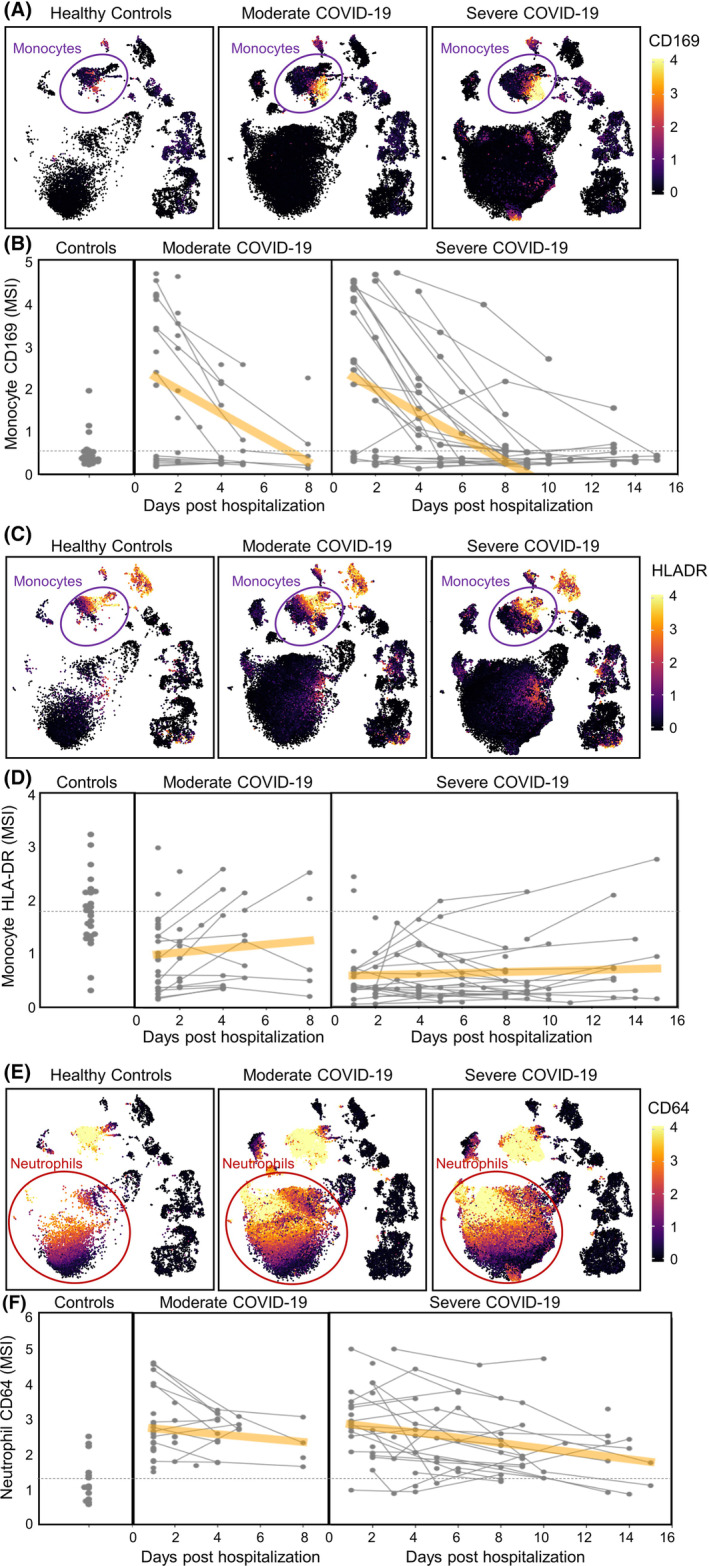
Identification of both dynamic and durable changes in myeloid cell phenotype in COVID‐19 patients. Longitudinal aliquots of whole blood from 72 hospitalized COVID‐19 patients (41 with moderate disease and 31 with severe disease) and 24 healthy donors were stained with the MDIPA‐SmartTube workflow and analyzed as described. (A) UMAP plots matched to those in Figure 5A showing median expression of CD169 on aggregated samples from each of the three cohorts. Each point on each UMAP represents a K‐means down‐sampled cluster from each of the analyzed samples (1000 clusters per sample), colored by median arcsinh‐transformed CD169 intensity. (B) Median arcsinh‐transformed CD169 intensity on annotated CD14 + CD16− monocytes is shown for each sample in each cohort over the collection period. Each point represents a whole blood sample and collection date relative to initial date of hospitalization, and longitudinal samples from the same subject are indicated by linked lines. The dashed line indicates the mean CD169 expression in the control cohort and the orange line represents a linear regression to indicate the time dependency of marker changes within each of the COVID‐19 cohorts. (C and D) Similar representations of HLA‐DR intensity visualized by UMAP, and longitudinal changes of arcsinh‐transformed median HLA‐DR intensity on CD14 + CD16− monocytes. (E and F) Similarly representations of CD64 intensity visualized by UMAP, and longitudinal changes of arcsinh‐transformed median CD64 intensity on annotated neutrophils [Color figure can be viewed at wileyonlinelibrary.com]
We also observed subpopulations of monocytes with reduced HLA‐DR expression, which were notably increased in COVID‐19 patients and associated with disease severity (Figure 6C), which was consistent with previous reports. 26 , 27 , 28 Longitudinal analyses showed that dysregulated HLA‐DR expression was also dynamic and typically increased over the course of the hospital stay (Figure 6D). However, the kinetics of these changes were typically slower than those of CD169, and in some patients, particularly those with more severe disease, reduced HLA‐DR expression persisted for the duration of the hospital stay.
In addition to changes in monocyte phenotype, we also observed dramatic changes in neutrophil phenotype, most notably elevated CD64 expression, which has previously been seen in the setting of sepsis and has been proposed as a biomarker of bacterial infection. 29 Once again, longitudinal analyses revealed the dynamic nature of these changes, with a progressive decrease in most patients. However, as with reduced HLA‐DR expression on monocytes, elevated CD64 expression on neutrophils was more persistent and, in many cases, remained elevated above the levels seen in controls for the duration of the hospital stay. This is also consistent with our earlier report of elevated neutrophil CD64 expression in the absence of monocyte CD169 expression in children suffering from multisystem inflammatory syndrome >1 month after initial SARS‐CoV‐2 infection. 30
Together, these results highlight key features of COVID‐19 associated immune dysregulation and broadly demonstrate the applicability of this assay to large‐scale studies to characterize changes in circulating immune cell frequency and phenotype.
4. DISCUSSION
Overall, we believe that the data provided here provide a validation of a streamlined, sample‐sparing whole blood immune monitoring workflow (Figure S1) and offer data to support important considerations in terms of vacutainer selection, storage duration prior to staining, and the incorporation of additional markers to supplement the core MDIPA panel. We also demonstrate and discuss important considerations in the successful application of this protocol to characterize immune responses in COVID‐19 patients. Comprehensive longitudinal immune profiling of 184 whole blood samples from 72 hospitalized COVID‐19 patients and 24 healthy controls identifies elevated neutrophil frequencies and reduced T cell frequencies as clear biomarkers of COVID‐19 disease severity, but also highlights acute adaptive immune responses in some patients, represented by elevated frequencies of plasmablasts and activated CD4+ and CD8+ T cells. We also show profound changes in myeloid cell phenotype, including reduced HLA‐DR expression and elevated CD169 expression on monocytes, and elevated CD64 expression on neutrophils. Furthermore, our data clearly illustrate the highly dynamic nature of these phenotypic changes and establish that it is critically important to consider the time from infection onset and the kinetics of disease progression in interpreting these changes. Studies that relate differences in CD169 to COVID‐19 disease severity may be confounded by insufficient consideration of these kinetics. 31 , 32
This protocol already offers a simple workflow that requires only two pipetting steps and no need for centrifugation equipment at the site of sample collection. Based on the ease of use, this protocol is currently being deployed as part of the NIAID Immunophenotyping assessment in a COVID‐19 Cohort (IMPACC) study, which aims to perform standardized longitudinal immune monitoring of 2000 patients from 12 clinical collection sites across the United States. However, despite the improvements that we have presented here to streamlined and simplify the workflow, the protocol still requires an appropriate BSL‐approved environment to process the blood samples, and the ability to accurately pipette and time the addition of the necessary volumes, which may still not be possible at some resource‐limited clinical collection sites. Thus, a next logical step toward enabling even broader adoption of these workflows would be to pre‐package the lyophilized antibody panel as part of a syringe based fixed‐volume blood collection device, such as TruCulture system, 33 and to automate the timing and addition of the stabilization buffer and cryopreservation steps, using a device such as the SmartTube base station.
AUTHOR CONTRIBUTIONS
Daniel Geanon: Data curation; formal analysis; investigation; methodology; writing‐original draft; writing‐review and editing. Brian Lee: Data curation; formal analysis; investigation; methodology; writing‐review and editing. Edgar Gonzalez‐Kozlova: Formal analysis; methodology; visualization; writing‐original draft. Geoffrey Kelly: Data curation; investigation; methodology; writing‐review and editing. Diana Handler: Data curation; investigation; methodology; writing‐review and editing. Bhaskar Upadhyaya: Investigation; methodology; writing‐review and editing. John Leech: Investigation; project administration; writing‐review and editing. Ronaldo De Real: Data curation; investigation; methodology. Manon Herbinet: Investigation; methodology. Assaf Magen: Formal analysis; visualization. Diane Del Valle: Data curation; software; writing‐review and editing. Alexander Charney: Funding acquisition; project administration. Seunghee Kim‐Schulze: Project administration; supervision; writing‐review and editing. Sacha Gnjatic: Funding acquisition; project administration; supervision; writing‐review and editing. Miriam Merad: Funding acquisition; project administration; supervision; writing‐review and editing. Adeeb Rahman: Conceptualization; data curation; formal analysis; funding acquisition; methodology; project administration; supervision; visualization; writing‐original draft.
CONFLICT OF INTEREST
The authors have no conflicts to disclose.
Supporting information
Figure S1 Graphical overview of the MDIPA‐SmartTube workflow.
Figure S2 Gating strategy used to define immune populations with the MDIPA panel. (A) Schematic of the manual gating hierarchy used to define immune populations. (B) Correlation between population cell counts determined by manual gating and MaxPar PathSetter analysis in two validation samples.
Figure S3 The SmartTube‐MDIPA workflow can be successfully applied to whole blood collected using multiple kinds of anticoagulant tubes. Whole blood was collected from the same healthy donor into a sodium heparin tube, an EDTA tube or a CPT‐citrate tube. Aliquots from each tube were stained with the MDIPA‐SmartTube workflow. (A) Heatmap of median marker expression of each marker on manually gated immune subsets in blood collected in each of the three tube types. (B) Pearson's coefficient of the correlation of the expression of each marker across all subsets in each of the three tube types. (C) Staining index of each marker in each of the three tube types. (D) Correlation of overall population frequencies for each gated cell type between the three tube types.
Figure S4 Additional heparin supplementation has no appreciable impact on staining quality or non‐specific background staining of blood collected in EDTA tubes. Parallel aliquots of healthy donor whole blood collected in an EDTA tube were stained with the MDIPA‐SmartTube workflow with or without additional heparin supplementation. (A) Heatmap of median marker expression of each marker on manually gated immune subsets using the two workflows. (B) Pearson's coefficient of the correlation of the expression of each marker across all subsets using the two workflows. (C) Staining index of each marker using the two workflows.
Figure S5 Impact of delayed processing time on staining patterns and population frequencies. Blood was collected from a healthy donor in a CPT‐Citrate tube and left resting on a bench at room temperature with no agitation to replicate delayed processing after collection. At time intervals of 0, 4, and 9 h after collection, aliquots of blood were removed from the tube and stained with the MDIPA‐SmartTube workflow. After thawing, the samples were also stained with a supplemental CD61 antibody to evaluate potential formation of platelet‐leukocyte aggregates. (A) Heatmap of median marker expression of each marker on manually gated immune subsets at each of the timepoints. (B) Frequency of each gated immune cell subset at each timepoint. (C) Fold change in the frequency of each subset at 4 and 9 h relative to time 0.
Figure S6 Median marker expression levels across annotated cell types. (A) Aggregate UMAP of all the samples shown in Figure 5A colored by cell type annotation. Each point represents a K‐means down‐sampled cluster from each of the analyzed samples (1000 clusters per sample). (B) Heatmap showing the cell type definition and median marker expression for each of the cell types shown on the UMAP averaged across all samples.
Figure S7 Population frequencies across the three cohorts. Combined swarm/violin plots showing the frequencies of each of the defined subsets across all samples in the three cohorts corresponding to Figure 5C. Asterisks are shown to indicate significance comparisons between the three groups based on Wilcoxon tests, however these have not been subjected to the same covariate or multiple comparisons corrections as the values shown in Figure 5C.
MIFlowCyt item checklist.
ACKNOWLEDGMENTS
We thank all the members of the Mt. Sinai Human Immune Monitoring Center and the many individuals who contributed to the Mt. Sinai Precision Immunology COVID‐19 Repository effort. This work was supported by NIH U19AI118610 (M.M. and A.R.), U24AI118644 (M.M. and A.R., U24CA224319 (S.G. and A.R.). Helios mass cytometry instrumentation at the Human Immune Monitoring Center was obtained with support from S10OD023547.
Geanon D, Lee B, Gonzalez‐Kozlova E, et al. A streamlined whole blood CyTOF workflow defines a circulating immune cell signature of COVID‐19. Cytometry. 2021;99:446–461. 10.1002/cyto.a.24317
Daniel Geanon and Brian Lee contributed equally to this study.
Funding information National Cancer Institute, Grant/Award Number: U24CA224319; National Institute of Allergy and Infectious Diseases, Grant/Award Numbers: U19AI118610, U24AI118644; NIH‐Office of Research Infrastructure Programs, Grant/Award Number: S10OD023547
DATA AVAILABILITY STATEMENT
Annotated FCS files have been deposited in FLOWRepository under ID: FR‐FCM‐Z2XA, FR‐FCM‐Z2XB, and FR‐FCM‐Z36F.
REFERENCES
- 1. Chan RC‐F, Kotner JS, Chuang CM‐H, Gaur A. Stabilization of pre‐optimized multicolor antibody cocktails for flow cytometry applications. Cytometry B Clin Cytom. 2017;92:508–24. [DOI] [PubMed] [Google Scholar]
- 2. Bagwell CB, Hunsberger B, Hill B, Herbert D, Bray C, Selvanantham T, et al. Multi‐site reproducibility of a human immunophenotyping assay in whole blood and peripheral blood mononuclear cells preparations using CyTOF technology coupled with Maxpar Pathsetter, an automated data analysis system. Cytometry B Clin Cytom. 2020;98:146–60. [DOI] [PMC free article] [PubMed] [Google Scholar]
- 3. Charney AW, Simons NW, Mouskas K, Lepow L, Cheng E, Le Berichel J, et al. Sampling the host response to SARS‐CoV‐2 in hospitals under siege. Nat Med. 2020;26:1157–8. [DOI] [PubMed] [Google Scholar]
- 4. Jureka AS, Silvas JA, Basler CF. Propagation, inactivation, and safety testing of SARS‐CoV‐2. Viruses. 2020;12(6):622. 10.3390/v12060622. [DOI] [PMC free article] [PubMed] [Google Scholar]
- 5. Amir E‐AD, Guo XV, Mayovska O, Rahman AH. Average overlap frequency: a simple metric to evaluate staining quality and community identification in high dimensional mass cytometry experiments. J Immunol Methods. 2018;453:20–9. [DOI] [PubMed] [Google Scholar]
- 6. Rahman AH, Tordesillas L, Berin MC. Heparin reduces nonspecific eosinophil staining artifacts in mass cytometry experiments. Cytometry A. 2016;89:601–7. [DOI] [PMC free article] [PubMed] [Google Scholar]
- 7. Fread KI, Strickland WD, Nolan GP, Zunder ER. An updated debarcoding tool for mass cytometry with cell type‐specific and cell sample‐specific stringency adjustment. Pac. Symp. Biocomput. Pac Symp Biocomput. 2017;22:588–98. [DOI] [PubMed] [Google Scholar]
- 8. Anon . Clustergrammer, a web‐based heatmap visualization and analysis tool for high‐dimensional biological data|Scientific Data [cited 2020 Jun 24]. Available from: https://www.nature.com/articles/sdata2017151. [DOI] [PMC free article] [PubMed]
- 9. Geanon D, Lee B, Rahman AH. Donor‐specific plasma factors contribute to aberrant staining artifacts with a commercial lyophilized mass cytometry antibody panel. bioRxiv. 2020; 2020.11.30.405027. 10.1101/2020.11.30.405027. [DOI] [Google Scholar]
- 10. Wolf FA, Angerer P, Theis FJ. SCANPY: large‐scale single‐cell gene expression data analysis. Genome Biol. 2018;19:15. [DOI] [PMC free article] [PubMed] [Google Scholar]
- 11. Traag VA, Waltman L, van Eck NJ. From Louvain to Leiden: guaranteeing well‐connected communities. Sci Rep. 2019;9:5233. [DOI] [PMC free article] [PubMed] [Google Scholar]
- 12. Becht E, McInnes L, Healy J, Dutertre C‐A, Kwok IWH, Ng LG, et al. Dimensionality reduction for visualizing single‐cell data using UMAP. Nat Biotechnol. 2019;37:38–44. [DOI] [PubMed] [Google Scholar]
- 13. McInnes L, Healy J, Melville J. UMAP: Uniform Manifold Approximation and Projection for Dimension Reduction. 2018. [cited 2020 Dec 7]. Available from: https://arxiv.org/abs/1802.03426v3.
- 14. Hoffman GE, Roussos P. Dream: powerful differential expression analysis for repeated measures designs. Bioinformatics. 2020;1–10. 10.1093/bioinformatics/btaa687. [DOI] [PMC free article] [PubMed] [Google Scholar]
- 15. Hoffman GE, Schadt EE. variancePartition: interpreting drivers of variation in complex gene expression studies. BMC Bioinform. 2016;17:483. [DOI] [PMC free article] [PubMed] [Google Scholar]
- 16. Ritchie ME, Phipson B, Wu D, Hu Y, Law CW, Shi W, et al. limma powers differential expression analyses for RNA‐sequencing and microarray studies. Nucleic Acids Res. 2015;43:e47–7. [DOI] [PMC free article] [PubMed] [Google Scholar]
- 17. Gaudillière B, Fragiadakis GK, Bruggner RV, Nicolau M, Finck R, Tingle M, et al. Clinical recovery from surgery correlates with single‐cell immune signatures. Sci Transl Med. 2014;6:255ra131–1. [DOI] [PMC free article] [PubMed] [Google Scholar]
- 18. Glassberg J, Rahman AH, Zafar M, Cromwell C, Punzalan A, Badimon JJ, et al. Application of phospho‐CyTOF to characterize immune activation in patients with sickle cell disease in an ex vivo model of thrombosis. J Immunol Methods. 2018;453:11–9. [DOI] [PMC free article] [PubMed] [Google Scholar]
- 19. Amir ED, Lee B, Badoual P, Gordon M, Guo XV, Merad M, et al. Development of a comprehensive antibody staining database using a standardized analytics pipeline. Front Immunol. 2019;10. [cited 2020 June 24]. Available from: http://dx.doi.org/10.3389/fimmu.2019.01315. [DOI] [PMC free article] [PubMed] [Google Scholar]
- 20. Carissimo G, Xu W, Kwok I, Abdad MY, Chan Y‐H, Fong S‐W, et al. Whole blood immunophenotyping uncovers immature neutrophil‐to‐VD2 T‐cell ratio as an early marker for severe COVID‐19. Nat Commun. 2020;11:5243. [DOI] [PMC free article] [PubMed] [Google Scholar]
- 21. Kong M, Zhang H, Cao X, Mao X, Lu Z. Higher level of neutrophil‐to‐lymphocyte is associated with severe COVID‐19. Epidemiol Infect. 2020;148. [cited 2020 Dec 6]. Available from: https://www.ncbi.nlm.nih.gov/pmc/articles/PMC7360950/:e139. [DOI] [PMC free article] [PubMed] [Google Scholar]
- 22. Wang J, Li Q, Yin Y, Zhang Y, Cao Y, Lin X, et al. Excessive neutrophils and neutrophil extracellular traps in COVID‐19. Front Immunol. 2020;11. [cited 2020 Dec 6]. Available from: http://dx.doi.org/10.3389/fimmu.2020.02063. [DOI] [PMC free article] [PubMed] [Google Scholar]
- 23. Mathew D, Giles JR, Baxter AE, Greenplate AR, Wu JE, Alanio C, et al. Deep immune profiling of COVID‐19 patients reveals patient heterogeneity and distinct immunotypes with implications for therapeutic interventions. bioRxiv. 2020; 2020.05.20.106401. [DOI] [PMC free article] [PubMed] [Google Scholar]
- 24. Bedin A‐S, Makinson A, Picot M‐C, Mennechet F, Malergue F, Pisoni A, et al. Monocyte CD169 expression as a biomarker in the early diagnosis of COVID‐19. medRxiv. 2020; 2020.06.28.20141556. [Google Scholar]
- 25. Chevrier S, Zurbuchen Y, Cervia C, Adamo S, Raeber ME, Souza N d, et al. A distinct innate immune signature marks progression from mild to severe COVID‐19. bioRxiv. 2020; 2020.08.04.236315. [DOI] [PMC free article] [PubMed] [Google Scholar]
- 26. Giamarellos‐Bourboulis EJ, Netea MG, Rovina N, Akinosoglou K, Antoniadou A, Antonakos N, et al. Complex immune dysregulation in COVID‐19 patients with severe respiratory failure. Cell Host Microbe. 2020;27:992–1000.e3. [DOI] [PMC free article] [PubMed] [Google Scholar]
- 27. Lombardi A, Trombetta E, Cattaneo A, Castelli V, Palomba E, Tirone M, et al. Early phases of COVID‐19 are characterized by a reduction of lymphocyte populations and the presence of atypical monocytes. medRxiv. 2020; 2020.05.01.20087080. [DOI] [PMC free article] [PubMed] [Google Scholar]
- 28. Benlyamani I, Venet F, Coudereau R, Gossez M, Monneret G. Monocyte HLA‐DR measurement by flow cytometry in COVID‐19 patients: an interim review. Cytometry A 2020;97:1217–21. https://doi.org/10.1002/cyto.a.24249. [DOI] [PubMed] [Google Scholar]
- 29. Li S, Huang X, Chen Z, Zhong H, Peng Q, Deng Y, et al. Neutrophil CD64 expression as a biomarker in the early diagnosis of bacterial infection: a meta‐analysis. Int J Infect Dis IJID Off Publ Int Soc Infect Dis. 2013;17:e12–23. [DOI] [PubMed] [Google Scholar]
- 30. Gruber CN, Patel RS, Trachtman R, Lepow L, Amanat F, Krammer F, et al. Mapping systemic inflammation and antibody responses in multisystem inflammatory syndrome in children (MIS‐C). Cell. 2020;183:982–995.e14. [DOI] [PMC free article] [PubMed] [Google Scholar]
- 31. Silvin A, Chapuis N, Dunsmore G, Goubet A‐G, Dubuisson A, Derosa L, et al. Elevated calprotectin and abnormal myeloid cell subsets discriminate severe from mild COVID‐19. Cell. 2020;182:1401–1418.e18. [DOI] [PMC free article] [PubMed] [Google Scholar]
- 32. Roussel M, Ferrant J, Reizine F, Gallou SL, Dulong J, Carl S, et al. Mass cytometry and artificial intelligence define CD169 as a specific marker of SARS‐CoV2‐induced acute respiratory distress syndrome. bioRxiv. 2020; 2020.09.22.307975. [Google Scholar]
- 33. Duffy D, Rouilly V, Braudeau C, Corbière V, Djebali R, Ungeheuer M‐N, et al. Standardized whole blood stimulation improves immunomonitoring of induced immune responses in multi‐center study. Clin Immunol. 2017;183:325–35. [DOI] [PubMed] [Google Scholar]
Associated Data
This section collects any data citations, data availability statements, or supplementary materials included in this article.
Supplementary Materials
Figure S1 Graphical overview of the MDIPA‐SmartTube workflow.
Figure S2 Gating strategy used to define immune populations with the MDIPA panel. (A) Schematic of the manual gating hierarchy used to define immune populations. (B) Correlation between population cell counts determined by manual gating and MaxPar PathSetter analysis in two validation samples.
Figure S3 The SmartTube‐MDIPA workflow can be successfully applied to whole blood collected using multiple kinds of anticoagulant tubes. Whole blood was collected from the same healthy donor into a sodium heparin tube, an EDTA tube or a CPT‐citrate tube. Aliquots from each tube were stained with the MDIPA‐SmartTube workflow. (A) Heatmap of median marker expression of each marker on manually gated immune subsets in blood collected in each of the three tube types. (B) Pearson's coefficient of the correlation of the expression of each marker across all subsets in each of the three tube types. (C) Staining index of each marker in each of the three tube types. (D) Correlation of overall population frequencies for each gated cell type between the three tube types.
Figure S4 Additional heparin supplementation has no appreciable impact on staining quality or non‐specific background staining of blood collected in EDTA tubes. Parallel aliquots of healthy donor whole blood collected in an EDTA tube were stained with the MDIPA‐SmartTube workflow with or without additional heparin supplementation. (A) Heatmap of median marker expression of each marker on manually gated immune subsets using the two workflows. (B) Pearson's coefficient of the correlation of the expression of each marker across all subsets using the two workflows. (C) Staining index of each marker using the two workflows.
Figure S5 Impact of delayed processing time on staining patterns and population frequencies. Blood was collected from a healthy donor in a CPT‐Citrate tube and left resting on a bench at room temperature with no agitation to replicate delayed processing after collection. At time intervals of 0, 4, and 9 h after collection, aliquots of blood were removed from the tube and stained with the MDIPA‐SmartTube workflow. After thawing, the samples were also stained with a supplemental CD61 antibody to evaluate potential formation of platelet‐leukocyte aggregates. (A) Heatmap of median marker expression of each marker on manually gated immune subsets at each of the timepoints. (B) Frequency of each gated immune cell subset at each timepoint. (C) Fold change in the frequency of each subset at 4 and 9 h relative to time 0.
Figure S6 Median marker expression levels across annotated cell types. (A) Aggregate UMAP of all the samples shown in Figure 5A colored by cell type annotation. Each point represents a K‐means down‐sampled cluster from each of the analyzed samples (1000 clusters per sample). (B) Heatmap showing the cell type definition and median marker expression for each of the cell types shown on the UMAP averaged across all samples.
Figure S7 Population frequencies across the three cohorts. Combined swarm/violin plots showing the frequencies of each of the defined subsets across all samples in the three cohorts corresponding to Figure 5C. Asterisks are shown to indicate significance comparisons between the three groups based on Wilcoxon tests, however these have not been subjected to the same covariate or multiple comparisons corrections as the values shown in Figure 5C.
MIFlowCyt item checklist.
Data Availability Statement
Annotated FCS files have been deposited in FLOWRepository under ID: FR‐FCM‐Z2XA, FR‐FCM‐Z2XB, and FR‐FCM‐Z36F.