Abstract
5‐Fluorouracil (5‐FU) is a widely used chemotherapeutic drug, but the mechanisms underlying 5‐FU efficacy in immunocompetent hosts in vivo remain largely elusive. Through modeling 5‐FU response of murine colon and melanoma tumors, we report that effective reduction of tumor burden by 5‐FU is dependent on anti‐tumor immunity triggered by the activation of cancer‐cell‐intrinsic STING. While the loss of STING does not induce 5‐FU resistance in vitro, effective 5‐FU responsiveness in vivo requires cancer‐cell‐intrinsic cGAS, STING, and subsequent type I interferon (IFN) production, as well as IFN‐sensing by bone‐marrow‐derived cells. In the absence of cancer‐cell‐intrinsic STING, a much higher dose of 5‐FU is needed to reduce tumor burden. 5‐FU treatment leads to increased intratumoral T cells, and T‐cell depletion significantly reduces the efficacy of 5‐FU in vivo. In human colorectal specimens, higher STING expression is associated with better survival and responsiveness to chemotherapy. Our results support a model in which 5‐FU triggers cancer‐cell‐initiated anti‐tumor immunity to reduce tumor burden, and our findings could be harnessed to improve therapeutic effectiveness and toxicity for colon and other cancers.
Keywords: 5‐FU resistance, Dacarbazine, Ifnb, Mb21d1, Tmem173
Subject Categories: Cancer, Immunology
Sensitivity to the widely used chemotherapeutic drug 5‐FU is determined by STING‐dependent type I interferon signaling in tumor cells.

Introduction
5‐FU is a chemotherapeutic drug widely used in the treatment of a range of cancers, including colorectal, pancreatic, gastric, biliary, small intestinal, head, and neck and breast cancers (Longley et al, 2003). 5‐FU has been incorporated as the backbone drug of the FOLFOX (Giacchetti et al, 2000) and the FOLFIRI chemotherapy regimens (Douillard et al, 2000) for colorectal and other cancer types. For colorectal cancer, which is the second most lethal cancer in the United States and worldwide, conventional cytotoxic chemotherapy remains a key treatment modality for advanced‐stage diseases, yet clinical responses vary substantially among patients (Ikoma et al, 2017). This leads to the important question of what determines the sensitivity and response to 5‐FU in vivo. The cell‐intrinsic mechanisms of 5‐FU sensitivity and resistance have been extensively studied (Longley et al, 2003; Zhang et al, 2008), mostly in cultured cells. 5‐FU is an analogue of uracil with a fluorine atom at the C‐5 position in place of hydrogen. One of the major mechanisms of 5‐FU is the inhibition of thymidylate synthase, which is required for synthesizing dTMP from dUMP and the folate derivative 5,10‐methylenetetrahydrofolate. In addition to thymidylate synthase inhibition, 5‐FU can also be metabolized into FUTP which can be incorporated into RNA to disrupt RNA processing and function and thus causing cytotoxicity. A variety of mechanisms have been identified that can cause cell‐intrinsic resistance to 5‐FU (Longley et al, 2003; Zhang et al, 2008), including but not limited to the overexpression of thymidylate synthase, increased catabolism of 5‐FU into inactive forms, and the expression of multidrug resistance proteins (Copur et al, 1995; Danenberg et al, 1995; Takebe et al, 2001; Longley et al, 2003; Zhang et al, 2008; Kikuchi et al, 2015). In contrast to cell‐intrinsic mechanisms of 5‐FU resistance, factors driving 5‐FU efficacy and resistance in vivo in the presence of a functional immune system have not been well elucidated.
Recently, the cGAS‐STING (encoded by Mb21d1 and Tmem173, respectively) pathway, which senses cytosolic DNA to upregulate type I interferons (IFNs) (Ma & Damania, 2016; Chen et al, 2016b; Li & Chen, 2018), has emerged as an important mediator of anti‐tumor immunity (Li & Chen, 2018; Ng et al, 2018; Vanpouille‐Box et al, 2018; Won & Bakhoum, 2020). In multiple tumor models, STING activation in non‐cancer cells within the tumor microenvironment (Woo et al, 2014; Ahn et al, 2014; Deng et al, 2014; Corrales et al, 2015; Lemos et al, 2016; Li et al, 2016; Curran et al, 2016; Zhou et al, 2020), often dendritic cells or macrophages (Woo et al, 2014; Deng et al, 2014; Curran et al, 2016; Schadt et al, 2019; Zhou et al, 2020), is required for triggering anti‐tumor immune responses. Intriguingly, this requirement of STING activation in non‐cancer cells is independent of where cGAS is activated. cGAS‐mediated cytosolic DNA sensing in either innate immune cells (Woo et al, 2014; Deng et al, 2014) or cancer cells (Schadt et al, 2019; Zhou et al, 2020) could activate STING in innate immune cells, with the latter mediated through intercellular transport of the cGAS‐produced STING‐agonist cyclic GMP‐AMP (cGAMP) (Chen et al, 2016a; Schadt et al, 2019).
Unlike STING activation in non‐cancer cells, the roles of cancer‐cell‐intrinsic STING in anti‐cancer immunity are less studied. In particular, whether conventional cytotoxic chemotherapy drugs could trigger anti‐tumor immunity through cancer‐cell‐intrinsic STING has not been elucidated. In this study, we modeled responses toward 5‐FU using colon and melanoma tumor models in immunocompetent hosts in vivo. We found that cancer‐cell‐intrinsic STING is critical for anti‐tumor immunity triggered by 5‐FU, which mediates the reduction of tumor burden, whereas STING in non‐cancer cells also play a role but to a lesser extent in our experimental models. This anti‐tumor activity is also dependent on cancer‐cell‐intrinsic cGAS and type I IFNs as well as IFN‐sensing by bone‐marrow‐derived cells and relies, at least in part, on T cells. In the absence of cancer‐intrinsic STING, a substantially higher concentration of 5‐FU is required for compensation. Additionally, a correlation between higher STING expression and better clinical response in colon cancer patients suggests that STING expression level could be a limiting bottleneck in tumor responses.
Results
5‐FU‐induced reduction of tumor burden in immunocompetent host is dependent on cancer‐cell‐intrinsic STING
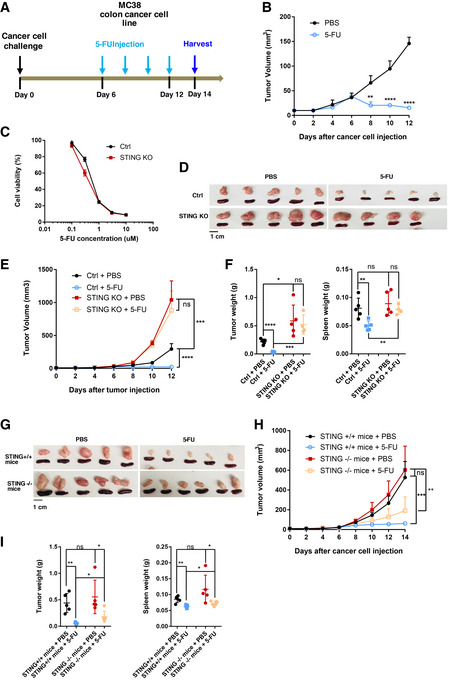
We first used an immunocompetent colon cancer model, which involves the injection of MC38, a murine C57BL/6 colon cancer cell line, into wild‐type (WT) syngeneic host mice. MC38 cells robustly gave rise to tumor formation (Fig 1A and B), and tumor size effectively shrank upon 5‐FU administration (25 mg/kg per dose) in vivo when examined at 2 weeks after cancer cell injection (Fig 1B). These data indicate that 5‐FU leads to effective reduction in tumor burden in immunocompetent hosts in vivo. Although after longer treatments, tumors eventually became resistant to 5‐FU (Fig EV1A), the present study is focused on the mechanism of the initial phase when tumors responded to 5‐FU.
Figure 1. Efficient 5‐FU‐induced reduction of tumor burden in immunocompetent host is dependent on cancer‐cell‐intrinsic STING.
-
ASchematic illustration of the syngeneic tumor model in which MC38 colon cancer cells were injected subcutaneously. 5‐FU (25 mg/kg per dose) was administered intraperitoneally from day 6 after cancer cell injection, with one dose every 2 days. Tumor and spleen were harvested at 2 weeks.
-
BTumors formed with WT MC38 cells were treated with PBS or 5‐FU. Tumor volumes were quantified at the indicated days. N = 5.
-
CSTING‐KO or sgRNA control (Ctrl) MC38 cells were treated in vitro with the indicated concentrations of 5‐FU. Cell viability were determined using the CellTiter‐Glo assay after 2 days, with normalized luminescence levels shown. N = 3.
-
D–FMice were injected with Ctrl or STING‐KO MC38 cells, and treated with PBS or 5‐FU. (D) Pictures of tumors and spleens from a representative experiment. Image panels were cropped from the same picture. (E) Tumor volumes were quantified at the indicated days after cancer cell injection. N = 4 to N = 5 as shown in (D). (F) Tumor and spleen weights at the endpoint for (E), with each dot representing a mouse.
-
G–IWT MC38 cells were injected into STING+/+ or STING−/− mice and treated with 5‐FU or PBS following the schematics in (A). (G) Pictures of tumors and spleens from a representative experiment. Image panels were cropped from the same picture. (H) Tumor volumes were quantified at the indicated days after cancer cell injection. N = 5. (I) Tumor and spleen weights at the endpoint for (H), with each dot representing a mouse.
Data information: For all panels, error bars stand for SD, and center values represent mean. Two‐tailed unpaired Student’s t‐test was used. *P < 0.05; **P < 0.01; ***P < 0.001; ****P < 0.0001; ns: not significant. Data in (B, D–F) are representative of at least four independent experiments. Data in (C, G–I) are representative of two experiments.
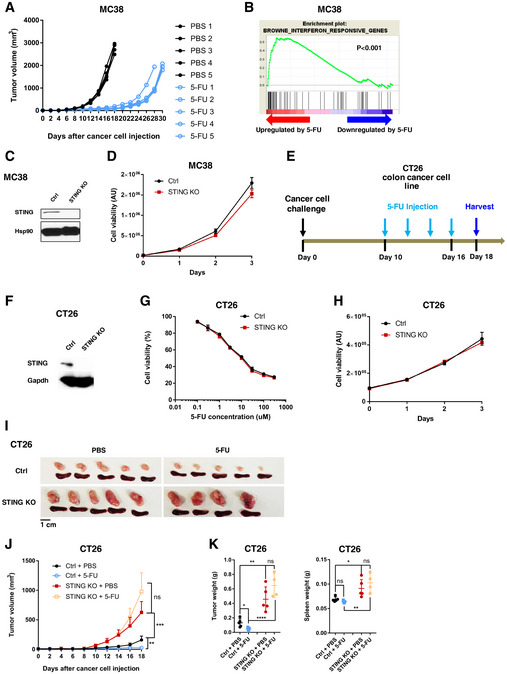
Figure EV1. 5‐FU responses of MC38 and CT26 colon cancer cells.
-
AMice were injected with WT MC38 cells, and treated with PBS or 5‐FU every other day from the sixth day after the cancer cell injection, and continued until the tumor surpassed size limit. Tumor volumes were quantified every 2 days. N = 5. Each line represents one tumor.
-
BMC38 cells were treated with 5‐FU or PBS for 24 h in vitro and subjected to RNA‐Seq analyses. Gene expression profiles were queried on interferon‐induced gene sets in MSigDB using Gene Set Enrichment Analysis. Result from a typical gene set is shown. The indicated P value was obtained by gene permutation during the GSEA procedure.
-
CWestern blot for STING levels in control (Ctrl) sgRNA and STING‐KO MC38 cells. Hsp90 was used as a loading control.
-
DMC38 cells with Ctrl sgRNA and STING‐KO MC38 cells were subjected to proliferation assay. Cell viability was determined on the indicated days after cell plating using the CellTiter‐Glo assay. Luminescence data in arbitrary units (AU) are plotted. N = 3. Data are representative of two independent experiments.
-
ESchematic illustration of the syngeneic tumor model in which CT26 colon cancer cells were injected subcutaneously into WT BALB/c mice. 5‐FU (25 mg/kg) were administered intraperitoneally from day 10 after cancer cell injection, with one dose every 2 days. Tumor and spleen were harvested on day 18.
-
FWestern blot of Ctrl and STING‐KO CT26 cells on STING and GAPDH levels.
-
GSTING‐KO or sgRNA control (Ctrl) CT26 cells were treated in vitro with the indicated concentrations of 5‐FU for 2 days. Cell viability was determined using the CellTiter‐Glo assay and normalized based on the level of PBS treatment. N = 3.
-
HSTING‐KO or Ctrl CT26 cells were subjected to proliferation assays, with cell viability determined on indicated days after plating. N = 3.
-
I–KCtrl or STING‐KO CT26 cells were injected into mice. Tumor growth and 5‐FU response was followed based on the schematics in (E). (I) Representative images of tumors and spleens. Image panels were cropped from the same picture. (J) Mean tumor volumes of Ctrl or STING‐KO CT26 with or without 5‐FU treatment were followed during the experiment. N = 5 for all except for 5‐FU‐treated STING‐KO group (N = 4). (K) Tumor (left panel) and spleen (right panel) weights were determined at the endpoint. Each dot represents one mouse.
Data information: For all panels, error bars represent SD, and center values represent mean. Two‐tailed unpaired Student’s t‐test was used. *P < 0.05; **P < 0.01; ***P < 0.001; ****P < 0.0001; ns: not significant. Data are representative of at least two independent experiments.
To investigate potential regulators of 5‐FU responsiveness, we performed RNA‐Seq on MC38 cells treated with 5‐FU in vitro and noticed that 5‐FU‐induced gene expression changes were enriched for an IFN response signature (Fig EV1B). We thus asked whether cancer‐cell‐intrinsic STING could control 5‐FU response of MC38 tumors. We generated STING knockout (KO) MC38 cells through CRISPR‐mediated gene editing (Fig EV1C). Compared to STING‐WT MC38 cells, STING‐KO MC38 cells showed similar 5‐FU sensitivity in vitro (Fig 1C) and had a similar expansion rate in vitro (Fig EV1D). Surprisingly, when injected into WT immunocompetent hosts, STING‐KO MC38 tumors became completely resistant to 5‐FU in vivo (Fig 1D–F). Of note, due to our observation that splenomegaly accompanied tumor growth, we also included spleen weight in quantification. In addition, we noticed that STING‐KO tumors grew ~2.7‐fold larger than STING‐WT tumors in the absence of 5‐FU (Fig 1D–F). These data support that while cancer‐cell‐intrinsic STING does not affect MC38 5‐FU sensitivity in vitro, it is required for 5‐FU‐induced reduction of tumor burden in vivo.
To determine whether the responsiveness of tumors to 5‐FU also requires STING activation in non‐cancer cells, we injected WT MC38 cells into STING+/+ and STING−/− mice, followed by 5‐FU or control treatment. WT MC38 tumors were comparable in size and weight in STING+/+ and STING−/− mice (Fig 1G–I). Upon 5‐FU treatment, tumor burden was reduced significantly in both STING+/+ and STING−/− hosts, with the reduction modestly less prominent in STING−/− mice (Fig 1G–I). The data above indicate that STING in non‐cancer cells plays a minor role in 5‐FU‐mediated tumor reduction.
To determine whether the requirement of cancer‐cell‐intrinsic STING in 5‐FU response is generalizable to other tumor models, we performed similar experiments using CT26 murine colon cancer cells in syngeneic immunocompetent BALB/c mice (Fig EV1E). Similar to the MC38 data above, STING‐KO CT26 cells showed similar in vitro expansion rate and sensitivity toward 5‐FU (Fig EV1, EV2, EV3, EV4), but STING‐KO CT‐26 tumors were again resistant to 5‐FU in vivo (Fig EV1, EV2, EV3, EV4K). Of note, two independent STING sgRNAs were used in CT‐26 cells, and both led to the same phenotype.
Figure EV2. Induction of IFN response by 5‐FU in cancer and normal cells.
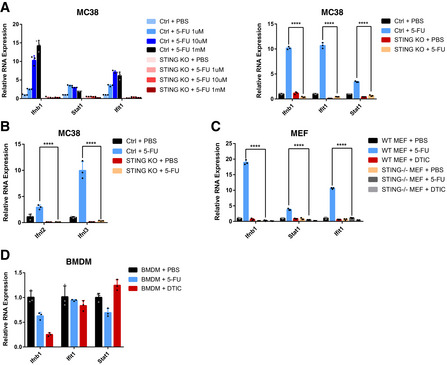
- Ctrl or STING‐KO MC38 cells were treated with the indicated concentrations (left panel) and IC50 (right panel) of 5‐FU for 24 h. Cells were analyzed for Ifnb1 and ISG RNA levels using qRT–PCR. N = 3.
- Ctrl or STING‐KO MC38 cells were treated with 5‐FU or PBS for 24 h. Cells were analyzed for Ifnl2 and Ifnl3 RNA levels using qRT–PCR. N = 3.
- WT or STING‐KO MEF cells were treated with 5‐FU, DTIC or PBS for 24 h. Cells were analyzed for Ifnb1 and ISG RNA levels using qRT–PCR. N = 3.
- WT BMDM cells were treated with 5‐FU, DTIC, or PBS for 24 h. Cells were analyzed for Ifnb1 and ISG RNA levels using qRT–PCR. N = 3.
Data information: For all panels, error bars represent SD, and center values represent mean. Two‐tailed unpaired Student’s t‐test was used. ****P < 0.0001. Data are representative of two independent experiments.
Figure EV3. 5‐FU treatment leads to the appearance of micronuclei‐like DNA structures.
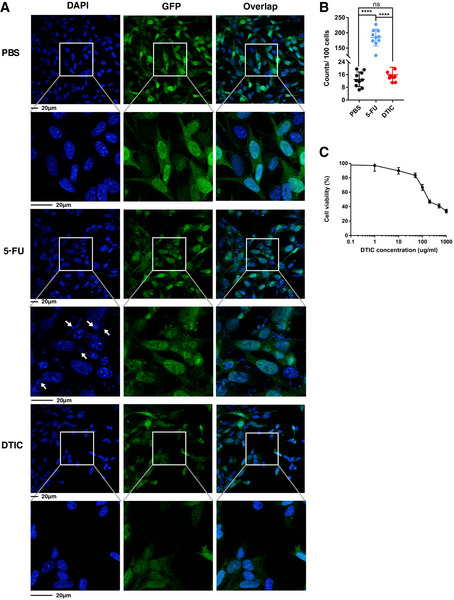
- Ctrl MC38 cells stably expressing GFP were treated with 0.3 µM 5‐FU, 300 µg/ml DTIC or PBS for 48 h. The cells were stained with DAPI (blue). Representative pictures are shown, with enlarged areas indicated by white boxes. Arrows point to examples of micronuclei‐like DNA structures.
- Quantification of micronuclei‐like DNA structures per 100 nuclei. N = 10 fields.
- Ctrl MC38 cells were treated in vitro with the indicated concentrations of DTIC for 2 days. Cell viability was determined using the CellTiter‐Glo assay and normalized based on the level of PBS treatment. N = 3.
Data information: For all panels, error bars stand for SD, and center values represent mean. Two‐tailed unpaired Student’s t‐test was used. ****P < 0.0001; ns: not significant.
Figure EV4. Flow cytometry analyses of intratumoral immune cell populations.
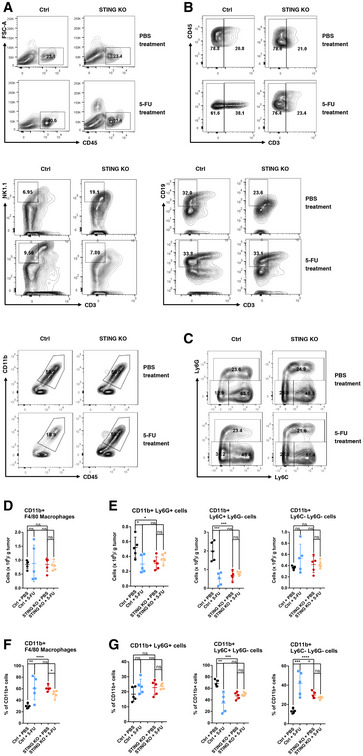
- Representative flow cytometry plots showing the percentages of CD45+ cells within FSC and SSC gated live cell population from the tumor mass.
- Representative flow cytometry plots showing the percentages of CD3+ T cells, CD3−NK1.1+ NK cells, CD3−CD19+ B cells, and CD11b+ myeloid cells within intratumoral CD45+ cells.
- Representative flow cytometry plots analyzing the CD11b+ population with Ly6G and Ly6C.
- The counts of intratumoral CD11b+F4/80+ macrophages per gram of tumor were quantified. N = 5. Each dot represents one mouse.
- The counts of intratumoral CD11b+Ly6G+, CD11b+Ly6C+ Ly6G−, and CD11b+Ly6C− Ly6G− cells per gram of tumor were quantified. N = 5. Each dot represents one mouse.
- The percentage of F4/80+ cells within the CD11b+ population is shown. N = 5. Each dot represents one mouse.
- The percentage of Ly6G+, Ly6G−Ly6C+, and Ly6G−Ly6C− cells within the CD11b+ population is shown. N = 5. Each dot represents one mouse.
Data information: For all panels, error bars represent SD, and center values represent mean. Two‐tailed unpaired Student’s t‐test was used. *P < 0.05; **P < 0.01; ***P < 0.001; ****P < 0.0001; ns: not significant. Data in all figures are representative of two or more independent experiments.
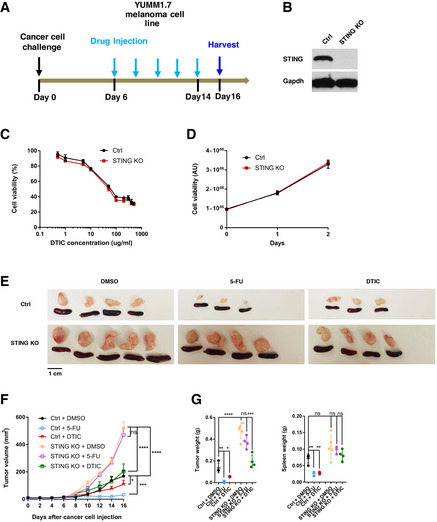
To test whether cancer‐cell‐intrinsic STING is required in general for chemotherapy responses in vivo, we evaluated STING’s function in melanoma’s response toward Dacarbazine (DTIC). We used a murine melanoma model, in which YUMM1.7 murine melanoma cells were injected into syngeneic immunocompetent hosts and then treated with DTIC (Fig 2A). YUMM1.7 is a low‐mutation‐load C57BL/6 melanoma cell line derived from the BrafV600EPten −/− Cdkn2a −/− mouse model (Meeth et al, 2016; Pan et al, 2017). Comparing STING‐WT to STING‐KO YUMM1.7 cells, DTIC led to similar responses in vitro (Fig 2B–D) and similar fold reduction of tumor size in vivo (Fig 2E–G). In contrast, responses of YUMM1.7 tumors to 5‐FU in vivo were STING‐dependent, similar to the colon tumor models (Fig 2E–G).
Figure 2. Cancer‐cell‐intrinsic STING is required for the response of YUMM1.7 melanoma to 5‐FU but not DTIC in vivo .
-
ASchematic illustration of the tumor model in which YUMM1.7 melanoma cells were injected subcutaneously into syngeneic wild‐type C57BL/6 mice. 5‐FU (25 mg/kg) or DTIC (10 mg/kg) were administered intraperitoneally from day 6 after cancer cell injection, with one dose every 2 days. Tumor and spleen were harvested at day 16.
-
BWestern blot for Ctrl and STING‐KO YUMM1.7 cells, assayed with STING and GAPDH antibodies.
-
CSTING‐KO or sgRNA control (Ctrl) YUMM1.7 cells were treated in vitro with the indicated concentrations of DTIC. Cell viability were determined using the CellTiter‐Glo assay after 2 days, with relative cell viability shown. N = 3.
-
DFor cells in (C), proliferation assays were performed with cell viability assayed on indicated days after plating. Relative luminescence in arbitrary units (AU) is shown. N = 3.
-
E–GYUMM1.7 Ctrl or STING‐KO cells were injected into mice. 5‐FU and DTIC responses were followed according to the schematics in (A). (E) Representative images of tumors and spleens. Image panels were cropped from the same picture. (F) Mean tumor volumes of Ctrl or STING‐KO YUMM1.7 with DMSO, DTIC or 5‐FU treatment were followed during the experiment. N = 3 to N = 5, as shown in (E). (G) Tumor (left panel) and spleen (right panel) weights were determined at the endpoint for the experiment followed in (F). Each dot represents data from a mouse.
Data information: For all panels, error bars represent SD, and center values represent mean. Two‐tailed unpaired Student’s t‐test was used. *P < 0.05; **P < 0.01; ***P < 0.001; ****P < 0.0001; ns: not significant. Data are representative of two independent experiments.
Taken together, the data above support that efficient 5‐FU‐induced tumor inhibition in immunocompetent hosts depends on cancer‐cell‐intrinsic STING, whereas STING in non‐cancer cells also plays a role but to a lesser extent in our model. Our data also indicate that direct cytotoxicity is not the main reason by which 5‐FU reduces tumor burden at the dose tested, given that cancer‐cell‐intrinsic STING does not affect 5‐FU sensitivity in vitro.
Cancer‐intrinsic cGAS and STING‐regulated type I IFNs are required for efficient 5‐FU‐induced tumor reduction
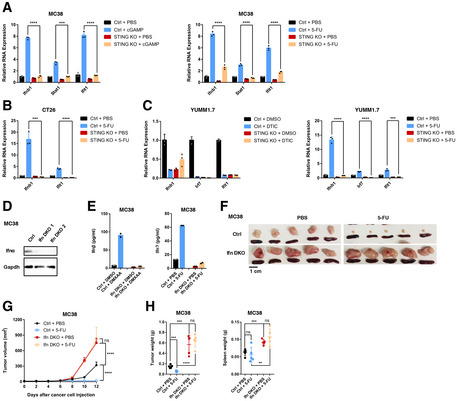
Given that STING is a key regulator of type I IFN production, we asked whether tumor‐intrinsic type I IFNs are required for 5‐FU‐induced tumor reduction. We first examined the relationship between 5‐FU‐induced tumor inhibition in vivo and IFN responses upon 5‐FU treatment in vitro. In MC38 cells, 5‐FU induced Ifnb1 and interferon‐stimulated genes (ISGs) Stat1 and Ifit1 (Fig 3A), an effect that could be observed across a range of 5‐FU concentrations, including the IC50 concentration (Fig EV2A). Additionally, 5‐FU also induced type III IFNs Ifnl2 and Ifnl3 (Fig EV2B). Loss of STING abolished IFN response to the STING agonist cGAMP (Fig 3A) and largely blunted Ifnb1 and ISG induction by 5‐FU in vitro (Figs 3A and EV2A). For CT26, 5‐FU‐induced upregulation of IFN response was completely abolished in STING‐KO cells (Fig 3B). YUMM1.7 cells also responded to 5‐FU with upregulation of IFN that was dependent on STING, but DTIC failed to induce IFN or ISGs in these cells (Fig 3C). In all cases, the type I IFN response in vitro paralleled the 5‐FU‐induced reduction of tumor burden in vivo, further suggesting a role of type I IFN in 5‐FU response in vivo.
Figure 3. Cancer‐cell‐intrinsic type I IFNs are required for efficient 5‐FU‐induced reduction of tumor burden.
-
AControl (Ctrl) or STING‐KO MC38 cells were treated in vitro with STING agonist cGAMP (left) for 6 h or 5‐FU (right) or relevant vehicle controls for 24 h. The expression of indicated genes was determined by qRT–PCR. N = 3.
-
BCtrl or STING‐KO CT26 cells were treated with 5‐FU or vehicle control for 24 h. The RNA expression levels of indicated genes were determined by qRT–PCR. N = 3.
-
CCtrl or STING‐KO YUMM1.7 cells were treated with (left panel) vehicle control (DMSO) or DTIC, or (right panel) PBS or 5‐FU for 24 h. The expression of indicated genes was determined by qRT–PCR. N = 3.
-
DWestern blot analysis was performed with Ifnα and GAPDH antibodies, for control (Ctrl) and Ifna1‐Ifnb1‐double KO (Ifn‐DKO) MC38 cells. Two independent KO clones are shown.
-
EMC38 Ctrl or Ifn‐DKO cells were treated with (left panel) control or the STING agonist DMXAA for 4 h, or (right panel) control or 5‐FU for 16 h. Ifnβ levels were determined in harvested culture media by ELISA. N = 2.
-
F–HMice were injected with Ctrl MC38 cells or Ifn‐DKO cells and treated with 5‐FU or PBS. (F) Pictures of tumors and spleens from a representative experiment. Image panels were cropped from the same picture. (G) Tumor volumes were quantified at the indicated days after cancer cell injection. N = 5. (H) Tumor and spleen weights at the endpoint for (G), with each dot representing a mouse.
Data information: For all panels, error bars stand for SD, and center values represent mean. Two‐tailed unpaired Student’s t‐test was used. **P < 0.01; ***P < 0.001; ****P < 0.0001; ns: not significant. Data are representative of two or more independent experiments.
We further tested the ability of 5‐FU to induce IFN in non‐cancer cells. In early‐passage mouse embryonic fibroblasts that were actively proliferating, 5‐FU also induced robust STING‐dependent IFN and ISG upregulation (Fig EV2C). In contrast, in bone‐marrow‐derived macrophages, 5‐FU failed to induce IFN and ISG expression (Fig EV2D). These data indicate that the effect of 5‐FU on IFN is not limited to cancer cells and suggest that its effect might be dependent on cellular context or proliferation status.
To address the functional importance of type I IFNs in 5‐FU response in vivo, we performed double KO (DKO) of Ifnb1 and Ifna1, two main type I IFN genes, in MC38 cells, and confirmed effective ablation using either western blot or DMXAA‐induced production of Ifnβ (Fig 3D and E). Of note, a low level of Ifnα protein was detected in DKO cells (Fig 3D), likely due to the presence of other Ifna genes in the genome. Loss of Ifnb1 and Ifna1 phenocopied STING‐KO, resulting in the abolishment of 5‐FU‐induced tumor reduction and increased tumor size (Fig 3F–H). These data support that cancer‐cell‐produced IFNs are required for 5‐FU‐induced reduction of tumor burden in vivo.
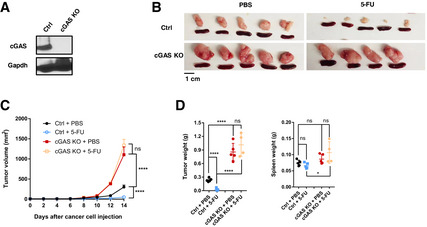
We then asked whether cGAS, which functions upstream of STING, controls 5‐FU response. We knocked out cGAS in MC38 cells with CRISPR (Fig 4A). Experiments in vivo showed that cGAS‐KO tumors phenocopied those of STING‐KO, with resistance to 5‐FU and a larger tumor burden without 5‐FU (Fig 4B–D). Taken together, the data above support that efficient 5‐FU‐induced reduction of tumor burden in vivo is dependent on the cGAS‐STING pathway and type I IFN production in cancer cells.
Figure 4. Cancer‐cell‐intrinsic cGAS is required for efficient 5‐FU‐induced reduction of tumor burden.
-
AWestern blot for control sgRNA (Ctrl) and cGAS‐KO MC38 cells, assayed with cGAS and GAPDH antibodies.
-
B–DMice were injected with Ctrl or cGAS‐KO MC38 cells and treated with PBS or 5‐FU. (B) Pictures of tumors and spleens from a representative experiment. Image panels were cropped from the same picture. (C) Tumor volumes were quantified at the indicated days after cancer cell injection. N = 4 to N = 5, as shown in (B). (D) Tumor and spleen weights at the endpoint for (C), with each dot representing a mouse.
Data information: For all panels, error bars stand for SD, and center values represent mean. Two‐tailed unpaired Student’s t‐test was used. *P < 0.05; ****P < 0.0001; ns: not significant. Data are representative of two or more independent experiments.
To gain insights into how 5‐FU triggers the activation of the cGAS‐STING pathway, we examined the nuclear morphology of cancer cells. We used MC38 cells stably expressing GFP which helped to demarcate the cellular boundaries. Treatment of 5‐FU at the IC50 concentration (0.3 µM) led to a substantial increase of DAPI‐positive micronuclei‐like DNA structures (Fig EV3A and B). In contrast, when MC38 cells were treated with DTIC at 300 µg/ml, a concentration higher than its IC50 (Fig EV3C), micronuclei‐like DNA structures remained at a low level (Fig EV3A and B). Given that micronuclei are known to activate cGAS (Dou et al, 2017; Harding et al, 2017; Mackenzie et al, 2017; Glück et al, 2017), the data above suggest the involvement of 5‐FU‐induced micronuclei‐like DNA structures in cGAS activation.
Effective 5‐FU‐induced reduction of tumor burden in vivo depends on IFN‐sensing by bone‐marrow‐derived cells
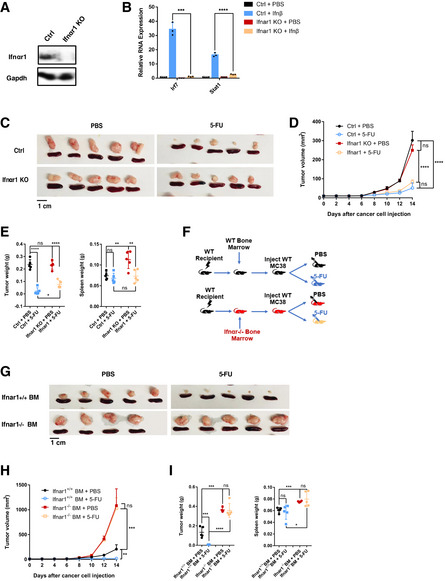
Which cells sense cancer‐cell‐produced IFN to control 5‐FU response in vivo? We first asked whether IFN‐sensing by tumor cells is critical. To this end, we knocked out Ifnar1 in MC38 cells (Fig 5A), which abolished the induction of ISGs upon recombinant Ifnβ treatment (Fig 5B). Ifnar1‐KO tumors were similar in size and weight to Ifnar1‐WT tumors without 5‐FU (Fig 5C–E). Treatment with 5‐FU led to a significant reduction in tumor size of Ifnar1‐KO tumors, albeit the reduction was modestly weaker than the reduction of Ifnar1‐WT tumors (Fig 5C–E). These phenotypes are different from those of STING‐KO tumors, suggesting that cancer‐cell‐intrinsic IFN‐sensing is not the main contributor to 5‐FU‐induced tumor reduction.
Figure 5. Efficient 5‐FU‐induced tumor inhibition depends on IFN‐sensing by bone‐marrow‐derived cells.
-
AWestern blot for Ctrl and Ifnar1‐KO MC38 cells, analyzed with Ifnar1 and GAPDH antibodies.
-
BCtrl or Ifnar1‐KO MC38 cells were treated with PBS or recombinant Ifnβ for 4 h. The RNA expression levels of indicated ISGs were analyzed using qRT–PCR. N = 3.
-
C–EMice were injected with control (Ctrl) or Ifnar1‐KO MC38 cells, and treated with 5‐FU or PBS. (C) Pictures of tumors and spleens from a representative experiment. (D) Tumor volumes were quantified at the indicated days after cancer cell injection. N = 5. (E) Tumor and spleen weights at the endpoint for (D), with each dot representing a mouse. Ctrl tumor data in (C–E) are the same as those in Fig 4B–D.
-
F–ISchematics (F) of the experiment to test the function of Ifnar1 in bone‐marrow (BM)‐derived cells. WT C57BL/6 mice were transplanted with either Ifnar1 +/+ or Ifnar1 −/− BM cells. Recipient mice were allowed to recover followed by the injection of WT MC38 cells, before treatment with 5‐FU or PBS. (G) Pictures of tumors and spleens from a representative experiment. Image panels were cropped from the same picture. (H) Tumor volumes were quantified at the indicated days after cancer cell injection. N = 4 to N = 5, as shown in (G). (I) Tumor and spleen weights at the endpoint for (H), with each dot representing a mouse.
Data information: For all panels, error bars stand for SD, and center values represent mean. Two‐tailed unpaired Student’s t‐test was used. *P < 0.05; **P < 0.01; ***P < 0.001; ****P < 0.0001; ns: not significant. Data are representative of two independent experiments.
As bone‐marrow‐derived immune cells are known components of tumor mass, we then addressed the importance of IFN‐sensing by bone‐marrow‐derived cells. We transplanted Ifnar1 −/− and Ifnar1 +/+ bone marrow cells into WT recipients. After the recovery of the hematopoietic system, recipient mice were injected with WT MC38 cells followed by 5‐FU or control treatment (Fig 5F). WT tumors grown in mice with Ifnar1 −/− bone marrow were larger than WT tumors in recipients with Ifnar1 +/+ bone marrow in the absence of 5‐FU (Fig 5G–I). Furthermore, WT tumors grown in recipients of Ifnar1 −/− bone marrow were resistant to 5‐FU (Fig 5G–I). These phenotypes were similar to those of STING‐KO tumors. Thus, these data support that IFN‐sensing by bone‐marrow‐derived cells is the main contributor to 5‐FU‐induced reduction of tumor burden, whereas IFN‐sensing by cancer cells themselves has only a minor role.
T cells contribute to 5‐FU‐induced tumor inhibition in vivo
To uncover immune cell types that regulate 5‐FU‐induced tumor inhibition, we first asked whether 5‐FU treatment alters immune cell composition within MC38 tumors and whether STING status affects immune cell composition. We observed that the number of intratumoral CD3+ T cells when normalized by tumor weight, as well as the percentage of CD3+ T cells within intratumoral CD45+ cells, was significantly increased after 5‐FU treatment, and this 5‐FU‐induced increase was dependent on cancer‐cell‐intrinsic STING (Figs 6A–D and EV4A and B). Additionally, 5‐FU treatment led to a reduction in both CD11b+ myeloid cells and CD3−NK1.1+ natural killer cells, whereas CD3−CD19+ B cells and CD11c+CD103+ dendritic cells were not affected significantly (Figs 6C and D, and EV4B, Appendix Fig S1A–C). Among CD11b+ cells, 5‐FU‐induced reduction was primarily attributable to the loss of Ly6C+Ly6G− monocytic population, but not to CD11b+F4/80+ macrophages and less so to Ly6G+ granulocytic cells (Fig EV4C–G), Interestingly, although 5‐FU‐induced reduction in myeloid cells, such as myeloid‐derived suppressor cells, has been previously described (Vincent et al, 2010), we observed that this reduction in myeloid cells was dependent on cancer‐cell‐intrinsic STING (Figs 6C and D, and EV4B), suggesting a potential role of cancer‐produced type I IFNs in 5‐FU‐induced toxicity on intratumoral myeloid cells. Among intratumoral T cells, the numbers of both CD4+ and CD8+ T cells was elevated after 5‐FU treatment (Fig 6E and F, Appendix Fig S2A). We further characterized the effects of 5‐FU on CD4+ and CD8+ cells, by examining CD4+FoxP3+ Tregs, memory T‐cell markers CD62L and CD44, T‐cell activation marker IFN‐γ, and T‐cell proliferation marker Ki67. Among CD4+ cells, the percentage of Tregs was reduced significantly by 5‐FU (Appendix Fig S2B–J). The percentages of other populations did not show significant changes, except that CD62L−CD44+ CD8+ T cells were reduced (Appendix Fig S2B–J). Of note, we also examined the levels of CD80, Fas, and MHC‐I in the CD45− population, and observed a significant increase of the number of MHC‐I+CD45− cells after 5‐FU treatment (Appendix Fig S3A and B). Taken together, the data above indicate that 5‐FU elevates intratumoral T cells but reduces tumor‐associated myeloid cells in a cancer‐STING‐dependent manner, suggesting that 5‐FU treatment of WT tumor favors an anti‐tumor immune microenvironment, and implicating the involvement of T cells.
Figure 6. 5‐FU treatment alters intratumoral immune cell populations.
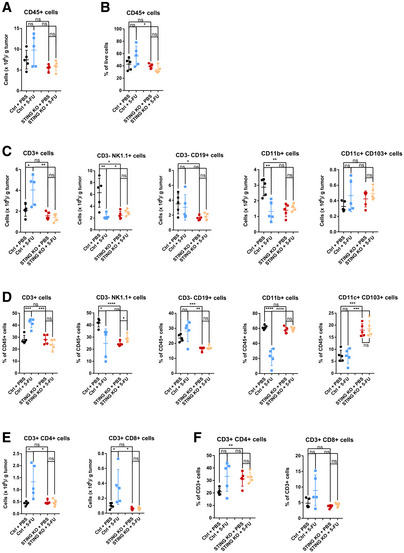
- The counts of CD45+ cells per gram of tumor.
- The percentages of CD45+ cells among forward scatter (FSC) and side scatter (SSC) gated live cell population.
- The counts of CD3+, CD3−NK1.1+, CD3−CD19+, CD11b+, and CD11c+CD103+ cells per gram of tumor were quantified.
- The percentages of CD3+, CD3−NK1.1+, CD3−CD19+, CD11b+, and CD11c+CD103+ cells among CD45+ cells were quantified.
- The counts of CD4+ and CD8+ T cells per gram of tumor.
- The percentages of CD4+ and CD8+ cells among CD3+ T cells were quantified.
Data information: For all panels, N = 5 from a representative experiment. Each dot represents one mouse. Error bars stand for SD, and center values represent mean. Two‐tailed unpaired Student’s t‐test was used. *P < 0.05; **P < 0.01; ***P < 0.001; ****P < 0.0001; ns: not significant. Data are representative of two independent experiments.
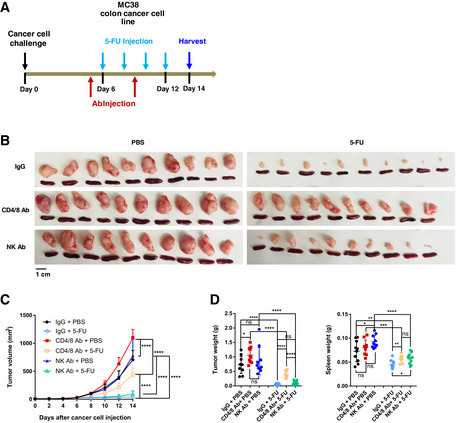
To directly test the function of T cells in 5‐FU‐induced tumor inhibition, we performed antibody‐based depletion with the initial dose of combined anti‐CD4 and anti‐CD8 treatment taking place 1 day prior to the injection of 5‐FU (Fig 7A). Compared to a control antibody, or an antibody against NK cells, administration of anti‐CD4 and anti‐CD8 antibodies led to a significant rescue, albeit not completely, of 5‐FU‐induced tumor inhibition (Fig 7B–D). Additionally, we noticed that anti‐CD4/CD8 led to a significant increase in tumor volumes in the absence of 5‐FU (Fig 7B–D). These phenotypes were both reminiscent of those of STING‐KO tumors. Taken together, the data above support that T cells participate in 5‐FU‐induced reduction of tumor burden in vivo.
Figure 7. T cells are required for efficient 5‐FU‐induced tumor inhibition.
-
A–DSchematics (A) of the experiment to examine the effect of T‐cell depletion on 5‐FU response, during which anti‐CD4/anti‐CD8 antibodies (Ab), control IgG Ab, or anti‐NK1.1 Ab were administrated on day 5 and day 9. (B) Pictures of tumors and spleens. Image panels were cropped from the same picture. N = 10. (C) Tumor volumes were quantified at the indicated days after cancer cell injection. N = 10. (D) Tumor and spleen weights at the endpoint for (C), with each dot representing a mouse.
Data information: For all panels, error bars stand for SD, and center values represent mean. Two‐tailed unpaired Student’s t‐test was used. *P < 0.05; **P < 0.01; ***P < 0.001; ****P < 0.0001; ns: not significant. Data were pooled from two parallel experiments.
Higher concentrations of 5‐FU partially compensate for the loss of STING on tumor inhibition
Our data above showed that under the initial 5‐FU dose tested (25 mg/kg per dose), cancer‐cell‐intrinsic STING is required for 5‐FU‐induced tumor inhibition in immunocompetent mice through modulating the immune system. However, it is well documented that some human colon cancer models developed in immunodeficient mice could still respond to 5‐FU (e.g., Morikawa et al, 1989). To reconcile these differences, we tested the possibility that increased concentrations of 5‐FU would be required to compensate for the loss of STING in MC38 cells. We treated STING‐WT and STING‐KO tumor‐bearing mice with 0, 25, 50 and 75 mg/kg 5‐FU per dose, following our dosing scheme (Fig 1A). While there was no detectable response of STING‐KO tumor to 25 mg/kg 5‐FU, both 50 mg/kg and 75 mg/kg doses led to significant tumor inhibition (Fig 8A–C). However, even with the highest tested dose, 75 mg/kg, which is higher than many literature reports (e.g., (Robinson et al, 2013; Dosset et al, 2018)), there were residual STING‐KO tumor masses ~8.5‐fold larger than those of STING‐WT tumors under the 25 mg/kg dose (Fig 8A–C). These data support that STING‐loss in cancer cells demands much higher concentrations of 5‐FU for effective tumor inhibition, which has implications for 5‐FU effectiveness and side effects in patients.
Figure 8. STING‐KO tumors require higher concentrations of 5‐FU for inhibition in vivo .
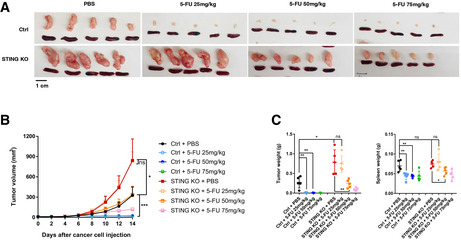
- Pictures of tumors and spleens from a representative experiment. Image panels were cropped from the same picture.
- Tumor volumes were quantified at the indicated days after cancer cell injection. N = 5.
- Tumor and spleen weights at the endpoint for (B), with each dot representing a mouse.
Data information: For all panels, error bars stand for SD, and center values represent mean. Two‐tailed unpaired Student’s t‐test was used. *P < 0.05; **P < 0.01; ***P < 0.001; ns: not significant. Data are representative of two independent experiments. Data are representative of two independent experiments.
Association of higher STING expression with better survival in human colon cancer
To investigate potential relationship between STING expression and colon cancer patient outcomes, we first examined 58 cases of TCGA (Weinstein et al, 2013) colon adenocarcinoma (COAD) patients for whom mass‐spec‐based protein quantification was available through the CPTAC project (Ellis et al, 2013). The initial focus on STING protein level was due to recent reports of loss of STING protein in some human colon cancer cell lines (Xia et al, 2016). We separated patients based on whether STING was detectable (STING‐Hi) or undetectable (STING‐Low). STING‐Hi patients showed significantly better survival than the STING‐Low group (Fig 9A). We also examined the STING RNA expression in tumor tissues from the same cohort of patients. Separating patients into the same number of STING‐Hi and STING‐Low cases as the stratification of the protein data showed no significant difference even though there appeared to be a similar trend (Fig 9B), suggesting RNA‐based stratification is weaker and may require more samples. We thus turned to TCGA COAD dataset and analyzed the relationship between STING RNA levels and patient survival for Stage II and Stage III patients, two stages that had the largest numbers of cases in the TCGA cohort. Indeed, higher STING RNA expression was significantly associated with better survival (Fig 9C). To further investigate the relationship between STING expression and chemotherapy response, we turned to a previously published dataset in which recurrent or metastatic colon cancer patients were treated with the 5‐FU‐containing FOLFOX regimen, with patients further classified into responder and non‐responder groups (Watanabe et al, 2011). STING RNA levels were significantly higher among responders than non‐responders (Fig 9D). The data above suggest that higher STING expression is associated with better survival and better chemotherapy response in colon cancer patients. Due to the facts that the STING levels were measured in bulk samples and that FOLFOX contains other drugs in combination with 5‐FU, it is challenging to determine potential association between cancer‐intrinsic STING and patients’ response to 5‐FU alone. Nevertheless, our data suggest that STING levels could be one of the bottlenecks in FOLFOX response in patients.
Figure 9. Association between STING expression and clinical responses of human colon cancer patients, and a model of our findings.
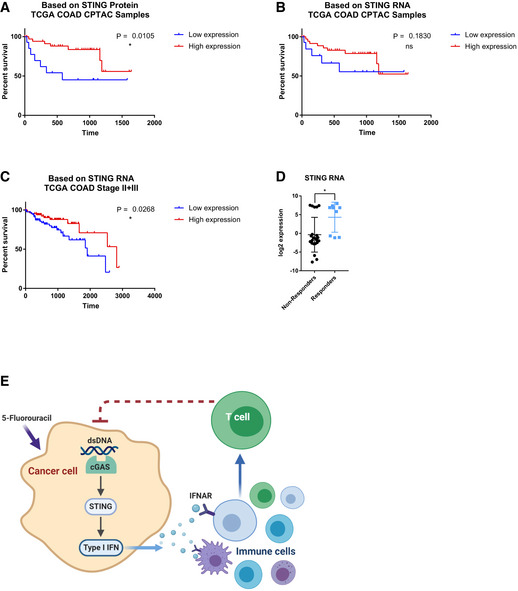
- STING protein expression of 58 colon adenocarcinoma specimens within the TCGA COAD collection were obtained from the CPTAC project website. Samples were partitioned into STING‐Low (non‐detectable STING protein, N = 15) and STING‐Hi (detectable STING protein, N = 43) groups. Kaplan–Meier curve is shown with P value indicated.
- STING RNA expression from the same 58 specimens were partitioned into STING‐Low (bottom 15 samples) and STING‐Hi (top 43 samples) groups. Kaplan–Meier curve is shown with P value indicated.
- Stage II and Stage III patients from the TCGA COAD dataset were partitioned into STING‐Hi (top 1/3 of samples, N = 87) and STING‐Low (bottom 1/3 of samples, N = 87). Kaplan–Meier curve is shown with P value indicated.
- From a published colorectal cancer chemotherapy response study, STING RNA expression in responders and non‐responders were compared, with each dot representing a tumor.
- A model summarizing our findings.
Data information: For panels (A–D), error bars represent SD, and center values represent mean. Log‐rank test was used to analyze survival data. Unpaired two‐tailed Student’s t‐test was used for comparing responders and non‐responders. *P < 0.05; ns: not significant.
Discussion
5‐FU is a conventional chemotherapeutic drug that has been widely used in multiple cancer types, yet mechanisms of 5‐FU sensitivity in the presence of a functional immune system are still poorly known. Our study proposes a model in which effective response toward 5‐FU not only requires cancer‐cell‐intrinsic sensitivity toward 5‐FU, but also anti‐tumor immunity triggered by cancer‐cell‐intrinsic STING. 5‐FU treatment leads to the activation of the cGAS‐STING pathway and subsequent local production of type I IFNs in cancer cells. Cancer‐produced IFNs are then sensed by immune cells, leading to T‐cell‐mediated anti‐tumor responses (see model in Fig 9E). The dependence of cancer‐cell‐intrinsic STING in 5‐FU response could be observed in two independent colon cancer models (MC38 and CT26), as well as a melanoma model (YUMM1.7), arguing that this is a general mechanism governing 5‐FU response in the presence of a functional immune system. It is currently not fully elucidated what cGAS is sensing in cancer cells to activate STING. It is known that cytoplasmic DNA could arise as a consequence of DNA damage, the formation of micronuclei, leakage of mitochondrial DNA, or internalization of DNA from neighboring cells (Rongvaux et al, 2014; White et al, 2014; Cai et al, 2014; Woo et al, 2014; Deng et al, 2014; West et al, 2015; Li & Chen, 2018; Ng et al, 2018). We noticed that treatment of 5‐FU, but not of Dacarbazine, leads to a substantial increase of micronuclei‐like DNA structures, suggesting the involvement of such DNA structures in cGAS activation. Detailed studies of which form of cytoplasmic DNA is responsible for 5‐FU‐induced cGAS activation and how 5‐FU triggers cytoplasmic DNA can be interesting questions to be pursued in the future. In the absence of STING in cancer cells, a much higher dose of 5‐FU would be required to achieve effective tumor inhibition. Since higher doses of 5‐FU will inevitably cause more severe chemotherapy‐induced side effects and would be more difficult to be tolerated especially in elderly patients, our findings can guide further investigation of 5‐FU doses, IFN production, anti‐tumor immunity and chemotherapy‐induced toxicity in a clinical setting. In the MC38 tumor model, after longer 5‐FU treatments, tumors develop resistance to 5‐FU in vivo. This resistance could be the consequence of selection of genetically mutated or epigenetically reprogrammed subclones of MC38 cells, but could also be due to alterations of the tumor microenvironment or changes in anti‐tumor immunity. Studying the mechanisms underlying this resistance phenomenon in the future can provide useful insights into 5‐FU resistance often observed in human patients.
Our data also group 5‐FU together with some other conventional cytotoxic chemotherapeutic drugs that are capable of inducing type I IFNs (Zitvogel et al, 2013; Galluzzi et al, 2015). At the same time, our study showed that Dacarbazine could not upregulate IFN, similar to mitomycin C and cisplatin (Sistigu et al, 2014). It could be interesting to systematically explore in the future which chemicals and which cellular backgrounds are permissive or resistant to type I IFN induction. It is also evident that among the chemotherapy drugs that are capable of inducing IFNs, there are substantial differences in the mechanisms of IFN induction and subsequent signaling and effects on tumor. Doxorubicin, an anthrocycline, induces type I IFN through activating the RNA sensor TLR3 in cancer cells, with the resultant IFNs signaling back to cancer cells to engage the immune system (Sistigu et al, 2014). DNA methylation inhibitors active IFNs through the RNA sensor MDA5 (Roulois et al, 2015; Chiappinelli et al, 2015). The microtubule toxin paclitaxel induces IFNs through cGAS‐STING to sensitize breast cancer cells to apoptosis rather than triggering anti‐tumor immunity (Lohard et al, 2020). In contrast to these examples, our data show that 5‐FU induces cGAS‐STING primarily within cancer cells to trigger anti‐tumor immunity. Additionally, our findings provide a potential mechanistic explanation to a recent study in which a 5‐FU‐based FOLFOX regimen synergizes with anti‐PD‐1 in inhibiting colon cancer (Dosset et al, 2018). This is consistent with prior studies that type I IFN production in the tumor vicinity synergizes with checkpoint inhibitors to augment anti‐tumor immunity (Demaria et al, 2015; Wang et al, 2017).
Our proposed model is substantially different from prior knowledge on systemic effects of IFN on colon cancer. More than two decades ago, multiple studies have demonstrated that ectopic treatment with recombinant type I IFN or type II IFN can enhance 5‐FU‐mediated cytotoxicity in cell lines in vitro (e.g., Morikawa et al, 1989b; Houghton et al, 1993) and in xenograft models in immunodeficient mice (e.g., Morikawa et al, 1989a). However, in a clinical trial, systemic administration of IFN together with 5‐FU‐based chemotherapy showed more toxicity without clinical benefit over chemotherapy alone (Hausmaninger et al, 1999). In our data, the presence of STING does not substantially affect the in vitro sensitivity of colon cancer cells toward 5‐FU, suggesting that the levels of IFNs produced endogenous by cancer cells are insufficient to achieve enhanced cytotoxic effects in vitro. More importantly, our data also highlight the role of local type I IFN production in 5‐FU response, in contrast to systemic administration of recombinant IFN. It is well appreciated that systemic IFN therapies are associated with substantial toxicity, and one may postulate that systemic IFN treatment would effectively dilute immune stimulatory effects away from tumor by activating immune responses in other parts of the body. It is possible that 5‐FU may be utilized to precisely trigger IFN in tumor microenvironment, especially for cancer types that are not traditionally treated with 5‐FU.
Materials and Methods
Mice
All animal experiments were performed under an approved protocol by Yale University’s Institutional Animal Care and Use Committee (IACUC) and following federal, state and local guidelines. C57BL/6J, BALB/c, STING−/− (stock #025805) and Ifnar1−/− (stock #028288) mice were purchased from the Jackson Laboratory. STING−/− and Ifnar1−/− mice used were on the C57BL/6J background. For all tumor experiments, 6‐ to 8‐week‐old female mice were used. Mice were housed in the Yale Animal Resources Center which provided daily husbandry.
For all animal studies, mice were randomly assigned into different treatment groups. Required sample size was estimated based on an initial test experiment. Blinding to investigator was not designed into experiments in this study.
Cell lines and cell culture
Murine MC38 colon cancer cell line and its control sgRNA and STING‐KO derivatives were generated in the laboratory of Dr. Qin Yan, and the original MC38 cell line was obtained from Dr. Gerald Shadel. CT26 cell line was obtained from Dr. Viswanathan Muthusamy. YUMM1.7 melanoma cells and its control sgRNA and STING‐KO derivative were generated in the laboratories of Drs. Marcus Bosenberg and Qin Yan. MC38 cells were maintained in Dulbecco’s Modified Eagle Medium (DMEM, Life Sciences #11995065) with 10% fetal bovine serum (FBS, Life Sciences #16000044) and 1% penicillin/streptomycin/glutamine (PSG, Life Sciences #10378016). CT26 cells were maintained in Opti‐MEM I Reduced Serum Medium (Thermo Fisher #31985070) with 10% FBS, 1% PSG, 1X MEM Non‐Essential Amino Acids Solution (Thermo Fisher #11140050), 1X L‐Glutamine (Thermo Fisher #25030081), and 1X Sodium Pyruvate (Thermo Fisher #11360070). YUMM1.7 cells were maintained in RPMI medium 1640 (Thermo Fisher #11875093), with 10% FBS and 1% PSG. All cells were cultured at 37°C and under 5% CO2.
C57BL/6J WT and STING‐KO mouse embryonic fibroblasts (MEFs) were prepared from WT and STING‐KO embryos (day E13), following a published procedure (Guo et al, 2014). The embryonic cells initially plated were referred to as passage zero. MEFs were cultured in DMEM with 10% FBS and 1%PSG. First passage MEFs were used for 5‐FU treatment experiment. Bone‐marrow‐derived macrophages (BMDMs) were prepared from WT mice using our published procedure (Pan et al, 2017). BMDMs used were after 7 days of differentiation when cells were mostly post‐mitotic. BMDMs were cultured in RPMI 1640 medium, supplemented with 30% L929‐conditioned medium, 20% FBS, 10 ng/ml recombinant murine M‐CSF (BioLegend, #576402).
CRISPR‐mediated gene knockout
KO cell lines were generated using CRISPR. Single guide RNA (sgRNA) sequences targeting genes of interest were designed using the CRISPR design tool (https://portals.broadinstitute.org/gpp/public/analysis‐tools/sgrna‐design). The sgRNA sequences (Appendix Table S1) were cloned into the LentiCRISPR‐v2, LentiCRISPRv2‐mCherry or LentiCRISPRv2‐GFP vectors (Addgene #52961, #99154 and #82416). Lentivirus was packaged in 293T cells using a protocol described in our previous studies (Guo et al, 2012; Cheng et al, 2016). Cells were directly transfected with crisper vectors or infected with the virus, and transduced cells were selected by puromycin or sorted based on mCherry or GFP. Single cells were then sorted into 96‐well plates to generate derivative single cell clones. KO status was confirmed by Western blot analysis, ELISA and/or functional analysis.
Murine tumor models, drug and antibody treatments
MC38, CT26, and YUMM1.7 cells were injected subcutaneously into the flanks of mice with 1 × 10⁶ cells per injection in 100 μl PBS (phosphate‐buffered saline). Each mouse was injected only on one of its flanks. Female C57BL/6J or BALB/c mice of 6 to 8 weeks of age were used.
Dosing and harvesting schemes for each tumor model are indicated in the figures. 5‐FU was obtained as a clinically used formulation, produced by Fresenius Kabi USA, LLC. DTIC and DMXAA were purchased from Sigma (#D2390 and #D5817) and dissolved in DMSO (Sigma‐Aldrich #D8418). For 5‐FU treatment, most experiments involved a dose of 25 mg/kg 5‐FU or 100 µl PBS (for control), administrated intraperitoneally with one dose every 2 days. For testing the effects of higher 5‐FU doses, 50 and 75 mg/kg doses were also used. For DTIC treatment, mice were treated with DTIC at a dose of 10 mg/kg or 100 µl of 50% DMSO in PBS (for control) intraperitoneally, with one dose every 2 days. For DMXAA treatment, C57BL/6 mice received a dose of DMXAA (500 µg total, at 5 mg/ml) or 100 µl of 50% DMSO/PBS (for control) through intratumoral injection, with a total of two doses per experiment.
For depleting specific immune cells, antibodies used include anti‐CD4 (BioXCell #BE0003‐1), anti‐CD8 (BioXCell #BE0004‐1), anti‐NK1.1 (BioXCell #BP0036), and control IgG (BioXCell # BE0085). Antibodies were treated following the corresponding schematic in figures. The dose of antibody was 200 µg total (100 µl in volume, at 2 mg/ml) or control IgG (200 µg total, at 2 mg/ml), administered intraperitoneally, with a total of two doses per mouse per experiment. In the CD4/CD8 experiment, two antibodies were mixed 1:1.
Tumor volumes were followed every 2 days. Tumor sizes were measured with a caliper, and tumor volumes were calculated using the length and width of the tumor and calculated by (1/2) × (Length × Width × Width).
On the day of tumor harvest, tumors were resected and transferred to 5 ml PBS on ice. Tumor weight was measured on a scale by transferring the specimen to a sterile Petri dish after the removal of surface moisture with Kimwipes. Spleen of the mice were similarly harvested and weighed. For experiments requiring flow cytometry analysis of intratumoral cells, the resected mouse tumors were careful weighted to the accuracy of 0.1 g, and mechanically dissociated with surgical scissors into ~1 mm3 small pieces, and digested with Collagenase IV (1 mg/ml, Worthington #CLSS‐4) and DNase I (20 µg/ml, Roche #4716728001) in PBS for 30 min in a 37°C shaking incubator (150 rpm). After the enzymatic digestion, the samples were transferred onto ice to stop the reaction. The tumor suspension was then filtered using a 70 µm cell strainer (Becton Dickinson #352350) and washed with FACS buffer (0.5% FBS in PBS) and centrifuged at 350 g at 4°C in an Eppendorf 5810R centrifuge for 5 min (similar centrifugation parameters were used throughout). Red blood cells were lysed with ACK lysis buffer (Thermo Fisher #A1049201) followed by washing with the FACS buffer. The samples were then resuspended in the FACS buffer and 200 µl of counting beads (BioLegend # 424902) were added. The samples were kept on ice throughout the rest of the staining procedure.
Flow cytometry analysis
For flow cytometry analysis or FACS‐sorting, single cell suspension from the tumor tissue was washed with the FACS buffer and stained with the following antibodies: anti‐mouse CD45.2–Pacific blue antibody (BioLegend; clone, 30‐F11; used at 1:500), anti‐mouse CD11b–FITC antibody (BioLegend; clone, M1/70; used at 1:500), anti‐F4/80–APC antibody (eBioscience; clone BM8; used at 1:500), anti‐CD3‐PE/Cy5 (BioLegend; clone 145‐2C11; used at 1:500), anti‐CD4–APC/Cy7 (BioLegend; clone RM4‐5; used at 1:500), anti‐mouse CD8a‐PE (BioLegend; clone 53‐6.7; used at 1:400), anti‐NK1.1‐FITC (BioLegend; clone PK136; used at 1:500), anti‐mouse CD19‐AF594 (BioLegend; clone 6D5; used at 1:400), anti‐CD44–FITC (BioLegend; clone IM7; used at 1:500), anti‐CD3‐APC (BioLegend; clone 17A2; used at 1:500), anti‐CD62L‐AF700 (BioLegend; clone MEL‐14; used at 1:400), anti‐Ly‐6C‐PE (BioLegend; clone HK1.4; used at 1:500), anti‐Ly‐6G–APC/Cy7 (BioLegend; clone 1A8; used at 1:500), anti‐CD11c‐AF700 (BioLegend; clone N418; used at 1:400), anti‐CD103‐AF594 (BioLegend; clone 2E7; used at 1:200), anti‐CD80‐APC (BioLegend; clone 16‐10A1; used at 1:100), anti‐CD95 (Fas)‐FITC (BioLegend; clone SA367H8; used at 1:800), or anti‐MHC‐I‐PE (BioLegend; clone 15‐5‐5; used at 1:100), at 4°C for 15 min in the dark. The samples were then washed twice and resuspended in FACS buffer for analysis. For analyzing TRegs, cells were stained according to the manufacturer’s protocol (Foxp3 Staining Buffer Set, eBioscience #00‐5523‐00), with anti‐mouse Foxp3‐AF700 (BioLegend; clone MF‐14; used at 1:100). For analyzing intracellular markers Ifn‐γ and Ki‐67, cells were stained according to the manufacturers’ protocols with anti‐mouse Ifn‐γ‐FITC (BioLegend; clone XMG1.2; used at 1:100) or anti‐mouse Ki‐67‐FITC (BioLegend; clone 16A8; used at 1:200).
Flow cytometry data were acquired on a BD LSRII flow‐cytometer and analyzed using the Flowjo software. Cells were first gated on the basis of forward scatter (FSC) and side scatter (SSC) to focus on live cells, followed by doublet exclusion using SSC‐A and SSC‐W, as well as FSC‐A and FSC‐W. Cells were then analyzed based on staining patterns of specific antibodies. When beads were used, beads were gated based on their FSC/SSC pattern and bead counts were enumerated. To obtain absolute cell numbers, the corresponding cell counts were normalized based on the bead counts obtained from the same flow cytometry experiment, as well as tumor weight, so that the normalized numbers reflect cell counts per gram of tumor.
Bone marrow transplantation
Bone marrow transplantation was performed similar to what we published before (Guo et al, 2012; Adams et al, 2012; Cheng et al, 2013). Specifically, bone marrow cells were harvested from either Ifnar1 +/+ or Ifnar1 −/− mice, and kept on ice before transplantation. Recipient mice were 8‐week‐old female WT C57BL/6 mice and were irradiated in a cesium irradiator at a lethal dose of 10 Gy. Each recipient mouse was transplanted with 3 million bone marrow cells from donor mice on the same day of the irradiation. Recipient mice were then recovered for 45 days before initiating cancer cell challenge.
RNA‐Seq and data analysis
MC38 cells were treated in vitro with 1 mM 5‐FU or PBS for 24 h. Total RNA was harvested using TRIzol. RNA‐Seq library preparation and sequencing were performed by BGI genomics, through polyA enrichment. After sequencing, the raw reads were aligned to the mm10 mouse genome assembly by STAR aligner (version 2.4.1a). Quantification of the RNA‐Seq data was performed using HTSeq (version 0.11.2). For analysis of the effect of 5‐FU treatment, gene set enrichment analysis (GSEA) was performed by using the GSEA program (GSEA 4.0.1) (Subramanian et al, 2005), using curated IFN gene sets from the MSigDB database (Liberzon et al, 2011). P values were obtained by permuting genes during the GSEA procedure.
Cell imaging
MC38 cells were transduced with a GFP‐expressing control virus, and GFP‐expressing MC38 cells were plated into removable 8‐well slide chambers (ibidi #80841). Cells were treated with either PBS, 0.3 µM 5‐FU or 300 µg/ml DTIC, for 24 or 48 h, and then fixed with 4% paraformaldehyde (PFA) in PBS for 10 min, permeabilized with 0.2% Triton X‐100 in PBS for 5 min, and stained with 1 µg/ml DAPI (Thermo Fisher #62248) for 5 min. Pictures were taken using a Leica SP5 confocal microscope. For each treatment, micronuclei‐like DNA structures were counted in 10 different fields of view from two different slides and normalized to the number of nuclei in the same fields.
Immunoblot analysis
Western blot analysis was performed similar to our previous studies (Cheng et al, 2013; Liu et al, 2017; Pan et al, 2017). Briefly, cells were extracted with Triton‐X100 buffer (150 mM sodium chloride, 50 mM Tris buffer, 1% Triton‐X100, pH 8.0) with proteinase inhibitors (Roche #11836170001) and phosphatase inhibitors (Sigma #4906845001). For western analysis, 30 μg of protein from each sample was analyzed in 10% SDS–PAGE gels and transferred onto Immobilon‐FL membranes (Millipore #05317‐10EA). Antibodies used include STING (Cell Signaling Technology #13647S), cGAS (Cell Signaling Technology #15102), Ifnar1 (Thermo Fisher #MA5‐32006), Ifnα (Abcam #ab7373), Hsp90 (Cell Signaling Technology #4874S), and GAPDH (Cell Signaling Technology #2118L).
ELISA
Control or IFN KO MC38 cells were stimulated with 100 ng/ml DMXAA for 4 h. Media were collected, and Ifnβ concentration was assessed using Mouse IFN‐beta Quantikine ELISA Kit (R&D Systems #MIFNB0), following manufacturer’s protocol.
Cell viability and proliferation assays
For proliferation assays, cells were seeded at a density of 2,000 cells per well in 96‐well plates and incubated for 24 h, which was treated as day 0. Cell viability was measured at this point and also after 1, 2, or 3 days afterward. CellTiter‐GLO kit (Promega #G7571) was used to measure cell viability. Luminescence signals were measured using a SpectraMax iD3 Multi‐Mode Microplate Reader (Molecular Devices).
To measure the drug responses, cells were plated at 5000 cells per well in 96‐well plates for 24 h prior to drug treatment. For 5‐FU treatment of MC38 cells, the following concentrations were used: 0, 0.1, 0.3, 1, 3, 10 µM. For 5‐FU treatment of CT26 cells, the following concentrations were used: 0, 0.1, 0.3, 1, 3, 10, 30, 100, 300 µM. For DTIC treatment of YUMM1.7 cells, the following concentrations were used: 0, 0.5, 1, 5, 10, 50, 100, 200, 300, 400, 500 µg/ml. For DTIC treatment of MC38 cells, the following concentrations were used: 0, 1, 10, 50, 100, 200, 500, 1,000 µg/ml. Cells were then subjected to cell viability analysis using CellTiter‐GLO after 2 days (for MC38, CT26, and YUMM1.7). These time points were selected based on pilot time course experiments showing clear treatment effects at these points with control untreated cells growing in the exponential growth phase. All assays were performed according to the manufacturers’ protocols.
Quantitative RT–PCR
Cells were treated with drugs in vitro, with 5‐FU (1 mM) for 24 h, DTIC (100 µg/ml) for 24 h, DMXAA (100 ng/ml) for 6 h and cGAMP (20 µg/ml) for 6 h. For cGAMP treatment, cells were transfected with cGAMP using Lipofectamine 3000 reagent (Thermo Fisher #L3000015). For assaying the effects of different concentrations of 5‐FU on IFN response, the concentrations in the relevant figures were used. Total RNA was extracted from cells or mouse tissues with TRIzol reagent (Thermo Fisher #15596018) according to the manufacturer’s protocol. cDNA was synthesized using SuperScript III reagent kit (Thermo Fisher #18080093) using random hexamer. The RNA expression levels of mouse Ifnb1, Ifit1, Irf7, and Stat1 were quantified by real‐time PCR using the SYBR Green PCR Master Mix (Thermo Fisher #4367659). All gene expression results were normalized to the expression of the housekeeping gene GAPDH. Real‐time PCR was performed on a Bio‐Rad CFX384 machine. Gene expression data were analyzed by calculating the threshold values (Ct) and fold changes relative to the GAPDH control. Primers used in this study are listed in Appendix Table S2.
Patient data analysis
The TCGA colon adenocarcinoma (COAD) data were downloaded from cBioPortal for Cancer Genomics (http://www.cbioportal.org/) in August 2018. The dataset contains survival data with clinical information, and transcriptome expression levels from RNA‐Seq. The related protein data for 58 TCGA COAD samples were downloaded from Clinical Proteomic Tumor Analysis Consortium (CPTAC) (https://cptac‐data‐portal.georgetown.edu/). The dataset contains mass‐spectrometer‐based protein quantification.
For analysis of the association between STING protein and survival, we divided the 58 samples into non‐zero counts of STING protein (STING‐Hi, n = 43) and those with undetectable levels (STING‐Low, n = 15). Kaplan–Meier curves were plotted, and log‐rank P values were calculated using GraphPad Prism software 7.0. For analysis of STING RNA for the same samples, normalized TCGA RNA‐Seq data for the same 58 samples were analyzed. Samples were sorted based on STING RNA expression, and the top 43 samples were classified as STING‐Hi whereas the bottom 15 samples were classified as STING‐Low. Additionally, we analyzed STING RNA expression in Stage II and Stage III samples from the TCGA COAD dataset. These two stages have the largest numbers of samples in the COAD dataset. All repeated measurements were excluded, and all patients with a total survival greater than 3,000 days were excluded from the study. Remaining samples were classified into STING‐Hi if their STING RNA expression levels were among the top 1/3 of samples, whereas those in the bottom 1/3 were classified as STING‐Low. Kaplan–Meier curves and P values were similarly plotted or calculated as above.
For analysis of gene expression between responders and non‐responders to chemotherapy, we used data from GSE19860 (from the Gene Expression Omnibus (GEO)) to examine the levels of STING (TMEM173) RNA expression. P values were determined by two‐tailed unpaired Student’s t‐test between the responder group and non‐responder group.
Quantification and statistical analysis
Unless stated otherwise, we used two‐tailed unpaired Student’s t‐test for comparisons between the means of two variables. We have also used Welch’s t‐test, which resulted in similar conclusions. Tests were performed using GraphPad Prism software 6.0. Other P value calculations were stated in specific methods sections above.
Author contributions
JT and JL conceived the study. JL, SK and QL supervised or advised the study. JT performed the majority of the experiments with assistance from DZ, VK, QW, YW, DF and LW. DZ and JL analyzed RNA‐Seq data. JT and DZ analyzed the clinical data. QY, MB and MDM provided essential reagents and advised the project. JT and JL wrote the manuscript.
Conflict of interest
The authors declare that they have no conflict of interest.
Supporting information
Appendix
Expanded View Figures PDF
Review Process File
Acknowledgments
This study was supported in part by grants to JL (DoD W81XWH‐17‐1‐0306), QY (NIH R01CA237586 and P50CA121974). The study utilized services provided by the NIDDK‐funded Yale Cooperative Center of Excellence in Hematology.
The EMBO Journal (2021) 40: e106065.
Data availability
RNA‐Seq data from this study have been submitted to GEO (GSE160985).
References
- Adams BD, Guo S, Bai H, Guo Y, Megyola CM, Cheng J, Heydari K, Xiao C, Reddy EP, Lu J (2012) An in vivo functional screen uncovers miR‐150‐mediated regulation of hematopoietic injury response. Cell Rep 2: 1048–1060 [DOI] [PMC free article] [PubMed] [Google Scholar]
- Ahn J, Xia T, Konno H, Konno K, Ruiz P, Barber GN (2014) Inflammation‐driven carcinogenesis is mediated through STING. Nat Commun 5: 5166 [DOI] [PMC free article] [PubMed] [Google Scholar]
- Cai X, Chiu YH, Chen ZJ (2014) The cGAS‐cGAMP‐STING pathway of cytosolic DNA sensing and signaling. Mol Cell 54: 289–296 [DOI] [PubMed] [Google Scholar]
- Chen Q, Boire A, Jin X, Valiente M, Er EE, Lopez‐Soto A, Jacob LS, Patwa R, Shah H, Xu K et al (2016a) Carcinoma‐astrocyte gap junctions promote brain metastasis by cGAMP transfer. Nature 533: 493–498 [DOI] [PMC free article] [PubMed] [Google Scholar]
- Chen Q, Sun L, Chen ZJ (2016b) Regulation and function of the cGAS‐STING pathway of cytosolic DNA sensing. Nat Immunol 17: 1142–1149 [DOI] [PubMed] [Google Scholar]
- Cheng J, Guo S, Chen S, Mastriano SJ, Liu C, D’Alessio AC, Hysolli E, Guo Y, Yao H, Megyola CM et al (2013) An Extensive network of TET2‐targeting microRNAs regulates malignant hematopoiesis. Cell Rep 5: 471–481 [DOI] [PMC free article] [PubMed] [Google Scholar]
- Cheng J, Roden CA, Pan W, Zhu S, Baccei A, Pan X, Jiang T, Kluger Y, Weissman SM, Guo S et al (2016) A molecular chipper technology for CRISPR sgRNA library generation and functional mapping of noncoding regions. Nat Commun 7: 11178 [DOI] [PMC free article] [PubMed] [Google Scholar]
- Chiappinelli KB, Strissel PL, Desrichard A, Li H, Henke C, Akman B, Hein A, Rote NS, Cope LM, Snyder A et al (2015) Inhibiting DNA methylation causes an interferon response in cancer via dsRNA including endogenous retroviruses. Cell 162: 974–986 [DOI] [PMC free article] [PubMed] [Google Scholar]
- Copur S, Aiba K, Drake JC, Allegra CJ, Chu E (1995) Thymidylate synthase gene amplification in human colon cancer cell lines resistant to 5‐fluorouracil. Biochem Pharmacol 49: 1419–1426 [DOI] [PubMed] [Google Scholar]
- Corrales L, Glickman LH, McWhirter SM, Kanne DB, Sivick KE, Katibah GE, Woo SR, Lemmens E, Banda T, Leong JJ et al (2015) Direct activation of STING in the tumor microenvironment leads to potent and systemic tumor regression and immunity. Cell Rep 11: 1018–1030 [DOI] [PMC free article] [PubMed] [Google Scholar]
- Curran E, Chen X, Corrales L, Kline DE, Dubensky TW, Duttagupta P, Kortylewski M, Kline J (2016) STING pathway activation stimulates potent immunity against acute myeloid leukemia. Cell Rep 15: 2357–2366 [DOI] [PMC free article] [PubMed] [Google Scholar]
- Danenberg PV, Leichman L, Lenz HJ, Leichman CG, Danenberg KD (1995) Thymidylate synthase gene and protein expression correlate and are associated with response to 5‐fluorouracil in human colorectal and gastric tumors. Cancer Res 55: 1407–1412 [PubMed] [Google Scholar]
- Demaria O, De Gassart A, Coso S, Gestermann N, Di Domizio J, Flatz L, Gaide O, Michielin O, Hwu P, Petrova TV et al (2015) STING activation of tumor endothelial cells initiates spontaneous and therapeutic antitumor immunity. Proc Natl Acad Sci USA 112: 15408–15413 [DOI] [PMC free article] [PubMed] [Google Scholar]
- Deng L, Liang H, Xu M, Yang X, Burnette B, Arina A, Li XD, Mauceri H, Beckett M, Darga T et al (2014) STING‐dependent cytosolic DNA sensing promotes radiation‐induced type I interferon‐dependent antitumor immunity in immunogenic tumors. Immunity 41: 843–852 [DOI] [PMC free article] [PubMed] [Google Scholar]
- Dosset M, Vargas TR, Lagrange A, Boidot R, Végran F, Roussey A, Chalmin F, Dondaine L, Paul C, Marie‐Joseph EL et al (2018) PD‐1/PD‐L1 pathway: an adaptive immune resistance mechanism to immunogenic chemotherapy in colorectal cancer. Oncoimmunology 7: 1–14 [DOI] [PMC free article] [PubMed] [Google Scholar]
- Dou Z, Ghosh K, Vizioli MG, Zhu J, Sen P, Wangensteen KJ, Simithy J, Lan Y, Lin Y, Zhou Z et al (2017) Cytoplasmic chromatin triggers inflammation in senescence and cancer. Nature 550: 402–406 [DOI] [PMC free article] [PubMed] [Google Scholar]
- Douillard JY, Cunningham D, Roth AD, Navarro M, James RD, Karasek P, Jandik P, Iveson T, Carmichael J, Alakl M et al (2000) Irinotecan combined with fluorouracil compared with fluorouracil alone. as first‐line treatment for metastatic colorectal cancer: a multicentre randomised trial. Lancet 355: 1041–1047 [DOI] [PubMed] [Google Scholar]
- Ellis MJ, Gillette M, Carr SA, Paulovich AG, Smith RD, Rodland KK, Townsend RR, Kinsinger C, Mesri M, Rodriguez H et al (2013) Connecting genomic alterations to cancer biology with proteomics: The NCI clinical proteomic tumor analysis consortium. Cancer Discov 3: 1108–1112 [DOI] [PMC free article] [PubMed] [Google Scholar]
- Galluzzi L, Buqué A, Kepp O, Zitvogel L, Kroemer G (2015) Immunological effects of conventional chemotherapy and targeted anticancer agents. Cancer Cell 28: 690–714 [DOI] [PubMed] [Google Scholar]
- Giacchetti S, Perpoint B, Zidani R, Le Bail N, Faggiuolo R, Focan C, Chollet P, Llory JF, Letourneau Y, Coudert B et al (2000) Phase III multicenter randomized trial of oxaliplatin added to chronomodulated fluorouracil‐leucovorin as first‐line treatment of metastatic colorectal cancer. J Clin Oncol 18: 136–147 [DOI] [PubMed] [Google Scholar]
- Glück S, Guey B, Gulen MF, Wolter K, Kang TW, Schmacke NA, Bridgeman A, Rehwinkel J, Zender L, Ablasser A (2017) Innate immune sensing of cytosolic chromatin fragments through cGAS promotes senescence. Nat Cell Biol 19: 1061–1070 [DOI] [PMC free article] [PubMed] [Google Scholar]
- Guo S, Bai H, Megyola CM, Halene S, Krause DS, Scadden DT, Lu J (2012) Complex oncogene dependence in microRNA‐125a‐induced myeloproliferative neoplasms. Proc Natl Acad Sci USA 109: 16636–16641 [DOI] [PMC free article] [PubMed] [Google Scholar]
- Guo S, Zi X, Schulz VP, Cheng J, Zhong M, Koochaki SHJ, Megyola CM, Pan X, Heydari K, Weissman SM et al (2014) Nonstochastic reprogramming from a privileged somatic cell state. Cell 156: 649–662 [DOI] [PMC free article] [PubMed] [Google Scholar]
- Harding SM, Benci JL, Irianto J, Discher DE, Minn AJ, Greenberg RA (2017) Mitotic progression following DNA damage enables pattern recognition within micronuclei. Nature 548: 466–470 [DOI] [PMC free article] [PubMed] [Google Scholar]
- Hausmaninger H, Moser R, Samonigg H, Mlineritsch B, Schmidt H, Pecherstorfer M, Fridrik M, Kopf C, Nitsche D, Kaider A et al (1999) Biochemical modulation of 5‐fluorouracil by leucovorin with or without interferon‐α‐2c in patients with advanced colorectal cancer: final results of a randomised phase III study. Eur J Cancer 35: 380–385 [DOI] [PubMed] [Google Scholar]
- Houghton JA, Morton CL, Adkins DA, Rahman A (1993) Locus of the interaction among 5‐fluorouracil, leucovorin, and interferon‐α2a in colon carcinoma cells. Cancer Res 53: 4243–4250 [PubMed] [Google Scholar]
- Ikoma N, Raghav K, Chang G (2017) An update on randomized clinical trials in metastatic colorectal carcinoma. Surg Oncol Clin N Am 26: 667–687 [DOI] [PMC free article] [PubMed] [Google Scholar]
- Kikuchi O, Ohashi S, Nakai Y, Nakagawa S, Matsuoka K, Kobunai T, Takechi T, Amanuma Y, Yoshioka M, Ida T et al (2015) Novel 5‐fluorouracil‐resistant human esophageal squamous cell carcinoma cells with dihydropyrimidine dehydrogenase overexpression. Am J Cancer Res 5: 2431–2440 [PMC free article] [PubMed] [Google Scholar]
- Lemos H, Mohamed E, Huang L, Ou R, Pacholczyk G, Arbab AS, Munn D, Mellor AL (2016) STING promotes the growth of tumors characterized by low antigenicity via IDO activation. Cancer Res 76: 2076–2081 [DOI] [PMC free article] [PubMed] [Google Scholar]
- Li T, Chen ZJ (2018) The cGAS–cGAMP–STING pathway connects DNA damage to inflammation, senescence, and cancer. J Exp Med 215: 1287–1299 [DOI] [PMC free article] [PubMed] [Google Scholar]
- Li T, Cheng H, Yuan H, Xu Q, Shu C, Zhang Y, Xu P, Tan J, Rui Y, Li P et al (2016) Antitumor activity of cGAMP via stimulation of cGAS‐cGAMP‐STING‐IRF3 mediated innate immune response. Sci Rep 6: 1–14 [DOI] [PMC free article] [PubMed] [Google Scholar]
- Liberzon A, Subramanian A, Pinchback R, Thorvaldsdóttir H, Tamayo P, Mesirov JP (2011) Molecular signatures database (MSigDB) 3.0. Bioinformatics 27: 1739–1740 [DOI] [PMC free article] [PubMed] [Google Scholar]
- Liu J, Guo B, Chen Z, Wang N, Iacovino M, Cheng J, Roden C, Pan W, Khan S, Chen S et al (2017) miR‐125b promotes MLL‐AF9‐driven murine acute myeloid leukemia involving a VEGFA‐mediated non‐cell‐intrinsic mechanism. Blood 129: 1491–1502 [DOI] [PMC free article] [PubMed] [Google Scholar]
- Lohard S, Bourgeois N, Maillet L, Gautier F, Fétiveau A, Lasla H, Nguyen F, Vuillier C, Dumont A, Moreau‐aubry A et al (2020) STING‐dependent paracriny shapes apoptotic priming of breast tumors in response to anti‐mitotic treatment. Nat Commun 11: 1–16 [DOI] [PMC free article] [PubMed] [Google Scholar]
- Longley DB, Harkin DP, Johnston PG (2003) 5‐Fluorouracil: mechanisms of action and clinical strategies. Nat Rev Cancer 3: 330–338 [DOI] [PubMed] [Google Scholar]
- Ma Z, Damania B (2016) The cGAS‐STING defense pathway and its counteraction by viruses. Cell Host Microbe 19: 150–158 [DOI] [PMC free article] [PubMed] [Google Scholar]
- Mackenzie KJ, Carroll P, Martin C‐A, Murina O, Fluteau A, Simpson DJ, Olova N, Sutcliffe H, Rainger JK, Leitch A et al (2017) cGAS surveillance of micronuclei links genome instability to innate immunity. Nature 548: 461–465 [DOI] [PMC free article] [PubMed] [Google Scholar]
- Meeth K, Wang JX, Micevic G, Damsky W, Bosenberg MW (2016) The YUMM lines: a series of congenic mouse melanoma cell lines with defined genetic alterations. Pigment Cell Melanoma Res 29: 590–597 [DOI] [PMC free article] [PubMed] [Google Scholar]
- Morikawa K, Fan D, Denkins YM, Levin B, Gutterman JU, Walker SM, Fidler IJ (1989) Mechanisms of combined effects of gamma‐interferon and 5‐fluorouracil on human colon cancers implanted into nude mice. Cancer Res 49: 799–805 [PubMed] [Google Scholar]
- Ng KW, Marshall EA, Bell JC, Lam WL (2018) CGAS‐STING and cancer: dichotomous roles in tumor immunity and development. Trends Immunol 39: 44–54 [DOI] [PubMed] [Google Scholar]
- Pan W, Zhu S, Qu K, Meeth K, Cheng J, He K, Ma H, Liao Y, Wen X, Roden C et al (2017) The DNA methylcytosine dioxygenase Tet2 sustains immunosuppressive function of tumor‐infiltrating myeloid cells to promote melanoma progression. Immunity 47: 284–297.e5 [DOI] [PMC free article] [PubMed] [Google Scholar]
- Robinson SM, Mann DA, Manas DM, Oakley F, Mann J, White SA (2013) The potential contribution of tumour‐related factors to the development of FOLFOX‐induced sinusoidal obstruction syndrome. Br J Cancer 109: 2396–2403 [DOI] [PMC free article] [PubMed] [Google Scholar]
- Rongvaux A, Jackson R, Harman CCD, Li T, West AP, De Zoete MR, Wu Y, Yordy B, Lakhani SA, Kuan CY et al (2014) Apoptotic caspases prevent the induction of type i interferons by mitochondrial DNA. Cell 159: 1563–1577 [DOI] [PMC free article] [PubMed] [Google Scholar]
- Roulois D, Loo Yau H, Singhania R, Wang Y, Danesh A, Shen SY, Han H, Liang G, Jones PA, Pugh TJ et al (2015) DNA‐Demethylating agents target colorectal cancer cells by inducing viral mimicry by endogenous transcripts. Cell 162: 961–973 [DOI] [PMC free article] [PubMed] [Google Scholar]
- Schadt L, Sparano C, Schweiger NA, Silina K, Cecconi V, Lucchiari G, Yagita H, Guggisberg E, Saba S, Nascakova Z et al (2019) Cancer‐cell‐intrinsic cGAS expression mediates tumor immunogenicity. Cell Rep 29: 1236–1248.e7 [DOI] [PubMed] [Google Scholar]
- Sistigu A, Yamazaki T, Vacchelli E, Chaba K, Enot DP, Adam J, Vitale I, Goubar A, Baracco EE, Remédios C et al (2014) Cancer cell–autonomous contribution of type I interferon signaling to the efficacy of chemotherapy. Nat Med 20: 1301–1309 [DOI] [PubMed] [Google Scholar]
- Subramanian A, Tamayo P, Mootha VK, Mukherjee S, Ebert BL, Gillette MA, Paulovich A, Pomeroy SL, Golub TR, Lander ES et al (2005) Gene set enrichment analysis: a knowledge‐based approach for interpreting genome‐wide expression profiles. Proc Natl Acad Sci USA 102: 15545–15550 [DOI] [PMC free article] [PubMed] [Google Scholar]
- Takebe N, Zhao SC, Ural AU, Johnson MR, Banerjee D, Diasio RB, Bertino JR (2001) Retroviral transduction of human dihydropyrimidine dehydrogenase cDNA confers resistance to 5‐fluorouracil in murine hematopoietic progenitor cells and human CD34+‐enriched peripheral blood progenitor cells. Cancer Gene Ther 8: 966–973 [DOI] [PubMed] [Google Scholar]
- Vanpouille‐Box C, Demaria S, Formenti SC, Galluzzi L (2018) Cytosolic DNA sensing in organismal tumor control. Cancer Cell 34: 361–378 [DOI] [PubMed] [Google Scholar]
- Vincent J, Mignot G, Chalmin F, Ladoire S, Bruchard M, Chevriaux A, Martin F, Apetoh L, Rébé C, Ghiringhelli F (2010) 5‐Fluorouracil selectively kills tumor‐associated myeloid‐derived suppressor cells resulting in enhanced T cell‐dependent antitumor immunity. Cancer Res 70: 3052–3061 [DOI] [PubMed] [Google Scholar]
- Wang H, Hu S, Chen X, Shi H, Chen C, Sun L, Chen ZJ (2017) cGAS is essential for the antitumor effect of immune checkpoint blockade. Proc Natl Acad Sci USA 114: 1637–1642 [DOI] [PMC free article] [PubMed] [Google Scholar]
- Watanabe T, Kobunai T, Yamamoto Y, Matsuda K, Ishihara S, Nozawa K, Iinuma H, Konishi T, Horie H, Ikeuchi H et al (2011) Gene expression signature and response to the use of leucovorin, fluorouracil and oxaliplatin in colorectal cancer patients. Clin Transl Oncol 13: 419–425 [DOI] [PubMed] [Google Scholar]
- Weinstein JN, Collisson EA, Mills GB, Shaw KRM, Ozenberger BA, Ellrott K, Sander C, Stuart JM, Chang K, Creighton CJ et al (2013) The cancer genome atlas pan‐cancer analysis project. Nat Genet 45: 1113–1120 [DOI] [PMC free article] [PubMed] [Google Scholar]
- West AP, Khoury‐Hanold W, Staron M, Tal MC, Pineda CM, Lang SM, Bestwick M, Duguay BA, Raimundo N, MacDuff DA et al (2015) Mitochondrial DNA stress primes the antiviral innate immune response. Nature 520: 553–557 [DOI] [PMC free article] [PubMed] [Google Scholar]
- White MJ, McArthur K, Metcalf D, Lane RM, Cambier JC, Herold MJ, Van Delft MF, Bedoui S, Lessene G, Ritchie ME et al (2014) Apoptotic caspases suppress mtDNA‐induced STING‐mediated type i IFN production. Cell 159: 1549–1562 [DOI] [PMC free article] [PubMed] [Google Scholar]
- Won JK, Bakhoum SF (2020) The cytosolic DNA‐sensing cGAS–sting pathway in cancer. Cancer Discov 10: 26–39 [DOI] [PMC free article] [PubMed] [Google Scholar]
- Woo SR, Fuertes MB, Corrales L, Spranger S, Furdyna MJ, Leung MYK, Duggan R, Wang Y, Barber GN, Fitzgerald KA et al (2014) STING‐dependent cytosolic DNA sensing mediates innate immune recognition of immunogenic tumors. Immunity 41: 830–842 [DOI] [PMC free article] [PubMed] [Google Scholar]
- Xia T, Konno H, Ahn J, Barber GN (2016) Deregulation of STING signaling in colorectal carcinoma constrains DNA damage responses and correlates with tumorigenesis. Cell Rep 14: 282–297 [DOI] [PMC free article] [PubMed] [Google Scholar]
- Zhang N, Yin Y, Xu SJ, Chen WS (2008) 5‐Fluorouracil: mechanisms of resistance and reversal strategies. Molecules 13: 1551–1569 [DOI] [PMC free article] [PubMed] [Google Scholar]
- Zhou Y, Fei M, Zhang G, Liang WC, Lin WY, Wu Y, Piskol R, Ridgway J, McNamara E, Huang H et al (2020) Blockade of the phagocytic receptor MerTK on tumor‐associated macrophages enhances P2X7R‐dependent STING activation by tumor‐derived cGAMP. Immunity 52: 357–373.e9 [DOI] [PubMed] [Google Scholar]
- Zitvogel L, Galluzzi L, Smyth MJ, Kroemer G (2013) Mechanism of action of conventional and targeted anticancer therapies: reinstating immunosurveillance. Immunity 39: 74–88 [DOI] [PubMed] [Google Scholar]
Associated Data
This section collects any data citations, data availability statements, or supplementary materials included in this article.
Supplementary Materials
Appendix
Expanded View Figures PDF
Review Process File
Data Availability Statement
RNA‐Seq data from this study have been submitted to GEO (GSE160985).


