

Abstract
A critical question in neurodegeneration is why the accumulation of disease‐driving proteins causes selective neuronal loss despite their brain‐wide expression. In Spinocerebellar ataxia type 1 (SCA1), accumulation of polyglutamine‐expanded Ataxin‐1 (ATXN1) causes selective degeneration of cerebellar and brainstem neurons. Previous studies revealed that inhibiting Msk1 reduces phosphorylation of ATXN1 at S776 as well as its levels leading to improved cerebellar function. However, there are no regulators that modulate ATXN1 in the brainstem—the brain region whose pathology is most closely linked to premature death. To identify new regulators of ATXN1, we performed genetic screens and identified a transcription factor‐kinase axis (ZBTB7B‐RSK3) that regulates ATXN1 levels. Unlike MSK1, RSK3 is highly expressed in the human and mouse brainstems where it regulates Atxn1 by phosphorylating S776. Reducing Rsk3 rescues brainstem‐associated pathologies and deficits, and lowering Rsk3 and Msk1 together improves cerebellar and brainstem function in an SCA1 mouse model. Our results demonstrate that selective vulnerability of brain regions in SCA1 is governed by region‐specific regulators of ATXN1, and targeting multiple regulators could rescue multiple degenerating brain areas.
Keywords: Ataxin‐1, MSK1, RSK3, selective vulnerability, Spinocerebellar ataxia type 1
Subject Categories: Molecular Biology of Disease, Neuroscience
Selective vulnerability of cerebellar and brainstem neurons in Spinocerebellar Ataxia Type 1 (SCA1) is driven by region‐specific regulators of the ATXN1 protein.
Introduction
Neurodegenerative disorders are incurable debilitating diseases resulting in irreversible deterioration of neuronal integrity. They are globally prevalent with the two most common diseases, Alzheimer’s (AD) and Parkinson’s disease (PD) affecting as many as 0.5% of the world population (Tysnes & Storstein, 2017; Erkkinen et al, 2018). In general, most neurodegenerative diseases are regarded as proteinopathies because across different disorders, accumulation of certain toxic proteins is commonly found in both familial and sporadic cases. For example, accumulation of β‐amyloid (Aβ), α‐synuclein, and tau are found in familial and sporadic cases of AD, PD, and frontotemporal dementia (FTD), respectively. Decreasing levels of the toxic proteins is considered to be beneficial as many preclinical studies have shown that this strategy can rescue various disease phenotypes (Kumar et al, 2000; Kordasiewicz et al, 2012; Spencer et al, 2016; Friedrich et al, 2018; Silva et al, 2019). One of the characteristic, and enigmatic, proteinopathic patterns in neurodegenerative disorders is that specific brain regions and/or neuronal cell types are vulnerable to pathological protein accumulations, despite the brain‐wide expression of these proteins (Saxena & Caroni, 2011; Roselli & Caroni, 2015; Fu et al, 2018).
To gain insight into mechanisms that contribute to brain region‐specific vulnerability, we turned to a well‐characterized and genetically defined neurodegenerative disorder: Spinocerebellar Ataxia type 1 (SCA1). SCA1 is a fatal late‐onset neurodegenerative disorder caused by an expansion of CAG repeats encoding polyglutamine (polyQ) tract in the ATXN1 gene (Orr et al, 1993). Although ATXN1 is broadly expressed in the brain, cerebellar and brainstem neurons degenerate, causing loss of motor coordination, and premature death due to swallowing and breathing difficulties, respectively (Zoghbi & Orr, 2009). Neuronal toxicity of mutant ATXN1 is caused by a gain‐of‐function mechanism based on the following evidence: (i) Knockout of Atxn1 in mice does not cause neurodegeneration, whereas increase of even wild‐type protein does (Matilla et al, 1998; Fernandez‐Funez et al, 2000; Gennarino et al, 2015); (ii) polyQ expansion stabilizes ATXN1 by retarding its proteasomal degradation (Cummings et al, 1999); (iii) reducing ATXN1 by only 20% can rescue some disease phenotypes (Jafar‐Nejad et al, 2011). Previous efforts have identified regulators that, when targeted, can decrease ATXN1 protein levels. However, to date, these approaches have succeeded in identifying ATXN1 regulators that when targeted only rescue cerebellar dysfunction. For example, MSK1 is a serine/threonine kinase that phosphorylates ATXN1 at serine 776 (S776), promoting its stability through its interaction with 14‐3‐3ε (Chen et al, 2003; Park et al, 2013). Loss of either Msk1 or 14‐3‐3ε decreases Atxn1 levels in cerebellum and rescues cerebellar related deficits, without impacting the brainstem and its associated pathologies (Jafar‐Nejad et al, 2011; Park et al, 2013). Given that brainstem dysfunction greatly impacts survival of SCA1 patients, current therapeutic targets have limited promise for full efficacy and thus identifying ATXN1 regulators that when targeted rescue brainstem dysfunction are of high value.
Using a forward genetic screen in cells, we found that a transcription factor ZBTB7B, and to a lesser degree its paralog ZBTB7A, alters ATXN1 levels. ZBTB7A and ZBTB7B are members of the BTB‐ZF family of transcription factors harboring the protein‐interaction BTB domain and DNA‐binding ZF domains whose neuronal functions remain largely unknown (Siggs & Beutler, 2012). Our transcriptomic studies revealed that ZBTB7B modulates ATXN1 indirectly by regulating the expression of RPS6KA2, which encodes RSK3, and this ZBTB7B‐RSK3 axis regulates ATXN1 in vivo. Although RSK and MSK belong to two distinct groups of kinases, we found that both phosphorylate ATXN1 at S776. However, unlike Msk1, Rsk3 predominantly regulates Atxn1 in the brainstem. The two kinases are differentially expressed across brain regions in mice and humans, and they showed differential efficacy in regulating Atxn1 in a brain region‐dependent manner. Our work demonstrates that a key phosphorylation site that impacts mutant ATXN1 levels can be modulated by different regulators in select brain regions, and show that targeting multiple regulators may expand therapeutic potential to rescue multiple degenerating brain areas.
Results
Genetic screen reveals that ZBTB7A and ZBTB7B regulate ATXN1, and ZBTB7B is the more potent regulator
We discovered novel ATXN1 regulators by performing an shRNA screen of 858 genes in a Daoy (human brain cancer) cell line designed to report on ATXN1 levels (Fig 1A). This cell line expresses a mRFP‐ATXN1(82Q)‐IRES‐YFP transgene where ATXN1 levels can be monitored by measuring the RFP/YFP fluorescence ratio (Park et al, 2013). After transducing the cell line with a pooled library of shRNAs (8,845 shRNAs, ~ 10 shRNAs/gene), cells displaying a decreased or increased RFP/YFP ratio (5% lowest and 5% highest fractions) were sorted and collected via fluorescence‐activated cell sorting (FACS). Using the unsorted bulk population of cells as a reference, shRNAs enriched in the sorted fractions were identified by next‐generation sequencing. Deconvoluting the genes targeted by these enriched shRNAs revealed potential ATXN1 regulators, which were grouped into either positive regulators (genes targeted by shRNAs in the 5% lowest) or negative regulators (genes targeted by shRNAs in the 5% highest). These regulators were filtered and ranked (see Materials and Methods) to identify 39 positive regulators and 13 negative regulators that when knocked down decrease or increase ATXN1 levels, respectively (Tables EV1 and EV2). Among the positive ATXN1 regulators, ZBTB7A and ZBTB7B, caught our attention as they are two close paralogs that ranked in the top five genes demonstrating a strong effect on ATXN1.
Figure 1. Genetic screens reveal that ZBTB7A and ZBTB7B regulate ATXN1, and ZBTB7B shows more pronounced effect.
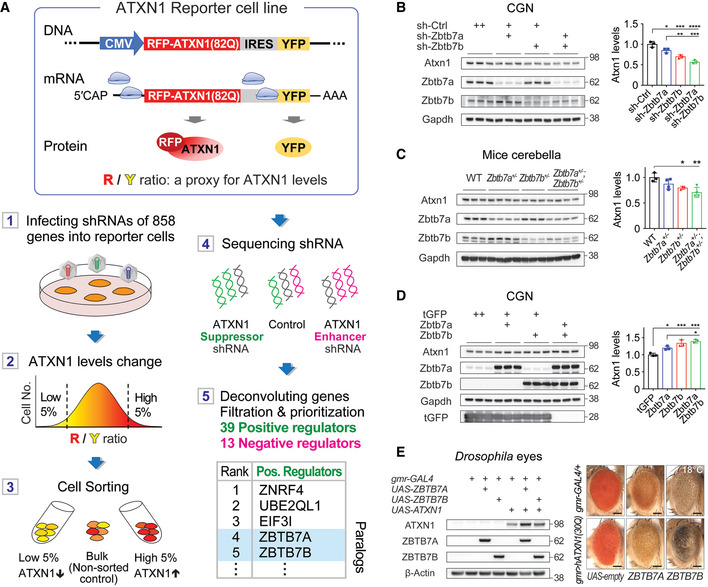
- A diagram that outlines the steps of the genetic screen. ATXN1 reporter cell line produces RFP‐conjugated ATXN1 and YFP internal control independently from a same transcript, and ATXN1 levels were monitored by measuring the ratio of red to yellow fluorescence intensity. (1) ATXN1 reporter cell line was transduced with lentivirus harboring shRNAs of 858 ubiquitination‐related genes. (2, 3) The cells with the 5% lowest and 5% highest fluorescence ratio were sorted. (4) Illumina sequencing revealed enriched shRNAs in the two groups compared to the non‐sorted group. (5) Identifying the genes targeted by these enriched shRNAs revealed 39 positive regulators including ZBTB7A and ZBTB7B, and 13 negative regulators of ATXN1 protein levels (See Table EV2 for the full list).
- Western blot analysis of Atxn1 levels in cerebellar granule neurons (CGNs) after knockdown of Zbtb7a and/or Zbtb7b (n = 3).
- Western blot analysis of Atxn1 levels in the cerebella of wild‐type (n = 3), Zbtb7a +/− (n = 4), Zbtb7b +/− (n = 3), Zbtb7a +/− ; Zbtb7b +/− (n = 4) mice.
- Western blot analysis of Atxn1 levels in CGNs after overexpressing Zbtb7a and/or Zbtb7b (n = 3).
- Genetic interaction of wild‐type human ATXN1(30Q) with either ZBTB7A or ZBTB7B expressed in the Drosophila eyes. Co‐expression of ATXN1(30Q) with ZBTB7A or ZBTB7B severely disrupted the external Drosophila eye structure and increased ATXN1 levels. Scale bar: 100 μm.
Data information: (B–D) Mean ± SD, *P < 0.05, **P < 0.01, ***P < 0.001, ****P < 0.0001, one‐way ANOVA.
Source data are available online for this figure.
We first confirmed that knockdown of either ZBTB7A or ZBTB7B in the reporter cell line decreased ATXN1 using Western blot analysis (Fig EV1A). To test whether ZBTB7A and ZBTB7B regulate endogenous Atxn1 in neurons, we transduced primary cerebellar granule neurons (CGNs) with lentivirus containing shRNAs that target either gene. Knockdown of either Zbtb7a or Zbtb7b in CGNs decreased Atxn1 significantly (Figs 1B and EV1B), and simultaneous knockdown of both of them decreased Atxn1 to a greater extent than knockdown of either alone (Fig 1B). This was also true in the cerebella of mice where double heterozygous knockout of Zbtb7a and Zbtb7b decreased Atxn1 more than single heterozygous knockout of each gene (Fig 1C). Consistent with these results, overexpression of either Zbtb7a or Zbtb7b increased Atxn1 in the CGNs, and co‐overexpression of both of them increased Atxn1 to a greater extent (Fig 1D). We next investigated the in vivo genetic interaction between ATXN1 and either ZBTB7A or ZBTB7B by expressing human ZBTB7A or ZBTB7B in the eyes of Drosophila also expressing human wild‐type ATXN1(30Q) in the same region (Fernandez‐Funez et al, 2000). These flies showed an increase of ATXN1 levels and with severe disruption of external ommatidia structures compared to the flies expressing ATXN1 without either ZBTB7A or ZBTB7B (Fig 1E). Altogether, these data indicate that ZBTB7A and ZBTB7B regulate ATXN1 positively and additively.
Figure EV1. Genetic screen reveals that ZBTB7A and ZBTB7B regulate ATXN1, and ZBTB7B shows more pronounced effects.
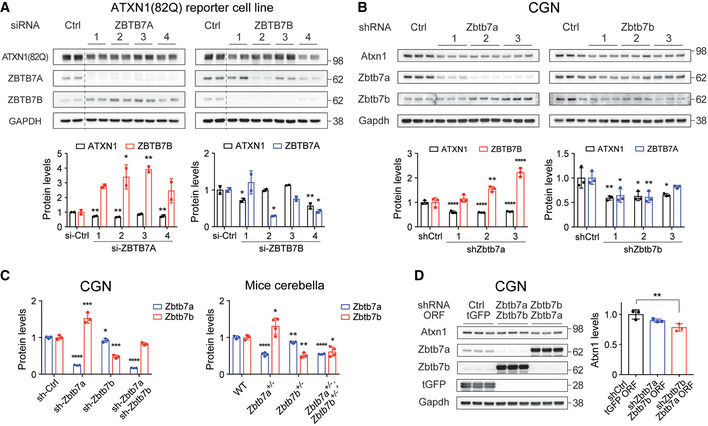
- Western blot analysis of ATXN1(82Q), ZBTB7A and ZBTB7B levels in ATXN1(82Q) reporter cell line after knockdown of either ZBTB7A or ZBTB7B (n = 2).
- Western blot analysis of Atxn1, Zbtb7a and Zbtb7b levels in cerebellar granule neurons (CGNs) after knockdown of either Zbtb7a or Zbtb7b (n = 3).
- Western blot analysis of Atxn1 levels after knockdown of either Zbtb7a or Zbtb7b and overexpression of the other (n = 3).
Data information: (A–D) Mean ± SD, *P < 0.05, **P < 0.01, ***P < 0.001, ****P < 0.0001, one‐way ANOVA.
Source data are available online for this figure.
Although both Zbtb7a and Zbtb7b regulate Atxn1 in vivo, there are remarkable differences between the two. While Zbtb7b −/− mice are viable (Wang et al, 2008b), Zbtb7a −/− mice are not (Maeda et al, 2009), suggesting that inhibiting Zbtb7b would be safer than Zbtb7a. Also, our in vitro and in vivo data show that Zbtb7b also had a greater effect on ATXN1 levels than Zbtb7a (Fig 1B–D). Notably, both knockdown and knockout of Zbtb7a induced a compensatory increase of Zbtb7b, but not vice versa (Figs 1B and C, and EV1, EV2, EV3, EV4, EV5, EV6), which might explain the weaker effect of Zbtb7a knockdown on Atxn1. To investigate the compensatory relationship between Zbtb7a and Zbtb7b in neurons, we measured Atxn1 levels after knocking down one of them and overexpressing the other simultaneously in CGNs. While Zbtb7a knockdown together with Zbtb7b overexpression did not change Atxn1 levels, Zbtb7b knockdown together with Zbtb7a overexpression did decrease Atxn1 protein levels, indicating that the Zbtb7a’s role in regulating Atxn1 can be partially replaced with Zbtb7b, but not vice versa (Fig EV1D). From this one‐way compensatory relationship between Zbtb7a and Zbtb7b, we concluded that Zbtb7b is the more potent ATXN1 regulator.
Figure EV2. ZBTB7B regulates ATXN1 indirectly through activating RSK3 expression.
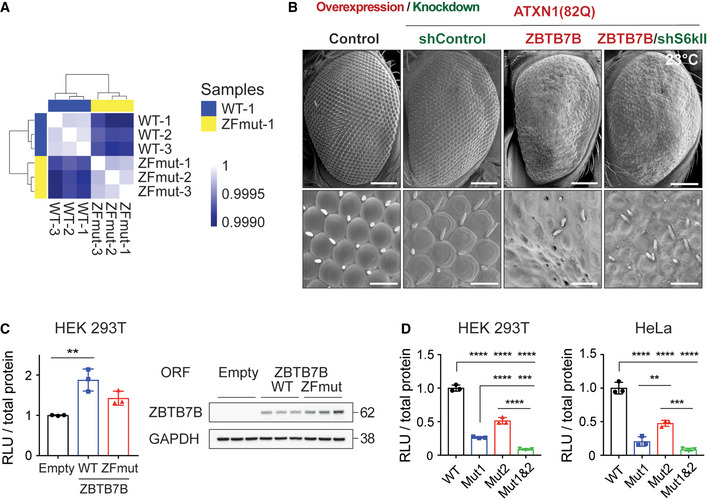
- Correlation heatmap of RNA‐seq samples derived from the cells overexpressing either WT or ZFmut ZBTB7B. Color scale: Pearson’s correlation coefficient.
- Images of Drosophila eyes co‐overexpressing human ATXN1(82Q) and ZBTB7B with or without knockdown of Drosophila RSK3 homolog Sk6II. Scale bar: 100 μm (top) and 20 μm (bottom).
- Luciferase assay of the RSK3 promoter in HEK 293T cells transfected with vectors expressing either WT or ZFmut ZBTB7B (left panel), and Western blot images showing the amount of the overexpressed WT and ZFmut ZBTB7B from cell lysates used in the luciferase assay (right panel) (n = 3).
- Luciferase assay of RSK3 promoter with mutations in either one or both of the putative ZBTB7B binding sites (Mut1 and Mut2) in HEK 293T and HeLa cells (n = 3).
Data information: (C, D) Mean ± SD, **P < 0.01, ***P < 0.001, ****P < 0.0001, one‐way ANOVA, post‐hoc: Tukey’s test.
Source data are available online for this figure.
Figure EV3. Inhibition of RSK3 decreases ATXN1 protein without changing its mRNA levels.
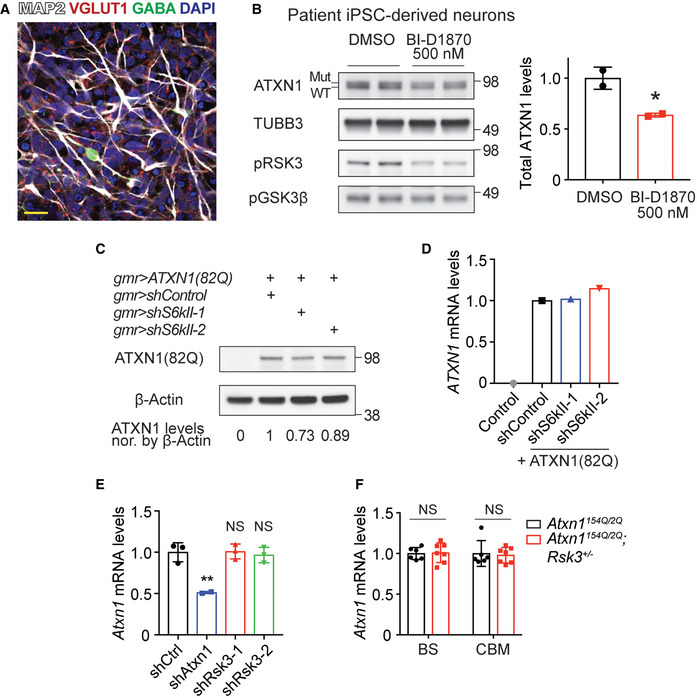
- Immunofluorescent (IF) image of MAP2, VGLUT1, and GABA in the SCA1 patient iPSC‐derived neurons differentiated for 3 weeks. Scale bar: 20 μm.
- Western blot analysis of ATXN1 levels after treating SCA1 patient iPSC‐derived neurons with 500 nM BI‐D1870 (n = 2). Mean ± SD, *P < 0.05, two‐tailed t‐test.
- Western blot analysis of ATXN1(82Q) levels after knockdown of S6kII in Drosophila eyes expressing ATXN1(82Q). Protein lysates were extracted from the pooled 25 fly heads per genotype.
- qRT–PCR results of ATXN1 mRNA levels after knockdown of S6kII in the Drosophila eyes expressing human ATXN1(82Q). Total RNA was extracted from the pooled 25 fly heads per genotype.
- qRT–PCR results of Atxn1 mRNA levels in the cerebella of the same mice used for the Western blot analysis in Fig 4D (n = 3 for shControl and shRsk3; n = 2 for shAtxn1). Mean ± SD, **P < 0.01, one‐way ANOVA.
- qRT–PCR results of Atxn1 mRNA levels in the brainstem and cerebella of the same mice used for the Western blot analysis in Fig 4E (n = 6 for Atxn1154Q / 2Q and n = 7 for Atxn1154Q / 2Q; Rsk3 +/− mice). Mean ± SD, Two‐tailed t‐test.
Source data are available online for this figure.
Figure EV4. Differential expression of Rsk3 across different brain regions.
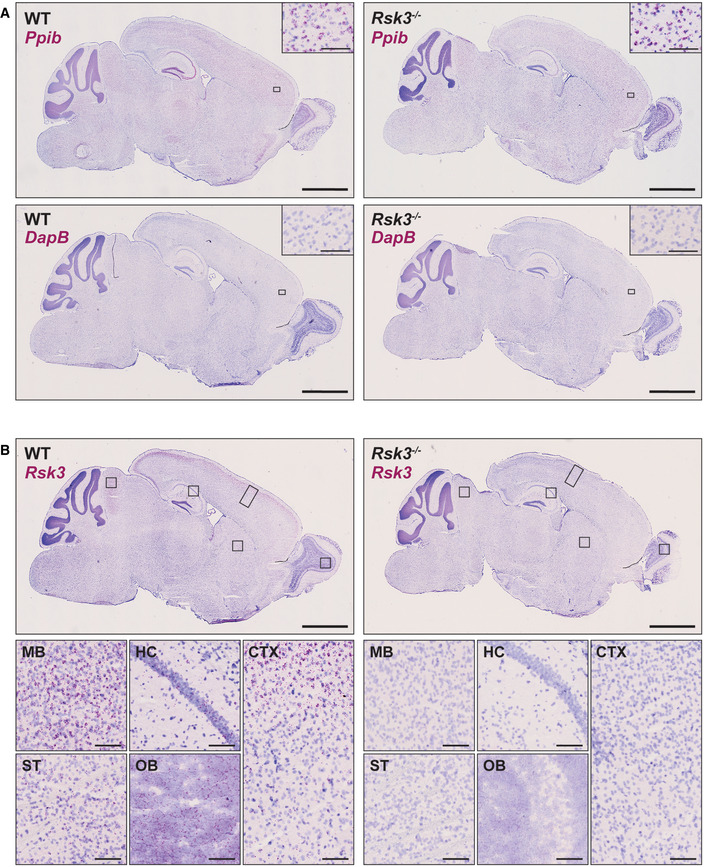
- BaseScope assay with a positive (Ppib) and negative control (DapB) in the sagittal sections of wild‐type and Rsk3 knockout mouse at 5–6 weeks old. This confirms RNA integrity and validation of the assay. Inset: magnified image of the area within the black box. Scale bar = 2 mm in the whole brain images; 100 μm in the insets.
- Supplementary images of Fig 5B that show Rsk3 expression in the midbrain, striatum, hippocampus, cortex, and olfactory bulb. The area within the black boxes in top panels are magnified in the bottom panels. Scale bar = 2 mm in the whole brain images; 100 μm in the magnified images.
Figure EV5. Differential expression of RSK3 and MSK1 in the brainstem and cerebellum.
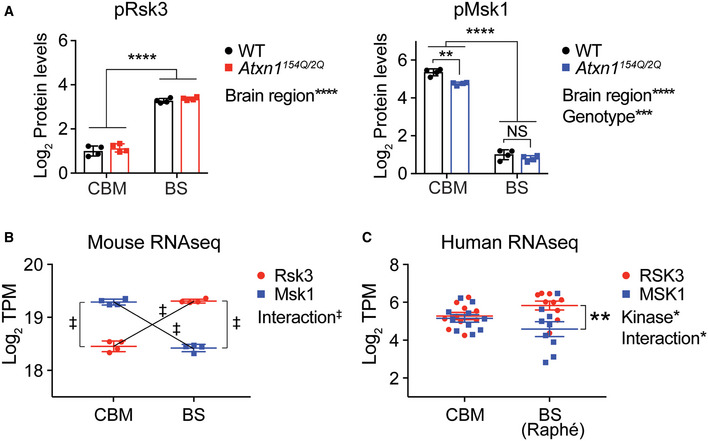
- Quantification of pRsk3 and pMsk1 protein levels in Fig 5D into log2 scale (n = 4). The protein levels of the two phospho‐kinases are significantly different between the two brain regions. Mean ± SD, **P < 0.01, ***P < 0.001, ****P < 0.0001, two‐way ANOVA.
- RNA‐seq result of Rsk3 and Msk1 expression (log2 TPM) in the 10‐week‐old wild‐type mice cerebella and brainstem. Two‐way ANOVA reveals the significant statistical interaction between kinase and brain region. Mean ± SD, n = 4 per each brain region, ‡ P < 0.0001.
- RNA‐seq result of RSK3 and MSK1 expression (log2 TPM) in human postmortem cerebella (n = 10) and brainstem Raphé nuclei (n = 9). Two‐way ANOVA reveals the significant statistical interaction between kinase and brain region. Mean ± SEM, *P < 0.05, **P < 0.01.
Figure EV6. Supportive data for biochemical, physiological, and histological phenotypes across different genotypes in Figs 6 and 7 .
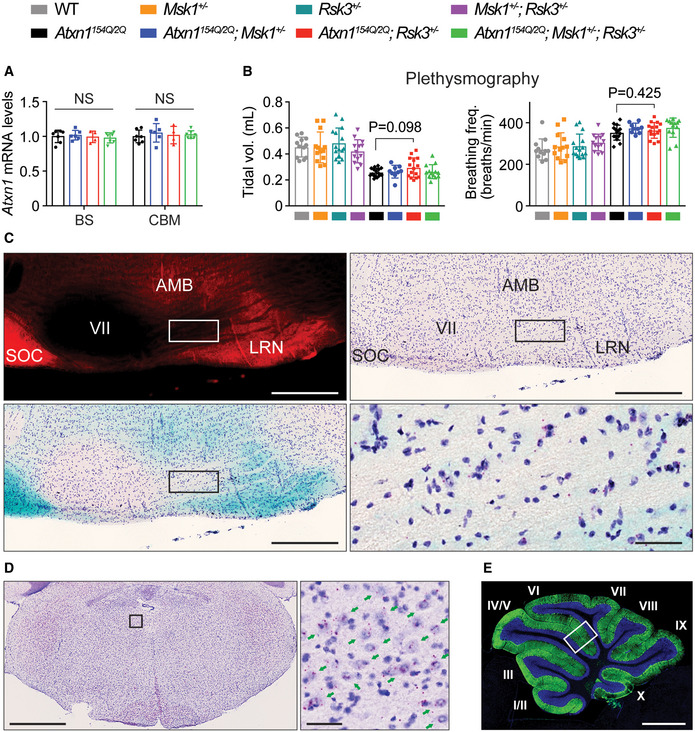
- qRT–PCR results of Atxn1 mRNA levels in the brainstem and cerebella of the same mice used for Western blot analysis in Fig 6A (n = 7, 6, 4, 7 following the order of genotypes in the graph). Mean ± SD, one‐way ANOVA in each brain region.
- Corresponding tidal volume (left panel) and breathing frequency (number of breaths per min, right panel) of the data in Fig 6B (n = 12, 13, 15, 13, 15, 9, 15, 13 following the order of genotypes in the graph, respectively). Mean ± SD, two‐tailed t‐test.
- Rsk3 expression in the PreBötzinger complex (PreBötC) and Bötzinger complex (BötC). Top left: Fluorescence image of Atoh1 lineage neurons (Red) in a sagittal section of Atoh1Cre /+ ; Rosalsl‐tdTomato / lsl‐tdTomato mouse brain. Top right: Brightfield image of Rsk3 BaseScope assay with the same section in the top left. Bottom left: merged image of the top right with color inverted image of the top left. Bottom right: magnified image in the area within the black box in the bottom left. SOC: superior olivary complex, VII: facial nerve, AMB: nucleus ambiguus, LRN: lateral reticular nucleus. Scale bar = 50 μm in bottom right; 500 μm in the others.
- Rsk3 expression in the hypoglossal nucleus. Left: BaseScope assay of Rsk3 in the coronal section of the brainstem in wild‐type mouse at 6 weeks old. Right: magnified image in the area within the black in the left. Arrows: pyramidal shaped neurons in the hypoglossal nucleus. Scale bar = 1 mm in the left; 50 μm in the right.
- A representative IF image of a whole cerebellum from wild‐type mice. The area within the white box were magnified and used in Fig 7E. The cerebellum lobules are numbered with Roman numerals, and the thickness of two molecular layer between lobule V and VI (where the white box is located) was consistently measured in each genotype. Scale bar: 1 mm.
ZBTB7B regulates ATXN1 indirectly through activating RSK3 expression
To investigate the mechanisms underlying ATXN1 regulation by ZBTB7B, we first focused on the two distinct domains of ZBTB7B, the four ZF (Zinc Finger) domains which bind target DNA sequences (Klug, 2010), and the BTB (Broad‐Complex, Tramtrack and Bric a brac) domain, which interacts with cullin3 E3 ligase (Xu et al, 2003) or transcriptional co‐regulators (Perez‐Torrado et al, 2006) (Fig 2A). With these two domains, ZBTB7B can either change gene expression or ubiquitinate proteins for degradation (Fig 2B). To determine which domain is involved in regulating ATXN1, both ZF and BTB domains were mutated within the full length ZBTB7B protein and overexpressed individually in Daoy cells, and ATXN1 levels were monitored. For ZF domain mutant (ZFmut), we generated an R363L mutation in the first ZF domain, because not only is R363 in direct contact with DNA (Pavletich & Pabo, 1991), but also mutating the corresponding residue of this in ZBTB7A (R399L) is known to abrogate target DNA binding ability (Liu et al, 2014). R49H and D35N/R49Q were used for BTB domain mutants (BTBmut) as they disrupt protein interacting function (Melnick et al, 2002) (Fig 2A). While the overexpression of BTBmut increased ATXN1 despite its low expression levels, overexpression of ZFmut did not, suggesting that DNA binding ZF domain is critical for regulating ATXN1 (Fig 2C). Therefore, we first hypothesized that ZBTB7B can change ATXN1 gene expression. However, the cerebella of Zbtb7b knockout mice showed no change in the Atxn1 mRNA levels (Fig 2D), suggesting that ZBTB7B indirectly regulates ATXN1 protein levels via unknown, intermediate regulators that can directly alter ATXN1 protein levels. To identify potential intermediate regulators, we performed an RNA‐seq on RNA from Daoy cells expressing either the wild‐type or ZFmut ZBTB7B, and analyzed differentially expressed genes (DEGs) (Fig 2E). The cells expressing WT ZBTB7B clearly showed an expression profile distinct from those expressing ZFmut ZBTB7B (Figs 2F and EV2A). After filtering our DEGs (see Materials and Methods), we focused on RSK3 (RPS6KA2) because its expression distinctively increase (4 fold) in cells overexpressing the wild‐type ZBTB7B compared to those expressing ZFmut, and RSK3 could potentially regulate Atxn1 directly as it can post‐translationally modify proteins in the nucleus where ATXN1 mainly resides (Fig 2E and Table EV3).
Figure 2. ZBTB7B regulates ATXN1 indirectly through activating RSK3 expression.
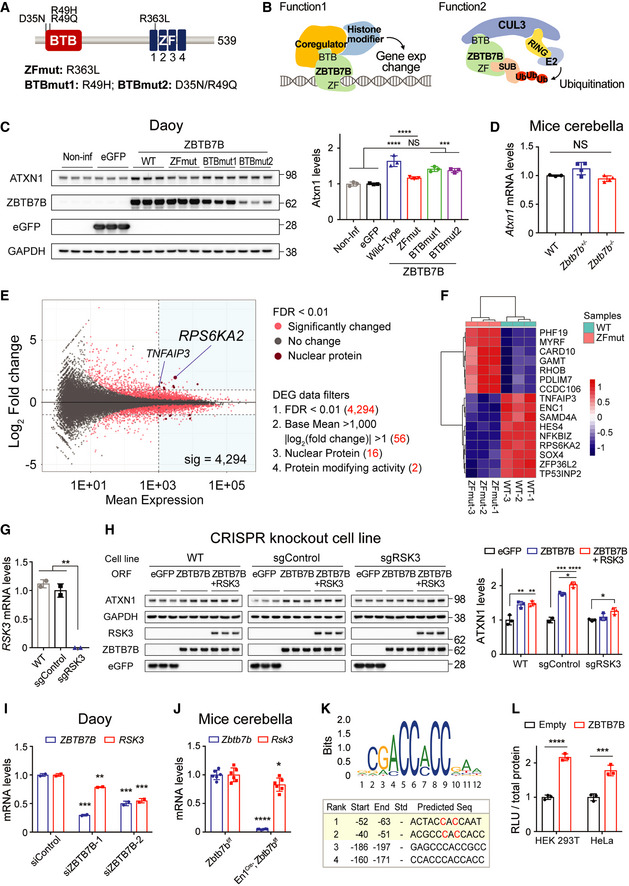
- ZBTB7B’s domain structure marked with the mutations in BTB and ZF domain used in this study.
- Two representative biological functions of ZBTB7B: (1) changing target gene expression; (2) recruiting target proteins for ubiquitination. CUL3: Cullin3, E2: ubiquitin‐conjugating enzyme, SUB: substrate.
- Western blot analysis of ATXN1 levels after overexpression of ZBTB7B wild‐type (WT), zinc‐finger domain mutant (ZFmut), or BTB domain mutants (BTBmut1 and BTBmut2) (n = 3).
- qRT–PCR results of Atxn1 mRNA levels in the cerebella of wild‐type (n = 3), Zbtb7b +/− (n = 4), and Zbtb7b −/− mice (n = 4).
- MA plot (M: log ratio; A: mean average) of the differentially expressed genes (DEG) analysis from RNA‐seq samples of the cells overexpressing either WT or ZFmut ZBTB7B. Four filters and the number of genes kept after applying each filter are described. Two genes that passed the 4th filter are labeled.
- Expression heatmap of the 16 genes that passed the 3rd filter. Color scale: row z‐score.
- qRT–PCR results of RSK3 mRNA levels across different CRISPR knockout cell lines (n = 2).
- Epistatic relationship between ZBTB7B and RSK3 in terms of ATXN1 regulation. ATXN1 levels were measured after overexpression of ZBTB7B in the RSK3 knockout cell line (sgRSK3) and control cell lines (WT and sgControl) (n = 3). ZBTB7B + RSK3: co‐overexpression of both ZBTB7B and RSK3.
- qRT–PCR results of RSK3 mRNA levels after knockdown of ZBTB7B in Daoy cells (n = 2).
- qRT–PCR results of Rsk3 mRNA levels in the cerebella of Zbtb7b conditional knockout mice (n = 6).
- Position frequency matrix of ZBTB7B binding DNA sequence and a table of the predicted ZBTB7B binding sites on human RSK3 promoter. Start and End position numbers are described based on TSS. The seventy base pairs upstream RSK3 promotor includes top two potential binding sites and was used for luciferase assays. C: mutated into A in Fig EV2D.
- Luciferase assay result of RSK3 promoter in HEK 293T and HeLa cells transfected with either an empty or ZBTB7B expressing vector (n = 3).
Data information: (C, D) Mean ± SD, ***P < 0.001, ****P < 0.0001, one‐way ANOVA. (G–I) Mean ± SD, *P < 0.05, **P < 0.01, ***P < 0.001, ****P < 0.0001, one‐way ANOVA. (J, L) Mean ± SD, *P < 0.05, ***P < 0.001, ****P < 0.0001, two‐tailed t‐test.
Source data are available online for this figure.
To test whether RSK3 is epistatic to ZBTB7B in ATXN1 regulation, we knocked out RSK3 in Daoy cells and measured ATXN1 levels upon overexpressing ZBTB7B in this cell line. CRISPR‐mediated deletion of RSK3 exon3 induced a frameshift mutation, and qRT–PCR confirmed the absence of RSK3 expression in these cells (Fig 2G). In contrast to the control cells, RSK3 knockout cells failed to increase ATXN1 levels in the presence of ZBTB7B overexpression and only showed the increase when the RSK3 expression was restored (Fig 2H). Consistent with these results, knockdown of the Drosophila RSK3 homolog S6kII partially suppressed the eye degeneration observed upon co‐expression of human mutant ATXN1(82Q) and ZBTB7B in the eyes (Fig EV2B), suggesting that ZBTB7B regulates ATXN1 indirectly by regulating RSK3 expression.
We also confirmed that knockdown of ZBTB7B decreased RSK3 mRNA in Daoy cells, and a conditional knockout of Zbtb7b significantly decreased Rsk3 mRNA in the mouse cerebella (Fig 2I and J). To locate the putative ZBTB7B binding sites on RSK3 promoter, we obtained human ZBTB7B binding motif and scanned its binding sites in human RSK3 promoter using the JASPAR 2018 website (http://jaspar.genereg.net/) (Khan et al, 2018) (Fig 2K). There are four putative ZBTB7B binding sites within the 200 bp upstream from the RSK3 transcription start site (TSS). Among these four, the top two ZBTB7B binding sites are located next to each other in the region within the 70 bp upstream from TSS. Given this, we used the 70 bp sequence in a luciferase reporter assay to test the transcriptional regulation of the RSK3 promoter by ZBTB7B. Overexpression of ZBTB7B increased luciferase activity 2.2‐ and 1.8‐fold in HEK293T and HeLa cells, respectively (Fig 2L), which was dependent on ZF domain, as the overexpression of ZFmut failed to increase the luciferase activity despite being expressed at higher levels than wild‐type ZBTB7B (Fig EV2C). Mutating either one of the two putative ZBTB7B binding sequences in the RSK3 promoter significantly lowered the luciferase activity, and mutating both of them together additively reduced the activity in both HEK293T and HeLa cells (Fig EV2D). Altogether, these data suggest that ZBTB7B regulates RSK3 mRNA via binding and activating the RSK3 promoter.
RSK3 regulates ATXN1 by phosphorylating S776
To test whether RSK3 regulates ATXN1 protein levels, we knocked down or overexpressed RSK3 in Daoy cells and monitored ATXN1 levels. Knockdown of RSK3 significantly decreased ATXN1 whereas overexpression of RSK3 increased ATXN1, although not as high as the increase observed with ZBTB7B overexpression (Fig 3A and B). Importantly, RSK’s ability to regulate ATXN1 was dependent on its kinase activity, as the ATXN1 levels in the Daoy cells expressing ATXN1(82Q) were increased only with the overexpression of wild‐type RSK3, but not with the catalytically inactive RSK3 K91A/K44A (Bjorbaek et al, 1995) (Fig 3C).
Figure 3. RSK3 regulates ATXN1 by phosphorylating S776.
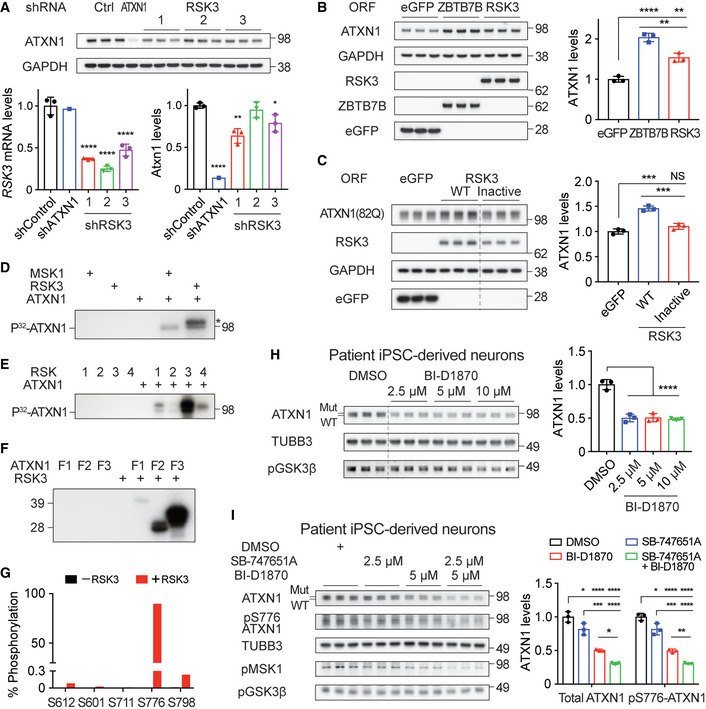
- Western blot analysis of ATXN1 after knockdown of RSK3 in Daoy cells. Bottom left panel: qRT–PCR results of RSK3 mRNA. Bottom right panel: densitometry of the western blot image in the top panel (n = 3 except for shATXN1 where n = 1).
- Western blot analysis of ATXN1 after overexpression of RSK3, ZBTB7B, or eGFP in Daoy cells (n = 3).
- Western blot analysis of ATXN1(82Q) after overexpression of either wild‐type or inactive RSK3 in Daoy cells expressing ATXN1(82Q) (n = 3).
- In vitro kinase assay of RSK3 with ATXN1. MSK1 was used as a positive control. Asterisk: auto‐phosphorylated RSK3.
- In vitro kinase assay of four different RSK members with ATXN1.
- In vitro kinase assay of RSK3 with N‐terminal (F1), middle (F2), and C‐terminal fragment (F3) of ATXN1.
- Mass spectrometry analysis of phosphorylated residues in ATXN1 F3 after in vitro kinase assay with RSK3.
- Western blot analysis of ATXN1 after a treatment with RSK3 inhibitor (BI‐D1870) on SCA1 patient iPSC‐derived neurons (n = 3).
- Western blot analysis of total and phospho‐S776 ATXN1 after a co‐treatment with MSK1 (SB‐747651A) and RSK3 inhibitor (BI‐D1870) on SCA1 patient iPSC‐derived neurons (n = 3).
Data information: RSK3 antibody used in (B, C) is only suitable for detecting overexpressed RSK3 but not for endogenous RSK3. (A–C) Mean ± SD, *P < 0.05, **P < 0.01, ***P < 0.001, ****P < 0.0001, one‐way ANOVA. (H, I) Mean ± SD, *P < 0.05, **P < 0.01, ***P < 0.001, ****P < 0.0001, one‐way ANOVA.
Source data are available online for this figure.
We next examined if RSK3 can phosphorylate ATXN1 by performing in vitro kinase assays with recombinant RSK3 and wild‐type ATXN1(30Q). MSK1 was used as a positive control kinase because it has been previously shown to phosphorylate ATXN1 at S776 (Park et al, 2013). We found that RSK3 phosphorylated ATXN1 at a similar level to MSK1 (Fig 3D). Notably, across all four RSK paralogs (RSK1‐4), only RSK3 was able to strongly phosphorylate ATXN1 (Fig 3E). To locate where RSK3 phosphorylates ATXN1, we fragmented ATXN1 into three parts (N‐terminal, middle, and C‐terminal—see Materials and Methods for details), and performed the kinase assay using the fragments. We found that the C‐terminal fragment was predominantly phosphorylated (Fig 3F). Mass spectrometry analysis of this fragment revealed that RSK3 phosphorylates ATXN1 mainly at S776 whose phosphorylation is well‐known to stabilize ATXN1 by mediating interaction with 14‐3‐3 (Chen et al, 2003) (Fig 3G).
To test whether inhibition of RSK3’s catalytic activity can decrease ATXN1 in SCA1 patient cells, we differentiated induced pluripotent stem cells (iPSCs) from an SCA1 patient into neurons (Rousseaux et al, 2018a), and titrated an RSK‐specific inhibitor BI‐D1870 (Sapkota et al, 2007). The differentiated neurons were positively stained with a neuronal marker MAP2, and most of them were characterized as VGLUT1‐positive excitatory neurons (Fig EV3A). Treatment with BI‐D1870 dramatically reduced both wild‐type and mutant ATXN1 protein levels in the neurons at a dose of 2.5 μM, that failed to completely block the phosphorylation of RSK’s known substrate GSK3β [pGSK3β, Ser9 (Nemoto et al, 2000; Carriere et al, 2008) (Fig 3H)]. At a lower concentration of 500 nM, BI‐D1870 could still significantly decrease the ATXN1 levels together with the active phospho‐RSK3 [pRSK3, Thr356/Ser360 (Carriere et al, 2008)] in the neurons (Fig EV3B). These results suggest that the partial inhibition of RSK3 activity could decrease ATXN1 protein levels. Combinatorial treatment of the patient iPSC‐derived neurons with both RSK3 and MSK1 inhibitors had an additive effect on decreasing both total and phospho‐S776 ATXN1 (pS776 ATXN1) at concentrations where pGSK3β and the active phospho‐MSK1 [pMSK1, Ser376 (Arthur, 2008)] levels were not drastically decreased (Fig 3I). Taken together, we found that RSK3 regulates ATXN1 by phosphorylating S776, and RSK3 and MSK1 additively regulate ATXN1 by phosphorylating the same site. These data establish a convergent mechanism for ATXN1 regulation by two distinct kinases.
Reducing RSK3 rescues behavioral phenotypes in SCA1 animal models by decreasing ATXN1
To test whether RSK3 regulates ATXN1 in vivo, we first used SCA1 Drosophila models which express human mutant ATXN1(82Q) in the eyes (Fernandez‐Funez et al, 2000) or in the central nervous system (CNS) (Al‐Ramahi et al, 2007). To express the ATXN1(82Q) transgenes in Drosophila, we used the GAL4/UAS system because expression levels can be modulated with temperature of the fruit fly cultures: high expression of the transgene at 29°C and moderate expression at 25°C. Knockdown of S6kII (also known as CG17596), the Drosophila homolog of RSK3, decreased ATXN1(82Q) protein, but not mRNA levels, and ameliorated the ATXN1(82Q)‐induced eye phenotype observed at 29°C (Figs 4A, and EV3C and D). Moderate expression of either ATXN1(82Q) or S6KII at 25°C induced mild phenotypes in the Drosophila eye, but their co‐expression in the same condition led to a severe eye degeneration at a comparable degree to the eye expressing ATXN1(82Q) at 29°C. In addition, knockdown of the S6kII significantly ameliorated motor impairments induced by expression of ATXN1(82Q) specifically in the CNS (Fig 4B). We next used a SCA1 mouse model which has the polyQ expansion knocked into the endogenous locus Atxn1 (Atxn1154Q) to replace one wild‐type allele (Atxn12Q) (Watase et al, 2002). Both Atxn12Q and Atxn1154Q can be detected by Western blot, but the signal from Atxn1154Q is much weaker than Atxn12Q due to lower solubility. This animal model faithfully replicates both cerebellum‐derived (motor incoordination and cerebellar atrophy) and brainstem‐related (breathing difficulties and premature death) deficits of SCA1 (Zoghbi & Orr, 1995; Orengo et al, 2018). Notably, we found that the Rsk3 protein levels increased in both cerebella and brainstem of SCA1 mice, the two mainly affected regions in SCA1, compared to the wild‐type mice (Fig 5D). To test whether knockdown of Rsk3 decreases Atxn1 in the SCA1 mice, we delivered an adeno‐associated virus serotype 9 (AAV9) carrying shRsk3 into the cerebella of adult SCA1 mice by stereotaxic injection. The virus infected almost the entire cerebellum, reducing Rsk3 levels to one third of the levels in control mice (Fig 4C and D). These mice showed that both wild‐type (2Q) and mutant (154Q) Atxn1 protein levels decreased without changes in the Atxn1 mRNA levels (Figs 4D and EV3E). We also measured Atxn1 levels in the brain of the SCA1 mice with Rsk3 heterozygous knockout (Atxn1154Q / 2Q; Rsk3 +/−). The mice showed decrease of both wild‐type and polyQ‐expanded Atxn1 proteins not only in the cerebella but also in the brainstem without changing Atxn1 mRNA levels (Figs 4E and EV3F). Decrease of cerebellar Atxn1 in SCA1 mice was reported to rescue motor performances in many studies (Jafar‐Nejad et al, 2011; Park et al, 2013; Friedrich et al, 2018). To confirm this in our study, we next compared the motor performance of Atxn1154Q / 2Q; Rsk3 +/− mice with that of Atxn1154Q / 2Q mice by rotarod assay, and confirmed that Atxn1154Q / 2Q; Rsk3 +/− improved the motor performances moderately but significantly at 11–12 weeks old (Fig 4F). Collectively, these data suggest that RSK3 regulates ATXN1 levels in vivo in the SCA1 animal models, and that reducing RSK3 in these animals can rescue ATXN1‐driven disease phenotypes by decreasing ATXN1 protein levels.
Figure 4. Reducing RSK3 rescues behavioral phenotypes in SCA1 animal models by decreasing ATXN1.
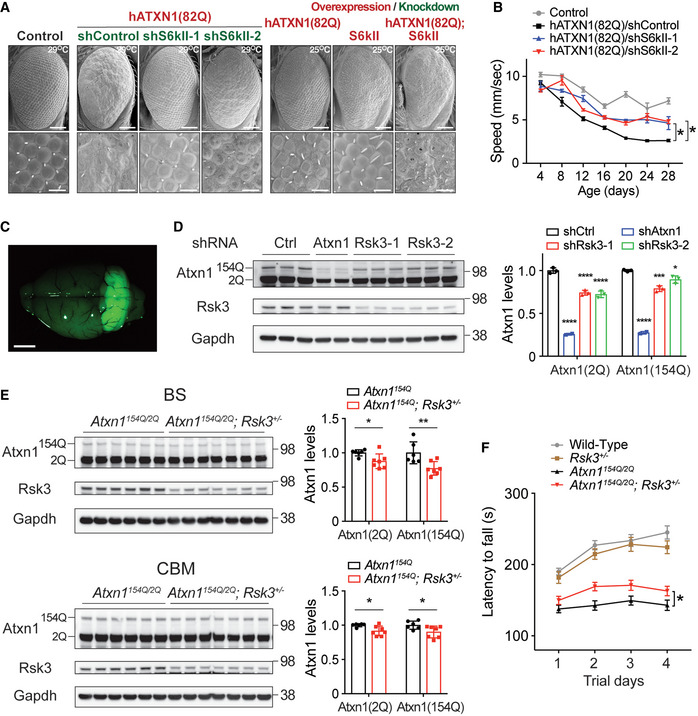
- Images of Drosophila eyes expressing human ATXN1(82Q) with either knockdown or overexpression of the Drosophila RSK3 homolog Sk6II. Scale bar: 100 μm (top) and 20 μm (bottom).
- Improvement of motor performance by the knockdown of Sk6II in Drosophila SCA1 model expressing ATXN1(82Q) in the central nervous system. Mean ± SEM, *P < 0.05, Linear mixed‐effect model ANOVA, n = 10/genotype, four times of measurements.
- A representative image of a mouse brain 4 weeks after AAV injection of shRsk3 into 12‐week‐old SCA1 mice (Atxn1154Q / 2Q) cerebellum. Scale bar: 2 mm.
- Western blot analysis of wild‐type (2Q) and mutant Atxn1 (154Q) in the cerebella of 16‐week‐old SCA1 mice dissected 4 weeks after the stereotaxic injection of AAV9 harboring shControl (n = 3), shRsk3 (n = 3), or shAtxn1 (n = 2). Mean ± SD, *P < 0.05, ***P < 0.001, ****P < 0.0001, one‐way ANOVA.
- Western blot analysis of wild‐type (2Q) and mutant Atxn1 (154Q) in the brainstem (BS) and cerebella (CBM) of 8‐week‐old Atxn1154Q / 2Q (n = 6) and Atxn1154Q / 2Q; Rsk3 +/− mice (n = 7). Mean ± SD, *P < 0.05, **P < 0.01, two‐tailed t‐test.
- Rotarod motor performance test result of Atxn1154Q / 2Q; Rsk3 +/− mice at 11–12 weeks old. Mean ± SEM, *P < 0.05, two‐way ANOVA, n = 35, 31, 34, 38 for WT, Rsk3 +/−, Atxn1154Q / 2Q, Atxn1154Q / 2Q; Rsk3 +/− genotype, respectively.
Source data are available online for this figure.
Figure 5. Differential expression of RSK3 and MSK1 in mouse and human brains.
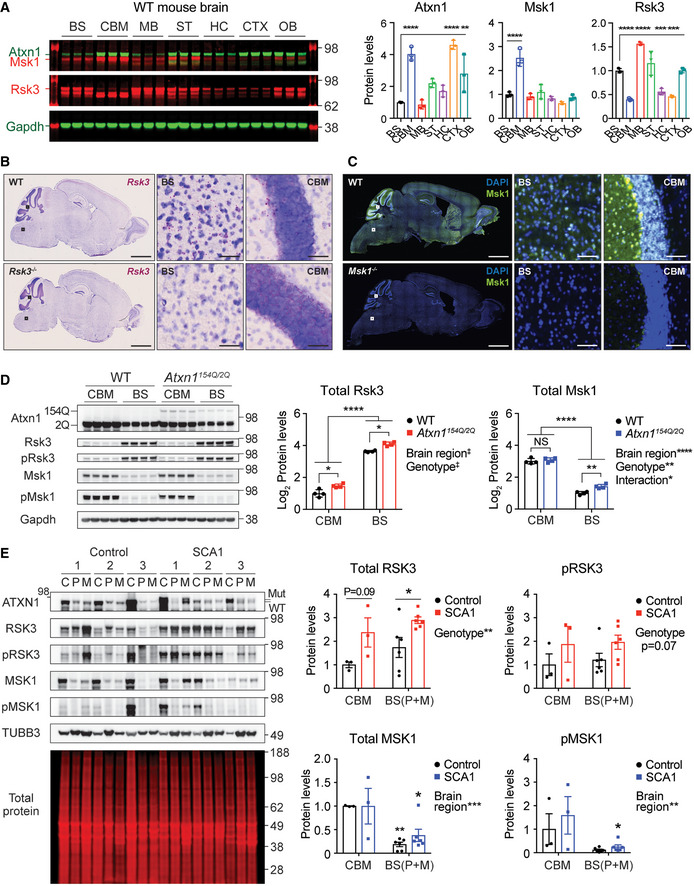
- Fluorescent Western blot analysis of Atxn1, Msk1, and Rsk3 in seven different brain regions of wild‐type mice at 9 weeks old (n = 3). Each protein levels were represented relative to the protein levels in brainstem. Mean ± SD, **P < 0.01, ***P < 0.001, ****P < 0.0001, one‐way ANOVA.
- Representative BaseScope assay images of Rsk3 in the whole‐brain sagittal sections of wild‐type (top) and Rsk3 −/− mice (bottom) at 5–6 weeks old. The areas within the black squares are magnified in the right panels in each genotype. Scale bar = 2 mm in whole brain images; 50 μm in the magnified images.
- Representative IF images of Msk1 in the whole brain sagittal sections of wild‐type (top) and Msk1 −/− mice (bottom) at 6 months old. The areas within the white squares are magnified in the right panels in each genotype. Scale bar = 2 mm in whole brain images; 50 μm in the magnified images.
- Western blot analysis of total and active form of Rsk3 and Msk1 in the cerebella and brainstem of 12‐week‐old WT and SCA1 mice (n = 4). Relative Rsk3 and Msk1 levels were represented into log2 scale. The protein levels of the two kinases are significantly different between the two brain regions. Mean ± SD, *P < 0.05, **P < 0.01, ****P < 0.0001, two‐way ANOVA.
- Western blot analysis of ATXN1, RSK3, pRSK3, MSK1, and pMSK1 in the postmortem cerebella, pons, and medulla oblongata of human controls and SCA1 patients (n = 3 per genotype). Total protein was used for normalization, and protein levels are represented relative to cerebellar protein levels in control group. C: Cerebellum, P: Pons, M: medulla oblongata. Values from P and M are combined and presented in BS. Mean ± SEM, *P < 0.05, **P < 0.01, two‐way ANOVA, n = 3 (CBM) and 6 (BS).
Data information: BS: brainstem, CBM: cerebellum, MB: midbrain, ST: striatum, HC: hippocampus, CTX: cortex, OB: olfactory bulbs.
Source data are available online for this figure.
RSK3 and MSK1 are differentially expressed across brain regions in mice and humans
Although RSK3 has a convergent function with MSK1 in regulating ATXN1, Rsk3 is the only one of the two to modulate Atxn1 levels in the brainstem. To gain insight into what drives this, we investigated whether the two kinases are differentially expressed across different brain regions including brainstem, using Western blot analysis in wild‐type mouse brain (Fig 5A). While Msk1 is predominantly expressed in the cerebellum, Rsk3 expression is enriched in several brain regions including brainstem. This distinct expression pattern of the two kinases in multiple brain areas was also confirmed at the cellular level; Rsk3 mRNA was labeled using BaseScope assay and Msk1 protein was stained by immunofluorescence (Figs 5B and C, and EV4A and B). Importantly, Rsk3 and Msk1 show a sharp contrast in their expression in cerebellum and brainstem, the two main regions that degenerate in SCA1. While Rsk3 is enriched in the brainstem, Msk1 is predominantly expressed in the cerebellum. Specifically, the total and active form of Rsk3 (pRsk3) were enriched over 6.1‐ and 4.6‐fold in the brainstem compared to in the cerebellum, respectively, whereas the total and pMsk1 were enriched over 3.1‐ and 16.7‐fold in the cerebellum compared to the brainstem, respectively, in both wild‐type and SCA1 mice (Figs 5D and EV5A). We also investigated this regional difference in expression levels of the two kinases in the cerebellum and brainstem (pons and medulla oblongata) of human control and SCA1 patient brains (Fig 5E). While MSK1 expression is significantly lower in the brainstem than in the cerebellum, RSK3 expression tends to be higher in the brainstem than in the cerebellum. Notably, RSK3 protein levels are significantly increased in the SCA1 patients’ brainstem, suggesting that inhibition of RSK3 might prove helpful for lowering ATXN1 levels. Our RNA‐seq data of wild‐type mouse brains and the RNA‐seq data of postmortem human brains from (Webb et al, 2015) also support the differential expression of RSK3 and MSK1 in the two regions (Fig EV5B and C). Moreover, by comparing the expression of the two kinases in the same brain region, we found that RSK3 has a greater expression than MSK1 in the brainstem, whereas MSK1 has a similar or greater expression compared to RSK3 in the cerebellum. Altogether, these data suggest that RSK3 and MSK1 might differentially regulate ATXN1 in the brainstem and cerebellum, respectively.
Rsk3 and Msk1 regulate Atxn1 levels differentially in the brainstem and cerebella of SCA1 mice
To test whether Rsk3 and Msk1 regulate Atxn1 differentially in the brainstem and cerebella of SCA1 mice, we bred the animals with single or double heterozygous knockout of the two kinases in SCA1 background (Atxn1154Q / 2Q), and compared their biochemical, behavioral, physiological, and histological phenotypes side by side across the different genotypes. We found that the brainstem of Atxn1154Q / 2Q; Rsk3 +/− mice showed a greater decrease of both total and pS776 wild‐type (2Q) and mutant (154Q) Atxn1 levels than Atxn1154Q / 2Q; Msk1 +/− mice without changing Atxn1 mRNA levels (Figs 6A and EV6A). Similar to SCA1 patients, SCA1 mice develop brainstem‐driven breathing difficulties at the later stage of the disease. Despite higher breathing frequency, these mice have a smaller total ventilation in a given amount of time (lower minute ventilation) due to shallow breathing (smaller tidal volume) compared to wild‐type mice, which contributes to premature death. Consistent with the different regional effects of the two kinases in regulating Atxn1 protein levels, our plethysmography data revealed that Atxn1154Q / 2Q; Rsk3 +/− mice showed moderate rescue of breathing phenotype at 34 weeks old displaying greater minute ventilation mainly due to the increase of tidal volume, whereas Atxn1154Q / 2Q; Msk1 +/− mice did not show a rescue (Figs 6B and EV6B). Diverse groups of brainstem neurons drive and control breathing; these include rhythmogenic complexes [PreBötzinger complex (PreBötC) and Bötzinger complex (BötC)], motor and premotor nuclei that control diaphragm and upper airway musculature [cranial nerve XII (hypoglossal nucleus), XI, X, and parabrachial nuclei], and chemosensory nuclei that regulate breathing frequency (retrotrapezoid nucleus and Raphé) (Smith et al, 2013). To investigate whether Rsk3 is expressed in the PreBötC and BötC, Atoh1Cre /+ ; Rosalsl‐tdTomato / lsl‐tdTomato mouse was used for locating the two complexes, as they are surrounded by Atoh1 positive [lateral reticular nucleus (LRN) and nucleus ambiguus (AMB)] and negative neurons [facial nerve (VII)] (Huang et al, 2012). Using this mouse, we confirmed that RSK3 is expressed in the PreBötC and BötC (Fig EV6C). Rsk3 is also expressed in the hypoglossal nucleus in the mouse brainstem (Fig EV6D) and in human Raphé nuclei (Fig EV5C), suggesting that reducing Rsk3 could rescue breathing phenotypes by decreasing Atxn1 levels in these area.
Figure 6. Differential effect of Rsk3 and Msk1 on Atxn1 regulation and disease phenotypes in SCA1 mice brainstem.
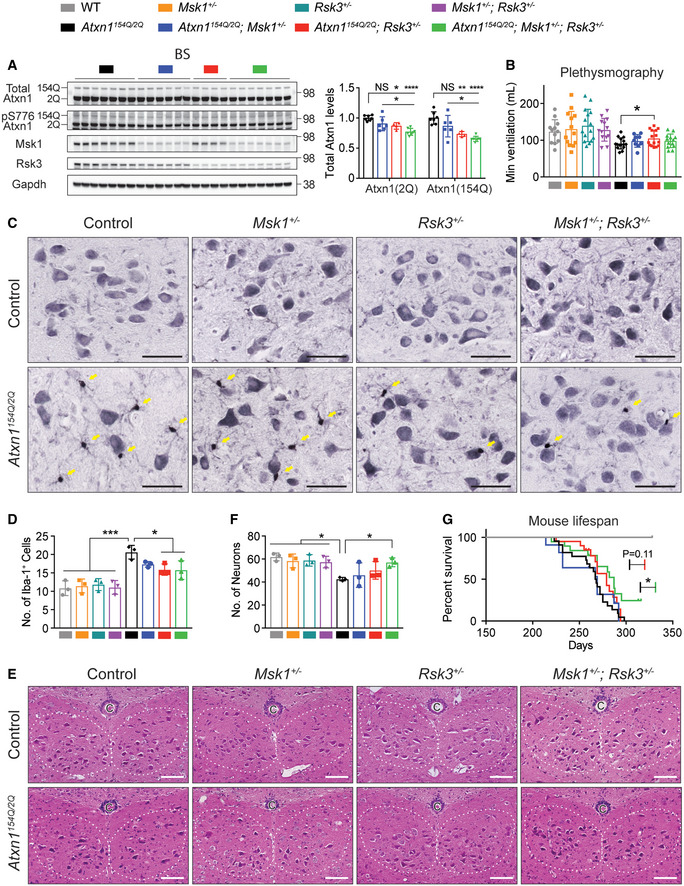
- Western blot analysis of total and pS776 wild‐type and mutant Atxn1 in the brainstem of 8‐week‐old SCA1 mice with heterozygous knockout of either one or both kinases. Mean ± SD, *P < 0.05, **P < 0.01, ****P < 0.0001, one‐way ANOVA, n = 7, 6, 4, 7 following the order of genotypes in the Western blot, respectively.
- Plethysmography data measuring breathing ability (total ventilated gas volume per minute) of 34‐week‐old mice with different genotypes. Mean ± SD, *P < 0.05, two‐tailed t‐test, n = 12, 13, 15, 13, 15, 9, 15, 13 following the order of genotypes in the graph, respectively.
- Representative immunohistochemistry images of Iba1+ reactive microglia in the coronally sectioned hypoglossal nucleus of 36‐week‐old mice with different genotypes. Yellow arrows indicate Iba1+ microglia, and larger pyramidal shaped cells are motoneurons. scale bar = 50 μm.
- Quantification of the number of Iba1+ cells shown in (C). Mean ± SD, *P < 0.05, ***P < 0.001, one‐way ANOVA, n = 3 mice per genotype, each dot is an averaged measurement from six sections per mouse.
- Representative Hematoxylin and Eosin stained motoneurons in the coronally sectioned hypoglossal nucleus (white dashed line) of 36‐week‐old mice with different genotypes. The motoneurons are dark purple with pyramidal shape within the nucleus. C: central canal. Scale bar = 100 μm.
- Quantification of the number of motoneurons shown in (E). Mean ± SD, *P < 0.05, one‐way ANOVA, n = 3 mice per genotype, each dot is an averaged measurement from six sections per mouse.
- Kaplan–Meier survival graphs of SCA1 mice with heterozygous knockout of either one or both kinases. The data of Msk1 +/−, Rsk3 +/−, and Msk1 +/− ; Rsk3 +/− mice overlap those of wild‐type mice. *P < 0.05, Gehan‐Breslow‐Wilcoxon test, n = 15, 15, 12, 13, 22, 11, 20, 19 following the order of genotypes in the legend on top of the figure, respectively.
Source data are available online for this figure.
In addition to breathing deficits, swallowing difficulty contributes to premature death in SCA1 patients, partially due to the degeneration of hypoglossal nucleus that controls tongue movement. In line with the Rsk3 expression in the hypoglossal nucleus (Fig EV6D), Atxn1154Q / 2Q; Rsk3 +/− mice showed a decreased number of Iba1+ reactive microglia in the hypoglossal nucleus, whereas Atxn1154Q / 2Q; Msk1 +/− mice did not (Fig 6C and D).
When it comes to a cerebellar phenotype, however, Atxn1154Q / 2Q; Msk1 +/− mice showed a decrease of Atxn1 levels without changing Atxn1 mRNA levels (Figs 7A and EV6A). We stained cerebellar molecular layer with anti‐Calbindin1 antibody and measured the thickness of the layer between the lobule V and VI across the different genotypes (Fig EV6E). While SCA1 mice (Atxn1154Q / 2Q) have thinner molecular layers than wild‐type mice due to Purkinje cell atrophy, Atxn1154Q / 2Q; Msk1 +/− mice recovered molecular layer thickness to a greater extent than Atxn1154Q / 2Q; Rsk3 +/− mice (Fig 7C and D). Taking advantage of reducing these two kinases together, Atxn1154Q / 2Q; Rsk3 +/− ; Msk1 +/− mice effectively decreased both total and pS776 wild‐type and mutant Atxn1 levels in the brainstem as well as in the cerebellum (Figs 6A and 7A).
Figure 7. Differential effect of Rsk3 and Msk1 on Atxn1 regulation and disease phenotypes in SCA1 mice cerebella.
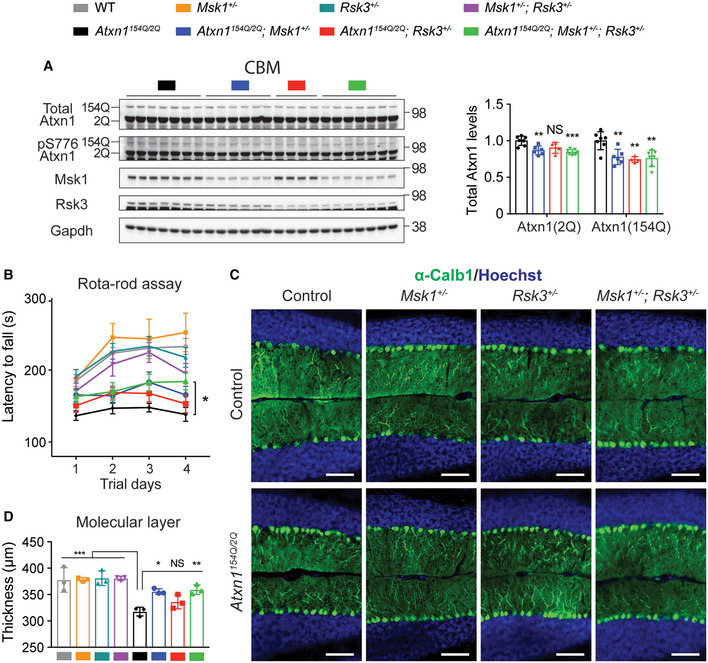
- Western blot analysis of total and pS776 wild‐type and mutant Atxn1 in the cerebella of 8‐week‐old SCA1 mice with heterozygous knockout of either one or both kinases. Mean ± SD, **P < 0.01, ***P < 0.001, one‐way ANOVA, n = 7, 6, 4, 7 following the order of genotypes in the Western blot, respectively.
- Rotarod motor performance test result of 11‐ to 12‐week‐old SCA1 mice with heterozygous knockout of either one or both kinases. Mean ± SEM, *P < 0.05, two‐way ANOVA, n = 18, 12, 13, 11, 19, 13, 15, 13 following the order of genotypes in the legend on top of the figure, respectively.
- Representative immunofluorescent (IF) images of cerebellar molecular layer between the cerebellum lobule V and VI across different genotypes at 36 weeks old, stained with anti‐Calbindin 1 antibody. Scale bar = 100 μm.
- Quantification of the thickness of top and bottom molecular layers shown in (C). Mean ± SD, *P < 0.05, **P < 0.01, ***P < 0.001, one‐way ANOVA, n = 3 mice per genotype, each dot is an averaged measurement from three sections per mouse.
Source data are available online for this figure.
Consistent with the protein levels, double heterozygotes significantly rescued the loss of neurons and reactive microgliosis in the hypoglossal nucleus, and delayed brainstem‐derived premature death of SCA1 mice by 3 weeks (7.7% of the median lifespan) (Fig 6C–G). In addition, the double heterozygotes significantly improved cerebellar motor performance together with the recovery of molecular layer thickness (Fig 7B–D). Of note, they also showed an enhancement of rescuing SCA1 phenotypes in each brain region compared to single heterozygote, as Atxn1154Q / 2Q; Rsk3 +/− ; Msk1 +/− mice rescued loss of hypoglossal motoneurons, extended lifespan, and improved motor performance to a greater degree than Atxn1154Q / 2Q; Rsk3 +/− and Atxn1154Q / 2Q; Msk1 +/− mice did, respectively.
Collectively, our results demonstrate that Atxn1 S776 phosphorylation and levels in the brainstem are modulated by Rsk3, whereas in the cerebellum they are predominantly modulated by Msk1. These data suggest that a combinatorial approach to simultaneously target both kinases could increase therapeutic efficacy in SCA1 by ameliorating symptoms derived from the two affected brain regions.
Discussion
Selective vulnerability of brain regions is a hallmark of multiple neurodegenerative diseases. In SCA1, the accumulation of mutant ATXN1 is the root cause of selective degenerating neurons in the cerebellum and brainstem. Although reducing toxic ATXN1 levels has therapeutic potential (Jafar‐Nejad et al, 2011; Park et al, 2013), lowering ATXN1 in the brainstem remains a challenge as the benefits from current disease modifiers has been limited to the cerebellum. Here, we use an unbiased shRNA screen and uncovered regulators that can modulate ATXN1 protein levels in a brain region‐specific manner and potentially contribute to the selective vulnerability of two degenerating brain regions in SCA1. We identified two paralogs of BTB‐ZF transcription factors, ZBTB7A and ZBTB7B, that additively regulate Atxn1 in mouse brain. Focusing on the more potent ATXN1 regulator from the two, our transcriptomic and genetic approaches found that ZBTB7B regulates ATXN1 indirectly by activating RSK3 transcription. We show that RSK3 phosphorylates ATXN1 mainly on S776, which is a residue critical for regulating ATXN1 stability and is also phosphorylated by MSK1. RSKs and MSKs are related kinases as they both have similar kinase domains, share a RXXS consensus sequence on their target proteins, and act downstream of the MAPK pathway (Hauge & Frodin, 2006; Cargnello & Roux, 2011). However, we found that the two kinases are disproportionally responsible for Atxn1 regulation in different brain regions in line with their differential expression in the brainstem and cerebellum observed in mice and humans. Rsk3 is the main kinase regulating ATXN1 levels in the brainstem where it is expressed in the hypoglossal nucleus, respiratory centers, and Raphé nuclei. In contrast, Msk1 is the predominant regulator in the cerebellum. Finally, we demonstrate that reducing each kinase modulates Atxn1 levels and primarily rescues behavioral deficits attributed to the brain region in SCA1 mice where their function for Atxn1 regulation is dominant. These data define a convergent mechanism for two distinct kinases in different degenerating brain regions, as well as provide a proof‐of‐concept for achieving symptomatic rescue in SCA1 when regional regulators of toxic protein levels are targeted (Fig 8).
Figure 8. Summary diagram for the differential expression of RSK3 and MSK1 in the SCA1‐affected brain regions.
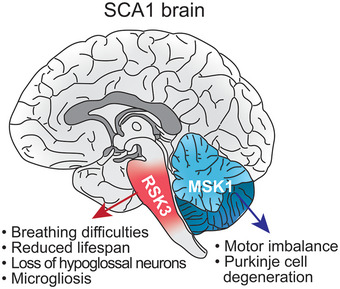
RSK3 is predominantly expressed in the brainstem where it increases ATXN1 levels and leads to brainstem deficits such as breathing difficulties, premature death, neuronal loss and microgliosis in the hypoglossal nucleus. In contrast, MSK1 predominantly regulates ATXN1 in the cerebellum, resulting in cerebellar motor incoordination and Purkinje cell degeneration.
ZBTB7A and ZBTB7B are widely expressed in the human brain (Uhlen et al, 2015), but their impact on neurodegeneration has not been reported. Although ZBTB7A and ZBTB7B share common functions (Widom et al, 2001; Vacchio et al, 2014; Carpenter et al, 2017), bind to similar DNA sequences (Wang et al, 2012; Khan et al, 2018), and both regulate ATXN1, our data suggest that their roles are not completely redundant as Zbtb7a and Zbtb7b additively regulate Atxn1, and Zbtb7a cannot replace Zbtb7b’s role in regulating Atxn1. Interestingly, they have one‐way compensatory relationship where loss of Zbtb7a induces compensatory increase of Zbtb7b and not vice versa. This relationship, together with the greater effect size on Atxn1, makes Zbtb7b a more potent Atxn1 regulator. We found that ZBTB7B regulates ATXN1 indirectly by activating RSK3 transcription. This transcriptional activation is dependent on the ZF domain of ZBTB7B and its regulatory elements in the RSK3 promoter, revealing for the first time a relationship between a BTB‐ZF transcription factor and RSK3 gene expression.
Here, we reported Rsk3 as a new regulator of ATXN1. RSKs have not received much attention for the regulation of ATXN1, partly because RSK1 and RSK2, the two most studied RSKs, do not phosphorylate ATXN1 (Park et al, 2013). However, the previous work did not extensively evaluate RSK’s contribution to regulating brain ATXN1 levels because the study did not include RSK3 which we now know has much higher expression levels across brain regions, including brainstem, than other RSK members (Zeniou et al, 2002). Our data illuminate the importance of RSK3 in regulating ATXN1 levels especially in the brainstem. The protein levels of Rsk3 were elevated in the brainstems of SCA1 mice and human patients compared with controls (Fig 5D and E), and decreasing Atxn1 by reducing Rsk3 improves the brainstem‐related phenotype (Fig 6A–D). Rsk3 moderately regulates Atxn1 in the mouse cerebellum where it has lower expression than Msk1. However, considering that RSK3 is expressed as high as MSK1 in the human cerebellum (Fig EV5C), RSK3 may play a more important role in regulating ATXN1 in the human cerebellum. Moreover, pharmacological inhibition of RSK3 dramatically decreases ATXN1 in SCA1 patient‐derived neurons. RSK3’s known substrates include GSK3β, PP1G, and c‐Fos (Bjorbaek et al, 1995; Nemoto et al, 2000), and it is noteworthy that the decrease of ATXN1 in neurons was observed at a low dose that preserve the phosphorylation of GSK3β. The molecular mechanism by which RSK3 regulates ATXN1 is the phosphorylation of ATXN1 at S776 to a comparable level as MSK1. This convergent function, but differential effect of the two kinases in two vulnerable brain regions suggests that targeting both to modulate complementary signaling pathways may yield more therapeutic benefit than targeting only one of the two (Posch et al, 2013; Tolcher et al, 2018). Indeed, co‐application of RSK3 and MSK1 inhibitors showed an additive effect in decreasing both total and pS776‐ATXN1 in SCA1 patient‐derived neurons (Fig 3I), and reducing both kinases enhanced the beneficial effects in the brainstem and cerebella of SCA1 mice.
Current drug targets for SCA1 show isolated effect on cerebellar phenotypes through regulation of Atxn1 levels. For example, reducing Msk1 or Nlk rescues cerebellar phenotypes, and pharmacological inhibition of PAKs decreases cerebellar Atxn1 levels in SCA1 mice (Ju et al, 2013; Park et al, 2013; Bondar et al, 2018). Investigating the therapeutic potential of Rsk3, which regulates Atxn1 in the brainstem, revealed expanded benefits of inhibiting Rsk3 in vivo. Knockdown of Drosophila homolog of RSK3 in flies reduces ATXN1(82Q) protein levels concomitant with phenotypic rescue of eye degeneration. In mice heterozygous for either Rsk3 or Msk1, we see predominant reduction of Atxn1 (WT and mutant) and behavioral rescue in the region where they dominantly regulate Atxn1 levels. Atxn1154Q / 2Q; Rsk3 +/− mice show preferential reduction of toxic Atxn1 in the brainstem and rescue of breathing difficulties and reactive microgliosis in the hypoglossal nucleus with minor improvements of motor dysfunction. This rescue of brainstem deficits is closely related to local Rsk3 expression, as Rsk3 is expressed in the breathing center nuclei and hypoglossal nucleus. We note that the rescue of brainstem deficits is partial, probably, in part due to the severity of the mutation (154 CAG repeats, with the largest in humans being 82), and in part because other mechanisms beyond S776 might contribute to toxicity. In contrast, Atxn1154Q / 2Q; Msk1 +/− mice show more pronounced rescue of cerebellar molecular layer thickness and motor dysfunction. Merging the effects of the two kinases, the mice heterozygous for both kinases show rescue of deficits in both affected brain regions demonstrating expanded therapeutic potential.
Ultimately, our data demonstrate that the mechanisms regulating levels of a toxic protein in a neurodegenerative disorder can be region‐specific, and therefore in part, contribute to selective vulnerability. These concepts may be applicable to other neurodegenerative disorders. Namely, selective vulnerability could be driven in part by the differential regulation of toxic protein levels across brain regions. If this is the case, we may need to target multiple selective regulators to achieve full rescue of degeneration and disease symptoms.
Materials and Methods
Forward genetic screen
We used the reporter Daoy cell line harboring the same transgene described in Park et al (2013) (a bicistronic transgene encoding polyQ‐expanded ATXN1 fused to RFP followed by an independently translated YFP), but lacking a puromycin resistance gene. The cells were cultured in DMEM with 10% FBS and 1× Pen/Strep. The reporter cells were transduced in 150‐mm dishes with retroviruses containing shRNAs against 858 genes involved in ubiquitin signaling (Rousseaux et al, 2018b) at an MOI of 0.3 to ensure a single copy integration and give 1,000× representation of each shRNA in the pool. Twenty‐four hours after transduction, the transduced cells were subject to puromycin selection (1 μg/ml) for 3 days, and then cultured for 6 more days. On the following day, the cells were sorted on a Sony SH800 sorter using a 100‐μm sorting chip. The live single cells with the 5% highest or 5% lowest RFP/YFP ratio were collected to obtain 100× representation of shRNAs, spun down at 4,000 g for 10 min at 4°C, and frozen until library preparation. All of these above steps were biologically quadruplicated. For preparing library, genomic DNA (gDNA) was extracted from the sorted cells using the Blood and Tissue DNeasy Blood and Tissue Kit (QIAGEN, 69506). Virally integrated shRNAs were amplified from gDNA using Q5 Hot Start High‐Fidelity 2× Master Mix (NEB, M0494L) supplemented with 2% DMSO and 1 mM MgCl2, with the FORamp and REVamp primer (Table EV4). The 360 bp amplicon was purified via Pippin Prep (Sage Science) and further processed to create next‐generation sequencing libraries using the Nextera XT DNA Library Prep kit (Illumina). After sequencing the libraries on a HiSeq 2500 (Illumina), FastQC (https://www.bioinformatics.babraham.ac.uk/projects/fastqc/) was used to check for sequencing quality. Reads with low sequencing quality were trimmed using an in‐house Python script. A stripped Smith‐Waterman alignment algorithm (Zhao et al, 2013) was used to identify candidate reads containing unique shRNA identification sequences. Principal component analysis was used to detect outliers in the samples. Read counts for each shRNA were computed using an in‐house C program (Dataset EV1) and then normalized by the trimmed mean of M‐values normalization method of edgeR (Robinson & Oshlack, 2010) (Dataset EV2). To identify shRNAs enriched or depleted relative to bulk samples, we applied a generalized linear model with negative binomial link function to test for statistical significance (McCarthy et al, 2012) (Dataset EV2). Batch effects were adjusted by adding a batch variable in the regression model. After applying the linear model to each shRNA, we defined the five statistics for every gene: P avg (geometric mean of P‐values of shRNAs which target the gene), log2FCavg (average of log of fold‐changes of the shRNAs), representation ratio (average number of shRNAs represented in bulk samples divided by the number of shRNAs represented in library), hit ratio (the number of shRNAs whose P values are less than 0.05 divided by average number of shRNAs represented in bulk samples), and conflict (the number of shRNAs whose sign of log2FC opposite to log2FCavg). We initially defined sets of top enriched and depleted hits based on P avg cutoff of 0.05. To reduce false positive, we performed additional filtering using the following criteria: (i) genes with a representation ratio greater than or equal to 0.6, (ii) genes whose conflict statistics were zero, and (iii) genes whose log2FCavg were higher than 2, and (iv) genes with a hit ratio of enriched shRNAs higher than 0.25. After these filtering, we identified 39 genes as suppressors and 13 genes as enhancers in our screen.
Culturing human neurons
SCA1 patient‐derived iPSCs were induced into Neural Progenitor Cells (NPCs) as described in Rousseaux et al (2018a) NPCs were maintained and plated in Neural Proliferation Medium [NPM, DMEM/F12:Neurobasal (1:1) supplemented with 0.5× B27, 0.5× N2, 2 mM Glutamax, 20 ng/ml FGF2, and 20 ng/ml EGF]. Two million NPCs were seeded in Cultrex‐coated T75 flask with Neural Induction Medium [NIM, DMEM/F12:Neurobasal (1:1) supplemented with 1× B27, 1× N2, and 2 mM Glutamax] supplemented with 20 ng/ml FGF2. Three days later, the cells were incubated in NIM without FGF2 for 4 more days and differentiated in Neural Differentiation Medium (NDM, Neurobasal with 1× B27, 2 mM Glutamax, 20 ng/ml BDNF, 10 ng/ml GDNF, 10 ng/ml NT‐3, 100 µM db‐cAMP, and 200 µM ascorbic acid) for 14 days, with full exchange of the media every 2 days. A flask of differentiated neurons was passaged with trypsin into two Cultrex‐coated 24‐well plates. Three days later, the neurons were treated with BI‐D1870 (Selleckchem, S2843) and/or SB‐747651A (Tocris, #4630) in fresh media and incubated for 3 days, and lysed for Western blot analysis.
Immunostaining of human neurons
Twenty thousand NPCs were seeded in each well of Cultrex‐coated Millicell EZ Slide 8‐well glass (EMD Millipore, PEZGS0816). The NPCs were differentiated into neurons for 3 weeks as described above. Neurons were fixed with 4% PFA at RT for 10 min and permeabilized with 0.3% PBST at RT for 15 min. Cells were then blocked with 2% NGS in 0.3% PBST for 1 h and incubated with chicken anti‐MAP2 (Abcam, ab5392, 1:1,000), mouse anti‐VGLUT1 (Sigma Aldrich, AMAB91041, 1:200), or rabbit anti‐GABA antibody (Sigma Aldrich, A2052, 1:200) in blocking solution at RT for 2 h. After incubating with secondary antibodies conjugated with fluorophore (Invitrogen, A‐21449, A‐21424, A‐11008, 1:500) in blocking solution at RT for 1 h, cells were counterstained with DAPI for 5 min. Cells were mounted on a slide glass and observed under a Nikon Eclipse Ti2‐E confocal microscopy equipped with DS‐Ri2 camera.
Culturing mouse cerebellar granule neurons
Ten to twenty cerebella of wild‐type P4–P7 pups were dissected and incubated at 37°C for 10 min in DMEM supplemented with 1× Pen/Strep and 0.025% trypsin. Cells were dissociated by syringing five times with 10‐ml syringe fitted with 22G1/2 needle and DNAseI was added to the 250 µg/ml of final concentration, followed by another incubation at 37°C for 10 min. The media of dissociated cells were serially changed into HBSS with high BSA (0.8% BSA, 0.6% glucose), HBSS with low BSA (0.2% BSA, 0.6% glucose), and finally CGN medium [Neurobasal medium supplemented with B27, Insulin/transferring/selenite (1×), Sodium pyruvate (1×), 0.45% glucose, 2 mM glutamine, Linoleic acid/albumin (1×), 16 μg/ml of N‐acetyl‐cysteine, Non‐essential amino acids (1×), Pen/Strep (1×), 25 mM KCl] by spinning down cells at 270 g for 10 min in RT, aspirating old media and resuspending them in new media. Three million cells in CGN medium were seeded in each Poly‐l‐lysine‐coated 12 well plates. Viruses were transduced 4 h after seeding, and a half volume of media was changed to fresh media every other day for 11 days.
Lentivirus production and infection
HEK293T cells were transfected with lentiviral plasmids (W118‐1 and pLX304 for overexpression, and pGIPZ and pZIP UltramiR for shRNA expression) and helper plasmids (pMD2.G and psPAX2) using TransIT®‐293 transfection reagent (Mirus Bio LLC). Next day, transfection media was changed to fresh growth media [DMEM, 10% FBS and 1× Antibiotic‐Antimycotic (AA)] and cells were further incubated for 2 more days. The media was collected and filtered by 0.45‐μm polyethersulfone filter, and viruses were concentrated by Lenti‐X concentrator (Takara Bio Inc.) following the manufacturer’s protocol. For transducing cells, the concentrated virus was simply added into media with an MOI of 5–10 for overexpression, and 10–40 for knockdown. After transduction, Daoy cells and CGNs were incubated for 72 h and 11 days, respectively.
Drosophila methods
The UAS‐ATXN1(82Q) lines were previously described (Fernandez‐Funez et al, 2000). Human ZBTB7A and ZBTB7B cDNA were cloned into pUAST‐attb, and transgenic flies were generated by injecting plasmids into embryos harboring the VK37 attP docking site and PhiC31 integrase. The nervous system driver line, nrv2‐GAL4, the eye driver line, GMR‐GAL4, the inducible shRNA line, 51694 targeting CG17596 (also known as S6kII, Drosophila homolog of RSK3), and the UAS‐CG17596 overexpression line, 8714, were obtained from the Bloomington Drosophila Stock Center (BDSC). The inducible shRNA line, 101451, targeting CG17596 was obtained from the Vienna Drosophila Stock Center. For the Drosophila motor performance assay, we used an automated data acquisition system as previously described (Rousseaux et al, 2018b). Vials were tapped at 7‐s intervals, and video files were recorded for the duration of the experiment. Files were processed using a custom software that calculates the average speed of the animals in each vial. Ten virgin females were used per replicate and at least four replicates per genotype were tested. Animals were crossed and raised at the temperatures indicated in the eye image panels, and were transferred daily into new vials containing fresh media. The external eyes were imaged using scanning electron microscopy as previously described (Fernandez‐Funez et al, 2000). For statistical analysis, we performed linear mixed‐effect model ANOVA across the indicated genotypes using four replicates per genotype.
RNA‐seq
All of the experiments were biologically triplicated. Daoy cells were transduced with lentivirus with an MOI of 15 and incubated for 72 h. Total RNA was extracted from the cells using Aurum™ Total RNA Fatty and Fibrous Tissue kit (Bio‐Rad), and 2 μg of total RNA was used to prepare sequencing libraries by using NEBNext® Ultra™ RNA Library Prep Kit for Illumina® (NEB), following the manufacturer’s protocol. The produced libraries were sequenced by Illumina HiSeq 4000 (Illumina) and more than 35 million pairs of 150 bp pair‐end reads were generated per sample. These raw reads were first groomed by trimming adapter sequences with Cutadap (Martin, 2011). Trimmed reads were then aligned to the Mus musculus genome (GRCh38, GENCODE, version24) using TopHat v2.0.9 (Kim et al, 2013) with default parameters (‐r 200 –p 8). The mappability for all six samples was average at 71%. To convert the aligned sequence reads into expression levels for differential gene analysis, we employed the free Python program HTSeq (Anders et al, 2015). The htseq‐count function of HTSeq allowed us to accumulate the number of aligned reads that fall under the exons of the gene (union of all the exons of the gene). Read counts obtained were analogous to the expression level of the gene. Using the obtained read counts, differential gene analysis was carried out using the DESeq2 package in the R environment. DESeq2 included functions that allowed us to normalize the read counts of multiple samples across different experimental groups by using the negative binomial distribution and a shrinkage estimator for the distribution’s variance (Love et al, 2014). Specifically, each gene was tested to check whether its expression level in the cells overexpressing wild‐type ZBTB7B was different from that of the cells overexpressing ZF mutant ZBTB7B (control). The statistical significance of the observed changes was reported by the false discovery rate (FDR), which are the P‐values adjusted for multiple testing with the Benjamini‐Hochberg procedure. A gene was identified as significantly changed if it changed by at least two‐fold and fell under the FDR of 1%. To find potential ZBTB7B targets which regulate ATXN1 directly, we applied additional criteria: (i) genes whose base mean was higher than 1,000, (ii) genes encoding proteins localized in nucleus, and (iii) genes encoding proteins which have protein modifying activity. After these filters, we identified two genes including RPS6KA2. The correlation heatmap of samples in Fig EV2A showed the pair‐wise Pearson’s correlation coefficient of samples computed on the regularized log‐transformed expression from DESeq2. It was plotted using the pheatmap function (https://cran.r‐project.org/package=pheatmap) in R environment.
Expression data for RPS6KA2 (RSK3) and RPS6KA5 (MSK1) in the human brainstem Raphé nuclei and cerebellum from GSE68559 (Webb et al, 2015) were downloaded from Gen Expression Omnibus (GEO). The Fragments Per Kilobase of transcript per Million mapped reads (FPKM) values of each transcript were first converted to Transcripts per Million mapped reads (TPM). TPM values of multiple transcripts of the same gene were summed up to compute the final expression for each gene used in the following analysis.
To quantify the expression levels of Rps6ka2 (Rsk3) and Rps6ka5 (Msk1) in the mouse brainstem and cerebellum, the raw reads from four samples of each brain region were aligned to the mouse reference genome mm10 using STAR 2.5.3a (Dobin et al, 2013). Whole‐genome FASTA sequence and annotations of respective mm10 genome build were downloaded from the UCSC genome browser portal. Sample‐wise alignments were saved as coordinate sorted binary format (BAM) files. Expression levels of Rps6ka2 and Rps6ka5 were quantified as TPM using TPMCalculator (Vera Alvarez et al, 2019).
Protein extraction and Western blot
To prepare mouse brain tissue lysates, 1 and 0.6 ml of cold lysis buffer (0.5% Triton X‐100, 50 mM Tris–HCl [pH 7.4], 150 mM NaCl) were added for a half of cerebellum and half of brainstem, respectively. The tissue was homogenized by syringing using an 1‐ml syringe first fitted with a 22G needle, and then with a 27G needle. Proteins from fly heads were extracted by immersing 25–30 fly heads in 100 μl of the lysis buffer and grinding the heads with pellet pestle. To extract proteins from the cells cultured in a plate, culturing media was aspirated, and the lysis buffer was added onto cells. The cells were then scraped, and the lysate was transferred into a new tube. These lysates were incubated for 10 min on ice and spun down at the maximum speed at 4°C for 15 min. After transferring the supernatant into a new test tube, loading samples were made by mixing the same amount of protein from each lysate with lysis buffer and NuPAGE™ LDS Sample Buffer. The mixture was incubated at 95°C for 10 min and cooled down at RT. To prepare human brain tissue lysates, 20 μl of cold urea lysis buffer (8 M urea, 1% IGEPAL CA‐630, 20 mM DTT) was added per mg tissue. The tissue was homogenized by syringing with 22G and 27G needles and was further lysed using a sonicator (Branson Sonifier 450, Branson) with output 2, duty cycle 30%, seven pulses at RT, twice with a 10‐min interval. After adding sample buffer and boiling for 10 min, the mixture was cooled down at RT and sonicated again. These protein samples were loaded onto NuPAGE 4–12% Bis‐Tris protein gel (Invitrogen), transferred to a nitrocellulose membrane (0.2 µm) with 1× Tris‐Glycine transfer buffer with 20% methanol. Total protein was stained for the Western blot of human brain tissue lysates using the Revert™ 700 total protein stain kits (LI‐COR, P/N 926), following the manufacturer’s protocol. The membrane was blocked with 5% skim milk in TBST and incubated with primary antibody in 3% BSA in TBST for overnight at 4°C. Primary antibodies used in this study are as follows: endogenous RSK3 (Abcam, ab32563), overexpressed RSK3 (Bethyl Laboratories, A304‐244A), pRSK3 (Cell Signaling Technology, #9348), MSK1 (R&D Systems, AF2518), pMSK1 (Cell Signaling Technology, #9591), pGSK3α/β (Cell Signaling Technology, #9331S), ZBTB7A (Bethyl Laboratories, A300‐548A), ZBTB7B (Cell Signaling Technology, #13205S), GAPDH (Advanced ImmunoChemical Inc, MAb 6C5), GFP (GeneTex, GTX26556), ATXN1 (in house, 11750 and 534), pS776 ATXN1 (in house, PN1248), tGFP (OriGene, TA150041), fly Actin (Thermo Scientific, ICN691001), and β3‐TUB (Sigma Aldrich, T8578). After washing the membrane with TBST, secondary antibodies conjugated with either HRP or fluorophore were applied for 1 h at RT in 5% skim milk in TBST for chemiluminescence, and 3% BSA in TBST for fluorescence. After washing the membrane again with TBST, the blot for chemiluminescence was applied with ECL (GE Healthcare, RPN2236) and imaged by ImageQuant LAS 4000 imager (GE Healthcare). The blot for fluorescence was scanned by Odyssey® CLx imager (LI‐COR).
Reverse transcription and qRT–PCR
RNA from tissue and cells was extracted by TRIzol® reagent (Invitrogen) and RNeasy Kit (Qiagen), respectively, and 150–3,000 ng of total RNA was reverse‐transcribed by SuperScript® III First‐strand Synthesis kit (Invitrogen), following the manufacturer’s protocol. For qPCR, 10–20 ng of cDNA was mixed with SYBR reagent, exon spanning primers, and water in a total volume of 20 μl, and the samples were run in C1000™ Thermal Cycler (Bio‐Rad). Relative gene expression was calculated by regular ΔΔC t method, where GAPDH and/or ACTB were used as reference genes.
siRNA transfection into Daoy cells
Daoy cells were plated in 12‐well plates [(20K cells in 1 ml of growth media (DMEM, 10% FBS)/well] and incubated for 20 h. Each siRNA was transfected to a final concentration of 20 nM using Dharmafect reagent (Horizon Discovery), following the manufacturer’s protocol. Briefly, 0.8 μl of Dharmafect was added to 50 μl of DMEM and incubated for 5 min. The solution was mixed with 50 μl of DMEM with 440 nM siRNA, and incubated for 20 min. The 100 μl of transfection mixture was added to each well, and the transfected cells were incubated for 72 h.
Generating knockout cells using CRISPR
Single guide RNAs targeting upstream and downstream of exon3 of RPS6KA2 were designed using the http://crispr.mit.edu/ website, and negative control gRNA was obtained from the Human Brunello CRISPR knockout pooled library (Doench et al, 2016). These sgRNAs were cloned into pLentiCRISPR V2 vector (addgene, 52961) and transfected into Daoy cells by using Lipofectamine LTX with a modified protocol. Briefly, Daoy cells were seeded in 6‐well plates with low serum media (DMEM, 5% FBS, 1× AA), and next day, the cells were washed with PBS. After the PBS was aspirated, transfection mixture (200 μl) was added dropwise directly on top of the cells and incubated for 5 min at RT, followed by adding 1 ml of low serum media. After 4 h, the media was changed to growth media (DMEM, 10% FBS, 1× AA), and cells were further incubated for 24 h and then selected with puromycin (1 μg/ml) for 3 days. The survived cells were expanded and sorted into single cells in 96‐well plates using BD FACSAria II (BD Biosciences). After allowing each cell to expand to an individual colony, each colony was split into two 96‐well plates, with one plate being used for genotyping. Genomic DNA was extracted by treating cells with 50 mM NaOH at 95°C for 10 min, and neutralized with 1 M Tris (pH 7.5). RSK3up_F and RSK3down_R primers were used for genotyping PCR (Table EV4).
Luciferase assay
The sequence 70 base pairs upstream of RSK3 TSS was cloned into pGL4.10 luciferase reporter vector (Promega), and point mutations were generated on the tentative ZBTB7B binding sites. Wild‐type and ZF mutant ZBTB7B were cloned into pcDNA3.1+/N‐DYK vector. HeLa (100K cells/well) and HEK293T (150K cells/well) cells were seeded in 24‐well plates, and next day, 200 ng of pcDNA vector and 100 ng of the luciferase reporter vector were co‐transfected into the cells using Lipofectamine™ 2000 (Invitrogen) according to the manufacturer’s protocol. Transfected cells were incubated for 24 h, and luciferase assay was performed by using Dual‐Luciferase® Reporter Assay System (Promega) following the manufacturer’s protocol except that the luciferase activity was normalized by total amount of protein measured by BCA assay instead of the second luciferase activity. The luciferase activity was measured with TD‐20/20 Luminometer (Turner Design).
Producing ATXN1(30Q) and fragmented ATXN1 in Escherichia coli
Human wild‐type ATXN1(30Q) or fragmented ATXN1 (F1: 1‐336, F2: 337‐562, F3: 563–815 amino acids of ATXN1) was cloned into pET‐28a(+)‐TEV vector. The vector was transformed into One Shot™ BL21(DE3) Chemically Competent E. coli (Invitrogen) and grew in 1 l of LB medium supplemented with Kanamycin (50 µg/ml) until the OD600 value reached 0.5. The cells were induced with 0.2% l‐arabinose and 0.5 mM IPTG for 4 h at 37°C while shaking and spun down. The cells were resuspended in 15 ml of bacterial lysis buffer (6 M urea, 20 mM 2‐mercaptoethanol, 0.5 M NaCl, 30 mM Imidazole and 50 mM NaPO4, [pH 7.4]) and lysed using a sonicator (Branson Sonifier 450, Branson) with output 3, duty cycle 30%, 15 pulses on ice, five times with 4‐min interval, followed by syringing five times for shearing DNAs. After adding Triton X‐100 to a final concentration of 1%, the lysates were incubated for 1 h at 4°C while rotating and spun down for 1 h at 6,000 g in 4°C. The supernatant was loaded onto Ni Sepharose High Performance beads (GE Healthcare, 17‐5268‐02) and passed through the column with gravity flow, a process which was performed three times. The beads were washed with bacterial lysis buffer for five times and eluted with the lysis buffer supplemented with 300 mM imidazole.
In vitro kinase assay
In a test tube, 150 ng of RSK3 (Signalchem, R16‐10G) or MSK1 (Signalchem, R19‐10G) was mixed with 1 μg of whole or fragmented ATXN1 in a kinase reaction buffer (25 mM MOPS [pH 7.2], 25 mM MgCl2, 5 mM EGTA, 2 mM EDTA, 0.1 mg/ml BSA). Cold and hot (γ‐32P) ATP were added to a final concentration of 1 μM and 0.13 μM (12 μCi), respectively, and the reaction mixture was incubated at 30°C for 1 h. The reaction was stopped by adding NuPAGE LDS sample buffer and reducing agent and boiled for 15 min. The samples were loaded and run on a NuPAGE 4–12% Bis‐Tris Gel, and exposed to an X‐ray film for 1 h. For the samples used in mass spectrometry, only cold ATP was used.
LC‐MS/MS analysis
The target band from SDS–PAGE gel was excised and processed for in‐gel digestion using trypsin (GenDepot, T9600) and chymotrypsin (Promega, V1061) separately. The peptides were resuspended in 10 μl of loading solution (5% methanol containing 0.1% formic acid) and subjected to nanoflow LC‐MS/MS analysis using a nano‐LC 1200 system (Thermo Scientific) coupled to Orbitrap Fusion™ Lumos (Thermo Scientific) mass spectrometer. The peptides were loaded onto a Reprosil‐Pur Basic C18 (1.9 µm, Dr. Maisch GmbH, Germany) precolumn of 2 cm × 100 µm size. The precolumn was switched in‐line with an in‐housed 5 cm × 150 µm analytical column packed with Reprosil‐Pur Basic C18 equilibrated in 0.1% formic acid/water. The peptides were eluted using a 45‐min discontinuous gradient of 5–28% acetonitrile/0.1% formic acid at a flow rate of 750 nl/min. The eluted peptides were directly electro‐sprayed into the mass spectrometer. The instrument was operated in the data‐dependent mode acquiring fragmentation under direct control of Xcalibur software (Thermo Scientific). Precursor MS spectrum was scanned at 300–1,400 m/z with 120,000 resolution by Orbitrap followed by collision‐induced dissociation (CID) fragmentation in the ion trap with 20 s of dynamic exclusion time. The raw file from MS was searched via Mascot 2.4 (Matrix Science) in Proteome Discoverer 1.4 interface (Thermo Scientific). Variable modification of oxidation on methionine, phosphorylation on serine, threonine, and tyrosine, and acetylation on protein N‐terminal were allowed. The precursor mass tolerance was confined within 20 ppm with a fragment mass tolerance of 0.5 Da and a maximum of two missed cleavages was allowed. The peptides identified from the mascot result file were validated with 5% FDR. The total MS1 area intensity for quantification was calculated using Skyline software (MacCoss lab, Univ. of Washington) as described previously (Dharmat et al, 2018). The phosphorylated sites and the degree of phosphorylation of ATXN1 protein were manually validated and quantified.
Postmortem human brain tissues
All experiments using postmortem human tissues were performed following the protocol (H‐1020) approved by Institutional Review Board (IRB) at Baylor College of Medicine (BCM). Frozen cerebella, pons, and medulla oblongata from three control subjects and three SCA1 patients were obtained from the Michigan Brain Bank and University of Florida (UF), respectively, following protocols of each institution approved by respective research ethics board. The authorization of retention for SCA1 brain tissues and protection of donor‐subjects anonymity was approved and assured by the IRB at University of Michigan (UM) and UF.
Mouse work
All experiments performed with mice followed the animal protocol approved by the IACUC at Baylor College of Medicine. All mice were housed with 12 h light and 12 h dark cycle at RT, and were provided with water and standard rodent diet ad libitum. Atxn1154Q / 2Q, Rsk3 +/− , Msk1 +/− , Zbtb7a +/− , Zbtb7b +/− , Zbtb7bflox / flox, and En1Cre mice were previously described (Watase et al, 2002; Maeda et al, 2007; Wang et al, 2008a; Li et al, 2013; Park et al, 2013; Rousseaux et al, 2018a). All these mice were maintained on a C57BL/6 background and genotyped by standardized procedures using the primers listed in Table EV4.
Measuring mouse motor performance, breathing phenotype, and life span
Rotarod assay and plethysmography were performed as previously described (Watase et al, 2002; Orengo et al, 2018; van der Heijden & Zoghbi, 2018). For rotarod assay, 11‐ to 12‐week‐old mice were put on a rod which accelerates from 4 to 40 rpm in rotating speed during the first 5 min, and stays at 40 rpm for the next 5 min. The amount of time it takes for each mouse to fall from the rod was measured. Four trials were performed per day for 4 days. For plethysmography, 34‐week‐old mice were housed in a chamber for 90 min and the breathing record for the last 30 min was used for analyzing the tidal volume, breathing rate, and minute gas exchange, using a custom MATLAB software (van der Heijden & Zoghbi, 2018). For measuring life span, mice were housed until they met the endpoint (inability to move) in animal protocol.
Immunostaining of Msk1 and measuring cerebellar molecular layer thickness
Deeply anesthetized mice were perfused with PBS followed by 4% PFA in PBS. Isolated brain tissues were post‐fixed with 4% PFA in PBS for 48 h at 4°C, followed by 15% and then 30% sucrose in PBS for cryoprotection. The brain tissues were then embedded in Tissue‐tek OCT compounds (Sakura, #4583) and sagittally sectioned with 30 μm thickness around the midline of the brain and freely floated in PBS for staining. The floating cryosections were blocked with 5% NDS for staining Msk1 and 10% NGS for staining Calbindin in 0.2% Triton X‐100 for an hour at RT. Goat anti‐Msk1 (R&D Systems, AF2518, 1:200) and mouse anti‐Calbindin antibody (Swant, McAB300, 1:600) were added into the blocking buffer and incubated for 24 h at 4°C with gentle shaking. After three times of wash with PBS, the sections were then incubated with anti‐mouse secondary antibody conjugated with Alexa Fluor 488 (Invitrogen, A11055 and A11029, 1:500) for 24 h at 4°C with gentle shaking. The stained sections were washed with PBS, counterstained with Hoechst for 5 min, and mounted on a slide with Vectashield antifading mounting media (Vector Laboratories, H‐1000). Fluorescence imaging of the tissues was performed on a Nikon Eclipse Ti2‐E confocal microscopy. The whole brain or cerebellum image of each stained section was obtained using a tile‐scanning function, and the thickness of the two molecular layers between the lobule V and VI were measured using an ImageJ software (Fiji, version 2.0.0‐rc‐69/1.52p).
BaseScope assay of Rsk3
BaseScope assay was performed using BaseScope™ Detection Reagent Kit v2 (Advanced Cell Diagnostics, #323900), following manufacturer’s protocol with some modifications. Brain tissues were quickly isolated from wild‐type (5–6 weeks old), Rsk3 −/− (5–6 weeks old), and Atoh1Cre /+ ; Rosalsl‐tdTomato mice (8 weeks old). These tissues were embedded into OCT compounds, sectioned with 20 μm thickness, and placed onto slides. For Atoh1Cre /+; Rosalsl‐tdTomato mouse brain sections, fluorescence images were taken by using a Nikon Eclipse Ti2‐E confocal microscopy equipped with DS‐Ri2 camera before proceeding with the assay. The sections are fixed with 4% PFA in 1× PBS for 30 min at RT, dehydrated, dried at RT, and treated with protease III (included in the kits) at 37°C for 1 h. Rsk3 BaseScope probe [1ZZ, targeting 322–366 of Rps6ka2 mRNA (NCBI accession: NM_011299.4)] and control probes [1ZZ Ppib and 1ZZ DapB probes in Control Probe Pack (Advanced Cell Diagnostics, #322976)] were then hybridized for 3 h, and signal were amplified from step 1 to 8, with step 1, 6, 7, and 8 being prolonged into twice of the time in the protocol. After signal development, counterstain was done with 20% Hematoxylin + solution (Fisher Scientific, 220‐100) for 7 sec, and the samples were dried and mounted using VectaMount® Mounting Medium (Vector Laboratories, H‐5000). Brightfield images were taken using a Nikon Eclipse Ti2‐E microscopy.
H&E Stain and immunohistochemistry
Perfused mouse brain tissues were post‐fixed with 4% PFA in PBS for 48 h at 4°C, dehydrated, and embedded in paraffin wax. Embedded tissue block was coronally sectioned with 6 μm thickness and mounted onto slides. For H&E stain, the sections were rehydrated and immersed in Hematoxylin + and Eosin Y solution (Fisher Scientific, 314–631), followed by dehydration. IHC of Iba1 was performed using the Vectastain® Elite ABC‐HRP Kit (Vector Laboratories, PK‐6101) following the manufacturer’s protocol with minor modifications. After deparaffinization and rehydration, citrate‐based solution (10 mM Na3C6H5O7·2H2O, 0.05% Tween‐20, pH 6.0) was used for unmasking antigen at 95°C for 9 min, and endogenous peroxidase activity was quenched with 3% H2O2 in water for 5 min at RT. Rabbit anti‐Iba1 antibody (Wako Chemicals, 019‐19741, 1:200) were added into the blocking buffer and incubated for overnight at 4°C. The slides were developed using Vector® DAB substrate (Vector Laboratories, SK‐4100) for 4 min and dehydrated. These dehydrated H&E and IHC sections were mounted using Cytoseal™ XYL mounting media (Thermo Scientific), and brightfield images were taken using a Nikon Eclipse Ti2‐E microscopy. The number of motoneurons and Iba1+ cells was counted using an ImageJ software.
AAV production
AAV9 virus was produced by transfecting 80 μg of pAAV‐CBA‐YFP‐miR‐E, AAV9 packaging, and AAV helper plasmids into four confluent 15‐cm plates of HEK293T cells using TransIT®‐293 transfection reagent. Next day, the transfection media was replaced with fresh complete media (DMEM, 10% FBS, 1× AA), and cells were further incubated for 48 h. Then, cells were scraped, transferred into 50 ml tubes, and spun down for 15 min at 1,500 g. Virus in the media (supernatant) was concentrated by adding PEG solution (40% PEG, 2.5 M NaCl) making a final concentration of 8%, and spinning down at 3,700 g for 30 min at 4°C. The pellet was resuspended in 1 ml of PBS‐MK buffer (1× PBS, 1 mM MgCl2, 2.5 mM KCl). Virus on the pellet was collected by resuspending the pellet in 5 ml of freezing buffer (0.15 M NaCl; 50 mM Tris, pH 8.0) and disrupting the cells through two cycles of freezing and thawing. After second thawing, 500 U of benzonase (Millipore, 70664) was added and the cell lysate was incubated at 37°C for 30 min. Disrupted cell pellets were spun down for 20 min at 3,700 g, and the supernatant was merged with the virus derived from media and slowly loaded onto iodixanol gradient (60, 40, 25, 15% gradient from the bottom) in an OptiSeal polypropylene tube (Beckman Coulter, 361625). After ultracentrifugation at 184,000 g for 3 h and 20 min, the tube was punctured with 18 g needle and the 40% iodixanol layer was collected. This liquid was mixed with 10 ml of PBS‐MK buffer (1× PBS, 1 mM MgCl2, 2.5 mM KCl), loaded on centrifugal filters with 100 kDa molecular weight cutoff (Millipore, UFC910024), and spun down until the filtered‐in volume was less than 200 µl. This step was repeated one more time and virus titer was measured by regular qPCR, with standard line generated from C t values of serially diluted pAAV‐CBA‐YFP‐miR‐E plasmids.
Stereotaxic injection of AAV into cerebellum
Twelve‐week‐old mice were anesthetized with isoflurane, and their heads were fixed in stereotaxic frame. The skin of mice heads was disinfected and incised to expose the skull. To target the entire cerebellum, four spots (left, right, middle anterior, and middle posterior) above cerebellum were marked with a sterile pen and were drilled with a microdrill. Six microliters of AAV (120 billion genome copies) was loaded into 10‐μl Hamilton syringe fitted with 32G needle, and 1.5 μl of the virus was injected into each spot at a 0.15 μl/min flow rate. Three coordinates (x: ML, y: AP, z: DV) for each spot were derived based on bregma (for x and y) and brain surface (for z), and written in millimeter unit: left/right (−/+1.75, −6.2, −2.1), middle anterior (0, −6.2, −1.4), and middle posterior (0, −6.8, −1.4). After injection, the needle was slowly withdrawn 0.2 mm upward and held for 5 min, allowing the virus to be distributed, and then completely removed from the brain. The incision was sutured and the mouse was rehydrated and monitored until it became ambulatory. The operated mice were dissected 4 weeks after injection for experiments.
Statistical analysis
Two‐tailed Student’s t‐test and one‐way or two‐way ANOVA were performed using GraphPad Prism 7 software. Post‐hoc analysis was performed either by Tukey’s tests (comparing every mean with every other mean), or Dunnett’s tests (comparing every mean to a control mean) unless otherwise specified. All center values and error bars are mean and standard deviation (SD), respectively, unless otherwise specified. Statistical significances were marked as follows: *P < 0.05, **P < 0.01, ***P or † P < 0.001, ****P or ‡ P < 0.0001.
Author contributions
WL and HYZ conceptualized the project. WL, LL, MWCR, AT, and SW developed methodology. EBR, YW, and HKY performed bioinformatic analysis. WL, LL, MWCR, YJ, WK, IA, SR, CJA, VVB, SW, SS, and SM conducted the experiments. WL wrote original draft. HTO, ZL, JB, and HYZ reviewed the manuscript and provided expertise and resources. HYZ secured funding.
Conflict of interest
The authors declare that they have no conflict of interest.
Supporting information
Expanded View Figures PDF
Table EV1
Table EV2
Table EV3
Table EV4
Dataset EV1
Dataset EV2
Source Data for Expanded View
Review Process File
Source Data for Figure 1
Source Data for Figure 2
Source Data for Figure 3
Source Data for Figure 4
Source Data for Figure 5
Source Data for Figure 6
Source Data for Figure 7
Acknowledgements
We thank the following researchers and groups for their support: Dr. H Jeong for reproducing shRNA screen data; Dr. J Kim, Dr. J Orengo, and Dr. T Lin for help with histological assay; Dr. ME Heijden and S Coffin for guidance on plethysmography; Dr. A Bajic for general support of culturing human neurons; Y He in Hugo Bellen’s laboratory for injection of plasmids into Drosophila embryos; Dr. C Ljungberg for help with BaseScope assay; Dr. PP Pandolfi, Dr. R Bosselut, Dr. MS Kapiloff for sharing the Zbtb7a, Zbtb7b, and Rsk3 knockout mice, respectively; Dr. V Shakkottai and Dr. L Ranum for sharing control and SCA1 human brain tissues, respectively; J Barrish and Dr. J Hicks from the Texas Children’s Hospital electron microscopy core for assistance with using SEM; and members of the Zoghbi laboratory for input on the manuscript.
This project was supported by grant NIH/NINDS R37NS027699 to HYZ and NIH/NIA R01AG057339 to JB, NIH/NINDS R01‐NS045667‐17 to HTO, Parkinson’s Foundation Stanley Fahn Junior Faculty Award JFA‐1762 to MWCR, NIH/NIGMS R01GM120033 to ZL, NIH R21NS096395, and the Darrell K Royal Research Fund for Alzheimer’s Disease to IA. WL was a Howard Hughes Medical Institute International Student Research fellow and HYZ is a Howard Hughes Medical Institute investigator. This project was also supported by Mass Spectrometry Proteomics Core at BCM with funding from NIH/NCI P30CA125123, Cancer Prevention and Research Institute of Texas RP170005, the IDDRC at Baylor College of Medicine (15P50HD103555—Behavioral Core) from the Eunice Kennedy Shriver National Institute of Child Health & Human Development. The content is solely the responsibility of the authors and does not necessarily represent the official views of the Eunice Kennedy Shriver National Institute of Child Health & Human Development or the National Institutes of Health.
The EMBO Journal (2021) 40: e106106.
Data availability
RNA‐seq data: Gene Expression Omnibus GSE151276 (https://www.ncbi.nlm.nih.gov/geo/query/acc.cgi?acc=GSE151276).
References
- Al‐Ramahi I, Perez AM, Lim J, Zhang M, Sorensen R, de Haro M, Branco J, Pulst SM, Zoghbi HY, Botas J (2007) dAtaxin‐2 mediates expanded Ataxin‐1‐induced neurodegeneration in a Drosophila model of SCA1. PLoS Genet 3: e234 [DOI] [PMC free article] [PubMed] [Google Scholar]
- Anders S, Pyl PT, Huber W (2015) HTSeq—a Python framework to work with high‐throughput sequencing data. Bioinformatics 31: 166–169 [DOI] [PMC free article] [PubMed] [Google Scholar]
- Arthur JS (2008) MSK activation and physiological roles. Front Biosci 13: 5866–5879 [DOI] [PubMed] [Google Scholar]
- Bjorbaek C, Zhao Y, Moller DE (1995) Divergent functional roles for p90rsk kinase domains. J Biol Chem 270: 18848–18852 [DOI] [PubMed] [Google Scholar]
- Bondar VV, Adamski CJ, Onur TS, Tan Q, Wang L, Diaz‐Garcia J, Park J, Orr HT, Botas J, Zoghbi HY (2018) PAK1 regulates ATXN1 levels providing an opportunity to modify its toxicity in spinocerebellar ataxia type 1. Hum Mol Genet 27: 2863–2873 [DOI] [PMC free article] [PubMed] [Google Scholar]
- Cargnello M, Roux PP (2011) Activation and function of the MAPKs and their substrates, the MAPK‐activated protein kinases. Microbiol Mol Biol Rev 75: 50–83 [DOI] [PMC free article] [PubMed] [Google Scholar]
- Carpenter AC, Wohlfert E, Chopp LB, Vacchio MS, Nie J, Zhao Y, Shetty J, Xiao Q, Deng C, Tran B et al (2017) Control of regulatory T cell differentiation by the transcription factors Thpok and LRF. J Immunol 199: 1716–1728 [DOI] [PMC free article] [PubMed] [Google Scholar]
- Carriere A, Ray H, Blenis J, Roux PP (2008) The RSK factors of activating the Ras/MAPK signaling cascade. Front Biosci 13: 4258–4275 [DOI] [PubMed] [Google Scholar]
- Chen HK, Fernandez‐Funez P, Acevedo SF, Lam YC, Kaytor MD, Fernandez MH, Aitken A, Skoulakis EM, Orr HT, Botas J et al (2003) Interaction of Akt‐phosphorylated ataxin‐1 with 14‐3‐3 mediates neurodegeneration in spinocerebellar ataxia type 1. Cell 113: 457–468 [DOI] [PubMed] [Google Scholar]
- Cummings CJ, Reinstein E, Sun Y, Antalffy B, Jiang Y, Ciechanover A, Orr HT, Beaudet AL, Zoghbi HY (1999) Mutation of the E6‐AP ubiquitin ligase reduces nuclear inclusion frequency while accelerating polyglutamine‐induced pathology in SCA1 mice. Neuron 24: 879–892 [DOI] [PubMed] [Google Scholar]
- Dharmat R, Eblimit A, Robichaux MA, Zhang Z, Nguyen TT, Jung SY, He F, Jain A, Li Y, Qin J et al (2018) SPATA7 maintains a novel photoreceptor‐specific zone in the distal connecting cilium. J Cell Biol 217: 2851–2865 [DOI] [PMC free article] [PubMed] [Google Scholar]
- Dobin A, Davis CA, Schlesinger F, Drenkow J, Zaleski C, Jha S, Batut P, Chaisson M, Gingeras TR (2013) STAR: ultrafast universal RNA‐seq aligner. Bioinformatics 29: 15–21 [DOI] [PMC free article] [PubMed] [Google Scholar]
- Doench JG, Fusi N, Sullender M, Hegde M, Vaimberg EW, Donovan KF, Smith I, Tothova Z, Wilen C, Orchard R et al (2016) Optimized sgRNA design to maximize activity and minimize off‐target effects of CRISPR‐Cas9. Nat Biotechnol 34: 184–191 [DOI] [PMC free article] [PubMed] [Google Scholar]
- Erkkinen MG, Kim MO, Geschwind MD (2018) Clinical neurology and epidemiology of the major neurodegenerative diseases. Cold Spring Harb Perspect Biol 10: a033118 [DOI] [PMC free article] [PubMed] [Google Scholar]
- Fernandez‐Funez P, Nino‐Rosales ML, de Gouyon B, She WC, Luchak JM, Martinez P, Turiegano E, Benito J, Capovilla M, Skinner PJ et al (2000) Identification of genes that modify ataxin‐1‐induced neurodegeneration. Nature 408: 101–106 [DOI] [PubMed] [Google Scholar]
- Friedrich J, Kordasiewicz HB, O'Callaghan B, Handler HP, Wagener C, Duvick L, Swayze EE, Rainwater O, Hofstra B, Benneyworth M et al (2018) Antisense oligonucleotide‐mediated ataxin‐1 reduction prolongs survival in SCA1 mice and reveals disease‐associated transcriptome profiles. JCI Insight 3: e123193 [DOI] [PMC free article] [PubMed] [Google Scholar]
- Fu H, Hardy J, Duff KE (2018) Selective vulnerability in neurodegenerative diseases. Nat Neurosci 21: 1350–1358 [DOI] [PMC free article] [PubMed] [Google Scholar]
- Gennarino VA, Singh RK, White JJ, De Maio A, Han K, Kim JY, Jafar‐Nejad P, di Ronza A, Kang H, Sayegh LS et al (2015) Pumilio1 haploinsufficiency leads to SCA1‐like neurodegeneration by increasing wild‐type Ataxin1 levels. Cell 160: 1087–1098 [DOI] [PMC free article] [PubMed] [Google Scholar]
- Hauge C, Frodin M (2006) RSK and MSK in MAP kinase signalling. J Cell Sci 119: 3021–3023 [DOI] [PubMed] [Google Scholar]
- van der Heijden ME, Zoghbi HY (2018) Loss of Atoh1 from neurons regulating hypoxic and hypercapnic chemoresponses causes neonatal respiratory failure in mice. Elife 7: e38455 [DOI] [PMC free article] [PubMed] [Google Scholar]
- Huang WH, Tupal S, Huang TW, Ward CS, Neul JL, Klisch TJ, Gray PA, Zoghbi HY (2012) Atoh1 governs the migration of postmitotic neurons that shape respiratory effectiveness at birth and chemoresponsiveness in adulthood. Neuron 75: 799–809 [DOI] [PMC free article] [PubMed] [Google Scholar]
- Jafar‐Nejad P, Ward CS, Richman R, Orr HT, Zoghbi HY (2011) Regional rescue of spinocerebellar ataxia type 1 phenotypes by 14‐3‐3epsilon haploinsufficiency in mice underscores complex pathogenicity in neurodegeneration. Proc Natl Acad Sci USA 108: 2142–2147 [DOI] [PMC free article] [PubMed] [Google Scholar]
- Ju H, Kokubu H, Todd TW, Kahle JJ, Kim S, Richman R, Chirala K, Orr HT, Zoghbi HY, Lim J (2013) Polyglutamine disease toxicity is regulated by Nemo‐like kinase in spinocerebellar ataxia type 1. J Neurosci 33: 9328–9336 [DOI] [PMC free article] [PubMed] [Google Scholar]
- Khan A, Fornes O, Stigliani A, Gheorghe M, Castro‐Mondragon JA, van der Lee R, Bessy A, Cheneby J, Kulkarni SR, Tan G et al (2018) JASPAR 2018: update of the open‐access database of transcription factor binding profiles and its web framework. Nucleic Acids Res 46: D260–D266 [DOI] [PMC free article] [PubMed] [Google Scholar]
- Kim D, Pertea G, Trapnell C, Pimentel H, Kelley R, Salzberg SL (2013) TopHat2: accurate alignment of transcriptomes in the presence of insertions, deletions and gene fusions. Genome Biol 14: R36 [DOI] [PMC free article] [PubMed] [Google Scholar]
- Klug A (2010) The discovery of zinc fingers and their applications in gene regulation and genome manipulation. Annu Rev Biochem 79: 213–231 [DOI] [PubMed] [Google Scholar]
- Kordasiewicz HB, Stanek LM, Wancewicz EV, Mazur C, McAlonis MM, Pytel KA, Artates JW, Weiss A, Cheng SH, Shihabuddin LS et al (2012) Sustained therapeutic reversal of Huntington's disease by transient repression of huntingtin synthesis. Neuron 74: 1031–1044 [DOI] [PMC free article] [PubMed] [Google Scholar]
- Kumar VB, Farr SA, Flood JF, Kamlesh V, Franko M, Banks WA, Morley JE (2000) Site‐directed antisense oligonucleotide decreases the expression of amyloid precursor protein and reverses deficits in learning and memory in aged SAMP8 mice. Peptides 21: 1769–1775 [DOI] [PubMed] [Google Scholar]
- Li J, Kritzer MD, Michel JJ, Le A, Thakur H, Gayanilo M, Passariello CL, Negro A, Danial JB, Oskouei B et al (2013) Anchored p90 ribosomal S6 kinase 3 is required for cardiac myocyte hypertrophy. Circ Res 112: 128–139 [DOI] [PMC free article] [PubMed] [Google Scholar]
- Liu XS, Haines JE, Mehanna EK, Genet MD, Ben‐Sahra I, Asara JM, Manning BD, Yuan ZM (2014) ZBTB7A acts as a tumor suppressor through the transcriptional repression of glycolysis. Genes Dev 28: 1917–1928 [DOI] [PMC free article] [PubMed] [Google Scholar]
- Love MI, Huber W, Anders S (2014) Moderated estimation of fold change and dispersion for RNA‐seq data with DESeq2. Genome Biol 15: 550 [DOI] [PMC free article] [PubMed] [Google Scholar]
- Maeda T, Merghoub T, Hobbs RM, Dong L, Maeda M, Zakrzewski J, van den Brink MR, Zelent A, Shigematsu H, Akashi K et al (2007) Regulation of B versus T lymphoid lineage fate decision by the proto‐oncogene LRF. Science 316: 860–866 [DOI] [PMC free article] [PubMed] [Google Scholar]
- Maeda T, Ito K, Merghoub T, Poliseno L, Hobbs RM, Wang G, Dong L, Maeda M, Dore LC, Zelent A et al (2009) LRF is an essential downstream target of GATA1 in erythroid development and regulates BIM‐dependent apoptosis. Dev Cell 17: 527–540 [DOI] [PMC free article] [PubMed] [Google Scholar]
- Martin M (2011) Cutadapt removes adapter sequences from high‐throughput sequencing reads. EMBnetjournal 17: 10–12 [Google Scholar]
- Matilla A, Roberson ED, Banfi S, Morales J, Armstrong DL, Burright EN, Orr HT, Sweatt JD, Zoghbi HY, Matzuk MM (1998) Mice lacking ataxin‐1 display learning deficits and decreased hippocampal paired‐pulse facilitation. J Neurosci 18: 5508–5516 [DOI] [PMC free article] [PubMed] [Google Scholar]
- McCarthy DJ, Chen Y, Smyth GK (2012) Differential expression analysis of multifactor RNA‐Seq experiments with respect to biological variation. Nucleic Acids Res 40: 4288–4297 [DOI] [PMC free article] [PubMed] [Google Scholar]
- Melnick A, Carlile G, Ahmad KF, Kiang CL, Corcoran C, Bardwell V, Prive GG, Licht JD (2002) Critical residues within the BTB domain of PLZF and Bcl‐6 modulate interaction with corepressors. Mol Cell Biol 22: 1804–1818 [DOI] [PMC free article] [PubMed] [Google Scholar]
- Nemoto S, Takeda K, Yu ZX, Ferrans VJ, Finkel T (2000) Role for mitochondrial oxidants as regulators of cellular metabolism. Mol Cell Biol 20: 7311–7318 [DOI] [PMC free article] [PubMed] [Google Scholar]
- Orengo JP, van der Heijden ME, Hao S, Tang J, Orr HT, Zoghbi HY (2018) Motor neuron degeneration correlates with respiratory dysfunction in SCA1. Dis Model Mech 11: dmm032623 [DOI] [PMC free article] [PubMed] [Google Scholar]
- Orr HT, Chung MY, Banfi S, Kwiatkowski TJ Jr, Servadio A, Beaudet AL, McCall AE, Duvick LA, Ranum LP, Zoghbi HY (1993) Expansion of an unstable trinucleotide CAG repeat in spinocerebellar ataxia type 1. Nat Genet 4: 221–226 [DOI] [PubMed] [Google Scholar]
- Park J, Al‐Ramahi I, Tan Q, Mollema N, Diaz‐Garcia JR, Gallego‐Flores T, Lu HC, Lagalwar S, Duvick L, Kang H et al (2013) RAS‐MAPK‐MSK1 pathway modulates ataxin 1 protein levels and toxicity in SCA1. Nature 498: 325–331 [DOI] [PMC free article] [PubMed] [Google Scholar]
- Pavletich NP, Pabo CO (1991) Zinc finger‐DNA recognition: crystal structure of a Zif268‐DNA complex at 2.1 A. Science 252: 809–817 [DOI] [PubMed] [Google Scholar]
- Perez‐Torrado R, Yamada D, Defossez PA (2006) Born to bind: the BTB protein‐protein interaction domain. BioEssays 28: 1194–1202 [DOI] [PubMed] [Google Scholar]
- Posch C, Moslehi H, Feeney L, Green GA, Ebaee A, Feichtenschlager V, Chong K, Peng L, Dimon MT, Phillips T et al (2013) Combined targeting of MEK and PI3K/mTOR effector pathways is necessary to effectively inhibit NRAS mutant melanoma in vitro and in vivo . Proc Natl Acad Sci USA 110: 4015–4020 [DOI] [PMC free article] [PubMed] [Google Scholar]
- Robinson MD, Oshlack A (2010) A scaling normalization method for differential expression analysis of RNA‐seq data. Genome Biol 11: R25 [DOI] [PMC free article] [PubMed] [Google Scholar]
- Roselli F, Caroni P (2015) From intrinsic firing properties to selective neuronal vulnerability in neurodegenerative diseases. Neuron 85: 901–910 [DOI] [PubMed] [Google Scholar]
- Rousseaux MWC, Tschumperlin T, Lu HC, Lackey EP, Bondar VV, Wan YW, Tan Q, Adamski CJ, Friedrich J, Twaroski K et al (2018a) ATXN1‐CIC complex is the primary driver of cerebellar pathology in spinocerebellar Ataxia type 1 through a gain‐of‐function mechanism. Neuron 97: 1235–1243.e5 [DOI] [PMC free article] [PubMed] [Google Scholar]
- Rousseaux MWC, Vazquez‐Velez GE, Al‐Ramahi I, Jeong HH, Bajic A, Revelli JP, Ye H, Phan ET, Deger JM, Perez AM et al (2018b) A druggable genome screen identifies modifiers of alpha‐synuclein levels via a tiered cross‐species validation approach. J Neurosci 38: 9286–9301 [DOI] [PMC free article] [PubMed] [Google Scholar]
- Sapkota GP, Cummings L, Newell FS, Armstrong C, Bain J, Frodin M, Grauert M, Hoffmann M, Schnapp G, Steegmaier M et al (2007) BI‐D1870 is a specific inhibitor of the p90 RSK (ribosomal S6 kinase) isoforms in vitro and in vivo . Biochem J 401: 29–38 [DOI] [PMC free article] [PubMed] [Google Scholar]
- Saxena S, Caroni P (2011) Selective neuronal vulnerability in neurodegenerative diseases: from stressor thresholds to degeneration. Neuron 71: 35–48 [DOI] [PubMed] [Google Scholar]
- Siggs OM, Beutler B (2012) The BTB‐ZF transcription factors. Cell Cycle 11: 3358–3369 [DOI] [PMC free article] [PubMed] [Google Scholar]
- Silva MC, Ferguson FM, Cai Q, Donovan KA, Nandi G, Patnaik D, Zhang T, Huang HT, Lucente DE, Dickerson BC et al (2019) Targeted degradation of aberrant tau in frontotemporal dementia patient‐derived neuronal cell models. Elife 8: e45457 [DOI] [PMC free article] [PubMed] [Google Scholar]
- Smith JC, Abdala AP, Borgmann A, Rybak IA, Paton JF (2013) Brainstem respiratory networks: building blocks and microcircuits. Trends Neurosci 36: 152–162 [DOI] [PMC free article] [PubMed] [Google Scholar]
- Spencer B, Desplats PA, Overk CR, Valera‐Martin E, Rissman RA, Wu C, Mante M, Adame A, Florio J, Rockenstein E et al (2016) Reducing endogenous alpha‐synuclein mitigates the degeneration of selective neuronal populations in an alzheimer's disease transgenic mouse model. J Neurosci 36: 7971–7984 [DOI] [PMC free article] [PubMed] [Google Scholar]
- Tolcher AW, Peng W, Calvo E (2018) Rational approaches for combination therapy strategies targeting the MAP kinase pathway in solid tumors. Mol Cancer Ther 17: 3–16 [DOI] [PubMed] [Google Scholar]
- Tysnes OB, Storstein A (2017) Epidemiology of Parkinson's disease. J Neural Transm (Vienna) 124: 901–905 [DOI] [PubMed] [Google Scholar]
- Uhlen M, Fagerberg L, Hallstrom BM, Lindskog C, Oksvold P, Mardinoglu A, Sivertsson A, Kampf C, Sjostedt E, Asplund A et al (2015) Proteomics. Tissue‐based map of the human proteome. Science 347: 1260419 [DOI] [PubMed] [Google Scholar]
- Vacchio MS, Wang L, Bouladoux N, Carpenter AC, Xiong Y, Williams LC, Wohlfert E, Song KD, Belkaid Y, Love PE et al (2014) A ThPOK‐LRF transcriptional node maintains the integrity and effector potential of post‐thymic CD4+ T cells. Nat Immunol 15: 947–956 [DOI] [PMC free article] [PubMed] [Google Scholar]
- Vera Alvarez R, Pongor LS, Marino‐Ramirez L, Landsman D (2019) TPMCalculator: one‐step software to quantify mRNA abundance of genomic features. Bioinformatics 35: 1960–1962 [DOI] [PMC free article] [PubMed] [Google Scholar]
- Wang L, Wildt KF, Castro E, Xiong Y, Feigenbaum L, Tessarollo L, Bosselut R (2008a) The zinc finger transcription factor Zbtb7b represses CD8‐lineage gene expression in peripheral CD4+ T cells. Immunity 29: 876–887 [DOI] [PMC free article] [PubMed] [Google Scholar]
- Wang L, Wildt KF, Zhu J, Zhang X, Feigenbaum L, Tessarollo L, Paul WE, Fowlkes BJ, Bosselut R (2008b) Distinct functions for the transcription factors GATA‐3 and ThPOK during intrathymic differentiation of CD4(+) T cells. Nat Immunol 9: 1122–1130 [DOI] [PMC free article] [PubMed] [Google Scholar]
- Wang J, Zhuang J, Iyer S, Lin X, Whitfield TW, Greven MC, Pierce BG, Dong X, Kundaje A, Cheng Y et al (2012) Sequence features and chromatin structure around the genomic regions bound by 119 human transcription factors. Genome Res 22: 1798–1812 [DOI] [PMC free article] [PubMed] [Google Scholar]
- Watase K, Weeber EJ, Xu B, Antalffy B, Yuva‐Paylor L, Hashimoto K, Kano M, Atkinson R, Sun Y, Armstrong DL et al (2002) A long CAG repeat in the mouse Sca1 locus replicates SCA1 features and reveals the impact of protein solubility on selective neurodegeneration. Neuron 34: 905–919 [DOI] [PubMed] [Google Scholar]
- Webb A, Papp AC, Curtis A, Newman LC, Pietrzak M, Seweryn M, Handelman SK, Rempala GA, Wang D, Graziosa E et al (2015) RNA sequencing of transcriptomes in human brain regions: protein‐coding and non‐coding RNAs, isoforms and alleles. BMC Genom 16: 990 [DOI] [PMC free article] [PubMed] [Google Scholar]
- Widom RL, Lee JY, Joseph C, Gordon‐Froome I, Korn JH (2001) The hcKrox gene family regulates multiple extracellular matrix genes. Matrix Biol 20: 451–462 [DOI] [PubMed] [Google Scholar]
- Xu L, Wei Y, Reboul J, Vaglio P, Shin TH, Vidal M, Elledge SJ, Harper JW (2003) BTB proteins are substrate‐specific adaptors in an SCF‐like modular ubiquitin ligase containing CUL‐3. Nature 425: 316–321 [DOI] [PubMed] [Google Scholar]
- Zeniou M, Ding T, Trivier E, Hanauer A (2002) Expression analysis of RSK gene family members: the RSK2 gene, mutated in Coffin‐Lowry syndrome, is prominently expressed in brain structures essential for cognitive function and learning. Hum Mol Genet 11: 2929–2940 [DOI] [PubMed] [Google Scholar]
- Zhao M, Lee WP, Garrison EP, Marth GT (2013) SSW library: an SIMD Smith‐Waterman C/C++ library for use in genomic applications. PLoS One 8: e82138 [DOI] [PMC free article] [PubMed] [Google Scholar]
- Zoghbi HY, Orr HT (1995) Spinocerebellar ataxia type 1. Semin Cell Biol 6: 29–35 [DOI] [PubMed] [Google Scholar]
- Zoghbi HY, Orr HT (2009) Pathogenic mechanisms of a polyglutamine‐mediated neurodegenerative disease, spinocerebellar ataxia type 1. J Biol Chem 284: 7425–7429 [DOI] [PMC free article] [PubMed] [Google Scholar]
Associated Data
This section collects any data citations, data availability statements, or supplementary materials included in this article.
Supplementary Materials
Expanded View Figures PDF
Table EV1
Table EV2
Table EV3
Table EV4
Dataset EV1
Dataset EV2
Source Data for Expanded View
Review Process File
Source Data for Figure 1
Source Data for Figure 2
Source Data for Figure 3
Source Data for Figure 4
Source Data for Figure 5
Source Data for Figure 6
Source Data for Figure 7
Data Availability Statement
RNA‐seq data: Gene Expression Omnibus GSE151276 (https://www.ncbi.nlm.nih.gov/geo/query/acc.cgi?acc=GSE151276).